


1. Introduction
1.1. Testing in Controlled Conditions
Financial crises may expose weaknesses in statistical models on which financial reporting or decision-making rely. For example, several banks and insurers sustained multi-billion dollar losses in the 2007–2009 crisis. At the time of writing, the UK pension protection fund is reporting aggregate scheme deficits in excess of £300,000,000,000 (Pension Protection Fund, 2006–2016). Many of these institutions boast of complex statistical models, asserting that such losses were very unlikely to occur. The regulation of financial institutions worldwide still often relies on similar models today.
Why did these models fail? Were they adequately tested? There is limited detail in the public domain for pension funds, but we can learn from bank and insurer disclosures. For example, American International Group “initiated engagements with … external experts to perform independent reviews and certifications of the economic capital model”, before sustaining a loss five times bigger than the model’s 99.95 percentile loss (2007). Many banks now shed light on their model testing, by publishing charts of historic daily profits and losses relative to their models’ value-at-risk.
In this paper, we argue that testing models on historic data is not enough. Especially when we are concerned with rare and severe market stress, the events that invalidate a model are often the same events that generate large losses. The models are of little use as early warning indicators.
In addition to historic back-testing, we therefore advocate laboratory testing for statistical models. We feed the models with artificial data, generated from a variety of processes whose properties (good or bad) are known. Such testing enables us to map out model strengths and weaknesses safely, where no money is at stake.
1.2. Lessons from Engineering
Engineering devices, and their components, may be subject to lab testing. Test environments could include extremes of temperature, stress, vibration, friction, sand blasting, immersion in corrosive liquids and so on. Such testing enables engineers to determine tolerance limits and maintenance protocols, as well as measuring the frequency and impact of any manufacturing defects.
This is safer and cheaper in the long run than assembling untested components, for example, into a bridge, aeroplane or prosthetic body part, and measuring the frequency and severity of harm to humans.
A failure in a lab test is not always a bad thing. Most components wear out eventually; all components have limits of temperature or pressure under which they will fail. The purpose of lab testing is to determine those limits.
It is always possible that the real world produces conditions, or combinations that were not foreseen in the lab tests. The converse is also possible, that the lab conditions are more severe than a component encounters in practical use. While we accept there is some subjectivity in determining what laboratory conditions best represent the stress of a component in use, we do not accept this as a reason not to perform lab tests.
1.3. Exponential Losses Example
In this paper we are primarily assessing the process of fitting probability distributions to data. Decisions are often associated with moments or percentiles derived from the probability distribution and it is therefore ultimately single numbers that are important in these cases. In practice, the full distribution is typically fitted. It is therefore important to give users a sense of the purposes for which this fitted distribution will or will not be appropriate.
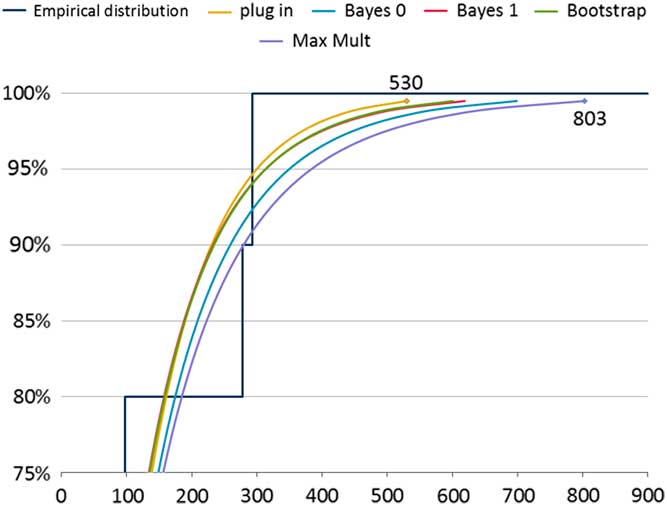
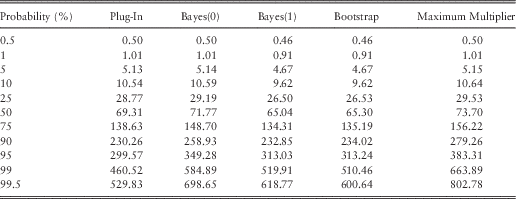
In section 5, we consider the problem of fitting a distribution to a sample of ten observations. In our example, we have grounds to believe that these observations are independent draws from an underlying (true, or reference) exponential distribution. Table 1 shows the result of five tools for fitting data to the observations (26, 29,40, 48, 59, 60, 69, 98, 278, 293), with an emphasis on the tails of the fitted distributions. Figure 1 compares the tail behaviour of these ersatz models graphically. We call each of these fitted models an ersatz model (see section 2 for more details). The simplest fitting process is the “plug-in” method, that is, an exponential distribution with mean equal to the sample mean of the data (which turns out to be 100). Even though the true distribution is believed to be exponential, the fitted distributions are not all exponential. The disagreement is clear between these ersatz models, especially in relation to the severity of tail outcomes. This motivates a search for a view about which is the better fit. By testing these methods against generated data we are indeed able to compare between these methods.
Exponential example: fitted distribution functions
Ersatz Distribution Percentile Claim Amounts
Of course the assumption, that a series of observations consists of independent draws from an unvarying distribution, is a strong one. We will often have good grounds for believing that there is in fact some linkage between observations, but this linkage too is unknown and needs to be fitted. In section 6 we consider an auto-regressive (AR) model, such as used for inflation in the Wilkie model (Wilkie, Reference Wilkie1984, Reference Wilkie1995), and test methods for fitting such models by applying them to generated data.
1.4. Average Fitted Models
One question to consider, motivated by the classical statistical bias concept, is the extent to which the fitted model agrees with the true (reference) model on average. For functions of the observations, we can calculate statistical bias, and for percentile estimators we can compare exceedance probabilities. Which of these, or other tests, is most relevant will depend upon the purpose of the model. We can say that the fitting method is consistent if it passes the relevant tests for a particular application.
It is not easy to pass multiple tests for a single reference model, nor a single test for multiple reference model. Testing across multiple distributions, however, allows the modeller to assess whether the method is robust to model mis-specification. We test the consistency and robustness of our fitting methods in sections 5 and 6.
1.5. The Rest of the Paper
The remainder of this paper proceeds as follows:
-
∙ We define key testing concepts: reference models, ersatz models, consistency, robustness, inner and outer scenarios.
-
∙ We revisit the classical notion of parameter bias and put it in the context of ersatz model testing.
-
∙ We describe percentile tests in the context of solvency capital requirements and back-testing.
-
∙ We show a numerical example based on a simple, exponential, model of insurance claims.
-
∙ We investigate a second numerical example using first-order AR models.
-
∙ We draw some conclusions from those examples.
2. Reference Models and Ersatz Models
In this section, we define the concept of an ersatz model. We describe our approach to testing, and contrast tests on generated data with more conventional tests on historic data.
2.1. Ersatz Models
Many corporate and individual decision tools make reference to probability laws; for example:
-
∙ Investors may value an asset by discounting the future expected cash flows.
-
∙ Investment portfolio selection may involve statistical measures of risk, such as standard deviation, adverse percentiles or expected utility of wealth.
-
∙ Financial firms are required to demonstrate capital resources, often determined by reference to high percentiles of a loss distribution.
-
∙ Probability-based capital requirements also appear in assessment of the future cost of capital, and as a denominator in performance measures such as return on capital.
In all of these applications, the true underlying probability law is unknown and, arguably, unknowable. Instead, we use ersatz models, estimated statistically from past experience, as a substitute for the hypothetical true model. The substitute cannot be perfect (because of irreducible parameter error) so the question has to be whether an ersatz model is a sufficiently close substitute for the intended purpose. In the words of Davis, “What is needed here is a shift of perspective. Instead of asking whether our model is correct, we should ask whether our objective in building the model has been achieved” (Reference Davis2014).
We might ponder whether we ever encounter models that are not ersatz? In social sciences we rarely use a “true” model. True models, or at least very close substitutes do exist in other fields: textbook experiments with unbiased coins, fair dice or urns full of coloured balls; laws of physical motion, Mendelian inheritance and so on. Many of our great statisticians have a background in fields where true models exist, which have provided context for the major statistical controversies of the 20th century. There is, arguably, a need for clearer philosophical articulation of what statistics means in the social science context, where ersatz models are almost universal.
2.2. Out-of-Sample Model Tests
Out-of-sample model testing is a well-established statistical discipline. It involves comparing a model prediction (based on sample of past data) to the emerging future experience. A good model should predict the future closely.
Empirical data is, by definition, realistic. However, despite this obvious point in its favour, out-of-sample testing also has some weaknesses, including the following:
-
∙ Data is limited, so the tests may have low power which means that incorrect models are not likely to be rejected.
-
∙ It is difficult to eliminate cherry picking, where only the best model is presented out of a large number that were tested. This hindsight can exaggerate the reported quality of fit.
-
∙ The true process that generated the (past and future) data is unknown, which makes it difficult to generalise about the circumstances in which a model approach may work well in future.
The philosophy of hypothesis testing is also troubling, in the context of out-of-sample testing. A successful out-of-sample test outcome is a failure to reject the hypothesis that the out-of-sample data could have come from the fitted model. But we know the fitted model is wrong, for example, because its parameters are subject to estimation error. To pass the test, we are hoping to force a Type II error, that is, failing to reject an incorrect model. Test success becomes more difficult as more out-of-sample data becomes available. For example, if we calibrate a model based on 5 years’ data and test it out-of-sample on the next 50 years’ data, we are likely to find a pattern in the 50 years that was not detectable in the first 5, and thus reject the model. We need a testing philosophy that is more forgiving of inevitable estimation errors.
In the rest of this paper we consider how model tests on computer-generated data, instead of historic data, can overcome some of the weaknesses of out-of-sample tests.
2.3. Generated Data Tests
We consider a model, in a broad sense, to comprise not only a probability description of future outcomes, but also the methodology for constructing that description from past data. To apply generated data tests, we must be able to determine how a given model would have been different, had the historic data been different.
Some methodological claims cannot be tested on real historic data. Take, for example, the statistical statement that the average of a sample is an unbiased estimate of the population mean. We could support this statement with a mathematical proof, or we could test on simulated data from a known population. However, a table of averages based on samples from an unknown population tell us nothing about whether the method is biased, because that would require a comparison of the sample averages to the (unknown) underlying mean. There are many other attributes which, like bias, are best validated on generated data.
By focussing on the way we build models, rather than on the built model, we can test proposed methodologies on computer-generated data. A typical test is structured as follows:
-
∙ Choose a process for generating the test data.
-
∙ Generate a long test data series, split into a past portion and a future portion.
-
∙ Take the past portion and use it to re-fit an ersatz model, without reference to the original generating process.
-
∙ Run the ersatz model based on the past data portion, to give forecast future scenarios.
-
∙ Compare the future scenario from the fitted model, to the future from the originally generated data.
-
∙ Repeat this many times on other generated data series.
The test passes if, in a statistical sense we shall define, the future scenarios from the fitted model are sufficiently representative of the future scenarios from the original generating process.
2.4. Reference Models
In a generated data test, there must be a process for generating the test data. We call this a reference model.
We should use not one, but many, reference models in generated data tests. The ersatz model fitting methodology applied to the generated past data, should see only the generated history and not the details of the reference model. Using a broad collection of reference models therefore reflects the difficulty, that when we try to interpret data, we do not know the process that originally generated it.
2.5. Generated Ersatz Models
The model fitted to the generated past data, is an instance of an ersatz model.
Ersatz models are widely used based on historic data, but where real data are used the underlying data-generating process is unknown. We cannot then directly measure the quality of the ersatz approximation.
In a generated data test, the reference model is known, and so we can quantify the discrepancy between the reference model and the ersatz model.
2.6. Inner and Outer Scenarios
We can visualise the reference and ersatz models in the context of models for generating economic scenarios, describing quantities such as inflation, equity, bond or property indices, interest rates, foreign exchange rates and so on.
On real data we have only one past and we will observe only one future. Generated data need not respect that constraint. We can generate multiple past outer scenarios. For each outer scenario, it is common to generate several alternative future (or inner) scenarios. For any given outer scenario, we use the reference model to generate inner scenarios from the conditional probability law given that specific outer scenario. This is sometimes called a nested stochastic or Monte Carlo squared structure.
Figure 2 shows reference models in green and red (two different reference models). The figure shows a collection of outer scenarios, one of which develops into a collection of inner scenarios, marked in the same colour.
Inner and outer scenarios
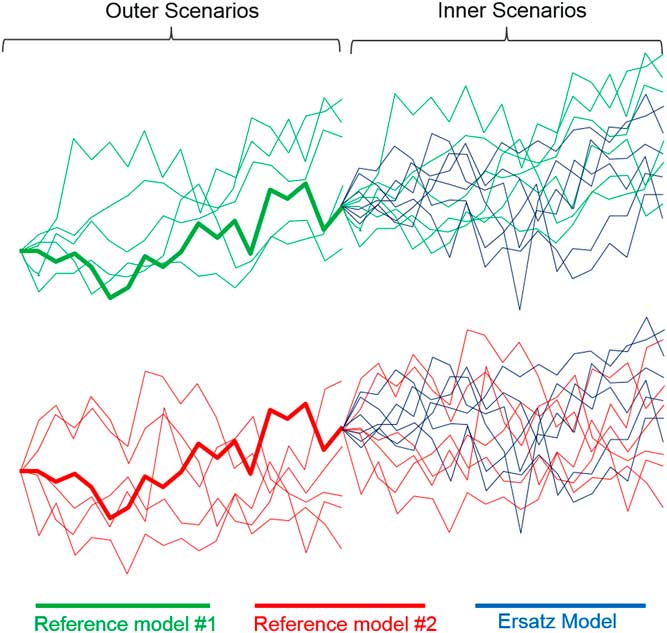
At the same time, we can generate multiple inner scenarios from an ersatz model, fitted to the outer scenarios. This gives another nested stochastic structure, with outer scenarios generated from a reference model and inner scenarios from an ersatz model. We will sometimes talk about hybrid scenarios. This refers to the combination of outer reference scenarios and inner ersatz scenarios. These are marked as blue in Figure 2. The test of the Ersatz model is that the blue ersatz scenarios resemble the properties of the original green or red reference scenarios.
2.7. Stated Assumptions
Generated data tests apply to a statistical procedure, that is, any algorithm for producing ersatz models from past data. We are not testing the stated rationale for the procedure, and indeed we can happily apply generated data tests to procedures unclothed in justifying rhetoric.
Where there is a formal stated model underlying the ersatz construction (e.g. a probability law estimated from a parametric family by likelihood maximisation), that fitted ersatz model may or may not agree with the reference model.
-
∙ Where the fitted model comes from a class that contains all the reference models, our procedure becomes a consistency test, that is, the effectiveness of a procedure when the reference model satisfies the ersatz assumptions.
-
∙ In other cases, for example, when the reference has many more parameters than could reasonably be estimated from the quantity of generated past data, it is still valuable to know how wrong the ersatz model might be. This is an example of a robustness test, that explores how performance degrades when the reference model violates the ersatz assumptions.
Consistency tests appear periodically in the actuarial literature, including the General Insurance Reserving Oversight Committee (GIROC) (2007, Reference Geoghan, Clarkson, Feldman, Green, Kitts, Lavecky, Ross, Smith and Toutounchi2008) who test the consistency of bootstrap techniques used in general insurance reserving applications. The classic text by Huber & Ronchetti (Reference Huber and Ronchetti2009) develops a framework for robustness based on influence functions which capture how outputs respond to small perturbations in input distributions, while Hansen & Sargent (Reference Hansen and Sargent2008) advocate a min-max approach based on finding the worst case model within a chosen ambiguity set.
Robustness tests are less common within the actuarial literature, and are usually limited to simpler tests based on possible mis-specified models. Eshun et al. (Reference Eshun, Machin, Sharpe and Smith2011) applied generated data tests to the fitting of generalised Pareto distributions to lognormally distributed data, to compare different means of parameter estimation (method of moments, maximum likelihood and probability-weighted moments). Cook & Smith (Reference Cairns and England2013) test the robustness of weather catastrophe models. Locke & Smith (Reference Locke and Smith2015) assess the robustness of the general insurance bootstrap.
Newer statistical techniques, including machine-learning tools based on neural nets or genetic algorithms, may not involve a conventional model with stated assumptions. The good news is that generated data tests apply just as well to these newer techniques as they do to classical models of regression or time series analysis. However, without a formal list of assumptions, we lose the distinction between consistency tests and robustness tests.
2.8. Generated Data Test Disadvantages
Tests on generated data can address questions that are unanswerable with real data. The method does, however, have some important limitations too.
There is some arbitrariness in the choice of the set of reference models. They should be broadly realistic and capable of generating at least the most important aspects of actual data. However, there will always be different perspectives on the future risks facing an organisation. The need to choose one or more reference models is a disadvantage of generated data approaches, compared to out-of-sample tests on real data.
Generated data tests require an ability to re-create what a fitted model would have looked like under alternative histories. This limits our ability to test certain models, when it is not completely clear how the observed data were converted into forecasts. For example, once a quarter the Bank of England publishes inflation forecasts for the following 8 months, using methods that incorporate the subjective judgement of the bank’s monetary policy committee. We can test the out-of-sample forecasts (e.g. see Elder et al., Reference Elder, Kapetanios, Taylor and Yates2005) but we cannot easily determine what the forecasts would be if the input data had been different.
A generated data test does not test a specific instance of a model. It tests the way we go about building models. This can result in models being penalised for their behaviour in entirely hypothetical situations. For example, suppose we construct an ersatz model by maximum likelihood estimation. Such estimation sometimes fails to converge (due to difficulties in the algorithm or non-existence of a maximum). In a generated data test, we cannot then describe the model’s statistical properties even if on the actual historic data the estimation proceeded without any difficulty.
Finally, we note that ersatz model calibration takes time to set up as a validation process, but the time taken to run thousands of nested simulations is reasonable in most cases.
3. Unbiased Parameters
The concept of an unbiased parameter is well-developed in statistics. A parameter estimate is unbiased if its mean value (over outer reference scenarios) is the true value.
In our context, the parameter might be the mean or standard deviation of one of the scenario output variables. We can regard the mean or standard deviation of the ersatz scenarios as being estimators for the respective “true” reference mean or standard deviation.
Although we describe the tests in terms of scenarios, it may be possible to calculate some or all of the relevant means and standard deviations analytically, which makes the assessment of bias more straightforward.
We now consider these bias measures in more detail.
3.1. Unbiased Mean
Let us focus on one variable whose values are simulated both in the reference and ersatz scenarios.
For a given reference model and outer scenario, the estimated mean is the conditional mean of the ersatz scenarios. The mean of this estimated mean is the average of these conditional means, which is the same as the unconditional mean of the relevant variable under the hybrid model consisting of reference history and ersatz future.
The estimated mean is an unbiased estimate if the average value, across outer scenarios, is the mean of the reference scenarios. This test is applied separately for each reference model, and the test passes if equality holds uniformly for each reference model.
Evidently, the larger and more diverse the set of reference models, the more difficult it will be to construct unbiased estimators.
To write the test in symbols, let us use
 $${\cal F}_{t} $$
to denote the information in the history. Then we are testing whether the average of the ersatz mean is the true mean, that is whether:
$${\cal F}_{t} $$
to denote the information in the history. Then we are testing whether the average of the ersatz mean is the true mean, that is whether:
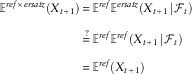 $$\eqalignno{ {\Bbb E}^{{ref{\times}ersatz}} \left( {X_{{t{\plus}1}} } \right)\,{\equals}\, & {\Bbb E}^{{ref}} {\Bbb E}^{{ersatz}} \left( {X_{{t{\plus}1}} \!\mid\!{\cal F}_{t} } \right) \cr \mathop{{\equals\,}}\limits^{\,?\,} & {\Bbb E}^{{ref}} {\Bbb E}^{{ref}} \left( {X_{{t{\plus}1}} \!\mid\!{\cal F}_{t} } \right) \cr {\equals\,} & {\Bbb E}^{{ref}} \left( {X_{{t{\plus}1}} } \right) $$
Here, we have used the symbol “=” for expressions that are mathematically equivalent, and “
 $$\mathop{{\equals}}\limits^{\,?\,} $$
” for quantities that are equal if and only if the ersatz mean is unbiased.
$$\mathop{{\equals}}\limits^{\,?\,} $$
” for quantities that are equal if and only if the ersatz mean is unbiased.
3.2. Unbiased Variance
We can define bias for other properties of an ersatz distribution, for example, the variance.
To do this, we calculate the variance of the chosen variable, across
-
∙ the hybrid scenarios consisting of outer reference scenarios and inner ersatz scenarios;
-
∙ the original reference model.
The ersatz variance is unbiased if these two quantities are the same, uniformly across reference models. In symbols, the criterion is:
 $${\rm Var}^{{ref{\times}ersatz}} (X_{{t{\plus}1}} )\mathop{{\equals}}\limits^{\,?\,} {\rm Var}^{{ref}} (X_{{t{\plus}1}} )$$
3.3. Unbiased Conditional Variance
We have defined variance bias in terms of unconditional expectations. We could alternatively investigate the conditional bias, to test whether the conditional ersatz variance is higher or lower than the conditional reference variance, given the outer reference scenario.
In each case, to perform the test, we take the average over the outer reference scenarios, but this time we have taken an average of conditional variance rather than an unconditional variance. The criterion for unbiased conditional variance is:
 $${\Bbb E}^{{ref}} {\rm Var}^{{ersatz}} \left( {X_{{t{\plus}1}} \!\mid\!{\cal F}_{t} } \right)\mathop{{\equals}}\limits^{\,?\,} {\Bbb E}^{{ref}} {\rm Var}^{{ref}} \left( {X_{{t{\plus}1}} \!\mid\!{\cal F}_{t} } \right)$$
We might ask why the variance bias test comes in two forms (conditional and unconditional) while we had only one mean bias test. The answer is that the mean is a linear functional of the underlying distribution, so we get the same answer whether we take the unconditional mean or average the conditional means. The variance, however, is a concave functional, which is why the variance of the whole population is higher than the average of the variances for sub-populations.
3.4. Unbiased Variance of the Mean
As well as comparing the average ersatz mean to the reference mean, we can also compare how much the conditional mean varies between outer reference scenarios. We can do this using the variance. In that case, the unbiased variance of the mean criterion becomes:
 $${\rm Var}^{{ref}} {\Bbb E}^{{ersatz}} \left( {X_{{t{\plus}1}} \!\mid\!{\cal F}_{t} } \right)\mathop{{\equals}}\limits^{\,?\,} {\rm Var}^{{ref}} {\Bbb E}^{{ref}} \left( {X_{{t{\plus}1}} \!\mid\!{\cal F}_{t} } \right)$$
There is neat mathematical identity, that the unconditional variance of a random variable is the variance of the conditional mean, plus the mean of the conditional variance. In symbols, this is
 $${\rm Var}^{{ref}} \left( {X_{{t{\plus}1}} } \right)\,{\equals}\,{\rm Var}^{{ref}} {\Bbb E}^{{ref}} \left( {X_{{t{\plus}1}} \!\mid\!{\cal F}_{t} } \right){\plus}{\Bbb E}^{{ref}} {\rm Var}^{{ref}} (X_{{t{\plus}1}} \!\mid\!{\cal F}_{t} )$$
 $${\rm Var}^{{ref{\times}ersatz}} \left( {X_{{t{\plus}1}} } \right)\,{\equals}\,{\rm Var}^{{ref}} {\Bbb E}^{{ersatz}} \left( {X_{{t{\plus}1}} \!\mid\!{\cal F}_{t} } \right){\plus}{\Bbb E}^{{ref}} {\rm Var}^{{ersatz}} (X_{{t{\plus}1}} \!\mid\!{\cal F}_{t} )$$
Thus, tests of the bias of conditional and unconditional variance are also tests of bias in the variance of the mean.
3.5. Unbiased Standard Deviation
We have described the concept of an unbiased variance. We could instead look at the bias in standard deviation (i.e. in the square root of the variance). Bias in conditional standard deviation is not equivalent to bias in variance, as the variance is a non-linear function (the square) of the standard deviation.
There is a further computational complexity in testing the bias of standard deviations. While there is a well-known unbiased estimate of variance for conditionally independent scenarios, there is no such general expression for standard deviations. This implies that tests of conditional variance biases using nested Monte Carlo scenarios, can be distorted by small sample biases in the standard deviation estimate itself rather than in the ersatz model.
3.6. Unbiased Quantiles
In the same way as for standard deviations, we can assess whether ersatz quantiles are biased relative to a reference model. As with standard deviations, we have two alternatives:
-
∙ We can measure the quantile of the hybrid outer reference and inner ersatz scenarios, and compare this to the quantile of the reference model.
-
∙ We can compare the conditional quantile of the ersatz model against the conditional reference quantile, and average this over the outer reference scenarios.
As with the standard deviation, these two tests are, in general, different. However, as quantiles are in general neither convex nor concave functionals of a probability distribution, there is no general theorem governing whether unconditional quantiles are higher or lower than mean conditional quantiles.
3.7. Example of Conflicting Tests
We have described a series of bias tests. We might hope to devise ersatz models that pass them all, by ensuring the ersatz distribution resembles the reference distribution in many ways at once.
Unfortunately, as we shall see, this is unachievable. The sensible tests we have described are already in conflict.
To see why, let us consider a series of independent identically distributed random variables. Under different reference models, different distributions apply but the observations are always independent and identically distributed. Under each reference model, the conditional and unconditional distributions of future observations are the same, and the variance of the conditional mean is zero. Therefore, the unconditional standard deviation is equal to the expected conditional standard deviation.
Under the hybrid outer reference and inner ersatz scenarios, the future distribution is not independent of the past. If the past observations have been higher than their true mean, this will be projected into the ersatz model; the ersatz models are different for each outer reference scenario. Thus, for the ersatz scenarios, the unconditional standard deviation is strictly higher than the unconditional standard deviation.
It follows that the ersatz standard deviation cannot simultaneously be unbiased in the conditional and unconditional senses.
3.8. A Note on Terminology
In general parlance, biased is a pejorative term, implying favouritism or dishonesty. In statistics, bias is a neutral term; it describes a mathematical inequality that may or may not hold. Unfortunately, the use of loaded terms such as bias can make it difficulty to justify biased estimators to non-specialists who may interpret bias in its general rather than technical sense.
To draw an analogy consider the term prime. In general parlance this has positive moral overtones; prime cuts of meat represent the highest quality; prime loans are to borrowers with the best credit histories. Prime also has a technical mathematical meaning; a integer >1 is prime if it has no factors other than 1 and itself. We easily avoid the trap of considering a number to be inferior if it is not prime. Asked to calculate 2×3, we are happy to calculate the answer as 6. We are not tempted to report the answer as 7 on the grounds that 7 is prime. Unfortunately, that is precisely what we do in statistics when we demand the use of unbiased estimators even when only biased estimators can solve the problem posed.
A great deal of work would be needed to demonstrate that expert judgement is unbiased in the statistical sense, because you need the expert to exercise judgement in a large number of scenarios. Kahneman & Tversky (Reference Kahneman and Tversky1979) quantify judgemental bias by asking the same question to a large number of subjects. However, for stochastic model tests, the supply of experts is limited. Furthermore, the impact of commercial pressure is difficult to replicate in Kahneman–Tversky experiments.
4. Percentile Tests
We now consider a series of tests based on matching percentiles. The idea is to test the definition of a percentile; for a continuous distribution, the α-quantile should exceed the actual observation with probability α. To turn this into an ersatz model test, we calculate the conditional ersatz α-quantile and then count the frequency with which this exceeds the reference scenarios. As with bias tests, we average this frequency over outer reference scenarios to construct the test.
This is the generated data equivalent of the Basel historic back-test requirement (Basel Committee on Banking Supervision, Reference Berkowitz1996; Financial Conduct Authority, Reference Frankland, Eshun, Hewitt, Jakhria, Jarvis, Rowe, Smith, Sharp, Sharpe and Wilkins2007) which counts the frequency of exceptions, that is events where (hypothetical) losses exceed an ersatz 99 percentile, with an aim to hit a 1% target. Given limited data, regulators allow firms a small margin so that the observed exception frequency may rise some way above the 1% target without sanction. In practice, many firms’ exception frequencies fall well below the threshold, due to deliberate caution in their ersatz models. The Bank of England’s test of its inflation forecasts (Elder et al., Reference Elder, Kapetanios, Taylor and Yates2005) also follows this exception-based approach. In the world of general insurance, these methods have been used for testing the over-dispersed Poisson bootstrap technique (England & Verrall, Reference Engle2002), both on historic data (Leong et al., Reference Leong, Wang and Chen2014) and on generated data (GIROC, 2007, Reference Geoghan, Clarkson, Feldman, Green, Kitts, Lavecky, Ross, Smith and Toutounchi2008). This is also the idea behind Berkowitz’ value-at-risk test (Berkowitz, 2001). Arguably, this test is also relevant for insurer capital adequacy, which within Europe is based on a notional 0.5% failure probability (European Parliament, 2009).
When dealing with simulation data, there are a few variants of the test, which we now consider. In each case, we assume that for each outer scenario, we have generated n inner scenarios, of which r are from the reference model (conditional on the outer scenario) and n−r are from the ersatz model.
4.1. Ersatz Percentile Exceedance
The percentile exceedance test requires us to choose a rank, 1≤q≤n−r and extract the q
th smallest of the ersatz scenarios, which we interpret as an estimator of the ${{\left( q \right)} \over {(n{\minus}r{\plus}1)}}$
quantile of the ersatz distribution. We then count the number of the r inner reference scenarios that do not exceed the extracted ersatz scenario. The test passes if the mean number of non-exceeding inner reference scenarios, averaged over a large number of outer reference scenarios, approaches
${{\left( q \right)} \over {(n{\minus}r{\plus}1)}}$
quantile of the ersatz distribution. We then count the number of the r inner reference scenarios that do not exceed the extracted ersatz scenario. The test passes if the mean number of non-exceeding inner reference scenarios, averaged over a large number of outer reference scenarios, approaches ${{\left( q \right)} \over {(n{\minus}r{\plus}1)}}r$
.
${{\left( q \right)} \over {(n{\minus}r{\plus}1)}}r$
.
4.2. Bucket Counts
An alternative percentile exceedance calculation involves taking the r inner reference scenarios and n−r ersatz scenarios together, sorting them into increasing order. For some 1≤q≤n, we take the q smallest observations, and count the number of reference scenarios represented therein. The test passes if the mean number of reference scenarios in the smallest q of the combined scenario set, averaged over a large number of outer reference scenarios, approaches ${{\left( q \right)} \over {\left( n \right)}}r$
.
${{\left( q \right)} \over {\left( n \right)}}r$
.
There is a special case when there is only r=1 inner reference scenario for each outer scenario. The one reference scenario being smaller than the q th ersatz scenario is equivalent to being in the smallest q of the combined scenario set so our two tests become equivalent.
4.3. Continuous Percentile Test
We have described two ways to test percentiles based on Monte Carlo generated scenarios. When the ersatz model has an analytically tractable inverse distribution function, it may be possible to simplify the calculation by taking the limit of the exceedance test as the number of inner ersatz scenarios tends to infinity.
In that case, for each outer scenario, we can calculate a chosen α-quantile for the ersatz distribution. The test then focus on the probability (calculated by Monte Carlo, or analytically) that the reference outcome exceeds that ersatz α-quantile. In symbols, the test is that:
 $${\Bbb E}F_{{ref}} \left[ {F_{{ersatz}}^{{{\minus}1}} (\alpha \!\mid\!{\cal F}_{t} )} \right]\,{\equals}\,\alpha $$
This is what Geisser (Reference Geisser1993) calls a prediction interval. Gerrard & Tsanakas (2011) further consider this concept in the concept of capital adequacy, as do Frankland et al. (2014).
5. Exponential Losses Example
We consider an example of a series of variables X 1, X 2, … , X t , X t+1. We will assume they are positive random variables; they could represent an insurer’s total claim payments each year. We define Y t =X 1+X 2+ … +X t to be the cumulative losses.
We will consider various processes for generating the X t . In all our reference models, the X t are drawn from a stationary process.
The purpose of the stochastic model is to forecast the losses X t+1 in year t+1 based on the losses in years 1 to t inclusive.
5.1. Ersatz Models
We compare four different types of Ersatz model constructions for this generated loss example.
5.1.1. Plug-in ersatz model
Our first Ersatz model generates the next loss X t+1 from an exponential distribution with a mean equal to the sample average of X 1, X 2, … X t , that is, Y t /t.
5.1.2. Bayesian ersatz model
For some α 0 and λ 0>0, the Bayesian ersatz model generates X t+1 from a Pareto distribution with parameters α t =α 0+t and λ t =λ 0+Y t .
If α
0>0 and λ
0>0 this is the Bayesian predictive distribution, based on the hypothesis that all the X
t
are independent exponential draws from an exponential distribution with mean M and prior distribution
 $$M^{{{\minus}1}} \sim\Gamma \left( {\alpha _{0} ,\lambda _{0} } \right)$$
.
$$M^{{{\minus}1}} \sim\Gamma \left( {\alpha _{0} ,\lambda _{0} } \right)$$
.
In our tests, we will use λ 0=0 and α=0 or 1. In these cases, our Ersatz model is just a formulaic procedure for generating distributions; the Bayesian derivation is invalid because the prior density cannot be integrated.
5.1.3. Bootstrap ersatz model
The bootstrap Ersatz model (Efron & Tibshirani, Reference Efron and Tibshirani1993) starts by randomly sampling the loss data X 1, X 2, … X t , repeated t times with replacement. There are t t possible ways of doing this, which we either weight equally or, for large t where enumeration is impractical, we re-sample randomly. We then generate X t+1 from an exponential distribution with mean equal to the average of the random re-sample. To generate a new bootstrap forecast, we re-run both the random re-sample and also the exponential draw.
5.1.4. Maximum multiplier method
Let M t =max{X 1, X 2, … X t }. Under the maximum multiplier method, the reference distribution function is:
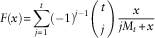 $$F(x){\equals}\mathop{\sum}\limits_{j{\equals}1}^t ({\minus}1)^{{j{\minus}1}} \left( {\matrix{ t \cr j \cr } } \right){x \over {jM_{t} {\plus}x}}$$
Table 2 describes the mean and variance of these ersatz models.
Properties of Selected Ersatz Models

5.2. Reference Models
We consider the following reference models:
-
∙ The X t are independent exponential random variates, with mean (and standard deviation) 100.
-
∙ The X t are independent Pareto random variates, with mean 100 and variance 15,000 or 20,000, corresponding to shape parameters α=6 or α=4.
-
∙ The X t are drawn from a first-order auto-regressive (AR1) process, with stationary exponential distribution (mean 100) and auto-correlation QA=0.5, 0.7 or 0.9.
We consider a historic data period of 10 years. We attempt to forecast only the next year’s loss X t+1.
We can consider our first, independent exponential, reference model also to be a AR1 process with QA=0. In Table 3 we list the mean and variance of the next observation according to these reference models.
Reference Distribution Mean and Variance
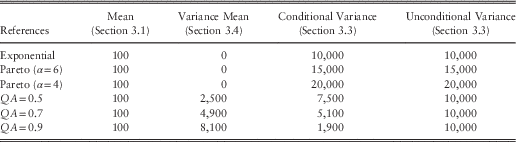
These are the “true” parameters which we seek to reproduce, or at least approximate, with an ersatz model.
5.3. Mean Bias Results
We now consider the bias in the mean of the ersatz model. Table 4 shows the average of the ersatz mean, for a range of different reference models and ersatz model constructions. This should be compared to the first column of Table 3.
Ersatz Distribution Mean for Sample Size t=10 Data Points
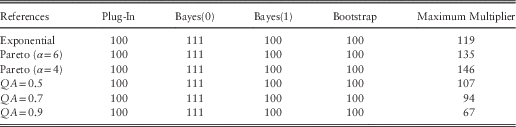
All of our reference models have constant mean (as they are fragments of stationary processes), which implies that the mean of the sample past average is equal to the mean of the next observation. It is then immediate that both the plug-in method and the bootstrap method produce unbiased means.
For the Bayesian method, the mean of the ersatz distribution is equal to ${{(\lambda _{t} )} \over {\left( {a_{t} {\minus}1} \right)}}$
, that is,
${{(\lambda _{t} )} \over {\left( {a_{t} {\minus}1} \right)}}$
, that is, ${{\left( {Y_{t} } \right)} \over {(a_{0} {\plus}t{\minus}1)}}$
. This is an unbiased estimator of the true distribution only if α
0=1. If α
0<1 then the ersatz mean is biased upwards.
${{\left( {Y_{t} } \right)} \over {(a_{0} {\plus}t{\minus}1)}}$
. This is an unbiased estimator of the true distribution only if α
0=1. If α
0<1 then the ersatz mean is biased upwards.
Finally, we come to the maximum multiplier method. Here, the ersatz mean is a multiple of M t . To find the mean of this, we need to know the expectation of M t , the maximum value of X 1, X 2, … X t . We have evaluated this analytically for the independent exponential and Pareto models, and have used Monte Carlo simulation for the AR1 processes.
The pattern of the maximum multiplier method deserves some explanation. The method is upwardly biased, even for the exponential reference method, and indeed shows a worse mean bias than the Bayes(0). Moving from exponential to Pareto distributions increases the bias. This is because the difference between the maximum of a set and the mean of the same set is a measure of variability, and the chosen Pareto distributions have higher variance than the exponential distribution.
The mean bias in the AR1 case is lower than in the independent case. That is because positive auto-correlation between observations reduces the relative dispersion, reducing the expected maximum value compared to independent observations.
5.4. Variance Bias Results
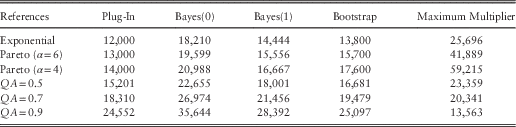
Tables 5 and 6 show the Ersatz variance, on a conditional and unconditional basis, for a variety of different reference models and ersatz constructions. These should be compared to the columns 3 and 4, respectively, in Table 3.
Ersatz Distribution Conditional Variance for t=10

Ersatz Distribution Unconditional Variance for t=10
In creating these examples, we used the following result for an AR process. From the covariance structure Cov (X s , X t )=QA |t−s|Var (X 1), we find that:
 $${\rm Var}^{{ref}} (Y_{t} ){\equals}{{t(1{\minus}QA^{2} ){\minus}2QA(1{\minus}QA^{t} )} \over {(1{\minus}QA)^{2} }}{\rm Var}^{{ref}} (X_{1} )$$
This expression is different to equation (3), because this equation refers to an unconditional variance, in contrast to the conditional variance of equation (3).
Clearly none of these ersatz models produces unbiased variances, although some show worse bias than others.
For the exponential reference model, the smallest variance bias occurs for the plug-in method. At first sight, the bias is surprising, because the mean is unbiased and both ersatz and reference models produce exponential variates, for which the variance is the square of the mean. The paradox is explained because the ersatz mean it itself a random variable. The ersatz expected variance is the mean of the squares ersatz mean, while the reference variance is square of the mean. The mean of the square is always bigger than the square of the mean, by Jensen’s inequality, hence the upward bias in the ersatz variance.
For the Pareto reference models, more methods, with the glaring exception of the maximum multiple, produce downwardly biased expected variances, both conditional and unconditional. This is because the ersatz models have been derived from exponential distributions, which (for a given mean) have lower variance than the Pareto distribution. In other words, the downward bias is a consequence of model mis-specification.
An upward bias in ersatz conditional variance emerges for the AR processes. The conditional reference variance is reduced because some of the variance is explained by the AR term; it is only the balance which features in the conditional variance. The ersatz models fail to capture the AR effect, and so overstate the conditional variance.
The maximum multiple method shows a bigger upward ersatz variance bias than any of the other methods; indeed the bias is so big that we have an upward variance bias even for the Pareto reference models. We recall that the mean of the maximum multiple method also had an upward mean bias. The bias evidence gives us little reason to commend the maximum multiple method, nor indeed the Bayes(0) method. These show positive bias in both the mean and variance, while the plug-in and Bayes(1) methods have unbiased mean and smaller variance bias in the exponential reference case. Overall, the plug-in method would be preferred on the grounds of smallest bias.
5.5. Percentile Test Results
5.5.1. Consistency
Table 7 shows the exceedance probabilities for different ersatz percentiles, for the exponential reference model. We have calculated these, with a mixture of analytical (where possible) and Monte Carlo methods, applying equation (1).
Percentile Tests for Sample Size t=10, Exponential Reference
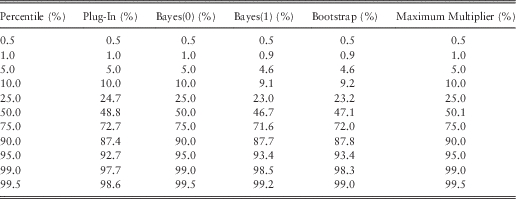
Surprisingly, these results show an exact pass for the Bayes(0) and maximum multiple methods. These are the two methods which performed worst according to the bias criteria. The Bayes(0) method is an example of a probability matching prior, as considered in Thomas et al. (Reference Speed2002) and Gerrard & Tsanakas (2011).
The next best candidates in the percentile tests are the Bootstrap and Bayes(1) methods, whose results are very close to each other despite their contrasting derivations. The worst method for percentile test is the plug-in method, which produces too many exceptions; for example, 2.3% of reference scenarios exceed the 99 percentile of the plug-in ersatz distribution.
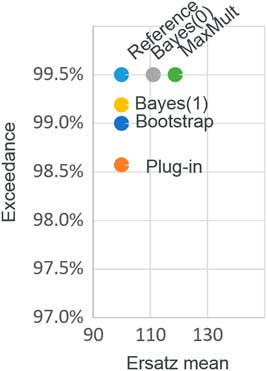
Figure 3 shows the mean bias and the percentile tests for the different methods. We can see that we can satisfy the bias tests, or the percentile tests, but not both. Furthermore, we can see that that the percentile test is a stronger test than the bias test, in that if a method passes the percentile test then the mean is upwardly biased.
Mean bias and percentile tests: exponential example
It appears, then, that the ersatz methods that work best from a bias perspective are worst for percentile tests, and vice versa. This is to be expected. We now explain why.
Let us suppose that Q is an ersatz q-quantile, and let us suppose Q≥0. For a random variable with reference distribution function F(x), we consider two criteria:
-
∙ For Q to be an unbiased estimate of the true q-quantile, we want
 $${\Bbb E}(Q)\,{\equals}\,F^{{{\minus}1}} (q)$$
, or equivalently,
$$F[{\Bbb E}(Q)]\,{\equals}\,q$$
.
$${\Bbb E}(Q)\,{\equals}\,F^{{{\minus}1}} (q)$$
, or equivalently,
$$F[{\Bbb E}(Q)]\,{\equals}\,q$$
. -
∙ For Q to exceed a proportion q of observations, we want
$${\Bbb E}F(Q)\,{\equals}\,q$$
.


Now for the exponential, Pareto and many other distributions, the distribution function F(x) is a strictly concave function on x≥0. Jensen’s inequality now implies:
 $${\Bbb E}F(Q)\leq F\left( {{\Bbb E}Q} \right)$$
Equality holds only if Q is not random. In other words, if Q is an unbiased estimator for q (as is the plug-in ersatz model) then the ersatz percentile test is too low. If, on the other hand, the percentile test passes, then Q is an upwardly biased estimate of the reference percentile q, as occurs in the Bayes(0) test. We simply cannot pass all the tests at once.
5.5.2. Robustness: Pareto
Table 8 shows exceedance probabilities for ersatz percentiles, when the reference model is series of independent Pareto variates, with shape parameter α=6, corresponding to a variance of 1.5 if the mean is 1. These are all based on ten data points, and a one-step-ahead forecast.
Percentile Tests: Robustness to Mis-Specified Distribution: Pareto (α=6)
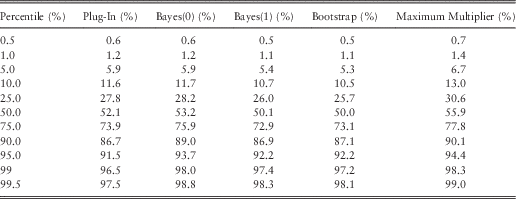
As we might expect, ersatz models derived from exponential distributions do not perform brilliantly on a diet of Pareto distributed data. The Pareto has fatter tails than the exponential, so exponential ersatz models should under-predict the upper tails, which is exactly what we see in Table 8 and also Figure 4. It remains the case that the Bayes(1) and bootstrap method are similar to each other.
Mean bias and percentile tests: Pareto (α=6) sensitivity
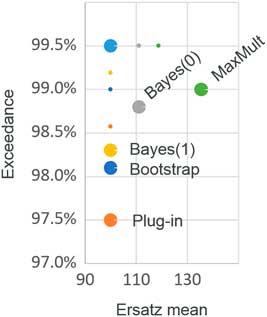
It is not surprising that the Bayes(0) method performs better than Bayes(1) in the extreme tail, because with ten data points, Bayes(0) produces a fatter tailed Pareto ersatz distribution (α t =10) than the Bayes(1) ersatz distribution (α t =11).
The least bad method at high percentiles, from a robustness point of view, appears to be the maximum multiple method. While the plug-in and Bayes methods focus on the historic average, the maximum multiple method focusses on the largest observation. As we have seen, this produces a higher variance, but, as the maximum focusses on the upper tail, we are able better to hedge our bets against mis-specification of tail fatness.
5.5.3. Robustness: AR model
Table 9 shows exceedance probabilities for ersatz percentiles, when the underlying data are autocorrelated, having been generated from an AR1 process. These are all based on ten data points, and a one-step-ahead forecast.
Percentile Tests: Robustness to Auto-Correlation (QA=0.5)
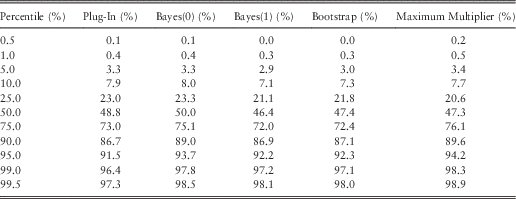
The striking feature of Table 9 is the poor fit at low percentiles. The reason for this is that, under the AR1 process, X t+1≥QA×X t with probability 1, so the conditional reference distribution has a strictly positive lower bound. This contrasts with the Ersatz models all of which have a lower bound of zero (and no higher).
At the upper end, the pattern of extreme reference percentile under-prediction persists, with the maximum multiple method once again the most robust.
5.6. Conflicting Objectives
Our examples have shown how difficult it is to satisfy multiple tests at once. We can summarise the results so far.
-
∙ From a parameter bias perspective, the best ersatz model is the plug-in, followed by Bayes(1).
-
∙ For percentile consistency tests, the best performers are Bayes(0) and maximum multiple.
-
∙ For robustness to model mis-specification at the upper percentiles, the maximum multiple method performs best, with Bayes(0) coming second.
-
∙ Passing a percentile test is a stronger validation criterion than passing a bias test; a loss model must be upwardly biased in order to pass the percentile test.
We can ask for parameters to be unbiased, or for accurate percentile tests but, apparently, not both at once.
These conflicts have been noted in special cases before. For example, GIROC (2007, Reference Geoghan, Clarkson, Feldman, Green, Kitts, Lavecky, Ross, Smith and Toutounchi2008), applied percentile tests to the over-dispersed Possion bootstrap method described by Brickman et al. (Reference Cook and Smith1993) and England & Verrall (Reference Engle2002), with mixed results. Cairns & England (Reference Brickman, Barlow, Boulter, English, Furber, Ibeson, Lowe, Pater and Tomlinson2009) reproduced the GIROC results but disputed the conclusions on the grounds that the tests were inappropriate.
Figure 2 gives another view of why the tests conflict. An ersatz model test is a comparison of some property of the blue ersatz scenarios, relative to the green and red inner reference scenarios. For an ersatz model to pass all possible tests, the blue ersatz scenarios should be indistinguishable in all respects from the green or red inner reference scenarios, for each outer scenario.
However, in this example we have two reference models. The corresponding collections of inner reference scenarios are of course different, having arisen from different models. However, it so happens that the two highlighted outer scenarios, one from each model, are the same. As a result, the two collections of blue inner ersatz scenarios must be the same in each case, as the ersatz scenarios are calibrated to the same outer scenarios. The blue scenarios cannot at the same time be indistinguishable from the green inner scenarios and from the red inner scenarios.
5.7. Alternative Paths
In this section, we have tested formulaic methods of constructing ersatz models from limited data. It is common in practice to follow a more complex decision tree, where model fit and parameter significance are subjected to testing, with different model classes eventually used according to the results of these tests.
Taking the example in section 1.3, before using a model based on the exponential model, we might estimate a distribution property, for example, the standard deviation or the L-scale, and compare it to the theoretical value. For our ten observations, the sample mean is 100, the s.d. is also 100 and the L-scale is 50. These are exactly what we would expect for an exponential distribution. But if we had rejected the exponential distribution we would then possibly have fitted very different ersatz models.
The use of intermediate tests in the ersatz model construction does not invalidate the idea of generated data tests, but it does complicate them.
6. AR Growth Example
6.1. Wilkie’s Inflation Model
Much of econometric analysis concerns the prices of investments or commodities. An individual share, bond or foodstuff may fall in or out of favour, but the general level of a market is typically captured in an index Q t representing a basket of assets, such as the Retail Prices Index or the Financial Times Stock Exchange 100 Index.
Index starting values are often set arbitrarily to a round number such as Q 0=100; it is only relative changes in index values that have economic meaning, describing whether asset prices have risen or fallen compared to previous values.
The simplest approach to modelling such indices is to use a random walk (Samuelson, Reference Samuelson1972) but this does not cope well with processes such as inflation where changes are typically positively correlated from one period to the next. One approach to capture the auto-correlation is to treat the changes in the log index as a AR1 process. For example, Wilkie (Reference Wilkie1984, Reference Wilkie1995) proposed the following model:
 $${\rm ln}\left( {{{Q_{{t{\plus}1}} } \over {Q_{t} }}} \right)\,{\equals}\,QA\,{\rm ln}\left( {{{Q_{t} } \over {Q_{{t{\minus}1}} }}} \right){\plus}\left( {1{\minus}QA} \right)QMU{\plus}{\cal N}\left( {0,QSD^{2} } \right)$$
With a little algebra, we can derive the k-step forecast, which will be the basis of our ersatz models:
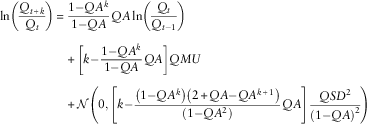 $$\eqalignno{ {\rm ln}\left( {{{Q_{{t{\plus}k}} } \over {Q_{t} }}} \right)\,{\equals}\, & {{1{\minus}QA^{k} } \over {1{\minus}QA}}QA\,{\rm ln}\left( {{{Q_{t} } \over {Q_{{t{\minus}1}} }}} \right) \cr & {\plus}\left[ {k{\minus}{{1{\minus}QA^{k} } \over {1{\minus}QA}}QA} \right]QMU \cr & {\plus}{\cal N}\left( {0,\left[ {k{\minus}{{\left( {1{\minus}QA^{k} } \right)\left( {2{\plus}QA{\minus}QA^{{k{\plus}1}} } \right)} \over {\left( {1{\minus}QA^{2} } \right)}}QA} \right]{{QSD^{2} } \over {\left( {1{\minus}QA} \right)^{2} }}} \right) $$
Wilkie has published parameter estimates from time to time for UK inflation, including those in Table 10.
Wilkie’s Parameters for UK Inflation
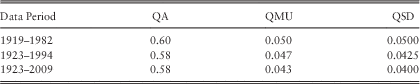
These parameters were estimated by treating equation (2) as a linear regression of
 $$\ln \left( {{{Q_{t} _{{{\plus}1}} } \over {Q_{t} }}} \right)$$
against
$$\ln \left( {{{Q_{t} _{{{\plus}1}} } \over {Q_{t} }}} \right)$$
against
 $$\ln \left( {{{Q_{t} } \over {Q_{t} _{{{\minus}1}} }}} \right)$$
, with slope QA, intercept (1−QA)QMU and residual standard deviation QSD, estimated in the usual way. The parameter estimates were then rounded. The originally published model (Wilkie, Reference Wilkie1984) included a subjective upward adjustment to QMU.
$$\ln \left( {{{Q_{t} } \over {Q_{t} _{{{\minus}1}} }}} \right)$$
, with slope QA, intercept (1−QA)QMU and residual standard deviation QSD, estimated in the usual way. The parameter estimates were then rounded. The originally published model (Wilkie, Reference Wilkie1984) included a subjective upward adjustment to QMU.
Later in this paper, we consider ways of testing such AR models on generated data.
6.2. Reference Models
For our AR growth example, we construct reference models based on equation (2). We use the following combinations:
-
∙ AR parameters QA=0, 0.5, 0.7 or 0.9.
-
∙ Historic periods of 10, 20 or 50 years.
-
∙ Forecast horizons of 1, 10 or 20 years.
We use QMU=0.05 and QSD=0.05, which were Wilkie’s (Reference Wilkie1984) choices for a UK inflation model. These choices affect only relative outputs, and so is effectively without loss of generality.
In each case, we start the reference model from the stationary distribution:
 $${\rm ln}\left( {{{Q_{1} } \over {Q_{0} }}} \right)\!\sim\!{\cal N}\left( {QMU,{{QSD^{2} } \over {1\,{\minus}\,QA^{2} }}} \right)$$
6.3. What Exactly are we Testing?
This section is not a test of the Wilkie model, which describes many time series besides inflation. Wilkie’s model has been exposed to extensive review elsewhere (Geoghan et al., Reference Gerrard and Tsanakas1992; Huber, Reference Huber1995).
This section is also not a test of Wilkie’s inflation model; since his original model he has described several alternative approaches to inflation modelling. Our generated data tests do not even use any real inflation data. Readers interested in learning more about specifics of inflation may wish to consult Engle (Reference England and Verrall1982), Wilkie (Reference Wilkie1995), Speed (Reference Thomas, Mukerjee and Ghosh1997), Whitten & Thomas (Reference Whitten and Thomas1999).
We are testing an abstract method (ordinary least squares) of calibrating univariate AR1 models. Although Wilkie used this method, it is a general statistical approach in widespread use (Hamilton, Reference Hamilton1994). Our mechanical testing approach contravenes Wilkie’s instruction that model users “should form their own opinions about the choice of appropriate mean values” (Reference Wilkie1995). We have used Wilkie’s notation as this may be already familiar to actuaries.
Previous published work in this area is scant. Exley et al. (2002) provide some tests of the AR models on simulated data.
6.4. Ersatz Models
Our ersatz models are also AR1 models, but with estimated parameters
 $$\widehat{{QA}}$$
,
$$\widehat{{QA}}$$
,
 $${\widehat {Q\!M\!U}}$$
and
$${\widehat {Q\!M\!U}}$$
and
 $$\widehat{{QSD}}$$
. We estimate these by linear regression of consecutive changes in the reference log inflation index histories.
$$\widehat{{QSD}}$$
. We estimate these by linear regression of consecutive changes in the reference log inflation index histories.
While our reference models are all stationary (because the reference parameter |QA|<1), this does not automatically apply to parameter estimates
 $$\widehat{{QA}}$$
. In particular, in a certain proportion of outer scenarios, we will find
$$\widehat{{QA}}$$
. In particular, in a certain proportion of outer scenarios, we will find
 $$\widehat{{QA}}\,\gt\,1$$
. These imply a divergent series with exponentially exploding scenarios. For longer horizon forecasting, this small number of exploding ersatz models comes to dominate any attempts to measure parameter bias.
$$\widehat{{QA}}\,\gt\,1$$
. These imply a divergent series with exponentially exploding scenarios. For longer horizon forecasting, this small number of exploding ersatz models comes to dominate any attempts to measure parameter bias.
Some experts, faced with an estimate
 $$\widehat{{QA}}\,\gt\,1$$
, will reject that value, on the grounds that the implied exploding process is an implausible model for inflation. They might constrain
$$\widehat{{QA}}\,\gt\,1$$
, will reject that value, on the grounds that the implied exploding process is an implausible model for inflation. They might constrain
 $$\widehat{{QA}}$$
to lie in what is judged to be a plausible range. In our calculations, for any outer reference scenario producing
$$\widehat{{QA}}$$
to lie in what is judged to be a plausible range. In our calculations, for any outer reference scenario producing
 $$\widehat{{QA}}\,\gt\,1$$
, we replace the ersatz model with
$$\widehat{{QA}}\,\gt\,1$$
, we replace the ersatz model with
 $$\widehat{{QA}}{\equals}1$$
. We then recompute the other parameter estimates
$$\widehat{{QA}}{\equals}1$$
. We then recompute the other parameter estimates
 $$\widehat{{Q\!M\!U}}$$
and
$$\widehat{{Q\!M\!U}}$$
and
 $$\widehat{{QSD}}$$
from the history, but with the regression gradient forced to 1. We apply a similar transformation in the (less frequent) cases where
$$\widehat{{QSD}}$$
from the history, but with the regression gradient forced to 1. We apply a similar transformation in the (less frequent) cases where
 $$\widehat{{QA}}\,\lt\,{\minus}1$$
. In other words, we impose a plausible range of
$$\widehat{{QA}}\,\lt\,{\minus}1$$
. In other words, we impose a plausible range of
 $${\minus}1\leq \widehat{{QA}}\leq 1$$
, with estimates outside that range mapped onto the nearest boundary.
$${\minus}1\leq \widehat{{QA}}\leq 1$$
, with estimates outside that range mapped onto the nearest boundary.
6.5. Mean Bias
We now argue that the ersatz mean of future scenarios is an unbiased estimate of the reference mean.
We demonstrate this by a symmetry argument. Let us fix the parameters QA and QSD, and also fix the random normal error terms. Let us consider the impact of adding some constant, c, to QMU. Under this shift, we see:
-
∙ The historic reference rates of inflation all increase by c.
-
∙ Future reference rates of inflation all increase by c.
-
∙ Ersatz
$$\widehat{{QA}}$$
and
$$\widehat{{QSD}}$$
are unchanged, but
$$\widehat{{QMU}}$$
increases by c, so future ersatz scenarios increase by c.


We can conclude that the mean bias, that is the difference between mean ersatz and reference scenarios, is invariant under changes in QMU. But in the case QMU=0 both the reference and ersatz distributions are symmetric about zero, so the bias is zero.
Sadly, these symmetry arguments get us nowhere when it comes to bias in variance. We can proceed only by Monte Carlo.
6.6. Variance Bias
Table 11 shows the average variance of the ersatz scenarios, that is, the conditional variance for log of the index ln Q t+h for various histories t∈{10, 20, 50}. In the limit as t ↑ ∞, the ersatz parameters converge to the reference parameters.
Mean of Conditional Variance for Various Horizons; QA=0.7
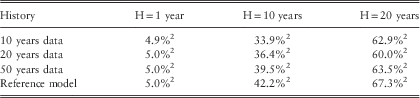
The figures in Table 11 should be read as follows. Let us focus on the horizon H=10 years. Under the reference model, if we want to forecast the log inflation index 10 years ahead, we can do so with a variance of 42.2%2, or equivalently, a s.d. of 42.2%.
If we calibrate an ersatz model by least squares, we obtain on average a smaller conditional variance, for example, of 36.4%2 with 20 years’ calibration data. The absolute variances are of course dependent on our choice of reference QSD, but the ratio of ersatz to reference variance is not. The expected ersatz variance is systematically underestimated at around three quarters of the reference value (with the standard deviation factor the square root of this). This bias is in the opposite direction to the upward ersatz variance biases which we noticed in our exponential example.
The downward variance bias must be related to the small sample size. Theory tells us that the effect disappears as the data sample size tends to infinity, in the reference limit. However, we needed Monte Carlo simulations to quantify the effect for small samples. As we have seen, for history lengths and forecast periods which actuaries often encounter, these small sample biases are quite problematic.
At first sight, the biases are surprising, as linear regression is known to produce unbiased parameter estimates (Anderson, Reference Anderson2003). However, these results assume that the X variates are fixed, while Y are independent random variables. Time series estimates are different, as both X and Y are random variables, observed consecutively from (what we suppose to be) a common AR1 process. Furthermore, multi-period forecasts are non-linear functions of the parameters, with higher powers for longer periods. This might explain why the bias is modest with a 1-year horizon but deteriorates for 10-year projections.
Table 12 shows the impact of the QA parameter on variance bias. This shows that higher values of QA, that is, weaker mean reversion, lead to greater downward variance bias. The shape of variance by horizon is determined by QA; the higher the value of QA (other things being equal) the higher the multi-period variance. One possible reason for the downward bias in ersatz variance is our cap that
 $$\widehat{{QA}}\leq 1$$
. If the reference QA is close to 1, then estimated parameters may cluster around the true value, but by pushing down those that exceed 1, we depress the average
$$\widehat{{QA}}\leq 1$$
. If the reference QA is close to 1, then estimated parameters may cluster around the true value, but by pushing down those that exceed 1, we depress the average
 $$\widehat{{QA}}$$
and hence the average ersatz variance.
$$\widehat{{QA}}$$
and hence the average ersatz variance.
Mean of Conditional Variance for 10-Year Horizon

6.7. Percentile Tests
Table 13 shows the result of percentile tests, with a 10-year horizon and with QA=0.7. We can see that the ersatz median passes the test, exceeding the reference scenarios 50% of the time.
Percentile Exceedances; QA=0.7 and H=10 years
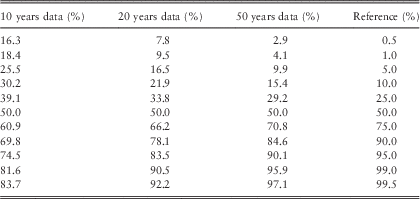
Other percentiles are captured less accurately. In each case, the extreme reference events happen more frequently than would be implied by the ersatz distribution. For example, taking 20 years of data and a 10-year forecast horizon, we see that the reference scenarios lie below the erstaz 1 percentile with a probability of 9.5%. In other words, if we were counting exceptions in a value-at-risk calculation, we are seeing nearly ten times more extreme events than the ersatz model predicts.
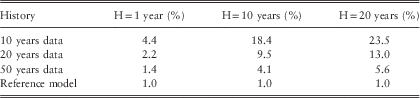
Table 14 shows that this percentile bias is smaller if the time horizon is shorter, or if the data sample is larger.
First Percentile Exceedance for Various Horizons; QA=0.7
6.8. Convexity Effects
We should not be surprised that ersatz AR1 models produce too many exceptions, given that we have already noted a downward bias in ersatz variance in Table 12.
However, the percentile tests fail by a much larger margin. Table 15 compares three distributions for log inflation over a 10-year horizon. All three have the same mean, which is equivalent to 10 years’ inflation at QMU=5%.
-
∙ The reference distribution has the conditional variance of the reference model in Table 11.
-
∙ The first ersatz distribution has the conditional variance equal to the average ersatz model calibrated to 20 years’ data, also in Table 11.
-
∙ The second ersatz distribution shows how small the ersatz standard deviation would have to be, in order to produce the 1 percentile test failure in Table 13.
First-order auto-regressive Standard Deviations and Extreme Stresses

The third column, for context, shows the corresponding fall in prices over a 10-year period (without logarithms).
Table 12 shows that the variance bias alone is insufficient to explain the percentile test failure. To understand the effect, we must recognise that ersatz variances are not only too low on average, but may be far smaller than the average variance for particular outer reference scenarios. If we focus on cases where reference scenarios exceed extreme ersatz percentiles, we will see a disproportionate number of calibration errors where the ersatz model understates deflationary scenarios. The ersatz model may have overestimated mean inflation, that is
 $$\widehat{{QMU}}\,\gt\,QMU$$
, underestimated the standard deviation
$$\widehat{{QMU}}\,\gt\,QMU$$
, underestimated the standard deviation
 $$\widehat{{QSD}}\,\lt\,QSD$$
or overstated mean reversion
$$\widehat{{QSD}}\,\lt\,QSD$$
or overstated mean reversion
 $$\widehat{{QA}}\,\lt\,QA$$
.
$$\widehat{{QA}}\,\lt\,QA$$
.
Such calibration errors are of course more severe when data are limited. Furthermore, the impact of a parameter error compounds over future time horizons; the further ahead we look, the greater the impact of uncertainty, especially in QMU and QA. We should not be surprised, therefore, that the percentile bias is smaller if the time horizon is shorter, or if the data sample are larger, as we saw in Table 14. This pattern is consistent with the Jensen effect we saw in the exponential example section 5.5.1.
6.9. Allowing for Parameter Uncertainty
In our calculations for the AR1 model, we have used the simplest ersatz construction: another AR1 model, with parameters estimated by least squares and plugged in. We could consider Bayesian or bootstrap methods for capturing parameter uncertainty. Wilkie (Reference Wilkie1985) describes some investigations of mixture investment models where the underlying parameters are stochastic, reporting no material change in mean investment returns but an increase in standard deviations. Percentile tests are not provided, but it is to be hoped that these would show an improvement relative to the plug-in approach.
7. Conclusions
7.1. All Models are Wrong
All models are deliberate simplifications of the real world. Attempts to demonstrate a model’s correctness can be expected to fail, or apparently to succeed because of test limitations, such as insufficient data.
We can explain this using an analogy involving milk. Cows’ milk is a staple part of European diets. For various reasons some people avoid it, preferring substitutes, or ersatz milk, for example, made from soya. In a chemical laboratory, cows’ milk and soya milk are easily distinguished.
Despite chemical differences, soya milk physically resembles cows’ milk in many ways – colour, density, viscosity, for example. For some purposes, soya milk is a good substitute, but other recipes will produce acceptable results only with cows’ milk. The acceptance criteria for soya milk should depend on how the milk is to be used.
In the same way, with sufficient testing, we can always distinguish an ersatz model from whatever theoretical process drives reality. We should be concerned with a more modest aim: whether the ersatz model is good enough in the aspects that matter, that is, whether the modelling objective has been achieved.
7.2. Testing on Empirical Data Versus Generated Data
In this paper we have considered methods for testing models using generated data.
Conventional model testing on historic data suffers from low power. This limits test sensitivity to detect model errors. An array of green lights in a validation report can easily be misinterpreted as proof that the models are correct. The actual achievement is more modest: a failure to demonstrate that the models are wrong. Limited data may mean we cannot decide if a model is good or not, or we might not have tried very hard to find model weaknesses.
Testing on generated data has the reverse problem, that even tiny discrepancies are detectable, given sufficiently many simulations. Generated data tests reveal a multitude of weaknesses for any model. This is a good thing if the validation objective includes a better understanding of model limitations. As all models have limitations, a validation report where all the indicators are green may be evidence of wishful thinking rather than a good model.
Generated data tests are not new, and there have been several applications to disparate areas of actuarial work described in the last 10 years. Some of these are parts of larger documents, or presentation discussions, without a detailed methodology description. This paper attempts to draw together themes from several strands of research, clarifying the methodology, adding further examples and arranging the various concepts and tests in a systematic fashion.
7.3. Have we Solved the Problem?
We started this paper with stories of models gone bad. Can our proposed generated data tests prevent a recurrence?
The Model Risk Working Party et al. (Reference Aggarwal, Beck, Cann, Ford, Georgescu, Morjaria, Smith, Taylor, Tsanakas, Witts and Ye2105) has explained how model risks arise not only from quantitative model features but also social and cultural aspects relating to how a model is used. When a model fails, a variety of narratives may be offered to describe what went wrong. There may be disagreements between experts about the causes of any crisis, depending on who knew, or could have known, about model limitations. Possible elements include:
-
∙ A new risk emerged from nowhere and there is nothing anyone could have done to anticipate it – sometimes called a “black swan”.
-
∙ The models had unknown weaknesses, which could have been revealed by more thorough testing.
-
∙ Model users were well acquainted with model weaknesses, but these were not communicated to senior management accountable for the business
-
∙ Everyone knew about the model weaknesses but they continued to take excessive risks regardless.
Ersatz testing can address some of these, as events too rare to feature in actual data may still occur in generated data. Testing on generated data can also help to improve corporate culture towards model risk, as:
-
∙ Hunches about what might go wrong are substantiated by objective analysis. While a hunch can be dismissed, it is difficult to suppress objective evidence or persuade analysts that the findings are irrelevant.
-
∙ Ersatz tests highlight many model weaknesses, of greater or lesser importance. Experience with generated data testing can de-stigmatise test failure and so reduce the cultural pressure for cover-ups.
We recognise that there is no mathematical solution to determine how extreme the reference models should be. This is essentially a social decision. Corporate cultures may still arise where too narrow a selection of reference models is tested, and so model weaknesses remain hidden.
7.4. Limitations of Generated Data Tests
Generated tests can tell us a great deal about a modelling approach. However, they have some limitations.
Generated data methods do not test a particular ersatz model; they test a way of building ersatz models. This requires us to specify how a model would have been constructed based on alternative input data. In some cases, for example, the Bank of England’s fan charts, we can examine historic ersatz models, but the parameter choice depends on the subjective judgement of the Bank’s Monetary Policy Committee so we cannot readily re-create the model under generated inputs. This is an obstacle to applying generated tests, and indeed prevents us from testing whether the model forecasts are statistically biased or not.
For models such as Wilkie’s (Reference Wilkie1984) model, we have a precise derivation of the parameters from historic data, so we can test how the fitted parameters would be different had the historic data been different. However, difficult cases arise, for example, in specifying alternative courses of action when a statistical test fails or when naïve parameter estimates imply geometrically exploding future scenarios.
7.5. Consistency and Robustness
Proposed models often come with stated lists of assumptions. Actuarial reports in the United Kingdom are required to document assumptions used in a model’s specification, its implementation and realisations (Board for Actuarial Standards, 2010).
One thing we know about assumptions is that they will turn out to be wrong. For model builders, client acceptance of a set of assumptions gives a degree of legal risk protection, as subsequent model malfunction may be blamed on inevitable assumption violations. However, this does little to satisfy the regulator’s objective that “users for whom a piece of actuarial information was created should be able to place a high degree of reliance on the information’s relevance” (Board for Actuarial Standards, 2010).
We can do better than this with ersatz model tests. Consistency means that the model works well on data generated consistently with the stated assumptions. Robustness means that the model may work within an acceptable tolerance even if the reference process violates the stated assumptions.
7.6. Parameter and Model Uncertainty
All stochastic investigations involve choices of models and parameters.
Many actuarial investigations involve a single model, whose chosen parameters are described as best estimates. While such models may be accompanied with statistical tests, or statements of parameter standard errors, there is not always an explicit allowance for the possibility that the model or parameters may be incorrect.
On the other hand, some modelling approaches, including some Bayesian and bootstrap methods, include explicit steps which are meant to capture parameter uncertainty. The Solvency II regulations (European Commission, Reference Exley, Smith and Wright2015) require that “Wherever possible, the probability distribution forecast shall be adjusted to account for model and estimation errors”.
There is no universally agreed criterion determining whether an ersatz model does, or does not, take account of model and estimation error. It is clearly not sufficient to scan the documentation searching for a step labelled “Model error adjustment” because, for example, a step entitled “Model Error adjustment: Add zero to all parameters” should not count.
We therefore look for an output-based criterion for capturing model error. Our results have shown that:
-
∙ Ersatz methods which ignore parameter error, typically fare well in tests for parameter bias, but perform poorly in percentile tests.
-
∙ Methods described as incorporating parameter error, tend to perform better, if not perfectly, in percentile tests. However, the allowance for parameter uncertainty will tend to increase projected outcome variance, and thus fail bias tests.
We are not suggesting that “passes percentile tests” is equivalent to “takes account of model and parameter error”. Rather, we are saying that the manner in which parameter error is taken into account should depend on the model purpose. If we have a true model then it is true for all purposes, but an ersatz model may be more limited in scope.
7.7. Test Conflicts
In this paper we have outlined a large number of model tests that could be performed using generated data. These tests all have plausible rationales, and several have been used in practice for many years, even if not in a structured way.
All of these tests should pass, if a procedure for generating ersatz scenarios correctly identifies the conditional distribution from an underlying reference model. However, when more than one reference model is considered, and given the unlimited power of generated data to detect model weaknesses, it may no longer be possible to satisfy all the tests at once. Choices and trade-offs must be made.
Conflict between different tests is a consequence of model and parameter uncertainty, and of the need to pick a single ersatz model. The conflicts are most acute when data are scant and so the uncertainty is most pronounced. For example, actuaries may debate whether it is possible to estimate a 99 percentile loss based on ten data points. We have seen that is it possible to create unbiased estimates of this percentile, and to create estimates that pass a percentile test, but not both at once. Solutions to either problem are vulnerable to model mis-specification. Claims to have calculated extreme percentiles, especially when based on small data sets, should be substantiated with details of any tests which those estimators have satisfied.
We consider several possible validation criteria: unbiased mean, unbiased (conditional or unconditional) variance and percentile tests. For value-at-risk, the validation criteria are a separate dimension to the confidence level. Any of these validation criteria could be combined with a 99.5% value-at-risk. An unbiased mean criterion typically produces a smaller value-at-risk figure while passing a percentile test produces a larger value-at-risk figure. For this reason, we might describe the unbiased mean criterion as weak and the percentile criterion as strong.
Weak and strong validation methodologies can both have their place, just as strong and weak actuarial valuation basis can have their place. However, it is important to understand the strength of assumptions being used. The relevant validation strength depends on a model’s application. Unbiased parameters are important in portfolio construction. Percentile tests are more important for value-at-risk, for example, as required in the Basel Committee market risk model back-test (Basel Committee on Banking Supervision, Reference Berkowitz1996). Other tests may be important for product pricing, financial reporting or risk control. We reject the naïve idea that a single model will be “best” for all purposes. Instead, users should test each model in a way that is appropriate to its application.
Acknowledgements
The authors are grateful for many constructive comments on earlier drafts of this paper from members of the Extreme Events Working Party, from attendees at the 2016 AFIR Colloquium in Edinburgh and at the 2016 Actuarial Teachers’ and Researchers’ conference at the University of East Anglia, where we presented an earlier version of this paper. The authors thank Antoon Pelsser, Andreas Tsanakas and David Wilkie for enlightening discussions. The authors are also indebted to three anonymous scrutineers for useful comments. Views expressed, and any remaining errors, are solely the responsibility of the authors.


 Open access

