
Antipsychotic medication is a mainstay in the treatment of schizophrenia. It is effective in treating symptoms and, when taken prophylactically, can prevent relapse. It is well established that many patients do not take their medication as prescribed, with adverse consequences including relapse. Some antipsychotic medications are available as long-acting depot injections and these preparations are thought to confer some benefit in terms of reduced relapse rates. Between a quarter and a third of patients with schizophrenia are prescribed such long-acting injections (LAI) and the rate is increasing. Reference Burns1,Reference Barnes, Shingleton-Smith and Paton2 Despite this frequent prescription, the data on the use of LAI antipsychotics are scanty and much of the research on these preparations is old. Reference Adams, Fenton, Quraishi and David3 There is also considerable uncertainty about optimal dosing. Reference Taylor4 Recently there have been calls to improve the evidence base for prescribing LAI antipsychotics to promote a more appropriate use of these drugs. Reference Patel, Taylor and David5
Flupentixol decanoate has a very wide dose range. For example, Taylor Reference Taylor4 reports a dose range of 50 mg every 4 weeks to 400 mg every week. The maximal equivalent dose of flupentixol decanoate when compared with other depot conventional antipsychotics appears to be relatively much greater. There is uncertainty regarding whether such high doses confer benefit to the patient. Since surveys in the UK and New Zealand have suggested that flupentixol decanoate is the most commonly prescribed antipsychotic in these settings, it is perhaps a little surprising that it has not been more extensively researched. Reference Paton, Lelliott, Harrington, Okocha, Sensky and Duffett6,Reference Humberstone, Wheeler and Lambert7
Method
The method of our review is based upon that of Taylor. Reference Taylor8 The Cochrane library was searched for flupentixol decanoate. The Cochrane review for flupentixol decanoate Reference David, Adams and Quraishi9 was studied and supplemented by a MEDLINE search in December 2009. References were checked for additional studies.
Those papers which were randomised controlled trials in schizophrenia, specified dosage of flupentixol decanoate, contained relapse data and lasted 6 months or longer were included.
To indicate the relationship between flupentixol decanoate dose and survival rate, a Generalised Additive Model Reference Wood10 (GAM) was fitted to the data obtained from the studies that met the inclusion criteria.
Results
Eight studies met all the inclusion criteria and all were included. The studies contained 12 different groups of patients prescribed flupentixol decanoate (Table 1).
Flupentixol decanoate studiesFootnote a
| Study | Duration and sample | Dose | Sample size n | Survival rate n (%) |
|---|---|---|---|---|
| Agrup-Andersson et al Reference Agrup-Andersson, Bengtsson, Erlandsson, Gottfries and Witzell-Ostlund11 | 6 months Adherent female out-patients | Mean 40 mg every 4 weeks (range 10-30 mg) | 28 | 22 (79) |
| Agrup-Andersson et al Reference Agrup-Andersson, Bengtsson, Erlandsson, Gottfries and Witzell-Ostlund11 | 6 months Adherent female out-patients | Mean 40.7 mg every 2 weeks (range 10-60 mg) | 29 | 26 (93) |
| Kelly et al Reference Kelly, Freeman, Banning and Schiff12 | 9 months Consecutive out-patients with schizophrenia | 20 mg every 3 weeks | 15 | 12 (80) |
| Kelly et al Reference Kelly, Freeman, Banning and Schiff12 | 9 months Consecutive out-patients with schizophrenia | 40 mg every 3 weeks | 15 | 14 (93) |
| Pinto et al Reference Pinto, Banerjee and Ghosh13 | 18 months Stabilised out-patients with schizophrenia | Mean 36.6 mg every 3 weeks (dose range not specified) | 31 | 29 (94) |
| Wistedt et al Reference Wistedt, Jorgensen and Wiles14 | 24 weeks Out-patients with schizophrenia | Mean 27.5 mg every 3 weeks (dose range not specified) | 8 | 5 (63) |
| Steinert et al Reference Steinert, Erba, Pugh, Robinson and Preist15 | 12 months Out-patients with schizophrenia | 40 mg every 2 weeks | 16 | 12 (75) |
| Cookson Reference Cookson16 | 44 weeks Patients with schizophrenia stabilised on high doses for at least 3 months | Mean 333 mg every 2 weeks | 9 | 6 (67) |
| Cookson Reference Cookson16 | 44 weeks Patients with schizophrenia stabilised on high doses for at least 3 months | Mean 118 mg every 2 weeks | 9 | 6 (67) |
| Johnson et al Reference Johnson, Ludlow, Street and Taylor17 | 12 months Out-patients with schizophrenia | Mean 9 mg per week (range 4-20 mg) | 31 | 28 (90) |
| Johnson et al Reference Johnson, Ludlow, Street and Taylor17 | 12 months Out-patients with schizophrenia | Mean 6 mg per week (range 1.7-10 mg) | 28 | 19 (68) |
| Lundin et al Reference Lundin, Dencker and Malm18 | 1 year Out-patients with schizophrenia stable for 3 months | Mean 82 mg per month | 28 | - (53)Footnote b |
a. Studies which are listed twice contained two groups of patients, each receiving different doses or dose ranges of flupentixol decanoate.
b. Only percentage rate given.
The studies used a variety of designs and their duration varied from 24 weeks to 18 months. The selection of patients differed between studies. Four studies required their patients to have experienced a period of stability prior to entering the study. Reference Agrup-Andersson, Bengtsson, Erlandsson, Gottfries and Witzell-Ostlund11,Reference Pinto, Banerjee and Ghosh13,Reference Cookson16,Reference Lundin, Dencker and Malm18
Only Kelly et al Reference Kelly, Freeman, Banning and Schiff12 used fixed doses and studied consecutive out-patients. The sample in Cookson Reference Cookson16 had treatment-resistant schizophrenia. Therefore a degree of clinical heterogeneity is likely to be present.
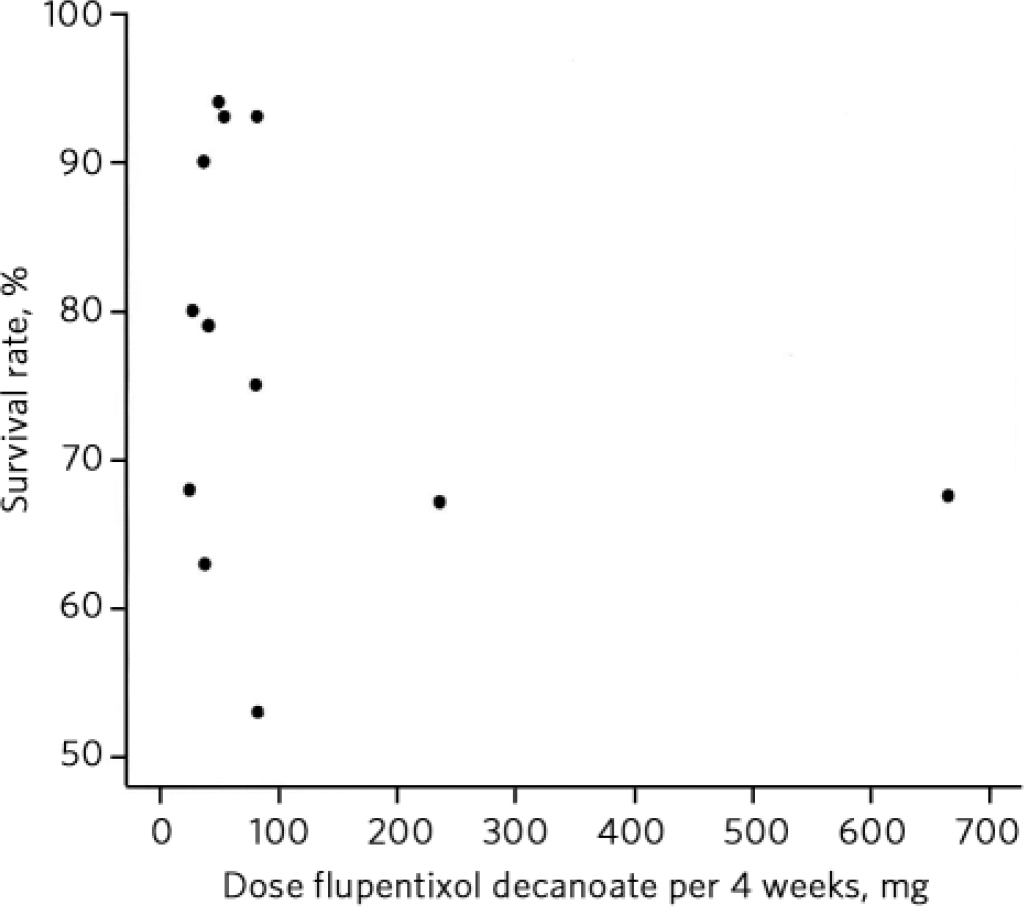
The survival rates are shown in Fig. 1. Points are plotted at the average dose received by patients in each study. It can be seen (Table 1 and Fig. 1) that the two groups of patients from the Cookson Reference Cookson16 study received much higher doses than those in the remaining studies and appear to be outliers. In addition, these were patients with treatment-resistant schizophrenia who were unlikely to respond. These two groups were therefore excluded from further analysis.
Survival rates by dose of flupentixol decanoate.
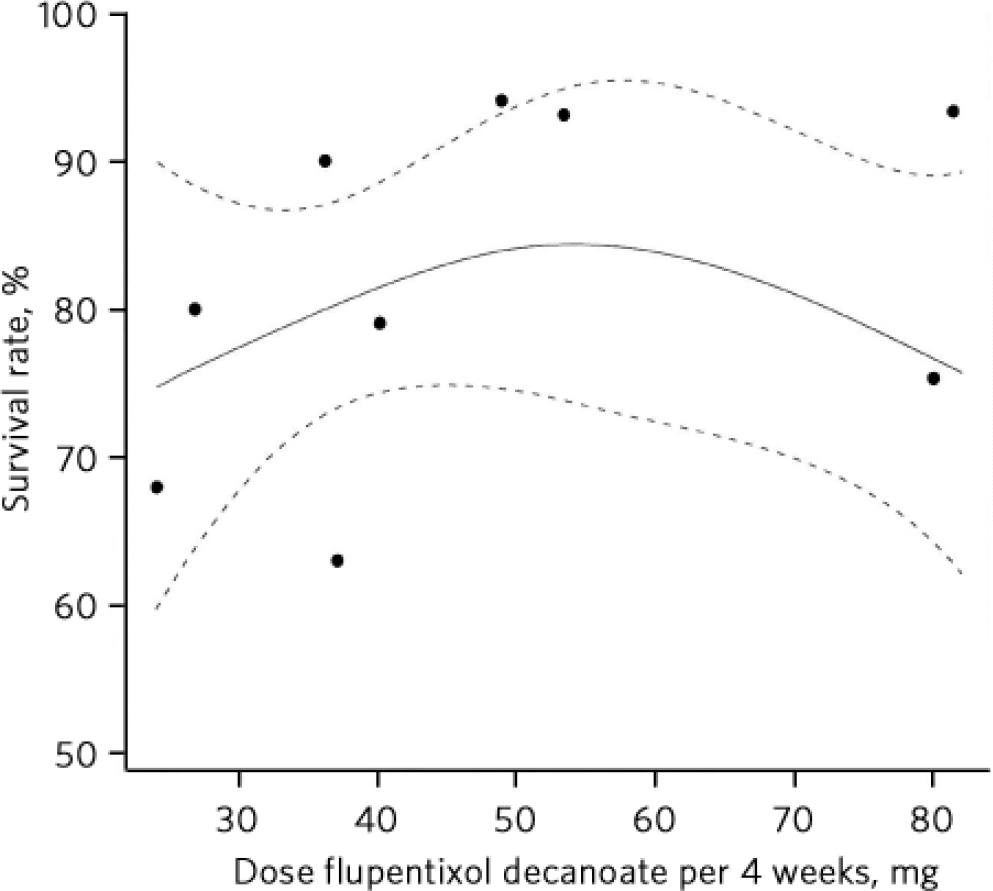
A dose-response curve was calculated for the remaining studies using the GAM method (Fig. 2). The level of uncertainty around the curve is shown by the dotted lines, which indicate two standard errors’ difference from the fitted curve. The best-fit curve is a gently arcing curve with a peak between 50 and 60 mg. However, the slope of the curve is shallow, suggesting modest effect of dose on survival rate. In addition, the uncertainty of the true shape of the curve is substantial. Nonetheless, there is no clear suggestion that doses of flupentixol decanoate higher than 50-60 mg every 4 weeks confer additional benefit.
Survival rates by dose of flupentixol decanoate, excluding the Cookson study, with the best fitting curve from the Generalised Additive Model shown with 95% confidence bands. Dotted lines represent the level of uncertainty.
Discussion
The results shown here should be interpreted with caution for a number of reasons. First, the studies were generally small in terms of number of patients: 3 of the 12 groups studied comprised fewer than 10 patients and the largest group comprised only 31 patients. This raises questions of potential selection bias and how representative these samples are of the patient population at large. Also, the small numbers used make estimates of the survival rates in several of the studies relatively imprecise. Nonetheless, these studies represent the best available data for exploring the issue of the effects of flupentixol decanoate dose on survival in schizophrenia.
A further confounding factor is that some of these studies allowed for the concomitant use of rescue medication, which might also have affected the outcomes.
The reporting of the results, including definition of relapse, varies between the studies, which is also likely to have affected the outcomes.
The survival rates of over 90% in some of these studies are very high for schizophrenia. Reference Leucht, Barnes, Kissling, Engel, Correll and Kane19 The three groups of patients with the highest survival rates (those in the Agrup-Andersson et al, Reference Agrup-Andersson, Bengtsson, Erlandsson, Gottfries and Witzell-Ostlund11 Kelly et al Reference Kelly, Freeman, Banning and Schiff12 and Pinto et al Reference Pinto, Banerjee and Ghosh13 studies) all used doses of around 50 mg flupentixol decanoate every 4 weeks. Interestingly, the sample from Pinto et al’s study, Reference Pinto, Banerjee and Ghosh13 as well as having the smallest relapse rate also had the longest follow-up. This suggests that flupentixol decanoate at modest dose can confer a good outcome for relatively long periods.
Johnson et al Reference Johnson, Ludlow, Street and Taylor17 also achieved a high survival rate in a group of patients whose mean dose of flupentixol decanoate was 36 mg every 4 weeks. The dose range in this group was 16-80 mg every 4 weeks. This is a wide range, which largely obscures any specific effect of dose. It does, however, suggest that in some patients relapse does not occur with doses even lower than 50 mg every 4 weeks. Certainly the patients in this group fared better than those in the comparison group who received a mean dose of 24 mg flupentixol decanoate every 4 weeks and experienced more than 3 times the relapse rate (32% v. 10%). This is a statistically significant difference.
Survival rates at higher doses
Two of the studies reviewed (Steinert et al Reference Steinert, Erba, Pugh, Robinson and Preist15 and Lundin et al Reference Lundin, Dencker and Malm18 ), like the Cookson Reference Cookson16 samples, showed a poorer survival rate despite higher doses. The reasons for this are not clear. The two samples do not appear to have had treatment-resistant schizophrenia. Lundin et al Reference Lundin, Dencker and Malm18 used a relatively high mean dose of 82 mg every 4 weeks. Also, the number of relapses in this study is reported only as a percentage rather than raw numbers. For this reason it is unclear as to whether this is an intention-to-treat analysis. Nine out of twenty-eight patients receiving flupentixol decanoate in this study were reported to have dropped out because of dissatisfaction with the prescribed medication, despite the investigators believing they had optimised dosage before study entry. The high drop-out rate suggests that tolerability was a problem in this study. The use of mean (rather than fixed) doses may again have obscured a true dose effect in this study.
The maximal survival rate at around 50-60 mg every 4 weeks is in marked contrast to the licensed 20 maximal dose of 400 mg every week (equivalent to 1600 mg every 4 weeks) for flupentixol decanoate. It is also towards the lower end of the range recommended by other research and guidelines. Reference Taylor4,Reference Taylor, Paton and Kapur21,Reference Gardner, Andrea, Murphy, O'Donnell, Centorrino and Ross22
Reports of actual dosage prescribed are even higher. For example, Taylor Reference Taylor4 reports a typical dose of flupentixol decanoate of 60 mg every 2 weeks, whereas in a large UK survey, Barnes et al Reference Barnes, Shingleton-Smith and Paton2 found an even higher median dose of 50 mg every week. These doses are considerably higher than the dose at which our curve peaked.
It is of course possible that increasing dose may confer a poorer outcome. The data presented here cannot confirm or refute this. Poorer response rates at higher doses have been suggested in other studies of conventional antipsychotics. Reference Geddes, Freemantle, Harrison and Bebbington23
Survival rates at lower doses
The situation for lower doses is also uncertain. The shape of the curve is compatible with increased relapse rates with lower dosage. However, the results are conflicting, with the Johnson et al Reference Johnson, Ludlow, Street and Taylor17 study showing good survival at a mean dose of 36 mg every 4 weeks, whereas Wistedt et al Reference Wistedt, Jorgensen and Wiles14 found a much higher relapse rate at a similar (mean 33 mg every 4 weeks) dosage. Kelly et al Reference Kelly, Freeman, Banning and Schiff12 found a good survival rate in their patients with a fixed dose of 20 mg every 3 weeks. Given that they also studied consecutive out-patients, the risk of selection bias might be lower in this study and the results more reliable.
The lowest effective dose in our review is 20 mg flupentixol decanoate every 3 weeks, with an impressive survival rate of 80%. Reference Kelly, Freeman, Banning and Schiff12 The one group of patients where the mean dose was lower was the low-dose group in the Johnson et al Reference Johnson, Ludlow, Street and Taylor17 study (average 18 mg every 3 weeks). As some of these patients would have received much less than the 20 mg every 3 weeks received in the Kelly et al Reference Kelly, Freeman, Banning and Schiff12 study, this might explain the worse outcome. Agrup-Andersson et al Reference Agrup-Andersson, Bengtsson, Erlandsson, Gottfries and Witzell-Ostlund11 also found higher relapse rates in their lower-dose group (mean 21.4 mg every 4 weeks), although this was not statistically significant.
All this suggests that doses lower than 20 mg every 3 weeks are likely to be too low for most patients.
Studies of other depot antipsychotic drugs using similar methods have also indicated maximal survival rates at modest dosage. Taylor Reference Taylor8 estimated a near-maximal response to haloperidol decanoate at 100 mg every 4 weeks. Davis & Chen Reference Davis and Chen24 estimated that the near-maximal effect of fluphenazine decanoate was achieved at a dose of 25 mg every 4 weeks. Neither study, however, suggested reduced benefits with higher doses. Using the British National Formulary dose equivalence table, 20 the dose equivalents of flupentixol decanoate from the Taylor study is 80 mg every 4 weeks and for the Davis & Chen study it is 40 mg every 4 weeks.
Overall, it would be unwise to draw too many conclusions from the data presented here because of the heterogeneity between studies, the small samples and the uncertainty around the true shape of the curve. Also, the data represent the outcomes of groups of patients rather than individuals, whereas the effect of dose is likely to vary between individual patients. The data presented here cannot determine the dose requirement of an individual patient. On the other hand, the data offer no support for increased benefit above doses of 50-60 mg every 4 weeks. Data also suggest that it is likely that lower doses may be effective for some patients.


 Open access
eLetters
No eLetters have been published for this article.