


Introduction
Bovine lactation is characterized by substantial milk production over a prolonged period and has been extensively researched, leading to a broad understanding of milk synthesis regulation in the bovine mammary gland. Milk production is an integrative response to the functional interaction of many cell types in the bovine mammary gland supporting milk synthesis including secretory mammary epithelial cells (MEC), myoepithelial cells, adipocytes, fibroblasts, endothelial cells, and immune cells. Milk also contains cells that originate from the mammary gland and together with immune cells are referred to as milk somatic cells (SCs). The SCs found in milk primarily consist of immune cells (Sharma et al. Reference Sharma, Singh and Bhadwal2011) and secretory MEC (Boutinaud and Jammes Reference Boutinaud and Jammes2002b).
The characterization of specific molecular mechanisms within cell subpopulations has been challenging due to technology limitations. Moreover, the difficulty of cell identification is further exacerbated when dealing with uncommon cell subpopulations. However, in recent years, advances in molecular technologies have facilitated the identification of numerous cell types within immune and epithelial cells present in human and bovine milk (Becker et al. Reference Becker, Weikard and Hadlich2021; Gleeson et al. Reference Gleeson, Chaudhary and Fein2022). The diverse range of cell subtypes present within these two primary subpopulations in milk makes milk a valuable and easily accessible sample source for gaining insight into fundamental aspects of lactation. This noninvasive approach allows for the examination of molecular and cellular features, providing a deeper understanding of the intricate processes occurring in the mammary gland (Martin Carli et al. Reference Martin Carli, Trahan and Jones2020). As a result, the utilization of milk samples for investigating and elucidating the mechanisms occurring in the mammary gland has gained significant relevance. Still, SCs found in bovine milk exhibit complex heterogeneity which hinders the precise delineation of individual cell type functionality and their roles within a heterogeneous group.
Technologies such as fluorescence-activated cell sorting (FACS) and RNA sequencing help address the challenges posed by cell heterogeneity (Chattopadhyay et al. Reference Chattopadhyay, Gierahn and Roederer2014). However, these technologies have limitations including limits on the number of subpopulations that can be identified and the dilution of rare cell types in a bulk gene expression pattern reducing the complexity and diversity of cell heterogeneity. Recently, the development of new research technologies such as single-cell RNA sequencing (scRNA-seq) with the capacity to identify low abundance cell types and compare the transcriptome profile of individual cells within a heterogeneous sample has facilitated tracing molecular identities at the individual cell level (Papalexi and Satija Reference Papalexi and Satija2018; Villani et al. Reference Villani, Satija and Reynolds2017). The objective of this preliminary study was to identify and recognize the functional diversity of MEC and immune cell populations in milk from healthy Holstein cows using scRNA-seq technologies.
Materials and methods
Experimental design
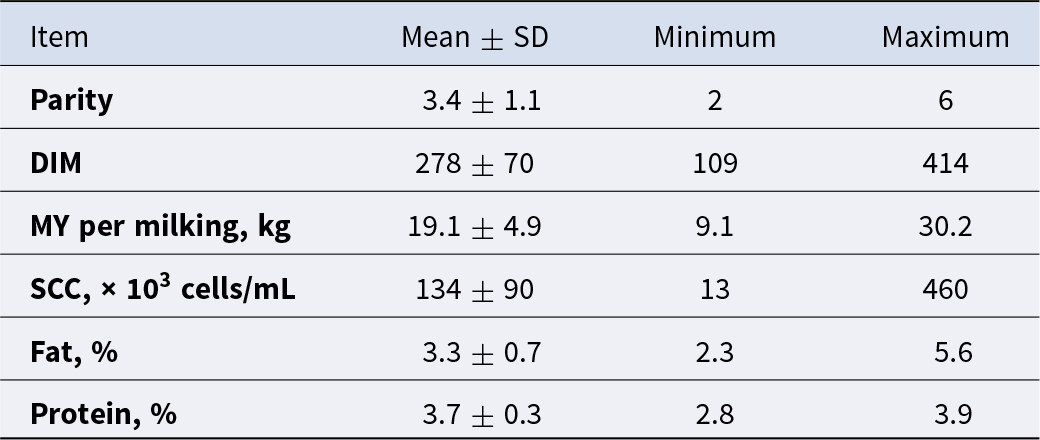
The use of animals and all procedures for this investigation were approved by the Virginia Tech Institutional Animal Care and Use Committee (21-220). Twenty-five healthy Holstein cows across different parities, lactation stages, milk yields (MYs), and pregnancy statuses were used in the experiment. These cows were used to identify a subset of cows to select for cell isolation. Specific details regarding characteristics of these animals are presented in Table 1. Throughout the experiment, cows remained in the main milking dairy herd and were housed in a sand-bedded free-stall barn at the Virginia Tech Dairy Science Complex – Kentland Farm (Blacksburg, VA). Cows were milked twice daily at 0100 and 1300 h, and MYs were recorded at the morning milking. Cows had ad libitum access to a total mixed ration balanced for milk production and composition. Cows were fed once daily (0800–1000 h) and had free access to clean water at all times. Milk samples were collected between February and July 2022.
Descriptive statistics of parity, days in milk, milk yield and milk components of lactating Holstein cows (n = 25) sampled for milk analysis and cell characterization using flow cytometry
Flow cytometry and FACS
On the day prior to milk sample collection, we assessed each cow’s health status using farm records (PCDART Software; available from Dairy Records Management Systems, Raleigh, NC). Criteria included no reported health issues, no presence of mastitis, somatic cell counts (SCCs) <200,000 cells/mL on the most recent DHIA test day, and consistent daily milk production over the past week. On a collection day, individual representative samples (3.8 L) from two to four eligible cows were collected at the morning milking. A milk subsample from each cow (35 mL) was sent to Lancaster Dairy Herd Improvement Association (Mannheim, PA) and analyzed for SCC, fat, protein, and solids (CombiFoss™ 7, Foss North America). Milk samples (n = 25) were processed in the laboratory for milk cell isolation following a previously established protocol (Lengi et al. Reference Lengi, Makris and Corl2021). Briefly, milk samples (3.8 L) containing a final concentration of 0.5 mM ethylenediaminetetraacetic acid (EDTA) were placed into conical containers (500 mL) and centrifuged (850 × g for 10 min) to pellet total cells present in milk. During each centrifugation step, the supernatant milk was discarded, and another 500 mL portion was added to the existing pellet. This process was repeated until the complete 3.8 L of milk were processed. This method ensured that the entire volume of milk was utilized to concentrate all cells into a single pellet for subsequent analysis.
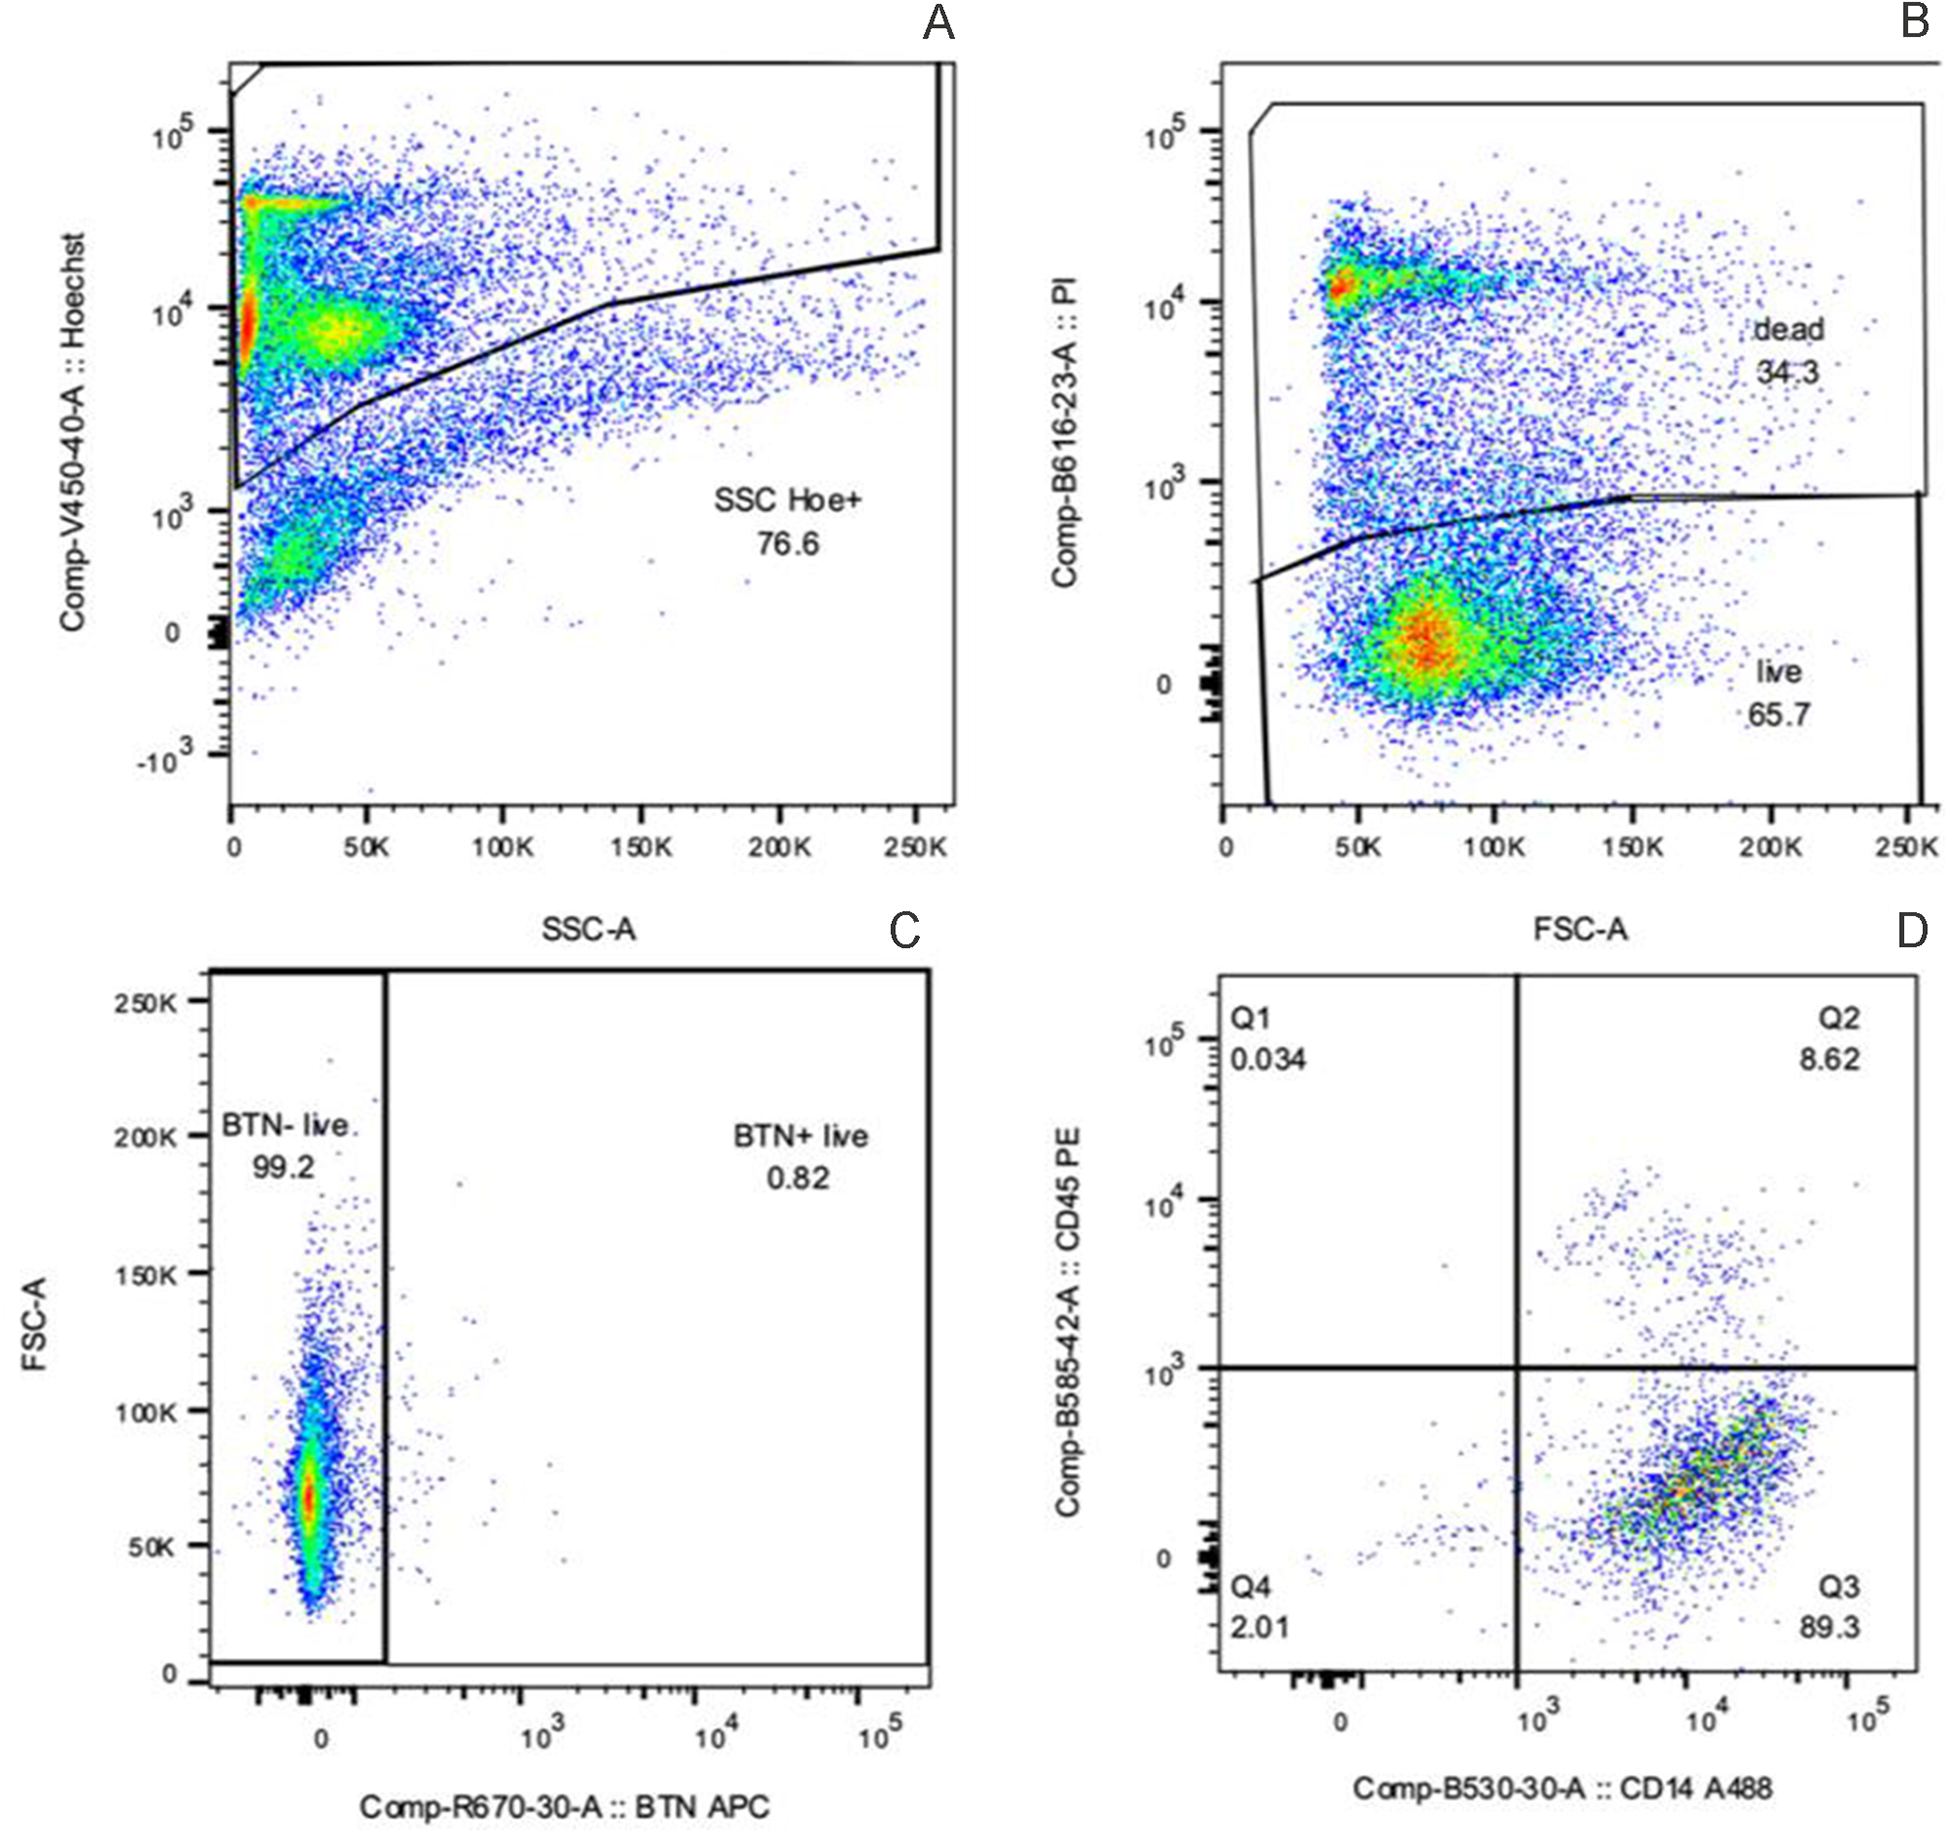
The pellet was washed once with Dulbecco’s phosphate-buffered saline and EDTA (0.5 mM final concentration), centrifuged, resuspended in red blood cell lysis buffer (154 mM NH4Cl, 10 mM KHCO3, 0.1 mM EDTA) for 15 min, and filtered through 100- and 40-µm sterile cell strainers (Genesee Scientific, El Cajon, CA) to remove noncellular debris. Total cell number was evaluated in each sample using a hemocytometer and samples were standardized to contain 2 × 10⁶ and 2 × 10⁷ cells for flow cytometry and FACS analysis, respectively. To label individual cells, we simultaneously incubated primary antibodies for hematopoietic cell surface protein (CD45 mouse IgG2a clone CACTB51A, Kingfisher Biotech, St. Paul, MN, 3.1 ng/µL), macrophages (CD14 mouse IgG1 clone CAM 36A, Kingfisher Biotech, 1.25 ng/µL), and MEC (Butyrophilin 1A1 (BTN), rabbit clone 2151C conjugated to APC, NOVUS Biologicals, Centennial, CO, 7 ng/µL) for 1 h at room temperature and protected from light. Sequentially, secondary antibodies used were rat anti-mouse IgG2a-phycoerythrin ([PE] clone SB84a, Southern Biotech Associates, Birmingham, AL, 1.0 ng/µL) and goat anti-mouse IgG1-AlexaFluor 488 ([AF488], polyclonal, Southern Biotech Associates, 1.25 ng/µL). Secondary antibodies were incubated for 1 h at room temperature. Lastly, cell viability was determined using propidium iodide (PI; BD Biosciences, San Jose, CA, 5 µg/mL) dye, and Hoechst 33342 (Invitrogen, Carlsbad, CA, 10 µg/mL) was used as a nucleic acid stain (Fig. 1). Cells were washed between antibody incubations, centrifuged at 850 × g for 10 min, and resuspended in Hoechst and PI for 60 min. After a final wash, cells were resuspended in 100 or 1,000 µL of Cell Staining Buffer (BD Bioscience) and examined by flow cytometry or sorted by FACS, respectively. Flow cytometry analyses and FACS were performed on a BD FACSAria Fusion (BD Biosciences) using FACSDiva software (BD Biosciences). Side scatter (SSC) and forward scatter thresholds were carefully established to exclude cellular debris and aggregates from analysis. Gating parameters were maintained across all samples to ensure consistency, allowing for minor adjustments for SSC variability. After initial gating based on morphology, nucleated cells were selected and further refined to identify PI-positive populations. Subpopulations were then identified by gating on cells labeled with CD45-PE, CD14-AF488, and BTN-APC (Fig. 1).
Representative flow cytometry dot plots showing sequential gating and staining of nucleated cells: Hoechst 33342 for nucleated cell selection (A), propidium iodide (PI) for viability assessment (B), BTN staining with APC (C), and dual staining for immune markers CD45 (PE) and CD14 (Alexa 488; D).
Using preliminary data, we estimated that >65% of SCs have a hematopoietic origin (CD45+) and 1.5% are secretory MEC (BTN+). Based on this information, we selected 5 cows from the base population of 25 that consistently exhibited higher proportions of BTN+ cells for cell isolation using FACS. This selection was intended to reduce the time and cell stress resulting from cell sorting of BTN+ cells. Sorted samples were used for scRNA-seq analysis. Sample inclusion for scRNA-seq analysis was based on cell composition consistency and the prevalence of BTN+ cells.
Statistical analysis
Descriptive statistics were calculated using the dplyr (Version 1.1.4) and psych (Version 2.4.6.26) packages in R software (Version 2024.09.0+375). Results are presented as mean ± standard deviation (SD).
Single-cell RNA library construction
A total of 6,399, 15,529, and 11,592 live (PI−) MEC cells (BTN+CD14−CD45−, BTN+CD14+CD45−, BTN−CD14+CD45−) and 303,813 and 600,000 live (PI−) immune cells (BTN-CD14-CD45+) were obtained after sorting. Sorted cells, obtained approximately 12 h after sampling, were prepared for further scRNA-seq library preparation following the manufacturer’s instructions (Chromium Next GEM Single Cell 3ʹ Low Throughput, 10X Genomics, Pleasanton, CA, USA). Briefly, immune and MEC live sorted cells from individual samples were diluted in resuspension buffer to achieve a concentration of 100−600 cells/µL for downstream analysis. Cell suspension was loaded into a master mix containing reverse transcription reagent B, template switch oligo, reducing agent B, and reverse transcription enzyme C plus nuclease-free water with a targeted cell recovery after sequencing for all samples from 500 to 1,000 cells (1,000 cells being the maximum cell number allowed per library). For library preparation, cell suspension, barcoded gel beads with oligonucleotides, and partitioning oil were loaded into a 10X Chromium Next GEM Chip L (10X Genomics) and combined in the Chromium Controller (10X Genomics; https://www.10xgenomics.com/instruments/chromium-controller). Using a microfluidics-based method, single-cell gel beads-in-emulsions (GEM) were generated. After GEM generation, the gel bead was dissolved, releasing primers and lysing the cells that were partitioned together within each GEM. Within each GEM and for each sample, polyadenylated mRNA was reverse transcribed into cDNA. The resulting cDNA was amplified for a total of 12 cycles (98°C for 3 min, 98°C for 3 s, 63°C for 20 s and 72°C for 1 min). Post cDNA amplification, cDNA concentration and sample quality were assessed using an Agilent TapeStation (High Sensitivity D5000). A fraction (10 µL) of the amplified and cleaned cDNA was fragmented using fragmentation buffer, fragmentation enzyme, and buffer EB, and incubated at 32°C for 5 min, at 65°C for 30 min, and kept at 4°C until further analysis. Adaptor ligation used ligation buffer, DNA ligase, and adaptor oligos, followed by a 30°C incubation for 30 min. After post-ligation clean up (SPRIselect, Beckman Coulter, IN, USA), individual sample index sets (Dual Index Plate TT Set A, 10X Genomics) were added and incubated for 10−12 cycles depending on cDNA input (150−1000 ng) for 45 s at 98°C, 20 s at 98°C, 30 s at 54°C, and 20 s at 72°C. The resulting cDNA sequencing libraries were evaluated for DNA concentration and fragment size using high-sensitivity Agilent TapeStation (D5000) analysis, ensuring that DNA fragment peaks were between 240 and 460 bp.
scRNA-seq and bioinformatics analysis
Individual sequencing libraries were sent to Novogene Sequencing Center for paired-end sequencing on an Ilumina HiSeq 6000 platform system (Novogene, Sacramento, CA, USA) using one lane per sample. The sequenced reads were processed and analyzed using the Cell Ranger pipeline v7.0.0 by 10X Genomics, as described in Zheng et al. (Reference Zheng, Terry and Belgrader2017). In summary, sequenced reads were demultiplexed, cell-barcode sequences corrected, and the FASTQ files were aligned to the Bos Taurus ARS-UCD1.2 genome using the default parameters and the Spliced Transcripts Alignment to a Reference (STAR; Du et al. Reference Du, Huang and Arisdakessian2020) aligner, as implemented in the Cell Ranger count pipeline. Subsequently, unique molecular identifier (UMI) sequences were corrected to ensure unique read mapping, and cell barcodes were filtered to ensure data quality and reliability. Mapped sequences from each library were used for UMI counting. Reads generated by barcode-associated cells were quantified and used to establish a UMI count matrix. Due to the limited quantity of live MEC obtained from milk by FACS, we employed the aggregated pipeline from Cell Ranger by 10X Genomics to merge the data from three MEC libraries.
Data obtained from MEC (n = 3) and immune cell libraries (n = 2), were analyzed individually. To identify cell populations present in the datasets, we followed the scRNA-seq integration pipeline described by Stuart et al. (Reference Stuart, Butler and Hoffman2019) using the Seurat package (v. 4.3) from R (v. 4.2.2). The count matrix was converted to an object using the Seurat package for individual downstream dataset analysis following the recommended pipeline (Butler et al. Reference Butler, Hoffman and Smibert2018; Slovin et al. Reference Slovin, Carissimo, Panariello, Dipartimento Di Bioscienze and Biotecnologie2021). Briefly, the data were normalized and scaled according to quality control metrics to ensure robust dataset integrity. Cells with fewer than 100 detected genes and high mitochondrial gene expression (>5%) were filtered out to exclude low-quality cells.
Despite these efforts, the merged MEC libraries contained insufficient data quality due to the predominance of cells with low gene counts and elevated mitochondrial content, limiting the viability of scRNA-seq analysis using the Seurat package. Immune cell libraries retained sufficient data quality, allowing for successful downstream analysis. Following quality filtering, dimensionality reduction, clustering, and visualization were performed on immune cell libraries to elucidate immune cell subpopulations.
Results and discussion
Heterogeneity of cells in bovine milk samples identified by flow cytometry
The standard technique to study the bovine mammary gland, a heterogeneous organ, at the cell level is through mammary gland biopsies. Nevertheless, bovine mammary biopsies can introduce a variety of risks and pitfalls (i.e., pain and discomfort in the animal, post-biopsy infection, and tissue fibrosis in biopsy site, nonrepresentative sample of the gland). Recently, the use of noninvasive “milk liquid biopsies” that can be regularly obtained easily eliminate related surgical biopsy pitfalls and mimic the results obtained from mammary gland biopsies (Martin Carli et al. Reference Martin Carli, Trahan and Jones2020). The collection of SCs present in milk is composed of secretory and nonsecretory MEC and immune cells. It is known that secretory MEC in milk result from the desquamation of the epithelium of alveoli and ducts (Alhussien and Dang Reference Alhussien and Dang2018). In contrast, immune cells of a hematopoietic origin are white blood cells that surveil the mammary gland and enter in response to injury or infection (Boutinaud and Jammes Reference Boutinaud and Jammes2002a; Sharma et al. Reference Sharma, Singh and Bhadwal2011). Immune cells play a pivotal role in supporting milk production by maintaining gland health, whereas MEC are solely responsible for milk synthesis. These cells are extensively studied due to their significant impact on offspring nutrition and food production. The definition of the extended cell profile and transcript expression of the bovine mammary gland during lactation is essential for a better understanding of the factors determining milk production.
Fresh milk samples from 25 multiparous Holstein cows were sampled across 6 months. Descriptive statistics for the cows used for milk collection and milk sample characteristics are presented in Table 1. To evaluate heterogeneity of the SCs present in milk by flow cytometry, we used cell surface markers for secretory MEC (BTN), cells of hematopoietic origin (CD45), and macrophages (CD45 and CD14) that resulted in eight subpopulations (Table 2). Nucleated cells identified by Hoechst nucleic acid staining averaged 58.2 ± 24.4%. According to flow cytometry analysis, the overall average including both live and dead MEC, total immune cells, and macrophages observed in this study was 2.5 ± 4.4%, 56.6 ± 22.2%, and 8.6 ± 6.1%, respectively. As expected, the main cell type present in milk was live immune cells (CD45+) with 34.5 ± 20% of the total cells, while live MEC (BTN+CD45-CD14-) were 0.8 ± 3.5% of the total cells. The utilization of BTN, a protein involved in fat droplet secretion, ensured the isolation of only secretory MEC, excluding ductal epithelial cells, which are traditionally considered nonsecretory epithelial cells and therefore not expressing BTN due to lack of milk fat secretion. Additionally, we identified a cell population marked as BTN-CD14+CD45−, which was not classified by the available markers in this study. The CD14 transcript is recognized as a progenitor cell marker in MEC, supported by several studies in rodents and humans (Bach et al. Reference Bach, Pensa and Grzelak2017; García Solá et al. Reference García Solá, Stedile and Beckerman2021; Martin Carli et al. Reference Martin Carli, Trahan and Rudolph2021). The average cell yield was 152 × 106 cells/milking and the concentration was 8,389 cells/mL independent of cell type.
Descriptive statistics for cell subpopulations, expressed in percentage, yield and concentration of single nucleated live and dead cells present in milk from Holstein multiparous cows identified by flow cytometry
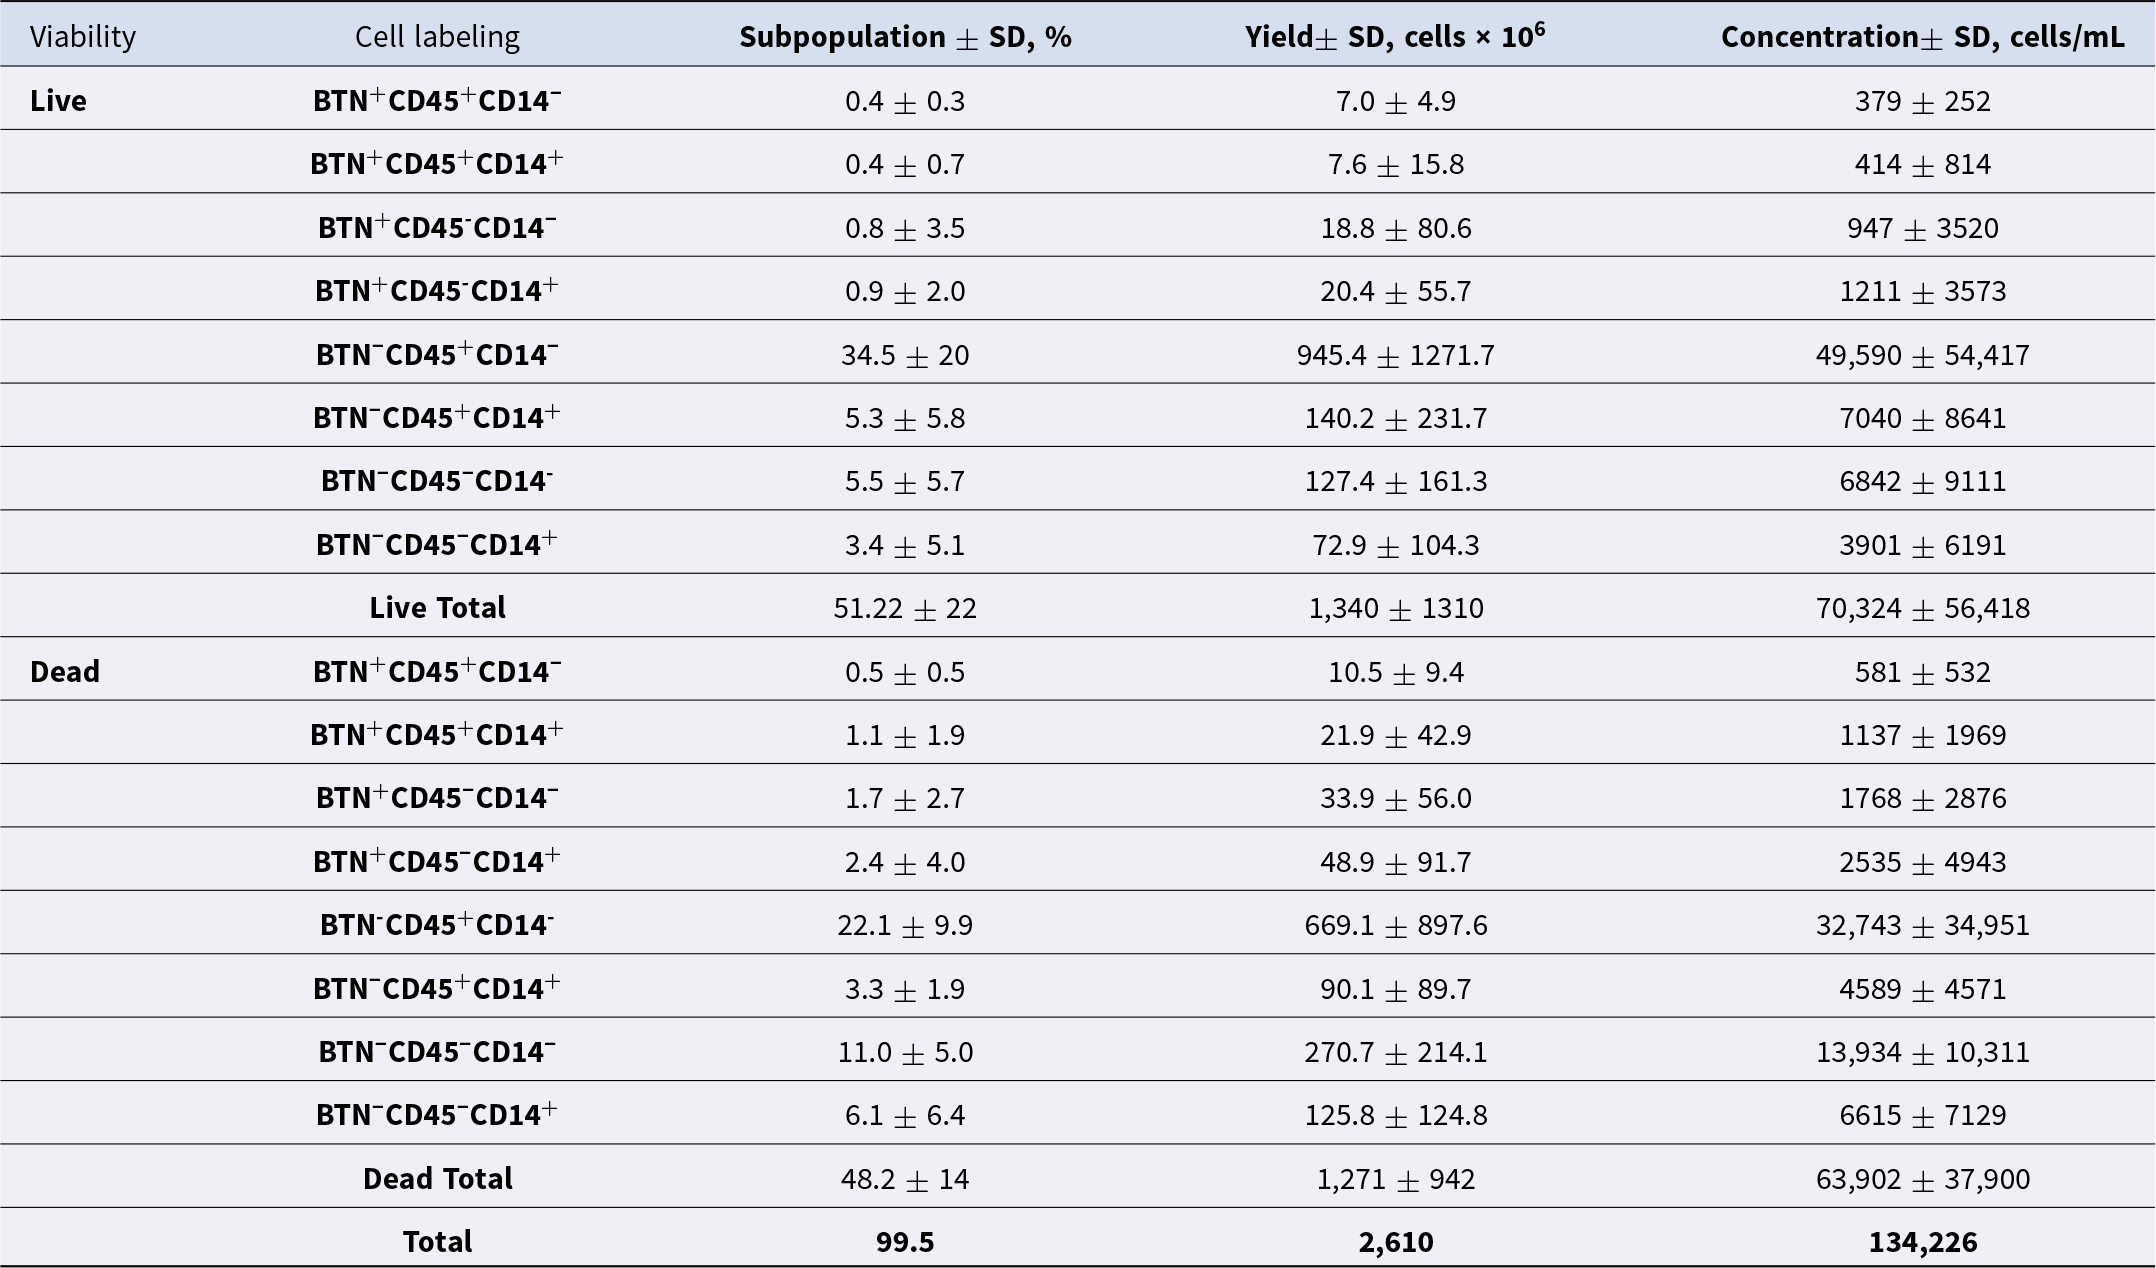
Note: Primary antibodies for immune cell surface protein (CD45), macrophages (CD14 and CD45), and mammary epithelial cells (Butyrophilin 1A1 (BTN) were used for cell labeling. Results are presented as mean ± standard deviation (SD).
The immune cell proportion within SCs observed in this study (64.4% live and dead CD45+) is notably lower compared to previous findings. Earlier reports indicated that 87% of SCs in milk samples from healthy Holstein cows (±100 × 103 SCC/mL) are immune cells. Of the total cells from hematopoietic origin, 42%, 11%, and 34% were granulocytes, lymphocytes, and monocytes, respectively (Koess and Hamann Reference Koess and Hamann2008). Similarly, macrophage percentages present in milk samples in this study were less than observed by De Matteis et al. (Reference De Matteis, Grandoni and Scatà2020) where milk samples from multiparous Holstein cows at 2 weeks postpartum contained 14.3% macrophages identified by flow cytometry ranging from 2.3% to 36%. On the other hand, the average of MEC observed in this study aligns with previous reports where live MEC in milk from healthy Holstein cows averaged 1.2% and were the least abundant of the SC types (Lengi et al. Reference Lengi, Makris and Corl2021).
Excluding the three main subpopulations identified in this study, 32.4% of remaining cells had an unidentified identity that expressed a combination of the cell surface markers suggesting potential heterogeneity within each subpopulation. However, due to technical capabilities such as wavelength overlap between available fluorescent dyes for flow cytometry, there is limited use of markers for subpopulation identification. To further explore cell identities within the main subpopulations identified by flow cytometry, milk samples from five cows were used for scRNA-seq analysis. Milk samples from three Holstein cows were used to assess the heterogeneity within the MEC (BTN+) sorted subpopulation. Additionally, samples from two Holstein cows were utilized to evaluate the heterogeneity within the sorted immune cell population expressing the CD45 marker.
Heterogeneity within MEC – BTN-positive cells
To complete single-cell analysis of MEC, fresh milk samples were obtained from three multiparous Holstein cows (2.7 ± 0.6 lactations), averaging 361 ± 46 days in milk (DIM), MY of 14.2 ± 4.7 kg/milking, and averaging an SCC of 115 ± 39 × 103 cells/mL (Table 3). Milk samples were processed and sorted by FACS using BTN as the cell surface marker for secretory MEC.
Descriptive statistics of parity, days in milk, milk yield and somatic cell count of Holstein cows sampled for milk analysis of mammary epithelial cells (MEC; n = 3) and immune cells (n = 2) using scRNA-seq
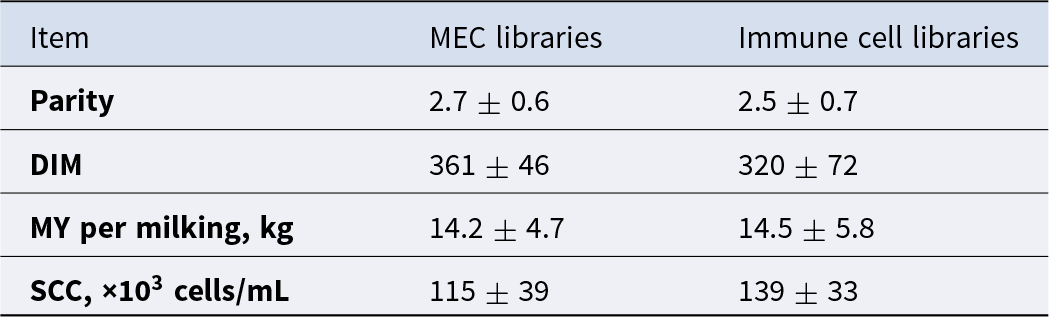
Results are presented as mean ± standard deviation (SD).
Sorted MEC (BTN+) were used to construct three individual sequencing libraries. Due to the use of a Low Throughput chip, which has a maximum target cell recovery of 1000 cells, we encountered challenges in obtaining high-quality data from the limited amount of MEC in bovine milk. Therefore, sequencing data from each library were combined and processed as a single dataset (n = 839 cells; data not shown). Following data quality assessment, cells with fewer genes and high mitochondrial gene expression were removed.
Analysis of the remaining cell population revealed minimal variability, with only one single-cell cluster and a low number of expressed transcripts (data not shown), which prevented further exploration. This lack of expression diversity and low transcript count limited clustering analysis, a critical step for identifying distinct cell states and functions within the MEC population. The MEC data lacked the resolution necessary to provide biologically meaningful insights into MEC heterogeneity, and the dataset was therefore excluded from downstream analyses.
The limited cell yields of sorted live MEC, attributable to the inherently low abundance of this cell type within milk samples, limited the comprehensive characterization of this population. Moreover, the quality of the sorted MEC in milk further complicates the analysis, requiring careful consideration for future studies that consider using this approach.
It is plausible, and possibly likely, that MEC shed in milk are no longer functional and may be undergoing cell death and detachment or cell death because of detachment. This would lead to cessation of new transcription and the onset of RNA degradation. The mammary epithelium is characterized by a bilayer hollow cavity enclosed by a basal membrane. The inner monolayer is formed by luminal cuboidal cells facing the central apical cavity and surrounded by an external basal monolayer of myoepithelial cells. If a cell is damaged, loses functionality, or is dying, it can be a threat to the tight barrier that epithelia form. To preserve the integrity of the MEC barrier, live or dying cells are apically or basally extruded in response to apoptotic stimuli or homeostasis regulation (Mleynek et al. Reference Mleynek, Redd and Chan2018; Slattum and Rosenblatt Reference Slattum and Rosenblatt2014). When cells are detached from the basement membrane and no longer have communication with the extracellular matrix and neighboring MEC, this produces an impairment of cell–matrix interaction and the loss of essential signals for survival leading the cells to a programmed cell death known as anoikis (Frisch and Francis Reference Frisch and Francis1994). Anoikis would result from detachment of viable epithelial cells from the basement membrane (Bretland et al. Reference Bretland, Lawry and Sharrard2001) and has been implicated in luminal clearance during mammary gland development in mice (Humphreys et al. Reference Humphreys, Krajewska and Krnacik1996). Nevertheless, the occurrence of this cell death type in the bovine mammary gland during lactation remains unexplored. Further investigation is needed to shed light on this aspect.
Although only live and viable MEC were used for library construction, the foundation of MEC sorting selection using FACS is based on membrane permeability and dye exclusion of PI. PI penetrates the cell membrane with loss of integrity, entering the cell nucleus and binding double-stranded nucleic acid, while intact membranes from viable cells prevent PI dye penetration and staining. While it has been reported that certain dyes may not effectively label early apoptotic cells (De Schutter et al. Reference De Schutter, Cappe and Wiernicki2021), there is no specific evidence of such limitations with PI. Additionally, it is important to note that not all cell death types described in the literature display membrane rupture as a characteristic feature, as there are over 20 different mechanisms of cell death documented (Galluzzi et al. Reference Galluzzi, Vitale and Aaronson2018). In fact, during apoptosis – the major form of programmed cell death described and studied – cell membrane integrity is retained, while non-apoptotic cell death like pyroptosis is mostly characterized by membrane rupture (Yan et al. Reference Yan, Elbadawi and Efferth2020; Zhang et al. Reference Zhang, Chen and Gueydan2018).
In this study, we encountered challenges in obtaining a substantial number of MEC from milk samples. To overcome these challenges and enhance the study of this specific cell type, future investigations could consider utilizing biopsy samples. Biopsy samples could be a better approach to increase availability of viable cells and possibly reduce the variability observed between animals and cell states. Furthermore, the use of functional secretory and viable MEC obtained through biopsies will enable the collection of a greater number of MEC for analysis. This approach will contribute to a deeper understanding of the heterogeneity of MEC in the bovine mammary gland and enhance our comprehension of milk synthesis capacity.
Heterogeneity within cells of hematopoietic origin – CD45-positive cells
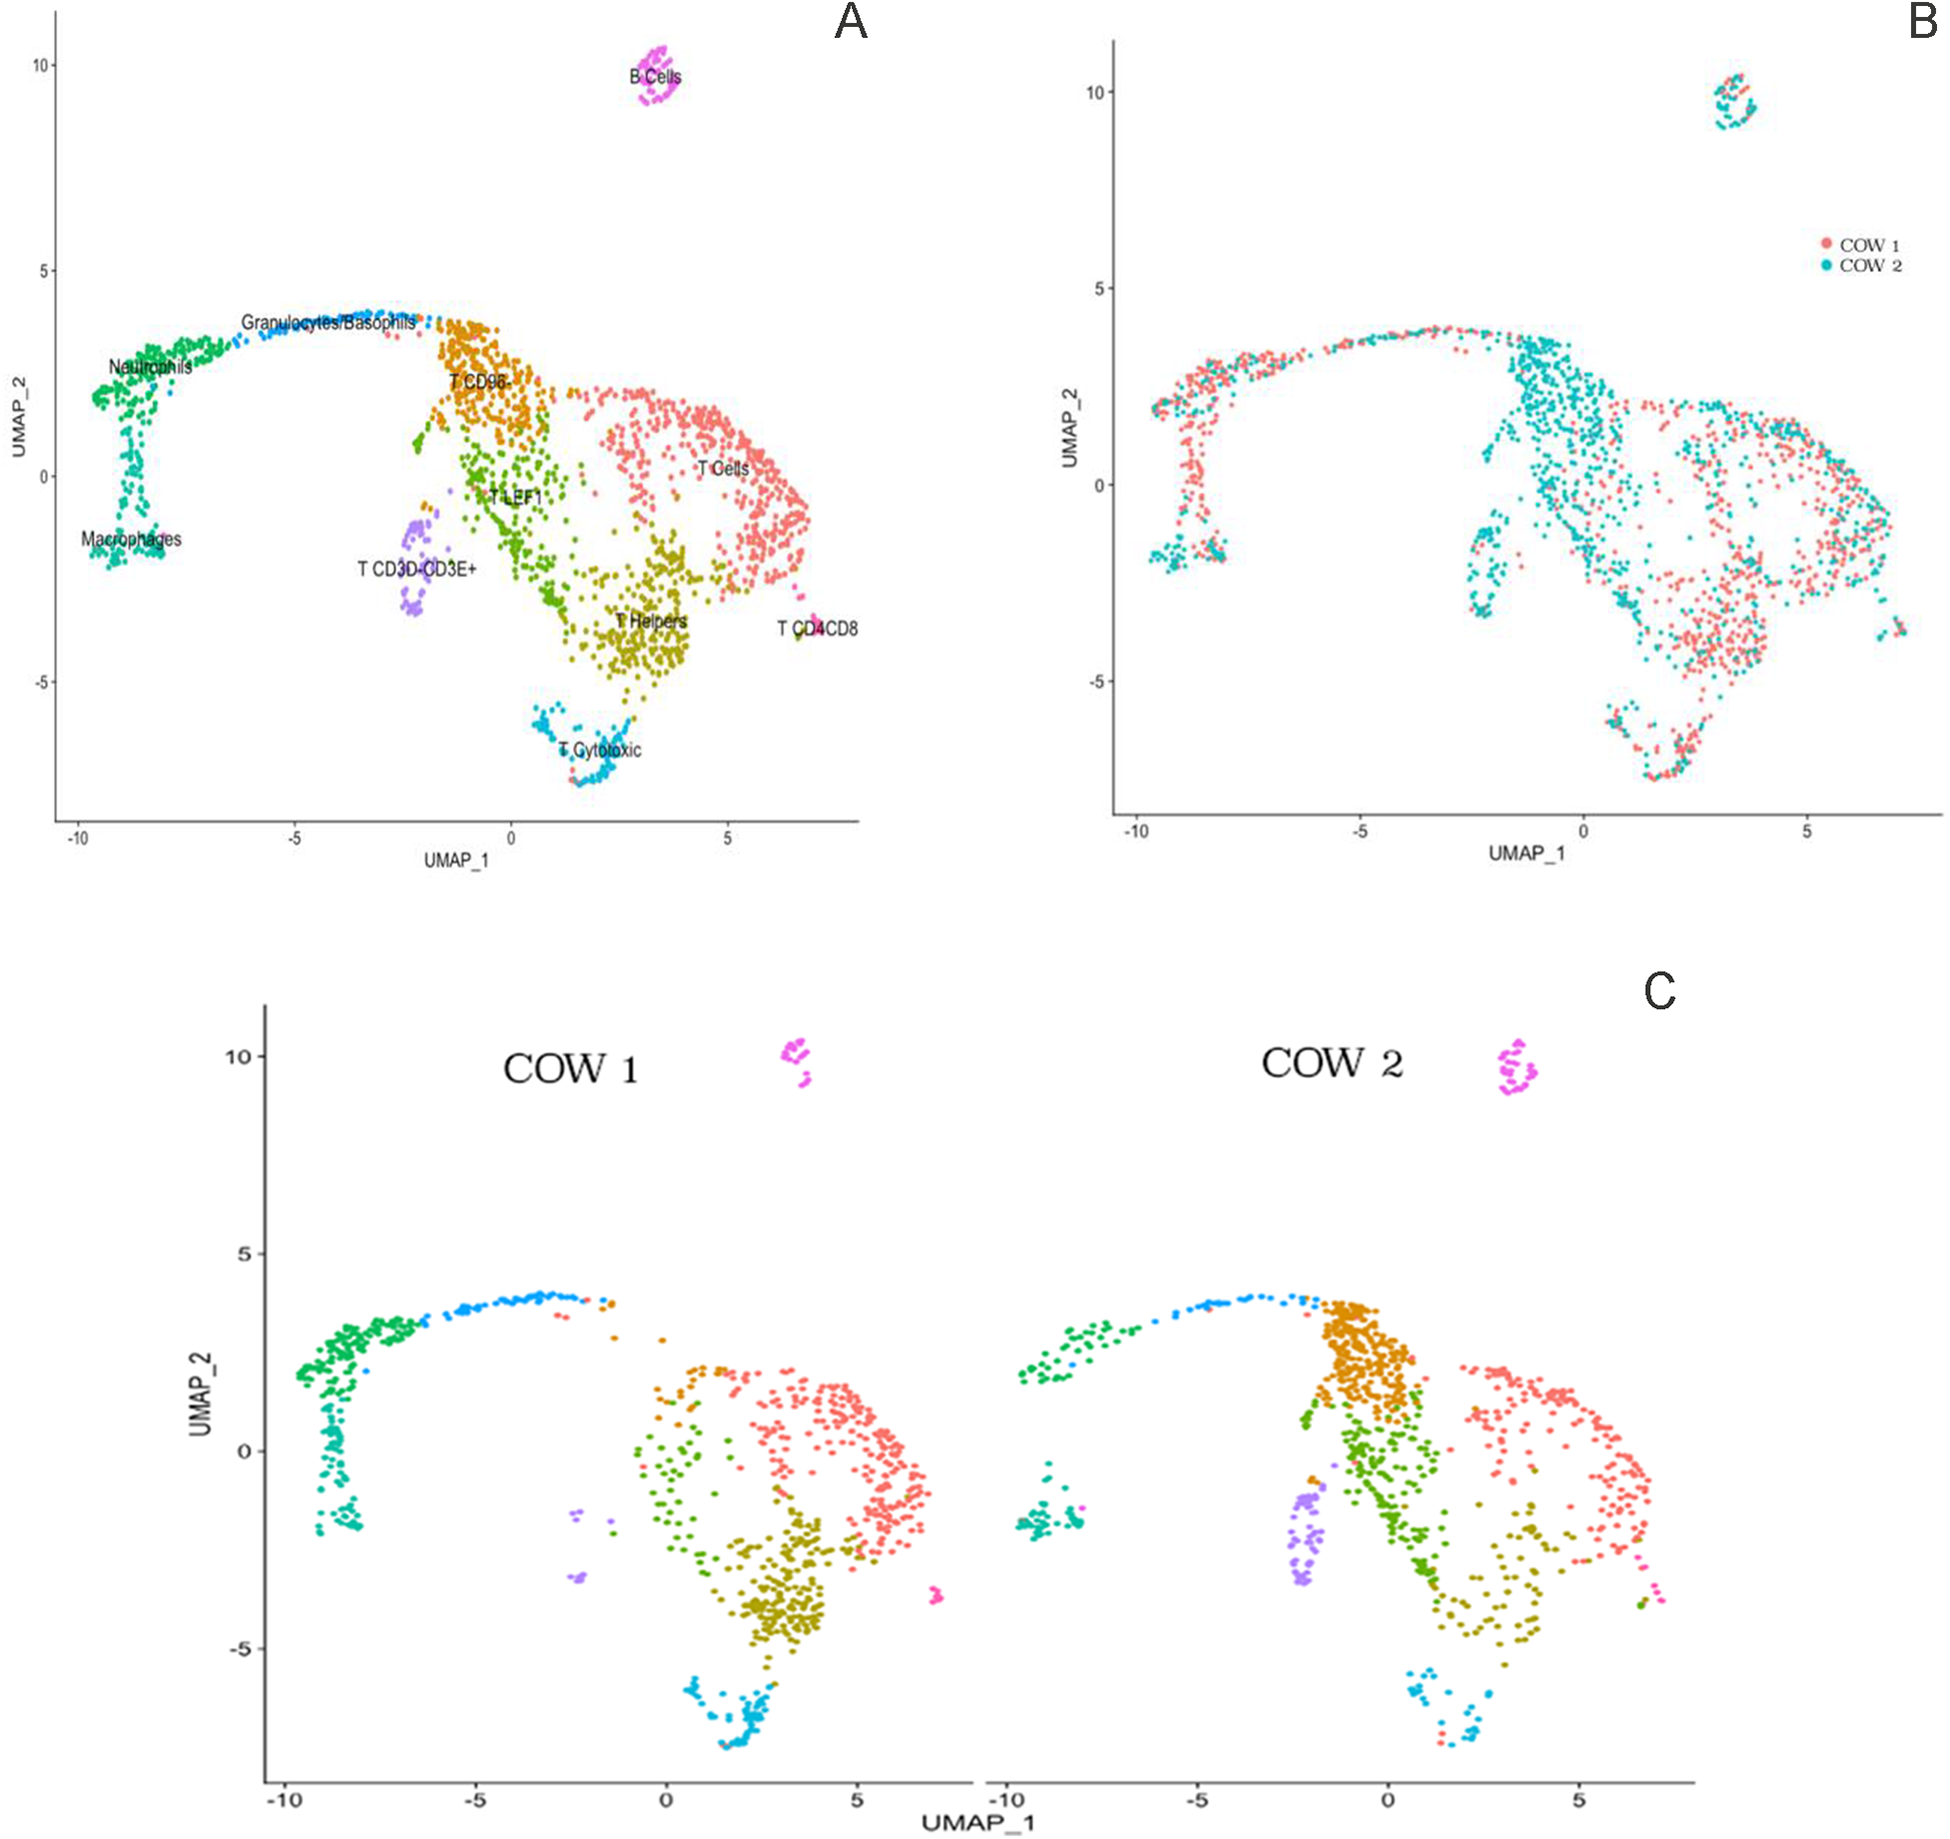
To address the molecular diversity within cells from hematopoietic origin, fresh milk samples were obtained from two Holstein multiparous cows averaging 2.5 ± 0.7 lactations, 320 ± 72 DIM, 14.5 ± 5.8 kg/milking at collection, and 139 ± 33 × 103 cells/mL (Table 3). Cells were sorted by FACS using the CD45+ cell surface marker. After sorting, individual libraries were sequenced, and individual data were integrated and analyzed as one dataset to explore the general heterogeneity within CD45+ cells following the integration method pipeline. The cluster analysis for the integrated data presented in Fig. 2A exhibited 11 distinct cell communities across both libraries. T cells were the most abundant cell type and depicted seven distinct types within the T cell subpopulation. The remaining four clusters were composed of granulocytes, including neutrophils, as well as macrophages and B cells. Integration analysis identified shared cell populations across sample sets; therefore both animals showed the same cell types. However, cell population proportion was different between them (Fig. 2B). As presented in the cluster graph per sample in Fig. 2C, cow one revealed a higher number of macrophages, neutrophils, CD4 helper T cells, and CD4 cytotoxic T cells, while cow two had a higher amount of T cells with low expression of CD96 and high expression of CD3E (Fig. 2C). To gain a deeper understanding of the heterogeneity observed between the two cows, we conducted a more detailed exploration of the immune cell heterogeneity within each milk sample.
Clustering of integrated immune cells in milk (A) from two Holstein cows (B) carried out using the uniform manifold approximation and projection (UMAP) dimension reduction technique. The total 1,774 immune divided into 11 clusters and differential clustering expression per cow (C). Cell proximity represents gene expression similarity and identification of cell types was completed by analyzing significantly enriched expression of established cell markers.
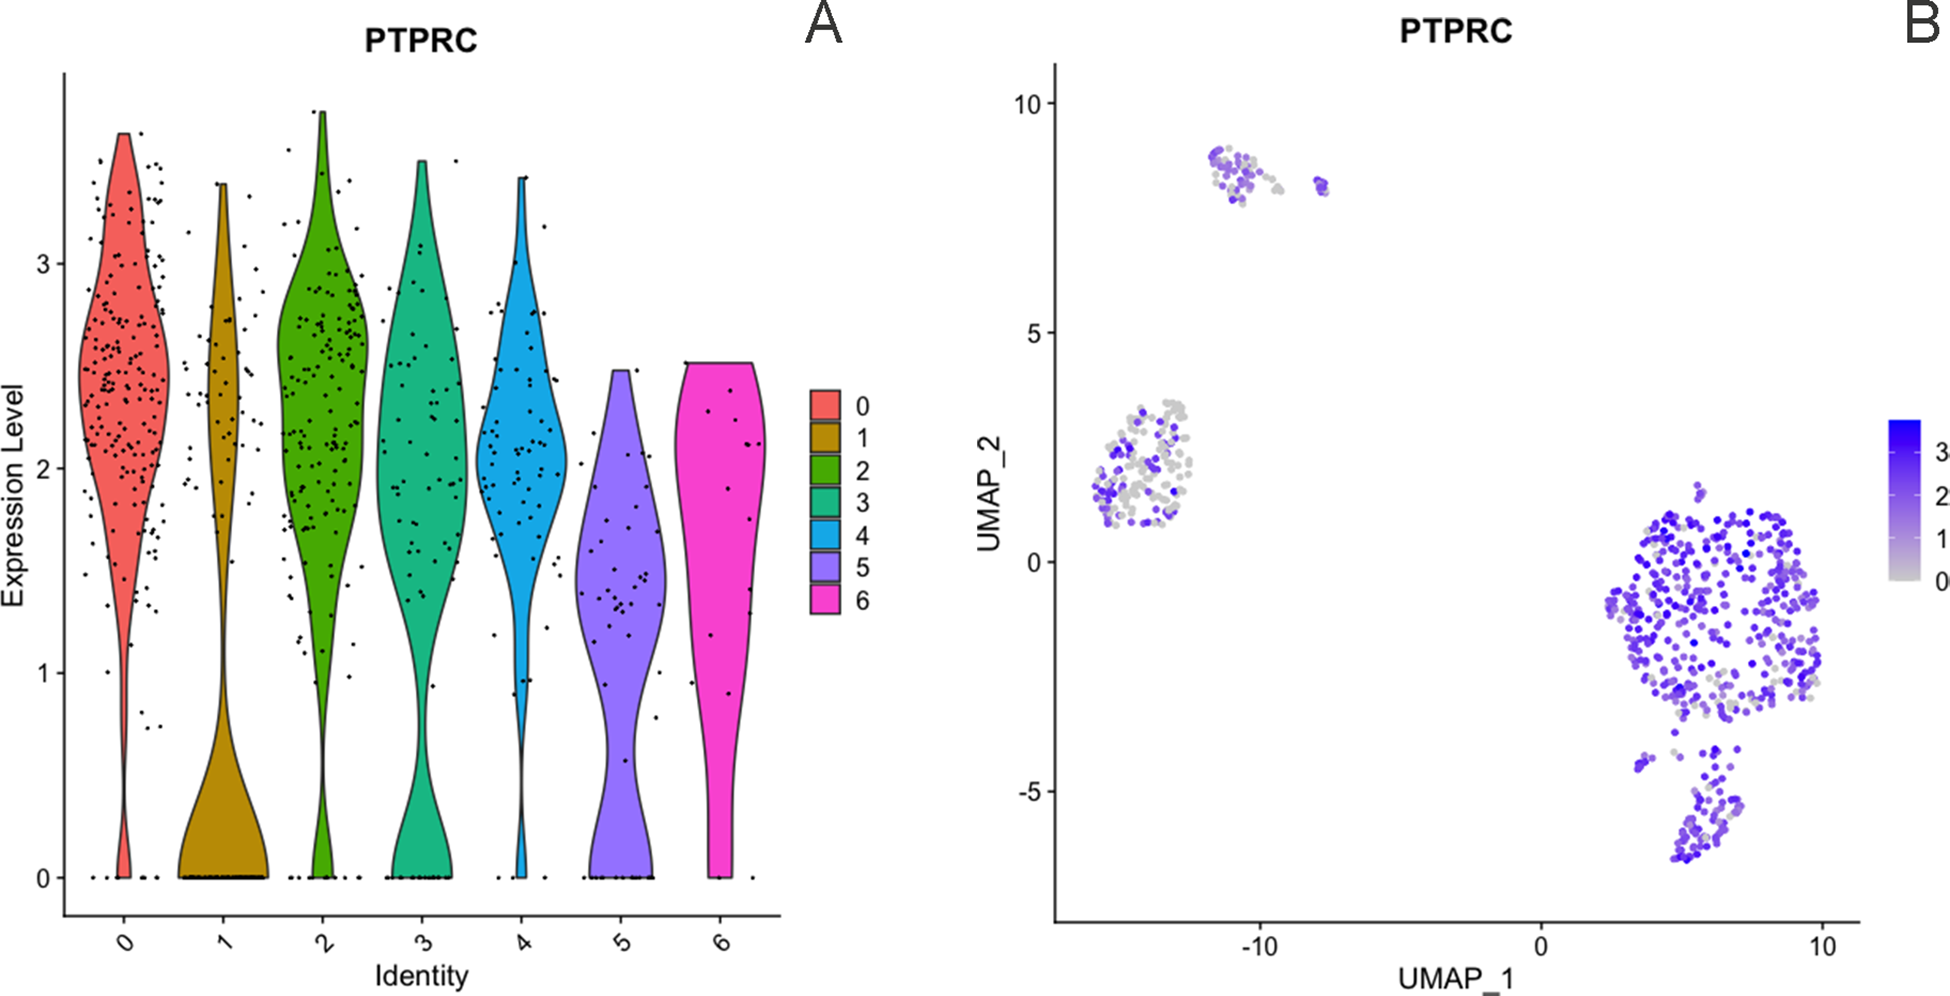
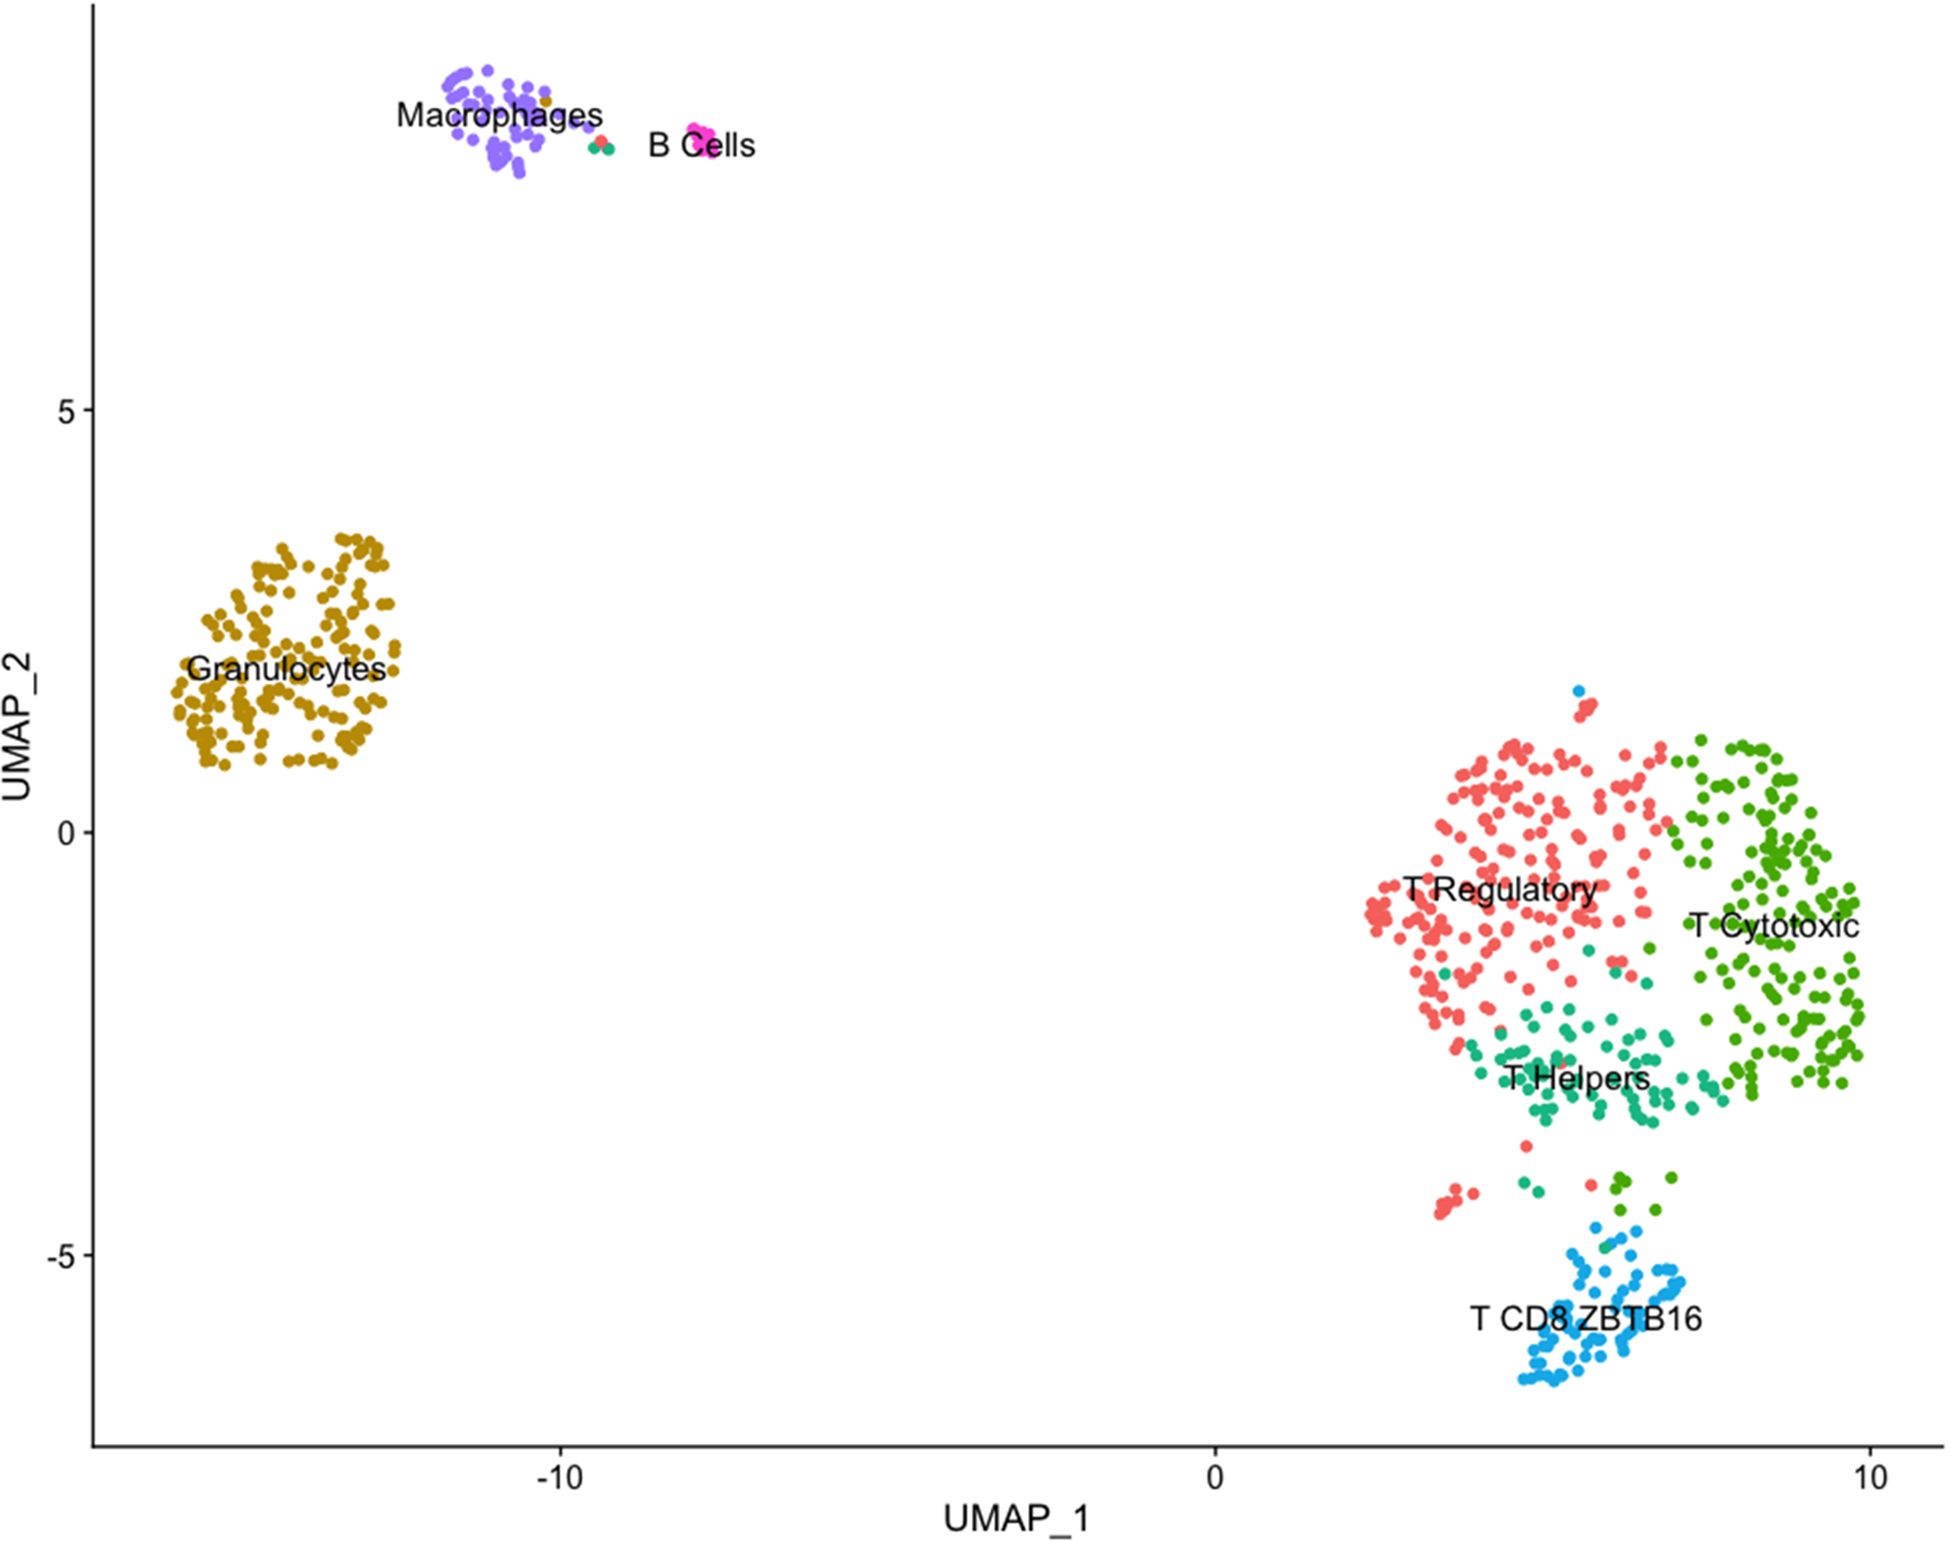
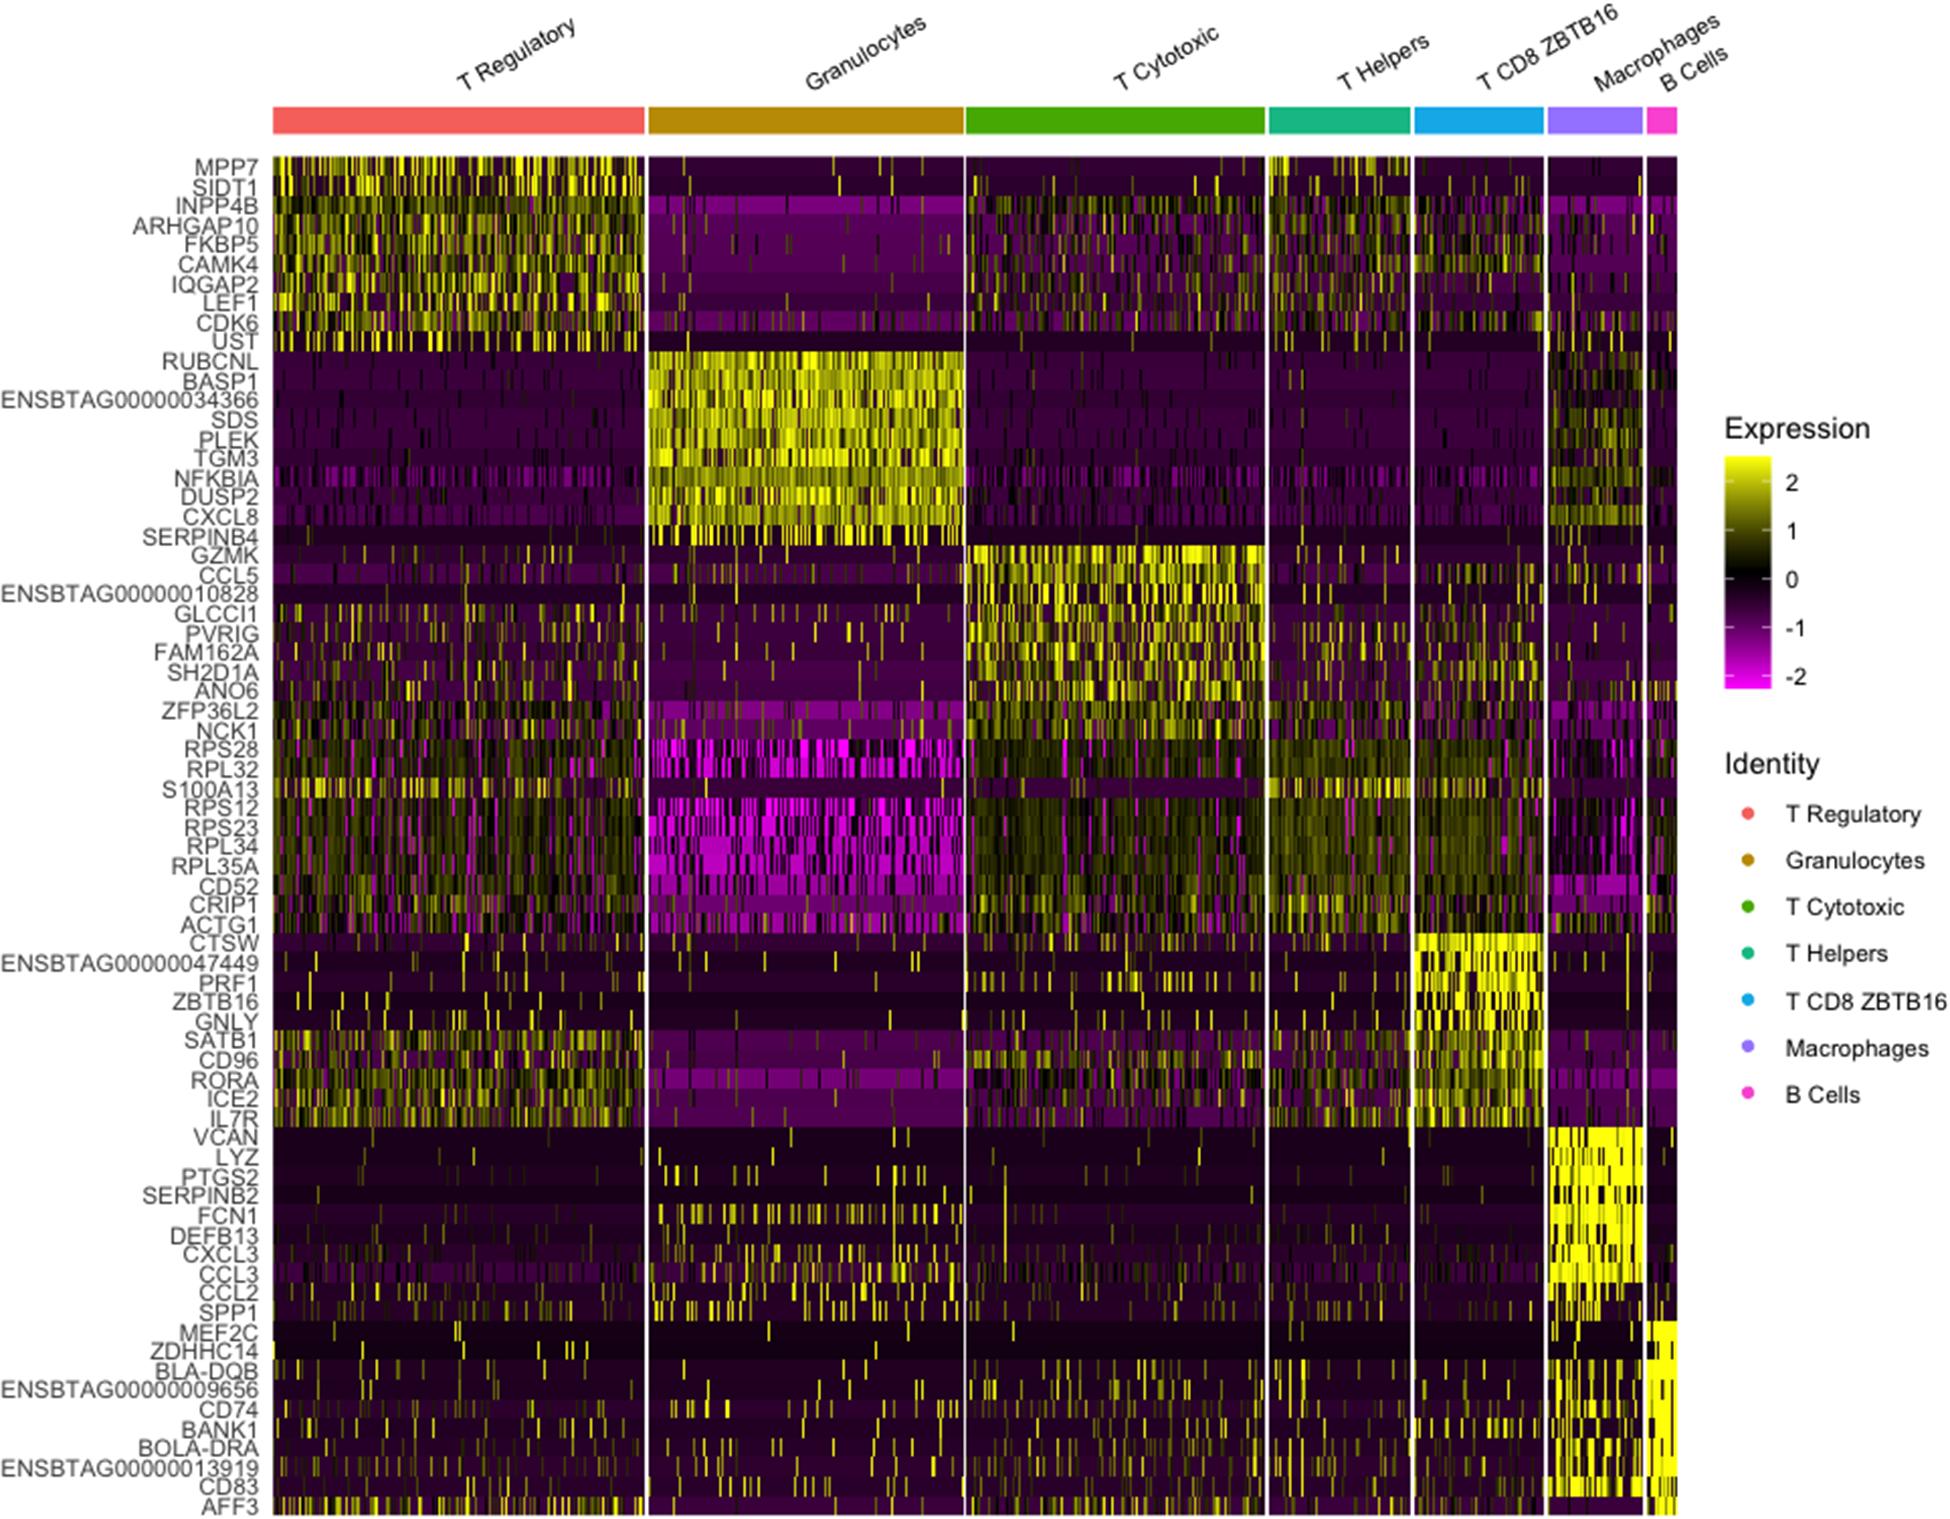
The dataset for Cow 1 included 851 cells with 12,156 features where seven clusters were identified. Initially, we conducted verification of the expression of the CD45+ marker, also known by its gene name PTPRC. This verification was completed using a violin plot and a feature plot (Fig. 3), which supported the accurate sorting of cells. After clustering analysis, seven distinct clusters were identified and are presented in Fig. 4. According to identified differentially expressed genes after heatmap analysis (Fig. 5) and the individual analysis of the main expression of canonical immune subpopulation markers (Fig. 6) reported in the literature (Azizi et al. Reference Azizi, Carr and Plitas2018; Becker et al. Reference Becker, Weikard and Hadlich2021), the putative cell subpopulations identified were granulocytes-expressing TLR4 and CD68 (22.8%), macrophages-expressing CD14 (6.9%), B cells-expressing CD19 and CD22 (2.1%), and T cells-expressing CD96, CD3E, and CD3D with four different identities: regulatory T cells-expressing CD4 and IL2RA (26.9%), cytotoxic T cells-expressing CD8A and CD8B (21.7%), helper T cells-expressing CD4 (10.2%), and a group of T cells-expressing CD8A, CD8B, and the ZBTB16 (9.4%).
Expression of immune marker PTPRC (CD45) across all clusters from dataset 1, including 851 cells, shown by violin plots (A) and feature plots (B) using the using the uniform manifold approximation and projection (UMAP).
Clustering immune cells in milk from one Holstein cow (dataset 1) using the uniform manifold approximation and projection (UMAP) dimension reduction technique. Note: The total 851 cells were divided into seven clusters. Cell proximity represents gene expression similarity and identification of cell types was accomplished by analyzing significantly enriched expression of established cell markers.
Heatmap of transcriptome similarities between cell clusters for dataset 1. Note: Rows represent representative genes and columns represent cell clusters. Numbers and colors on the right represent log2 fold changes relative to the median gene expression level across all clusters. Color scheme is based on z-score distribution from −2 (purple) to 2 (yellow). Right margin color bars highlight gene sets specific to the respective cluster.
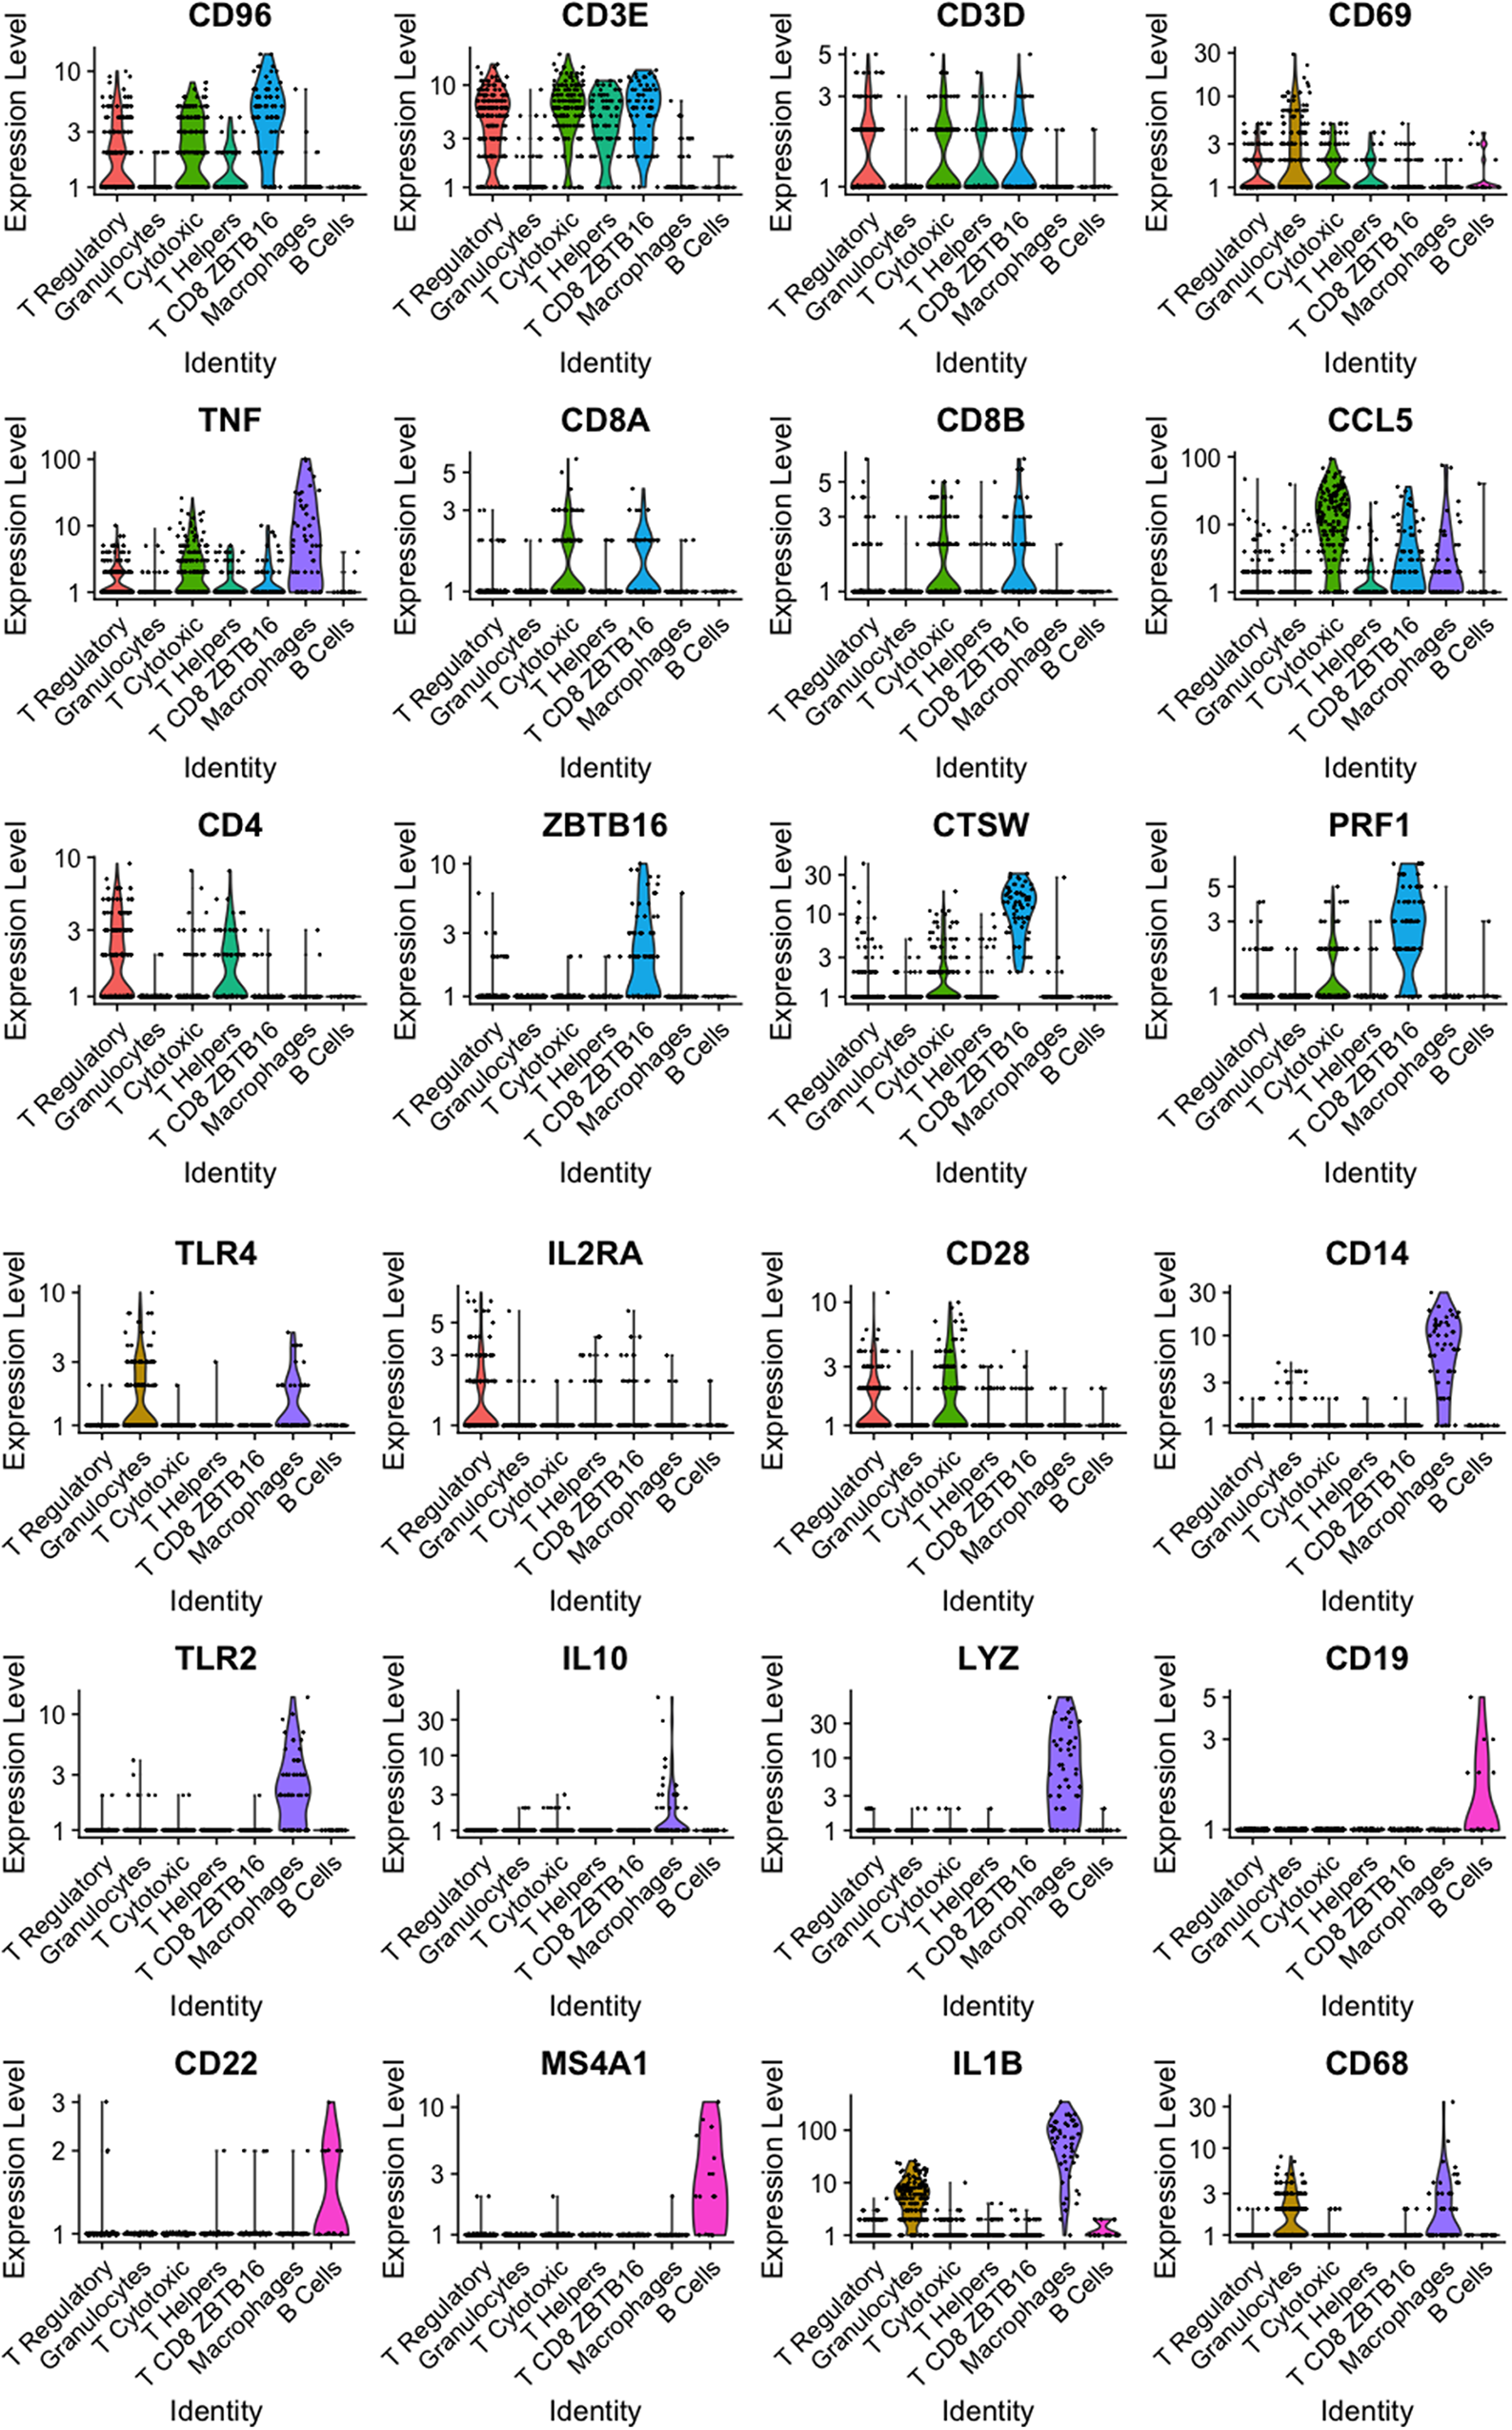
Violin plots for representative genes of clusters identified from immune cells (CD45+) sorted using FACS present in milk from a healthy Holstein cow (dataset 1).
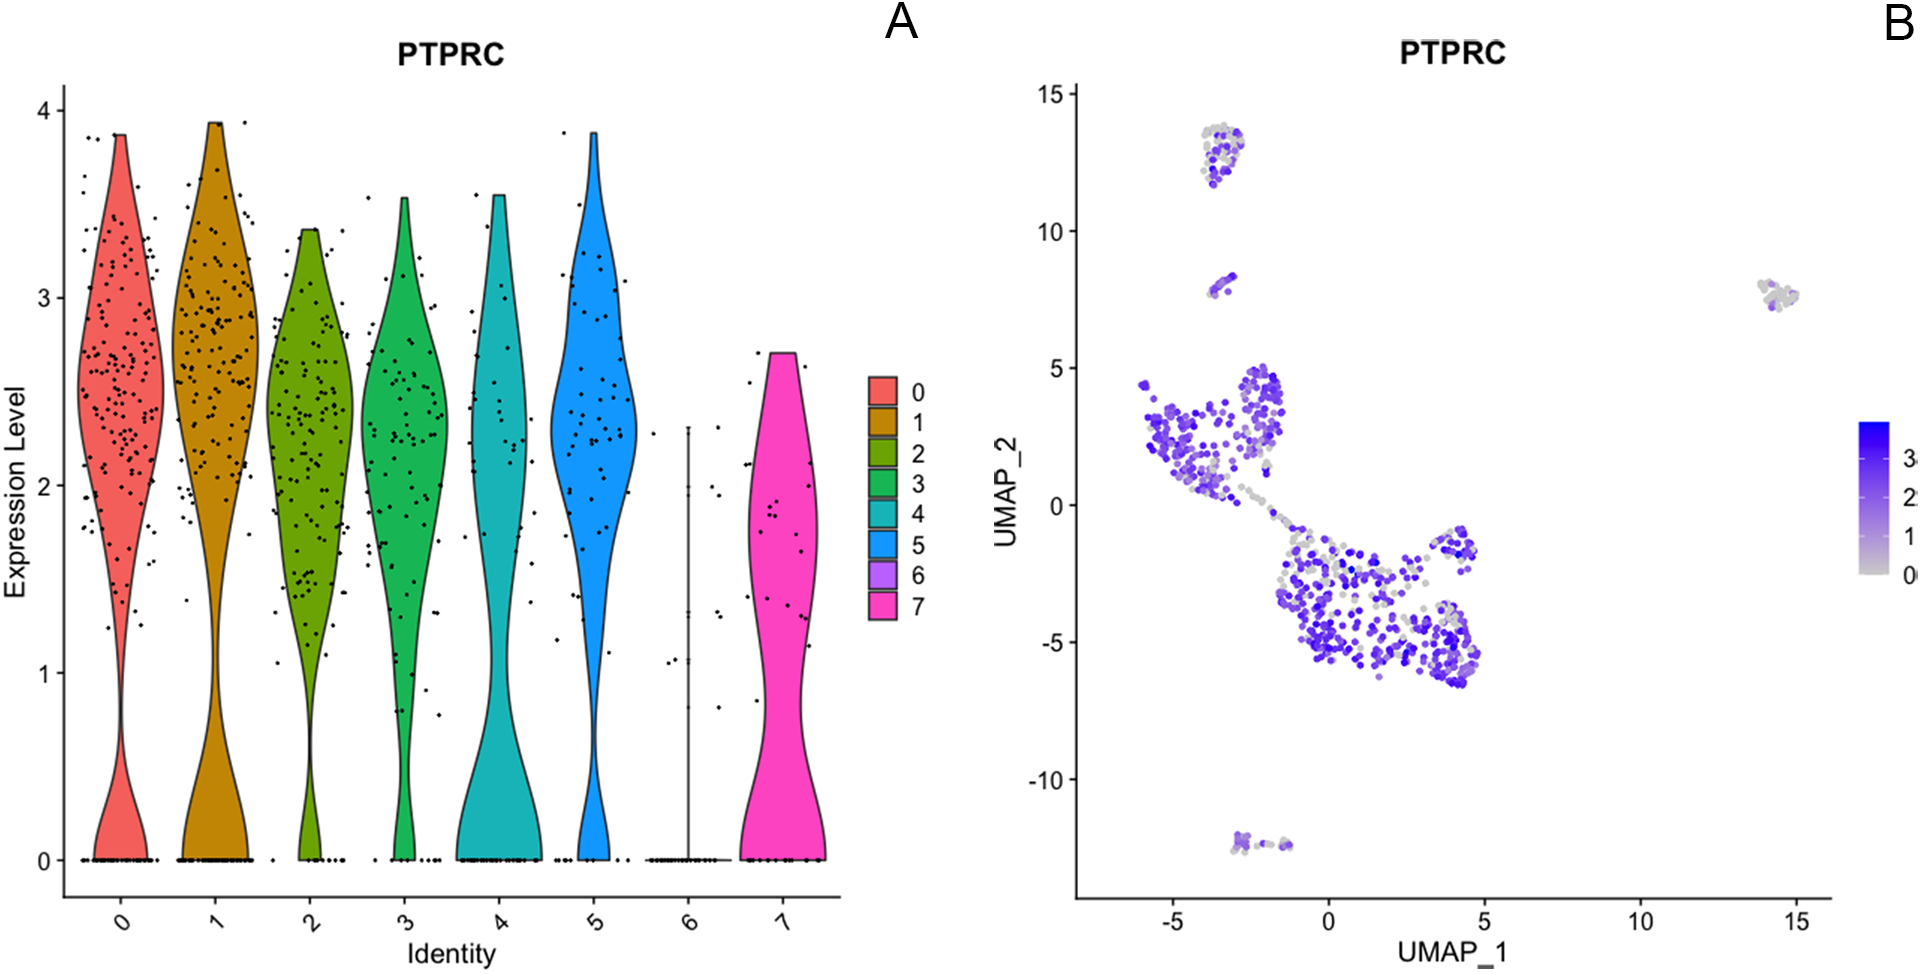
The dataset for Cow 2 included 923 cells with 17,771 features and eight differentiated clusters. Despite initial sorting based on CD45, it is noteworthy that only seven of the eight clusters express the PTPRC transcript (encoding CD45) as shown in Fig. 7. Interestingly, in our study, dendritic cells (group 6) were an exception, displaying no detectable RNA expression of CD45 despite their well-established characterization as CD45-positive immune cells, the marker used for sorting in our study. We have not determined an explanation for the difference between protein-level CD45 expression and the transcriptomic data.
Expression of immune marker PTPRC (CD45) across all clusters from dataset 2, including 923 cells, shown by violin plots (A) and feature plots (B) using the using the uniform manifold approximation and projection (UMAP).
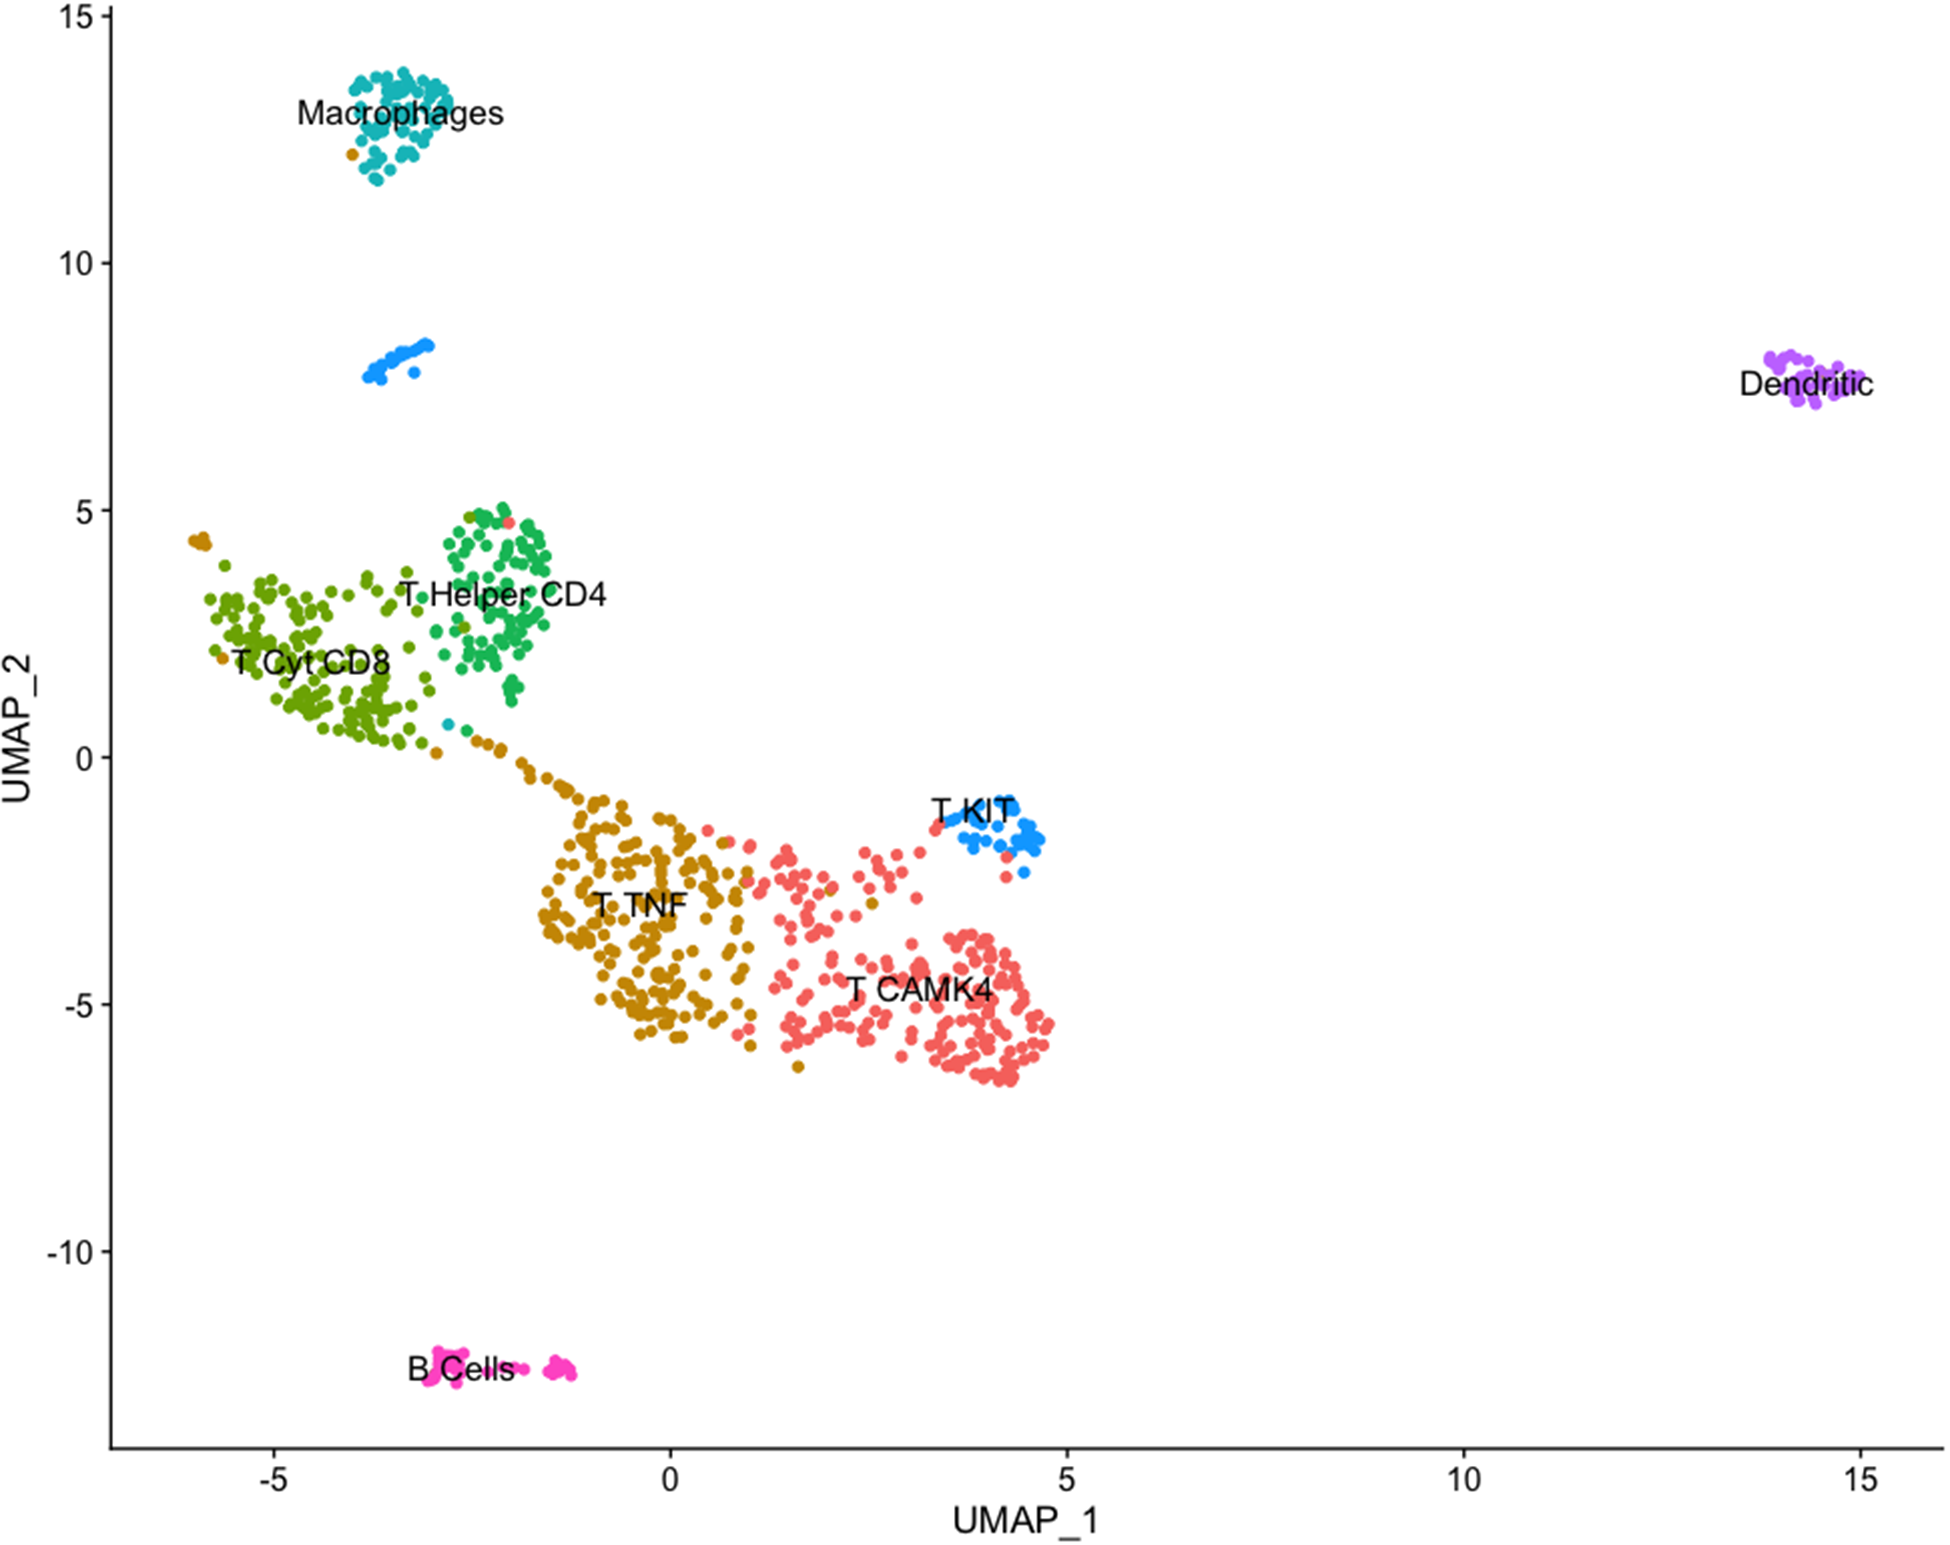
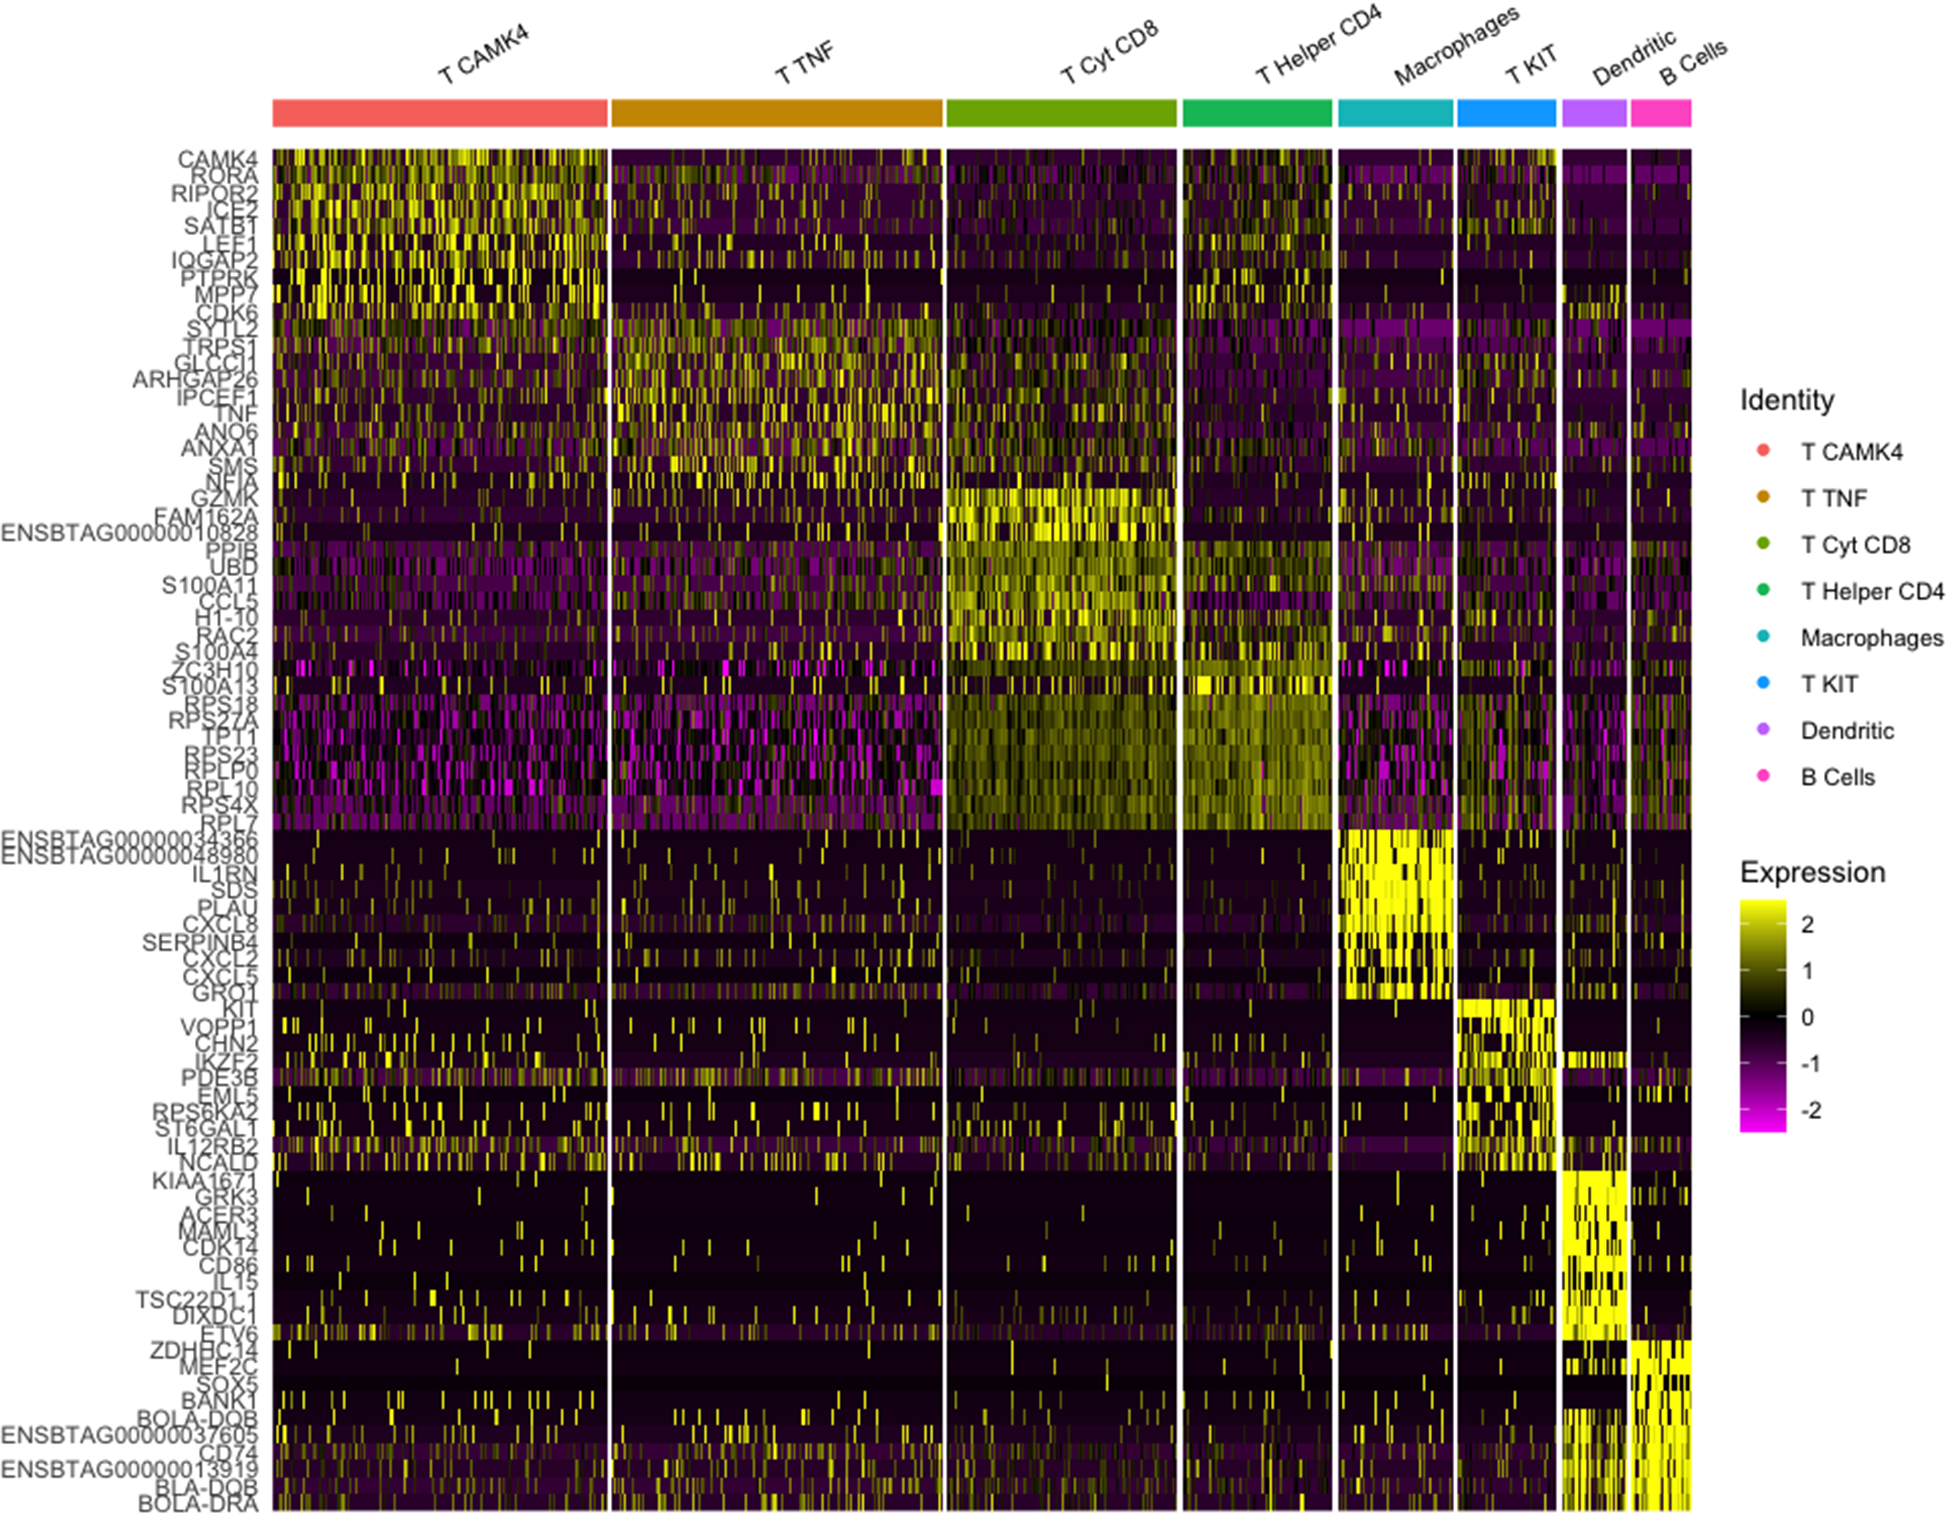
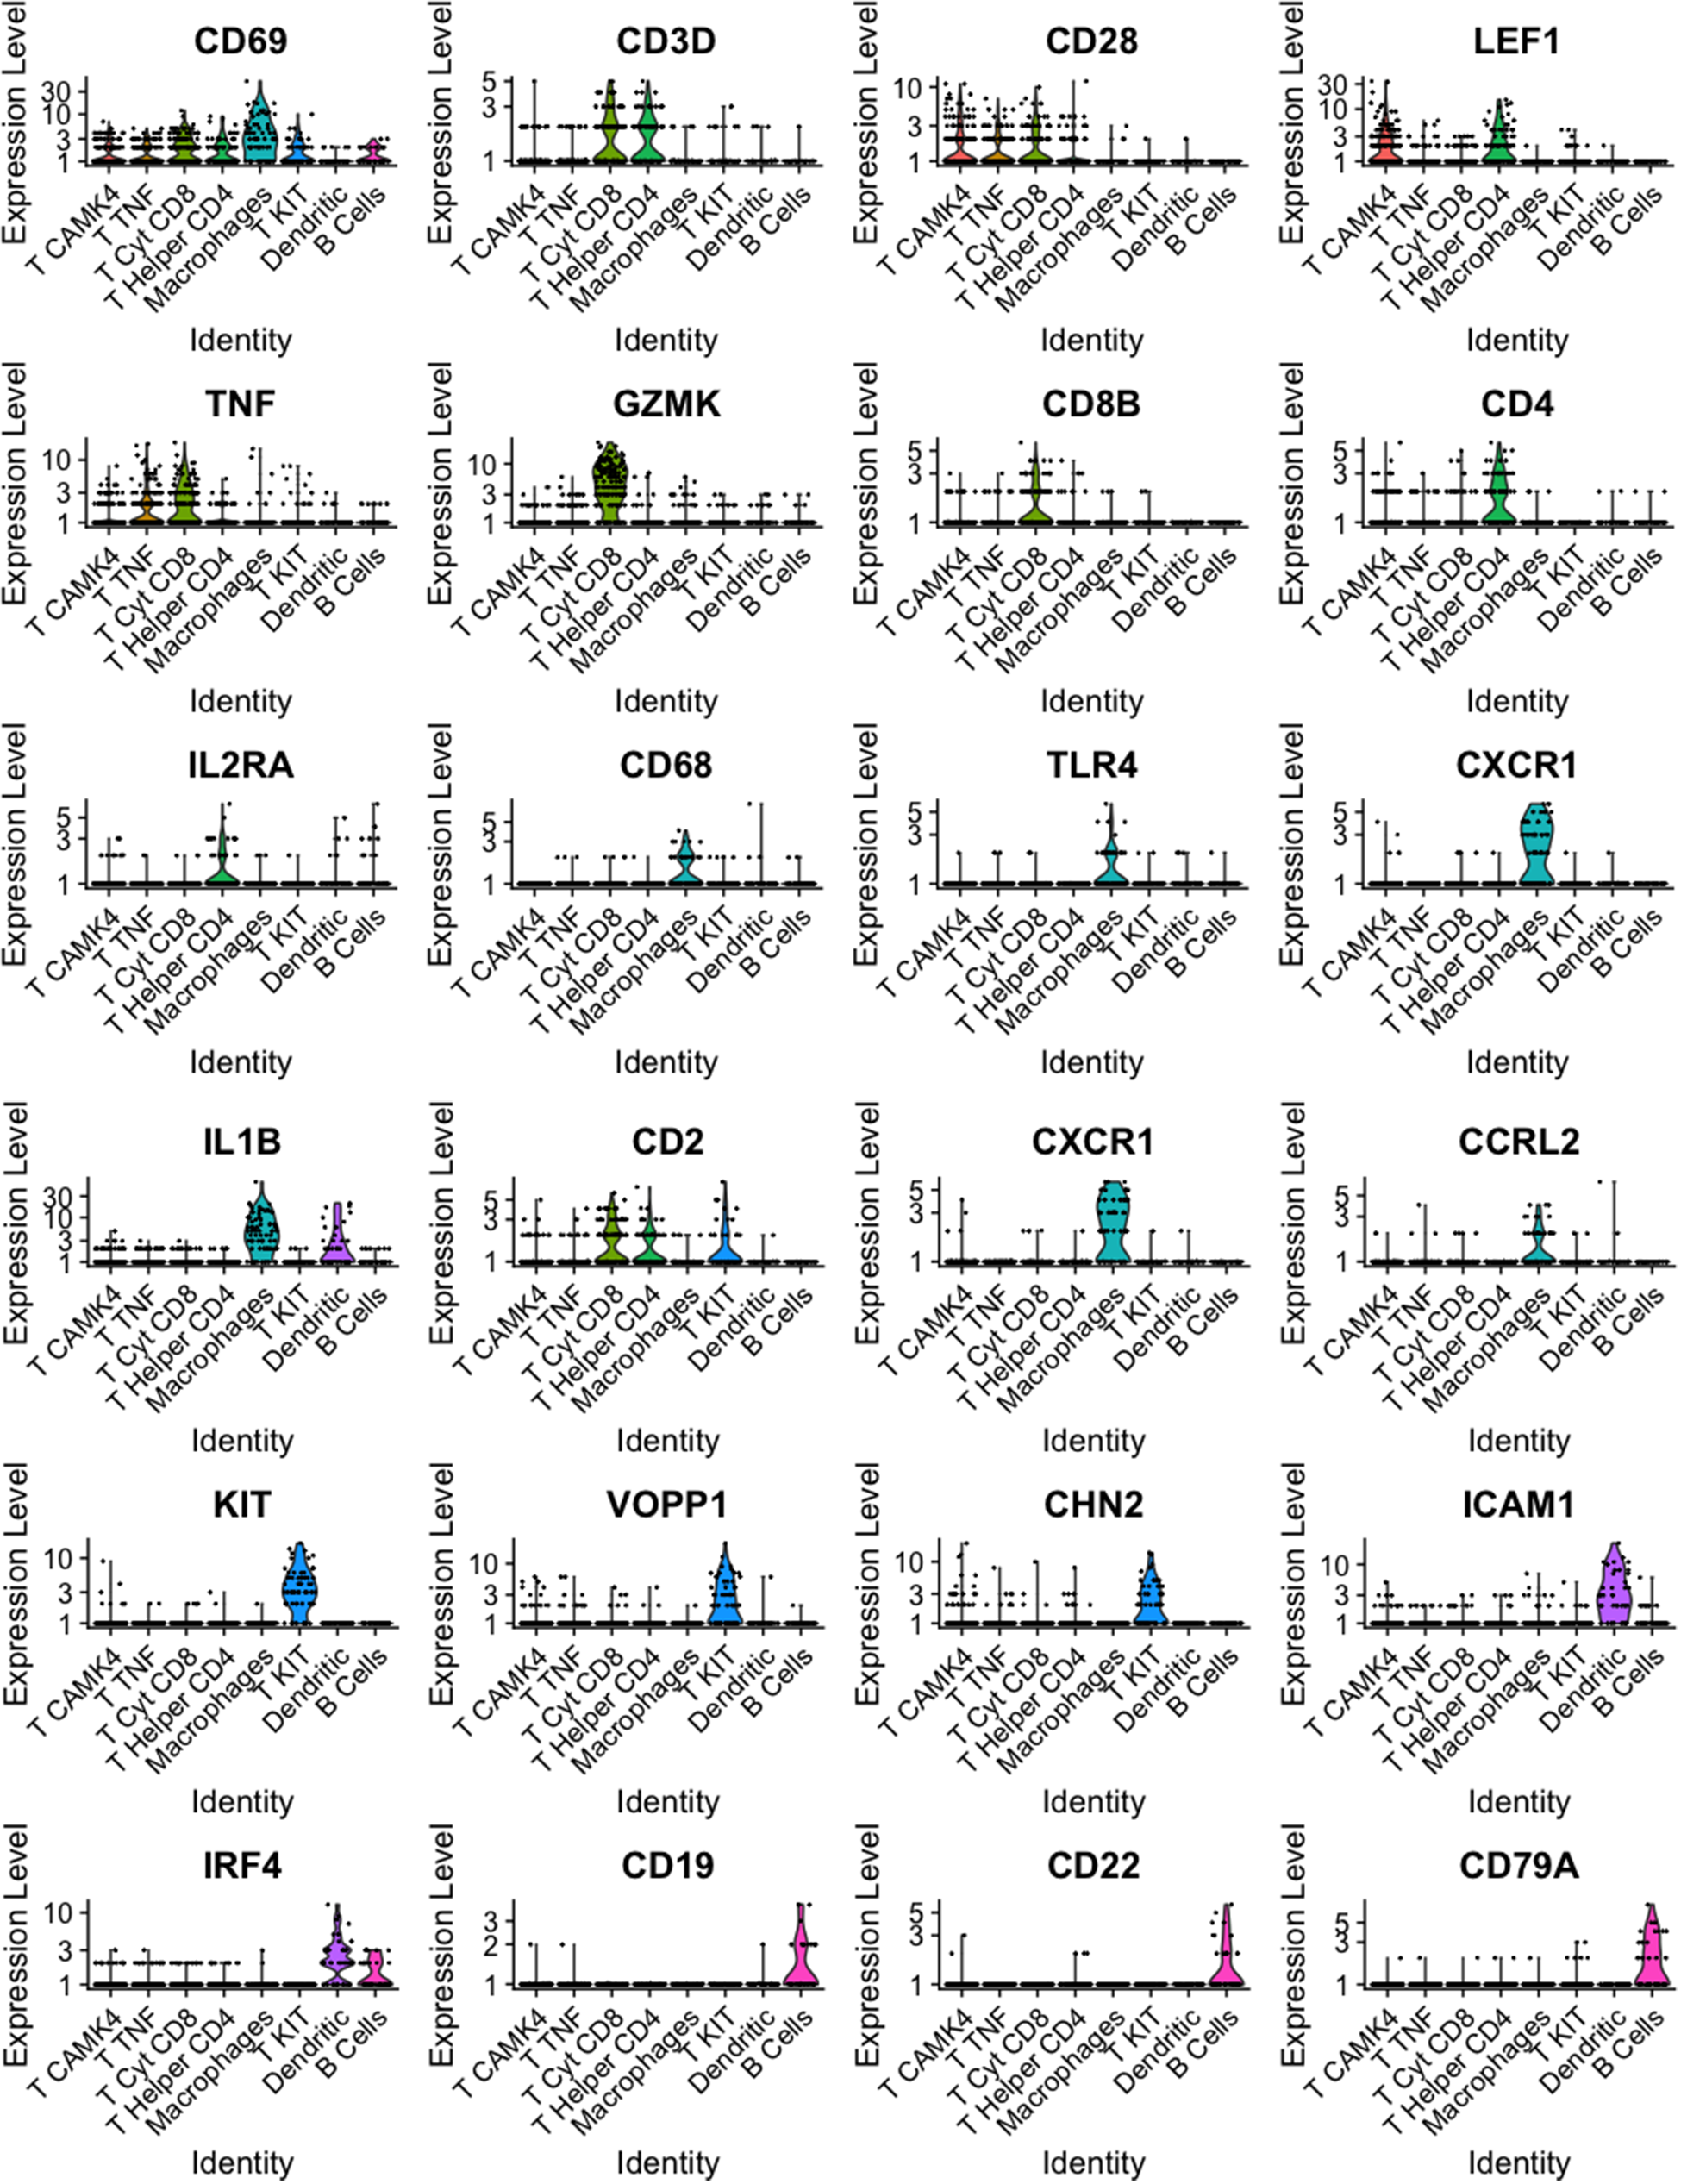
The putative identity for each population depicted by cluster analysis is macrophages-expressing CD68, TLR4, and IL1B (8.3%), dendritic cells-expressing ICAM1 and RF4 (4.7%), B cells-expressing CD19, CD22, and CD79A (4.3%), and five populations expressing T cells features classified as, helper T cells-expressing CD4 and IL2RA (10.9%), cytotoxic T cells-expressing TNF and CD8B (16.6%), a subgroup of T cells-expressing TNF, CD28, and CD69 (23.9%), T cells-expressing KIT, CD69, and CD2 (7.2%), and T cells-expressing CAMK4 and CD69 (24.1%) (Fig. 8). Population and cell identity were based on the top 10 up- and downregulated transcripts shown by heatmap analysis (Fig. 9) and analysis of individual recognized markers of immune cells identities (Fig. 10).
Clustering immune cells in milk from one Holstein cow (dataset 2) using the uniform manifold approximation and projection (UMAP) dimension reduction technique. Note: The total 923 cells were divided into eight clusters. Cell proximity represents gene expression similarity, and identification of cell types was accomplished by analyzing significantly enriched expression of established cell markers.
Heatmap of transcriptome similarities between cell clusters for dataset 2. Note: Rows represent representative genes and columns represent cell clusters. Numbers and colors on the right represent log2 fold changes relative to the median gene expression level across all clusters. Color scheme is based on z-score distribution from −2 (purple) to 2 (yellow). Right margin color bars highlight gene sets specific to the respective cluster.
Violin plots for representative genes of clusters identified from immune cells (CD45+) sorted using FACS present in milk from a healthy Holstein cow (dataset 2).
As demonstrated in review papers, the presence of immune cells such as neutrophils, macrophages, and lymphocytes in milk has been widely reported in multiple species such as cows, buffalo, ewe, goat, and camels (Alhussien and Dang Reference Alhussien and Dang2018). In human breast milk, the reported immune cells include monocytes, T cells, natural killer cells, B cells, neutrophils, eosinophils, and immature granulocytes (Witkowska-Zimny and Kaminska-El-Hassan Reference Witkowska-Zimny and Kaminska-El-Hassan2017). However, the exploration of cellular heterogeneity within these cell subpopulations has been mainly characterized in human milk, with only a few studies addressing cells present in bovine milk.
Consistent with our findings, immune cells in human milk comprise major immune cell types, including a high proportion of T cells, monocytes, macrophages, and B cells (Twigger et al. Reference Twigger, Engelbrecht and Bach2022). Additionally, immune cell identities, including T cells, B cells, macrophages, and dendritic cells have been reported in milk samples from 15 different human donors from 3 to 630 days of lactation. Nevertheless, the immune cell subpopulations described in that study showed a wider range of cell types including CSN1S1 macrophages, fibroblast, eosinophils, and Langerhans cells (Nyquist et al. Reference Nyquist, Gao and Haining2022).
Expecting possible differences between species, immune cells present in bovine milk from scRNA-seq analysis reported in the literature showed a similar profile to that observed in this study and in immune cells from human milk depicting immune cell communities of macrophages, monocytes, T cells, B cells, dendritic cells, and natural killer cells which have not been reported before in milk (Becker et al. Reference Becker, Weikard and Hadlich2021; Zorc et al. Reference Zorc, Dolinar and Dovč2024). Clustering analysis from Becker et al. (Reference Becker, Weikard and Hadlich2021) showed five, two, and three different subpopulations of monocytes, macrophages, and T cells, respectively. Within this immune population, most cells in the dataset were monocytes and macrophage, contrasting with the results observed in our study where the major immune cell type identified was T cells, and only a main community of macrophages was identified, while no monocytes were observed. In a more recent study conducted by Zorc et al. (Reference Zorc, Dolinar and Dovč2024), the group exhibiting the highest cellular diversity consisted primarily of T cells, including four subpopulations, followed by three subpopulations of neutrophils and monocytes. These findings align with prior literature and are consistent with our study results. Notably, researchers in this study also identified a significant presence of mast cells, which have not been previously reported in bovine milk. It is important to note that the studies by Becker et al. (Reference Becker, Weikard and Hadlich2021) and Zorc et al. (Reference Zorc, Dolinar and Dovč2024) used residual milk samples (120–200 mL), which might account for the variation observed in their results compared to our investigation, which utilized a significantly larger sample volume collected throughout the complete milking session (3.8 L).
Neutrophils, the primary type of granulocyte found in milk (Alhussien et al. Reference Alhussien, Panda and Dang2021), play a vital role in the innate immune response by primarily targeting and combatting bacterial infections (Kobayashi and DeLeo Reference Kobayashi and DeLeo2009). Given their known abundance in milk, it was anticipated that a greater number of these cells would be observed in the study. However, neutrophils are terminally differentiated cells with a remarkably short lifespan, serving as the frontline defenders against invading pathogens (Paape et al. Reference Paape, Bannerman and Zhao2003).
The limited lifespan of neutrophils relative to T cells could produce a difference in the proportions of live cells after cell sorting leading to an enriched profile of T cells in this study. Furthermore, the increased infiltration of neutrophils to infection sites as opposed to these samples obtained from clinically healthy animals could have influenced the relative contribution of other immune cells, such as T cells, to the overall sample composition. Consequently, the viability and presence of neutrophils could have played a significant role in shaping the observed immune cell profile. Further investigation and analysis are warranted to explore this intriguing relationship fully.
The observed differences in the broader heterogeneity of immune cells in milk between humans and cattle may be attributed to inherent species-specific variances, as well as the number of cells analyzed. In this study, we had the capacity to analyze only 1,000 cells from a representative sample, while other studies in the literature include more than 8,000 cells which might have increased the diversity and the amount of rare immune cells. Also, a greater amount of cell types and cell number would add diversity to the dataset allowing for a more delineated identification of more subtle immune cell communities within a cell subpopulation and a greater ability to detect minor populations.
Conclusion
In summary, milk-derived SCs are a diverse, enriched sample containing multiple cell types, as shown in this study. While cells of hematopoietic origin predominate in bovine milk from healthy Holstein cows, the presence of live MEC raises intriguing questions related to their abundance in healthy mammary glands under normal conditions. Based on our findings, the conduction of further investigations into the heterogeneity of MEC derived from milk using low-throughput technologies is not recommended. However, technologies like scRNA-seq have facilitated the exploration of molecular identities within bovine milk, particularly within immune cells, where T cells and granulocytes were present as the main cell types in healthy Holstein cows. Future studies leveraging these advancements to explore factors influencing the immune system in animals hold promise for unraveling interconnections within specific cell subpopulations, crucial for comprehending the roles of immune cells. This research clears the way for deeper insights into mammary gland function, offering potential avenues for enhancing animal health and milk production in the future.
Acknowledgements
This work was supported by USDA-NIFA Hatch Project VA-13995. This work was supported by the USDA-NIFA Hatch Project VA-135995 and AFRI competitive grant no. 2023-67015-39783. The authors thank the Virginia Tech farm staff for caring for the animals used in this study. Furthermore, we express our gratitude to Dr. Song Li and Dr. Prakash Raj Timilsena for their insightful guidance on data analysis.
Author contributions
BAC conceptualized and designed the research; GPH performed the experiments; AJL and MM contribute with laboratory protocols and methodologies. Data analyses were conducted collaboratively by GPH and BAC. GPH and BAC prepared the original manuscript. All authors read and approved the final manuscript.
Conflicts of interest
The authors have not stated any conflicts of interest.


 Open access