


Social media summary
Arcade game genres behave like cultural niches – some diversify, others become living fossils.
1. Introduction
What is an arcade video game? Although this may appear evident to experienced gamers today, video games lacked a clear cultural identity in their early years. It was uncertain whether they would be considered harmless amusement or a potential social concern, whether their audience would be primarily adults or children, and whether they would be perceived in positive, productive terms or as a moral and physical threat (Newman, Reference Newman2018). This ambiguity reflects a broader pattern in cultural evolution: new technological and artistic forms do not emerge with predetermined meanings or functions but instead undergo a process of social negotiation and adaptation (Mesoudi, Reference Mesoudi2011).
Arcade video games developed within a distinct cultural and technological niche, separate from home consoles and personal computers (see Appendix A for a glossary of technical and cultural terms used throughout the paper). Unlike other gaming sectors, arcade games operated under a coin-operated model, where access was distributed among players rather than granted through direct ownership. This economic structure shaped the design of arcade games, favouring short, intense gameplay loops optimised for engagement and repeat play. As a result, the arcade game ecosystem evolved under unique constraints—balancing technological capacity, player psychology, and business incentives—that distinguish it from other forms of gaming.
Despite their significance, arcade games remain an underexplored domain in cultural evolution research. Most studies of technological evolution have focused on early human tools, industrial innovations, or modern software, while video gaming—which now involves over 3 billion players globally—has received limited attention from a cultural macroevolutionary perspective. Cultural evolution studies have explored traditional games such as Go (Beheim et al., Reference Beheim, Thigpen and Mcelreath2014; Beheim, Reference Beheim2025), football (Mesoudi, Reference Mesoudi2020), and chess (Lappo et al., Reference Lappo, Rosenberg and Feldman2023), but arcade video games—despite their historical and technological richness—remain comparatively underanalysed. Beyond their narrative dimensions (Gilbert, Reference Gilbert2019), video games evolve as complex cultural products (Lowood, Reference Lowood2009), shaped by technological constraints, market dynamics, and imitation pressures.
Arcade games, in particular, illustrate how economic structures, player behaviour, and competitive pressures interact to drive innovation, persistence, and decline. Over time, they diversified into recognisable genres (Raessens & Goldstein, Reference Raessens and Goldstein2011)—such as maze games, shooters, fighting games, and driving simulators—each adapting to new technical affordances and shifting player expectations. As in other evolving systems, this diversification often followed a burst-and-collapse pattern (Žliobaitė et al., Reference Žliobaitė, Fortelius and Stenseth2017), where early novelty leads the way to saturation, redundancy, and decline.
This trajectory echoes dynamics observed in both biological and cultural evolution (Gould, Reference Gould1974; Strotz & Lieberman, Reference Strotz and Lieberman2023; Duran-Nebreda et al., Reference Duran-Nebreda, Bentley, Vidiella, Spiridonov, Eldredge, O’Brien and Valverde2024), where an initial expansion phase is followed by contraction due to competition, imitation, and resource limitations. In this context, genres can be seen as culturally constructed niches that temporarily stabilise design conventions, coordinate expectations, and filter viable trait combinations. While some genres disappeared during periods of contraction, others persisted or even re-emerged, suggesting the influence of cultural transmission mechanisms (Boyd & Richerson, Reference Boyd and Richerson1988; Henrich & Gil-White, Reference Henrich and Gil-White2001; Mesoudi, Reference Mesoudi2011; Acerbi & Mesoudi, Reference Acerbi and Mesoudi2015). Prestige-biased transmission and structural reinforcement may have preserved dominant genre templates, giving rise to cultural ‘living fossils’ (Eldredge & Stanley, Reference Eldredge, Stanley, Eldredge and Stanley1984).
As Eldredge argued (Vrba & Eldredge, Reference Vrba and Eldredge1984; Eldredge, Reference Eldredge1985; DeGregori & Eldredge, Reference DeGregori and Eldredge2020), evolution reflects ‘the fate of transmissible information in an economic context’—a principle that applies directly to arcade video games, where cultural and market forces jointly determine which gameplay forms are retained, adapted, or abandoned. Rather than functioning as lineages in a phylogenetic tree, arcade genres may be better understood as evolving cultural-ecological systems—structured assemblages of games, developers, infrastructures, and player communities that co-evolve through interaction, competition, and feedback.
Here, we analyse the cultural and technological evolution of arcade video game genres by reconstructing diversification patterns, exploring technological scaling laws, and identifying collapse and resilience dynamics. Using the MAME (Multiple Arcade Machine Emulator) database, we extract detailed metadata on 7,205 arcade video games, including titles, manufacturers, release years, genre classification, and hardware traits (see Appendix B). Our study explores how arcade video games evolved through the interplay of innovation, collaboration, and constraint—investigating how certain genres adapted to changing conditions while others succumbed to stagnation. By tracing the evolutionary trajectories of arcade video games, we contribute to a broader understanding of how complex cultural systems diversify, persist, and collapse over time (Valverde & Solé, Reference Valverde and Solé2006; Arthur, Reference Arthur2009).
2. Genres as emergent cultural forms
Genres in arcade video games are not static taxonomies but emergent cultural-ecological forms, shaped through the iterative interactions of players, developers, and manufacturers. In the early years of arcade gaming, the identity of these machines was not self-evident: Were they toys, competitive challenges, or technological spectacles? This uncertainty prompted open-ended exploration of gameplay possibilities, producing a system of classification that evolved through cumulative social experience. As in other complex cultural domains, new genres emerged through modification and recombination of prior forms (Hidalgo et al., Reference Hidalgo, Bailey Klinger and Hausmann2007; Mesoudi & O’Brien, Reference Mesoudi and O’Brien2008; Arthur, Reference Arthur2009; Solé & Valverde, Reference Solé and Valverde2020), eventually consolidating into partially stable niches within a broader design ecology.
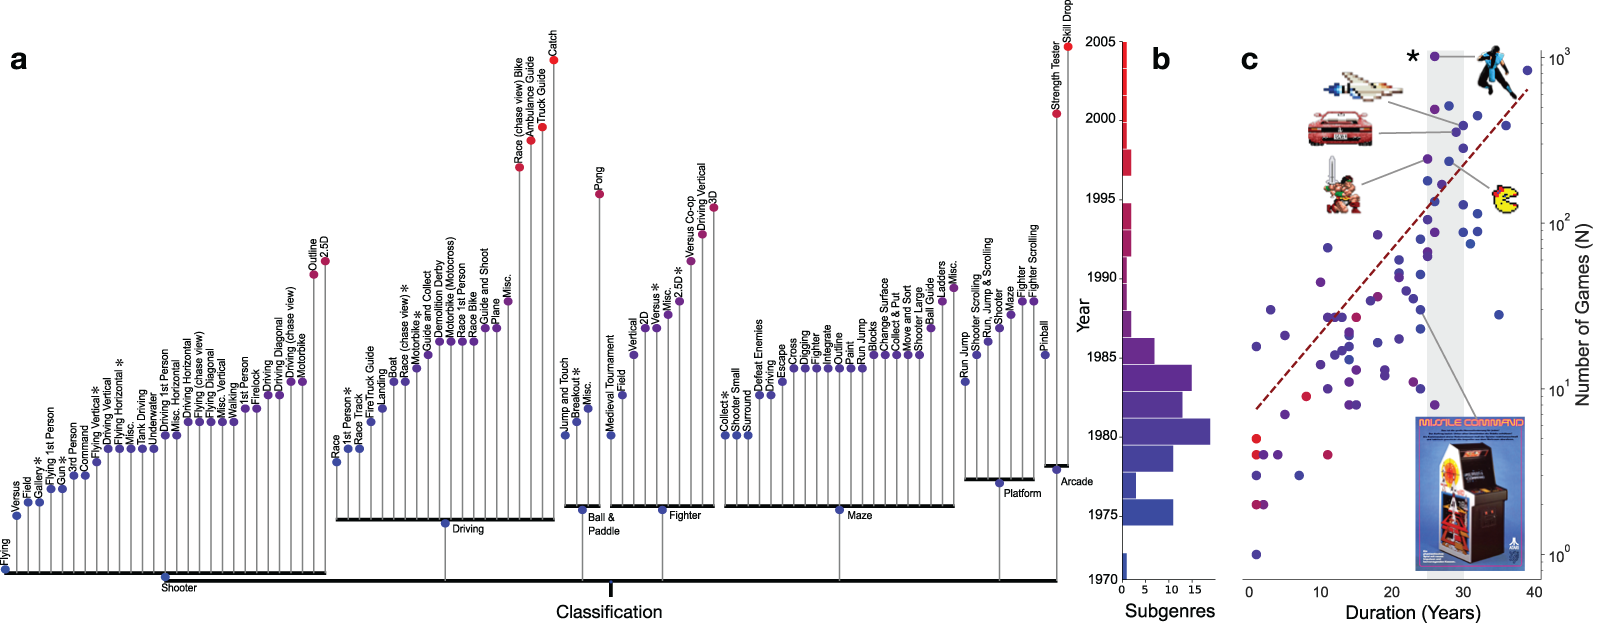
To visualise this niche diversification process, we constructed a hierarchical map of genres and subgenres based on a community-defined classification of MAME games (see Figure 1). While panel (a) adopts a tree-like visual structure, it is not a phylogenetic tree in the biological sense. Each game is assigned both a main category (genre) and a subcategory (subgenre) by the community, reflecting gameplay features rather than historical descent. The resulting layout is better interpreted as a cultural classification—a map of gameplay modalities shaped by overlapping innovations, user conventions, and systemic feedback.
Classification and diversity of arcade niches. (a) Hierarchical map of arcade genres and subgenres (‘niches’), showing their retrospective, culturally negotiated organisation rather than a phylogeny (see text). (b) Niche expansion over time follows a ‘hat’ pattern common in macroevolution – steady growth, a 1980s peak (the ‘golden age’), and a long-tailed decline. (c) Subgenre size (number of games, N) scales exponentially with subgenre duration (dashed line shows best fit). Residuals highlight persistent outliers (grey area), notably Fighter/Versus (black asterisk), suggesting how cultural inertia and market feedback influences niche longevity. Game icons illustrate representative titles (from top to bottom): Mortal Kombat (Fighter/Versus), Gradius (Shooter/Flying Horizontal), Out Run (Driving/Chase View), Rastan Saga (Platform/Fighter Scrolling), Pac-Man (Maze/Collect), and Missile Command (Shooter/Command). Node colour encodes year of first appearance (blue = early; red = recent).

Main categories can be interpreted as broad gameplay templates, while subcategories reflect finer-grained innovations explored within those domains. Gameplay structures, like linguistic forms or film genres, emerge through shared expectations, aesthetic norms, and socially reinforced conventions (Reali & Griffiths, Reference Reali and Griffiths2010; Sobchuk et al., Reference Sobchuk, Youngblood and Morin2024). These conventions function as cultural attractors—semi-stable tendencies toward particular forms in the cultural transmission process (Sperber, Reference Sperber1996; Claidière et al., Reference Claidière, Scott-Phillips and Sperber2014)—enabling both novelty and recognizability. The overlaps between genres reflect the recombinatorial and hybrid nature of arcade development—traits were not inherited strictly but assembled modularly across shifting cultural contexts.
Panel (b) in Figure 1 reveals a familiar ‘hat-shaped’ diversification curve, widely observed in evolutionary and historical systems (Liow & Stenseth, Reference Liow and Stenseth2007; Valverde & Solé, Reference Valverde and Solé2015; Raulo et al., Reference Raulo, Rojas, Kröger, Laaksonen, Orta, Nurmio, Peltoniemi, Lahti and Žliobaitė2023): a rapid expansion phase, peaking during the so-called ‘golden age’ of arcade video games (Kent, Reference Kent2010), followed by a protracted decline. This trajectory reflects a punctuated phase of exploratory innovation, in which new gameplay forms rapidly emerged and diversified, followed by a period of saturation and structural slowdown as redundancy increased and external competition— such as the rise of home consoles—altered the technological landscape.
Importantly, genre decline did not manifest as an abrupt collapse, but rather as a gradual macroevolutionary tapering—similar to winnowing patterns seen in paleobiological systems (Lloyd et al., Reference Lloyd, Wang and Brusatte2012). After the peak, innovation slowed, niche consolidation intensified, and audience attention became more narrowly focused. While some niches faded quickly, others persisted— stabilised by institutional scaffolding, community practices, and genre-level reinforcement. This persistence suggests that long-term survival was shaped not only by intrinsic innovation potential but also by broader cultural-ecological dynamics, including social memory, market infrastructure, and transmission bias.
Panel (c) explores how the number of games per genre scales with genre lifespan. While most niches follow an approximately exponential trend—where longer-lived niches tend to accumulate more games—some, such as Fighter/Versus, persist far beyond these expectations. These long-lived outliers reflect not only ongoing innovation but also the effects of cultural prestige, infrastructure support, and brand loyalty. Their persistence highlights that survival in complex cultural systems depends on more than functional traits alone (Gray et al., Reference Gray, Greenhill and Ross2007; Duran-Nebreda & Valverde, Reference Duran-Nebreda, Valverde, Tehrani, Kendal and Kendal2023); it is reinforced by the social dynamics, collaborative networks, and feedback loops that sustain niches.
3. The morphospace of arcade games
Technological constraints play a pivotal role in shaping the evolution of complex cultural products (Basalla, Reference Basalla1988). Arcade video games are multi-trait cultural artefacts, integrating hardware, game mechanics, and interface design—each evolving under distinct market constraints and player expectations.
3.1. Technological constraints and path-dependent evolution
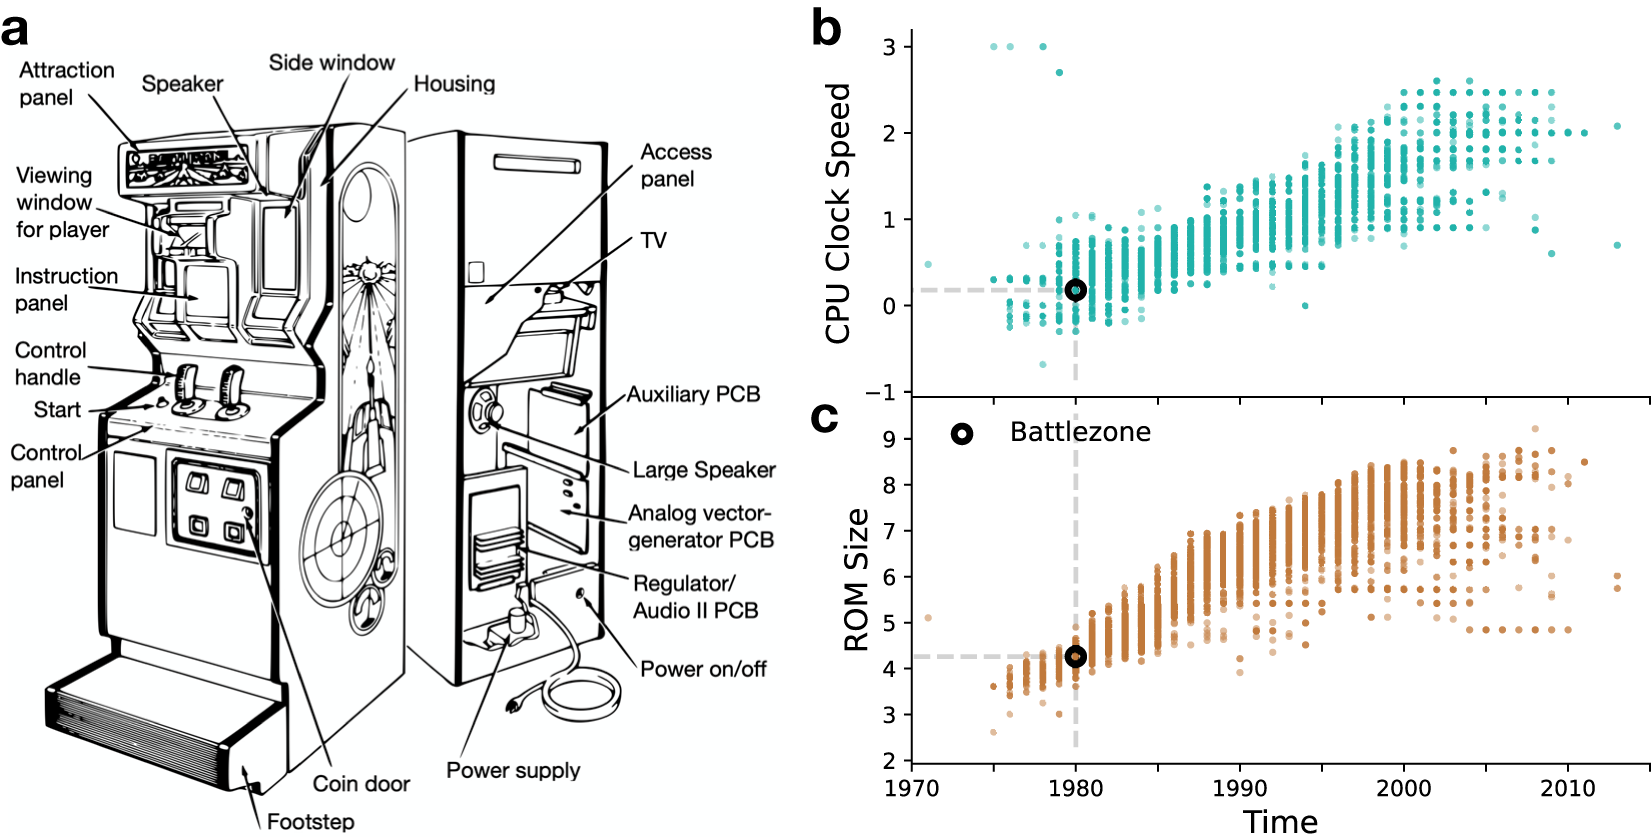
A clear example of how hardware and gameplay co-evolve under constraint is Atari’s Battlezone (1980), a shooter/tank driving game (Figure 2a). This machine employed a distinctive cabinet with both external and internal components that shaped user experience and game performance (Atkinson, Reference Guins2021). On the outside, the player interacted with an Attraction Panel, Viewing Window, and Control Panel. Inside, custom hardware—such as the Auxiliary Printed Circuit Board (PCB) and the Analog Vector-Generator PCB – generated the game’s characteristic vector graphics, creating a pseudo-3D tank battlefield (Wolf, Reference Wolf2012). This example illustrates how hardware was not simply a technical limitation but also a creative driver of unique genre aesthetics, that is, the now-iconic ‘retro’ look.
Arcade video games are multi-trait cultural and technological products. (a) Schematic of the Battlezone arcade system (Atari, 1980), a ‘Shooter/Tank Driving’ game, illustrating both external and internal components. Adapted from Atari Inc.’s ‘Operation, Maintenance, and Service Manual’ (1980), the front view highlights user interaction elements (e.g., control panel, viewing window), while the rear view reveals key internal hardware, including the Auxiliary PCB and Analog Vector-Generator PCB. (b, c) Temporal distribution of logarithmic CPU clock speed (b) and logarithmic ROM size (c) across arcade machines, demonstrating the increasing complexity of arcade hardware over time. The position of Battlezone within both distributions is marked (black dot).

To understand how hardware limitations shaped arcade game evolution more broadly, we focus on two consistently reported hardware traits: ROM (read-only memory) size and CPU clock speed. These traits represent fundamental computational dimensions—storage and processing—and serve as proxy indicators of technological complexity. ROM stored all game assets: graphics, audio, and executable code. Unlike RAM, ROM could not be modified during gameplay. Its capacity directly constrained the richness of content, animation complexity, and sound design. Equally important is the CPU (Central Processing Unit), which governs computational speed. For example, in Space Invaders (Taito, 1978), which ran on an Intel 8080 microprocessor (see Box 1) clocked at 2 MHz, only 24 objects could be animated simultaneously. As the player eliminated enemies, the processing burden decreased—causing the game to speed up. What became a signature gameplay mechanic emerged directly from hardware limitations, not intentional design.
Microprocessors in early arcade games: From Pinball to Space Invaders
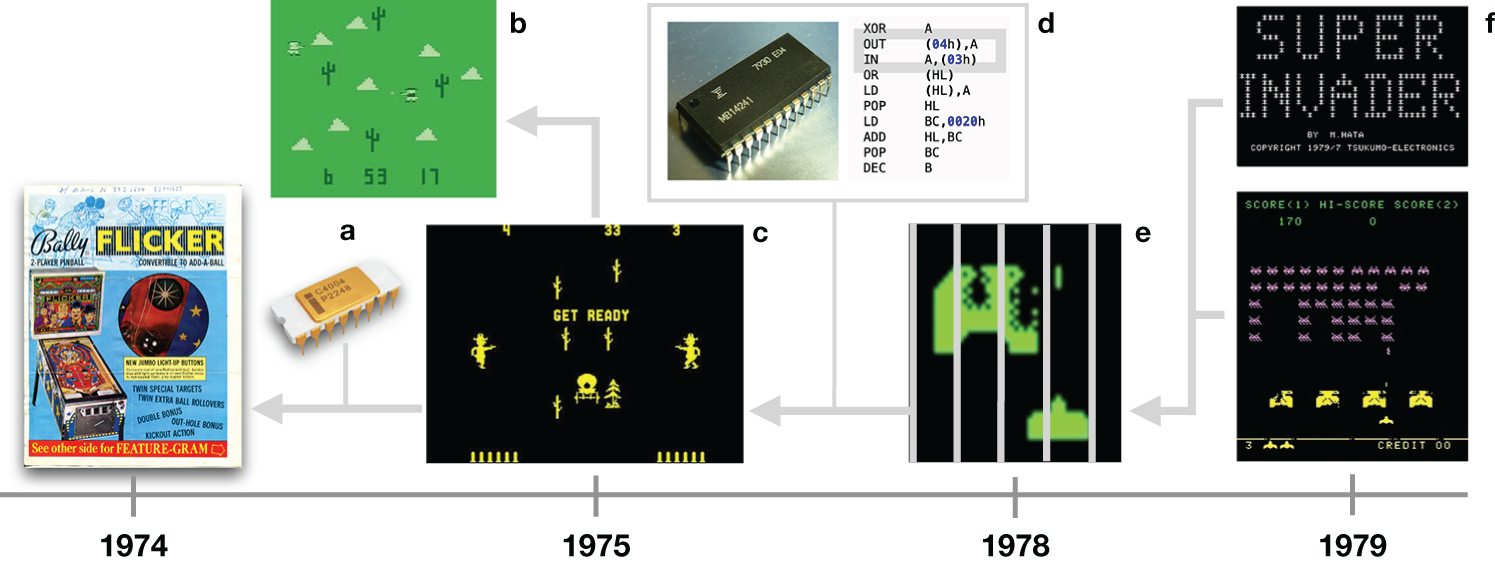
The shift from electromechanical to digital arcade machines marked a pivotal transition in the evolution of video games. In the early 1970s, Bally Manufacturing collaborated with Dave Nutting Associates to embed Intel’s 4004 CPU into pinball prototypes. While Taito’s Western Gun (1975) still used discrete circuitry, its localised version—Midway’s Gun Fight—became one of the first arcade games to use a microprocessor: Intel’s 8080. This innovation enabled smoother animation and modular code reuse despite tight memory and processing constraints.
These advances directly influenced Space Invaders (Taito, 1978), designed by Tomohiro Nishikado, who reused and extended Gun Fight’s architecture. The game’s iconic mechanic—accelerating enemy motion—emerged from CPU limitations, as fewer on-screen invaders meant fewer calculations per frame. The enormous success of Space Invaders triggered a flood of derivatives. Some were unauthorised bootlegs—hardware or software clones distributed without permission, often to bypass licensing restrictions. Others were licensed variants or early home adaptations like Super Invader for the Apple II. These versions highlight the blurred boundary between piracy, adaptation, and formal collaboration.
The genealogy in Figure 3 illustrates how modularity, reuse, constraints, and collaboration enabled early arcade innovation. In this article, we use ‘collaboration’ in a broad sense to include both co-development and licensing agreements that facilitated the integration of new gameplay mechanics, software, and hardware. These practices shaped the earliest arcade genres and established the evolutionary trajectories we trace in the broader analysis.
Hardware genealogy of early microprocessor-based arcade games. From Bally’s Flicker pinball machine (a), to Taito’s Western Gun (b), and Midway’s Gun Fight (c–d), leading to Nishikado’s Space Invaders (e), and its many clones and bootlegs (f). The highlighted assembly code subroutines were reused across games to animate sprites smoothly on a tile-based display (tile boundaries indicated by vertical grey bars in (e) were invisible in the game).

While technological capacity expanded over time (Figures 2b and 2c show log-transformed CPU speed and ROM size distributions), many games continued using outdated hardware. A horizontal band in Figure 2b, for instance, shows persistent use of 1 MHz CPUs well after more powerful chips became available. These choices were driven not only by cost but by developers’ familiarity and compatibility with existing systems—creating path-dependent trajectories in technological evolution (Solé et al., Reference Solé, Valverde, Casals, Stuart, Kauffman and Eldredge2013; Valverde, Reference Valverde2021).
Such patterns are consistent with Amdahl’s law (Amdahl, Reference Amdahl1967), which states that improvements in system performance are limited by the slowest, non-parallelizable components. Even with faster CPUs, serial processes like sprite rendering or audio synthesis constrained performance gains. Consequently, developers frequently prioritized reliability and affordability over cutting-edge architectures (Ashcraft and Snow, Reference Ashcraft and Snow2008). The economics of video game development partly explains the persistence of legacy hardware across decades—and how technical constraints shaped the pace and direction of genre innovation.
3.2. Scaling laws describe the morphospace trajectories of arcade niches
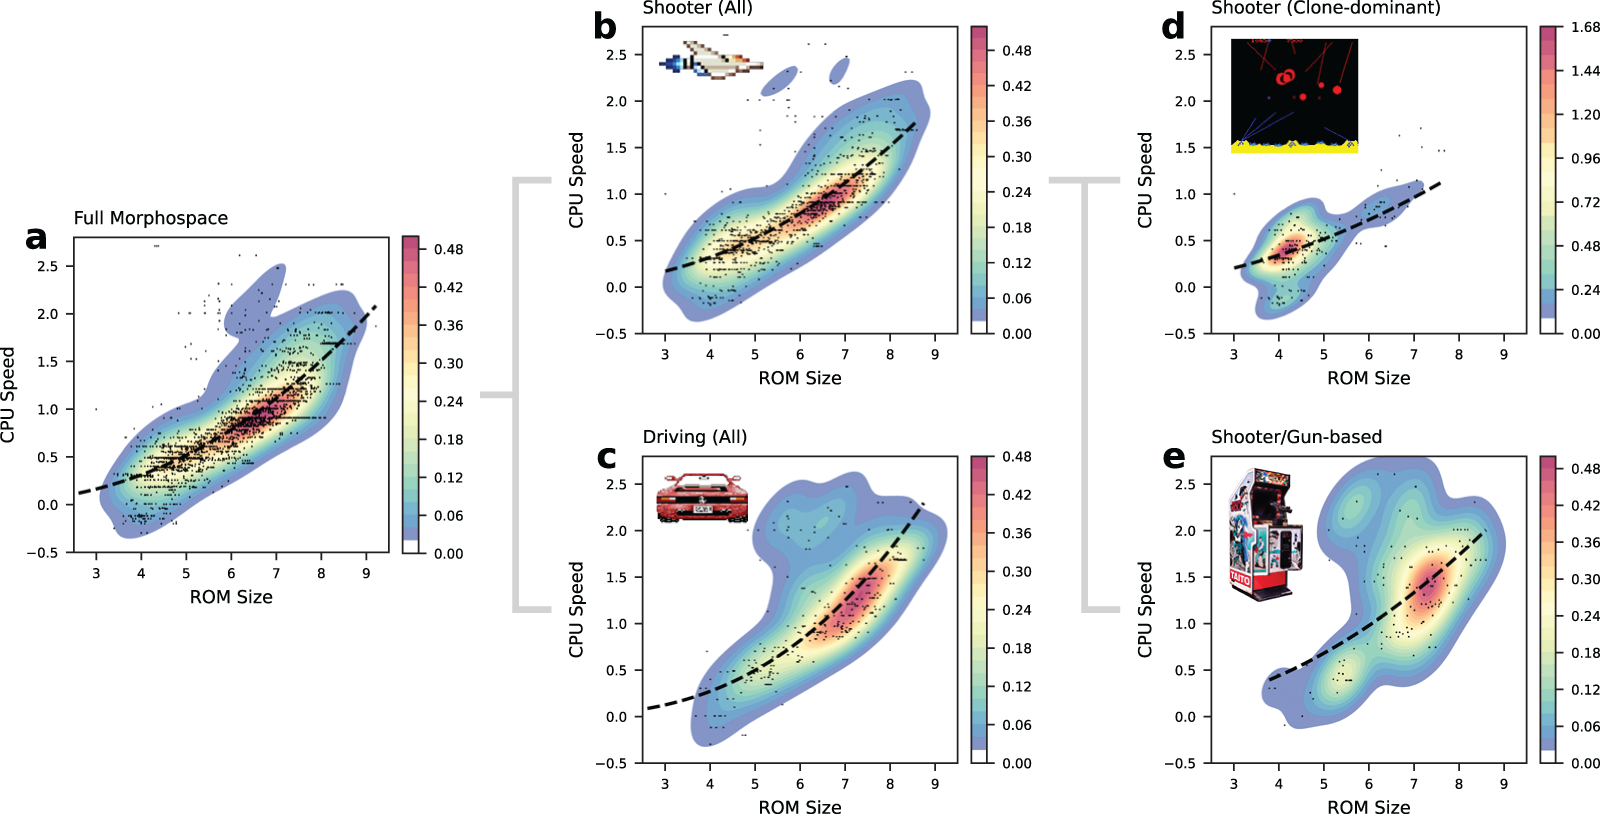
Although hardware constraints operated at the level of individual machines, they also shaped the broader evolutionary trajectories of arcade genres. To analyse these macroevolutionary patterns, we map video games into a technological morphospace (Raup & Michelson, Reference Raup and Michelson1965; McGhee, Reference McGhee1999)—a conceptual design space defined by log-transformed CPU speed and ROM size (Figure 4a). Genres can thus be understood as occupying distinct regions of this space, reflecting their hardware demands and game design strategies.
Niche diversification in arcade game morphospace. (a) Morphospace of arcade machines, defined by log-transformed CPU speed and ROM size. (b) The Shooter genre ( $N = 3{,}261$) diversified into multiple subgenres, occupying both overlapping and distinct regions of the morphospace. (c) The Driving genre (N = 849) evolves into high-complexity regions, exemplified by multi-chip systems such as Outrun. Two density peaks in the Shooter genre reflect separate waves of game popularity: (d) Clone-dominant Shooters—such as Missile Command (inset) and Space Invaders—concentrate in lower-performance regions; (e) Gun-Based Shooters—such as Operation Wolf —shift toward higher ROM and CPU specifications, incorporating 3D graphics and immersive mechanics. Discontinuous trend lines indicate scaling relationships between CPU speed and ROM size, with niche-specific exponents (see Section 3.2).

Across the full arcade dataset, we observe a consistent power-law relationship between CPU speed (S) and ROM size (M):
 \begin{equation}
S \sim M^a,
\end{equation}
\begin{equation}
S \sim M^a,
\end{equation}where the exponent a quantifies how increases in memory capacity scale with processing requirements. If demands grew proportionally, we would expect a ≈ 1. Instead, we find superlinear scaling across the dataset, with a global exponent of a = 2.3, indicating that larger ROMs——enabling richer content and compelling gameplay—typically generally required disproportionately faster CPUs to maintain performance.
The morphospace breakdown by genre and subgenre (Figure 4) reveals how these scaling exponents vary depending on gameplay mechanics. For example, Driving games—characterised by real-time physics, 3-D perspective changes, and custom hardware—show the steepest scaling (a = 2.75, Figure 4c), reflecting their high processing demands. Shooter games, in contrast, span a broad morphospace, enabled by their reliance on modular sprite-based rendering. They exhibit more moderate scaling (a = 2.28, Figure 4b), reflecting both diversity and standardisation within the category.
Within niches, we also detect distinct waves of innovation. In the Shooter genre, morphospace density plots reveal two such peaks. The first, in the late 1970s and early 1980s, includes early shooters such as Space Invaders (see Box 1). Many of these early titles were widely imitated—‘cloned’ in arcade parlance—and relied heavily on pre-rendered visuals and standardised hardware, in contrast to the technical experimentation that defined later Shooter subgenres. They display a flatter scaling exponent (a = 1.88, Figure 4d), suggesting constrained technical evolution. A second wave, spanning the late 1980s through the mid-2000s, features Gun-based shooters such as Operation Wolf, which embraced faster processors, novel input devices (e.g., light guns), and immersive audio-visual design. These games expanded into higher-performance regions of the morphospace and exhibit steeper scaling (a = 2.0, Figure 4e), indicative of more sustained innovation.
Taken together, these patterns show that arcade evolution was not driven solely by stylistic shifts but by trajectories through a landscape of material constraints. The scaling exponent in Equation 1 thus serves as a quantitative fingerprint of a genre’s technological path—distinguishing between strategies of reuse and replication versus those of experimentation and refinement.
4. Imitation, collaboration, and niche collapse
While the previous section explored how hardware constraints shaped genre viability through scaling dynamics, we now turn to the role of cultural and social mechanisms—particularly imitation, innovation, and collaboration—in determining long-term genre persistence or collapse (Henrich, Reference Henrich2016; Duran-Nebreda et al., Reference Duran-Nebreda, O’Brien, Bentley and Valverde2022; Vidiella et al., Reference Vidiella, Carrignon, Bentley, O’Brien and Valverde2022). As arcade technology advanced, cultural influences played a crucial role in shaping the evolution of genres, affecting not only the selection of games but also the way traits were combined, copied, or diminished over time.
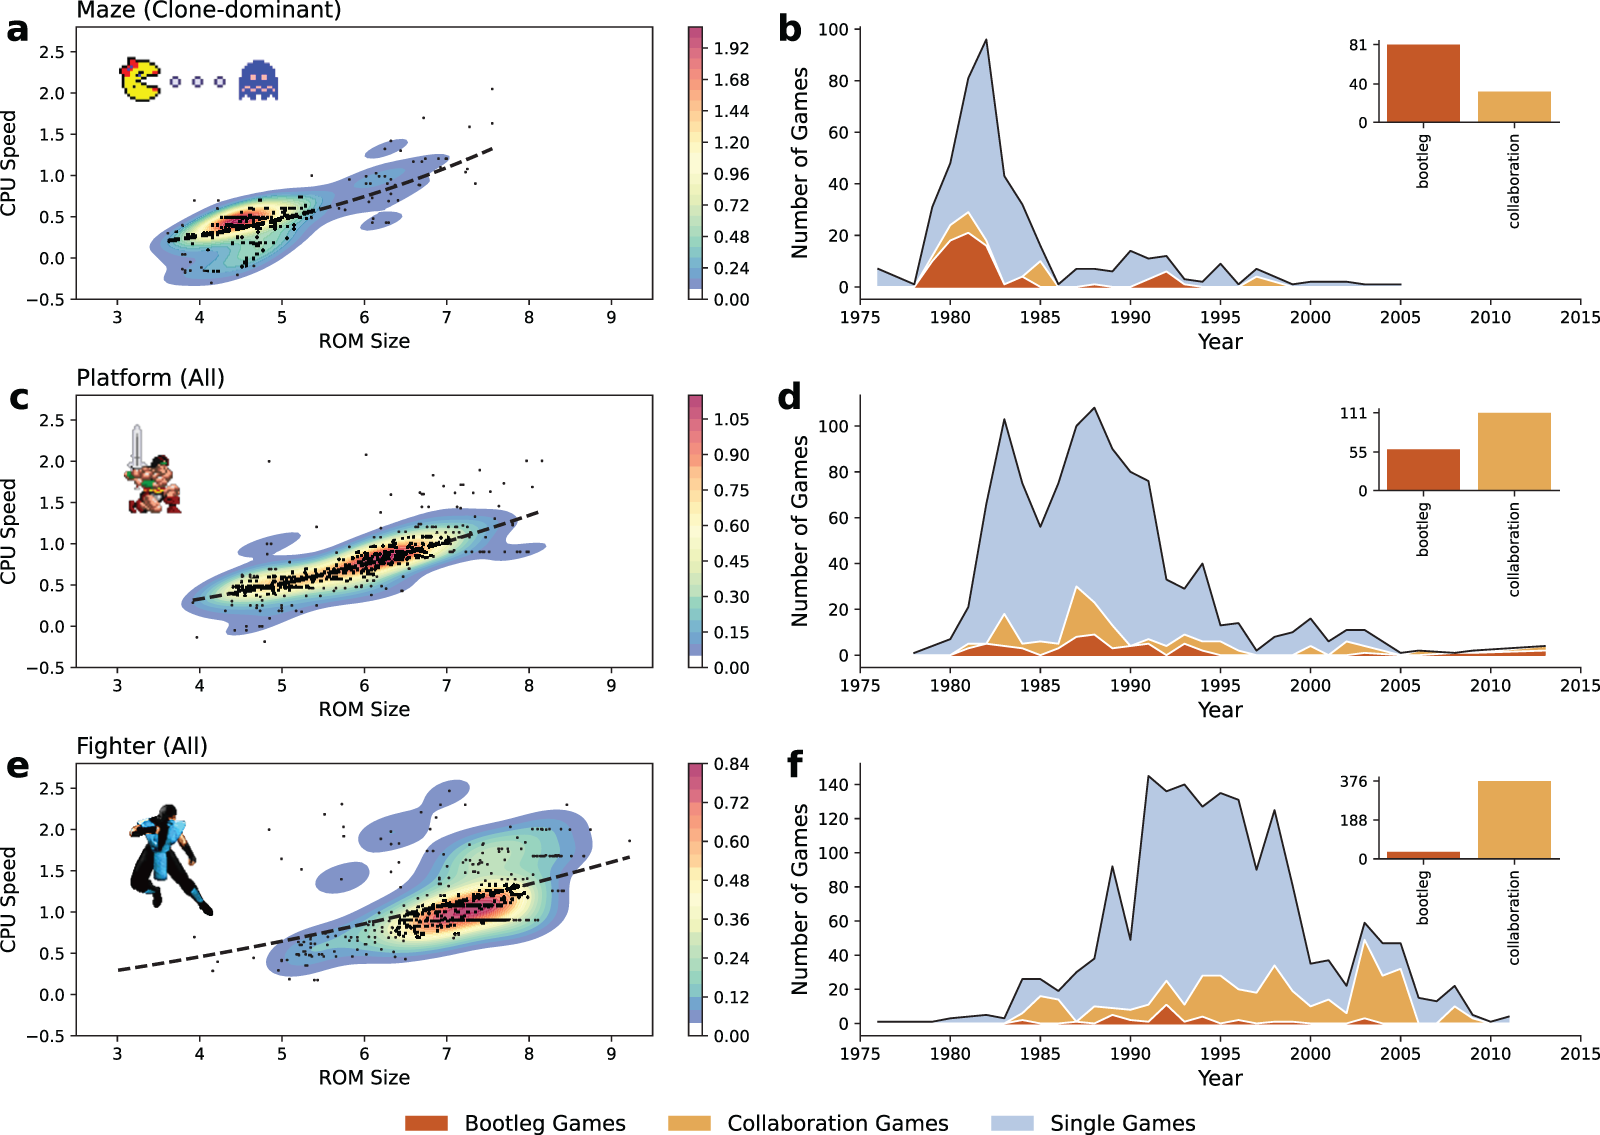
Figure 5 displays three case studies on Maze, Platform, and Fighter games, each demonstrating unique evolutionary results influenced by these cultural forces. Maze games, typified by Pac-Man (1980) (Kent, Reference Kent2010), reached a sharp peak in the early 1980s (Figure 5b). Platform games such as Rastan Saga (Taito, 1987) followed a slower, more gradual rise (Figure 5d), while Fighter games like Mortal Kombat (Midway, 1992) (Kocurek, Reference Kocurek2015) sustained growth well into the 1990s (Figure 5f).
Morphospace trajectories are shaped by the interplay of technological constraints, imitation, and collaborative innovation. Panels (a), (c), and (e) show the distribution of games within the morphospace for the Maze, Platform, and Fighter niches, respectively. The dashed lines indicate the fitted scaling relationship between log-transformed CPU speed (S) and ROM size (M), with exponents a = 2.5 (Clone-dominant Maze subgenres), a = 2.02 (Platform), and a = 1.55 (Fighter). Panels (b), (d), and (f) display the temporal distribution of game releases in each genre. The area under each curve represents the number of games released per year, with colour-coding indicating single-developer games (blue), bootlegs (brown), and collaborative productions (gold). Inset bar charts summarise the proportion of game types per genre, highlighting the prevalence of imitation versus collaboration.

Early Maze and Shooter subgenres of the 1980s were among the first to collapse under the weight of imitation. Landmark titles like Pac-Man and Space Invaders triggered a flurry of derivative development, spawning dozens of material clones and functional bootlegs (Markoff, Reference Markoff1981). This overproduction led to design redundancy and reduced trait diversity, undermining these genres’ capacity for sustained innovation. Maze subgenres such as Driving, Collect, Shooter Small, and Outline exhibited particularly high bootleg prevalence (Figure 5b, inset), suggesting that copying became the dominant mode of transmission. These trends lend support to the ‘dilution of expertise’ hypothesis, where excessive copying without significant innovation results in cultural stagnation and eventual collapse (see Box 2).
The dilution of expertise hypothesis
A central hypothesis in our study is that excessive imitation, when not balanced by innovation or recombination, destabilises cultural systems. Known as the dilution of expertise hypothesis (Duran-Nebreda et al., Reference Duran-Nebreda, O’Brien, Bentley and Valverde2022), this idea models stagnation and collapse across creative industries. When imitation outpaces a system’s capacity to generate or integrate new traits, expertise becomes diluted. New entrants replicate existing solutions without fueling the recombination that drives long-term innovation. Trait diversity saturates, performance plateaus, and the system enters decline.
In our arcade dataset, we approximate this shift using two indicators: the number of bootleg games (unauthorised clones or direct copies) and the number of collaborative games (co-productions between developers, licensors, or distributors). A genre is considered in collapse when bootlegs exceed collaborative projects over time—signalling a transition from recombination to stagnation, as observed in the decline of early Maze (Figure 5a) and Shooter (Figure 4d) subgenres.
To formalise this process, we can study a simple mathematical model in which trait diversity V(N) depends on the balance between imitation and collaboration. Let B(N) and C(N) be the cumulative number of bootleg and collaborative games. Then:
 \begin{equation*}
\frac{dV}{dN} = \alpha \left(1 - \frac{B(N)}{B(N) + C(N)}\right)^\beta \sim \left( \frac{C(N)}{B(N) + C(N)}\right)^\beta
\end{equation*}
\begin{equation*}
\frac{dV}{dN} = \alpha \left(1 - \frac{B(N)}{B(N) + C(N)}\right)^\beta \sim \left( \frac{C(N)}{B(N) + C(N)}\right)^\beta
\end{equation*} Here, α is the baseline innovation rate, and  $\beta \geq 1$ controls sensitivity to imitation. When bootlegs dominate, the imitation ratio $B/(B+C)$ approaches 1, suppressing diversity growth. When collaboration prevails, diversity increases steadily.
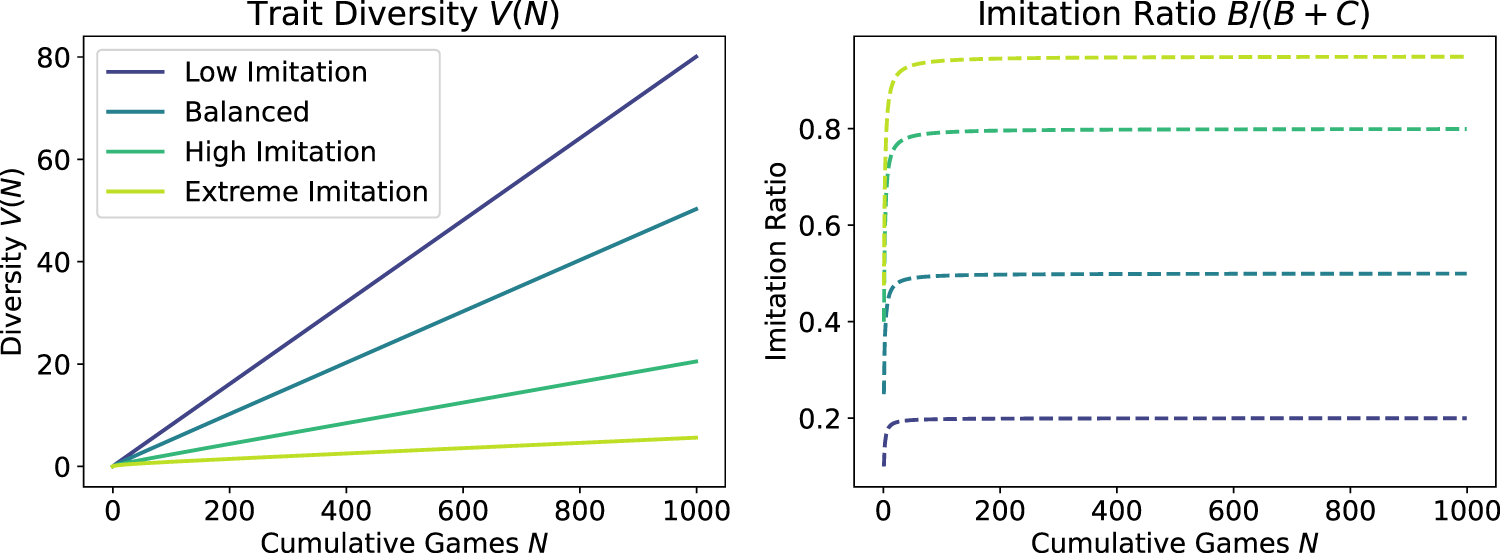
Computer simulations of this basic model capture how cultural diversity responds to shifting imitation regimes (see Figure 6). In ‘Low Imitation’ scenarios, diversity grows almost linearly. As bootlegging and imitation rise, diversity slows and eventually plateaus—reflecting cultural collapse. This dynamic could help explain why genres like Fighter and Driving games sustained innovation: not via sheer volume but through recombination of diverse expertise.
Simulated trait diversity and imitation ratio dynamics. Left: trait diversity V(N) under varying imitation-to-collaboration regimes. Right: imitation ratio  $B / (B + C)$ over time. In high imitation scenarios, diversity saturates rapidly.

Broader structural forces exacerbated this imitation-driven cultural collapse (Duran-Nebreda et al., Reference Duran-Nebreda, O’Brien, Bentley and Valverde2022). In 1983, a home console crash and the arcade industry downturn were system-wide failures caused by unsustainable early innovation. A feedback loop between arcades and home consoles destabilised the market: Platforms like the Atari 2600 (Montfort & Bogost, Reference Montfort and Bogost2009) and NES (Altice, Reference Altice2015) eroded arcades’ technological edge, while declining game quality and shifting consumer expectations accelerated the migration of both players and developers to home consoles. In contrast, many arcade Fighter games were multi-firm projects in the 1990s (Figure 5f), where networks of collaboration brought together developers, manufacturers, and even players to facilitate sharing of information and drive innovation under growing competition.
The scaling of technology both influenced and restricted the evolutionary possibilities of arcade niches in unique ways. We use the exponent from Equation 1 to capture niche-specific technological trends—linking ROM size and CPU speed as a proxy for hardware-driven design complexity. Although all three genres in Figure 5 show power-law scaling in CPU speed and ROM size, they have different exponents. Maze games show steep scaling (a = 2.5), pushing technical limits—for example, the computational demands of sprite management and AI pathfinding—but did not sustain novelty (Figure 5a). By contrast, the computational demands of Fighter games scaled more modestly (a = 1.55), suggesting steady innovation focused on gameplay refinement, such as prioritising fluid input responsiveness and rich character animations rather than brute-force processing throughput (Figure 5e).
Overall, arcade trends unveil a macroevolutionary process: niches did not simply decline in popularity but collapsed due to imitation limiting their innovation potential. Resilient niches, on the other hand, succeeded not just by producing new variants but by channelling novelty into cumulative innovations—through refinement, trait recombination, and coordinated exploration. In robust cultural evolution, it is not the volume of novelty that matters—but how it is organised.
5. Avoiding collapse through combinatorial innovation
In this section, we explore how recombination enabled resilient niches to explore their morphospace more effectively—through increased trait diversity. Combinatorial innovation is not only technical but also cultural, emerging most readily in niches where collaboration was strongest (as suggested in Section 4). Interactions among manufacturers, developers, and players provided the organisational infrastructure needed to mix, adapt, and refine cultural and technological traits across arcade genres.
To study the link between collaboration and innovation, we analyse the temporal diversity of two core technological traits—ROM size and CPU clock speed—across a range of arcade niches. As shown in Figure 7, we track the accumulation of unique ROM and CPU configurations, denoted V(N), as a function of the total number of games N in each genre. Following established models (Egghe, Reference Egghe2007), we expect trait diversity to follow a power-law relationship (see Box 2):
 \begin{equation}
V(N) \sim N^{b}
\end{equation}
\begin{equation}
V(N) \sim N^{b}
\end{equation}Scaling of trait diversity in collapsing (left column) and diversifying (right column) arcade genres. Panels (a) and (c) show the sublinear accumulation of unique ROM and CPU configurations in Maze (Figure 5a) and Shooter (Figure 4d–e) subgenres, consistent with low scaling exponents (b < 0.4) and limited design exploration. Panels (b) and (d) show that Fighter, Platform, and Driving games achieved higher trait diversity with increasing game output, reflecting sustained recombination and innovation. Dashed lines represent the fitted power-law relationship between trait diversity (V(N)) and the total number of games (N), with exponents b indicating genre-specific evolutionary potential (see Section 5 ).

where the exponent b serves as a signal of evolutionary potential. Sublinear values (b < 0.5) indicate redundancy and limited exploration, while linear or superlinear scaling ( $b \geq 1$) reflects ongoing innovation under a combinatorial regime.
This scaling framework suggests the collaboration mechanisms that enabled niches to withstand the broad decline of arcades in the 1980s, subsequently thriving during their revival of the 1990s. Maze and Shooter games were early commercial hits; however, several of their subgenres showed a high sublinear rise in trait diversity (b ≈ 0.28-0.36), suggesting imitation-driven collapse. Despite continued video game production, a lack of novel gameplay and technical variation led to player fatigue and genre stagnation. Bootlegging and imitation—previously identified as a contributor to collapse (Figure 5)—accelerated these trends by disincentivising experimentation.
Not all subgenres followed the same trajectory. Within Shooter games, for instance, the Aerial Combat subgenre (see Appendix B) maintained higher CPU diversity (b ≈ 0.69), avoiding collapse through innovations in scrolling mechanics, enemy AI, and free movement. This case shows that access to improved hardware was not sufficient on its own—what mattered was the ability to recombine existing gameplay elements into meaningful new forms (Arthur, Reference Arthur2009; Juul, Reference Juul2011; Koppl et al., Reference Koppl, Gatti, Devereaux, Fath, Herriot, Hordijk, Kauffman, Ulanowicz and Valverde2023).
By contrast, niches such as Fighter, Platform, and Driving sustained innovation through collaboration and shared development networks during the 1990s (see Box 3). Fighter games displayed the steepest increase in trait diversity (b ≈ 1.54–1.94), integrating innovations across hardware, animation, and input mechanics. This pattern suggests a process of combinatorial innovation, in which existing elements were reassembled into novel configurations—enabled in part by collaborative design practices and interoperable platforms. Platform and Driving games followed with moderate-to-high values (b ≈ 0.98–1.34), suggesting distinct but viable innovation strategies: Platformers emphasised gameplay mechanics and interactive environments, while Driving games pushed realism through technical advances in vehicle physics and AI complexity.
Recombination and collaboration networks fostered arcade resilience
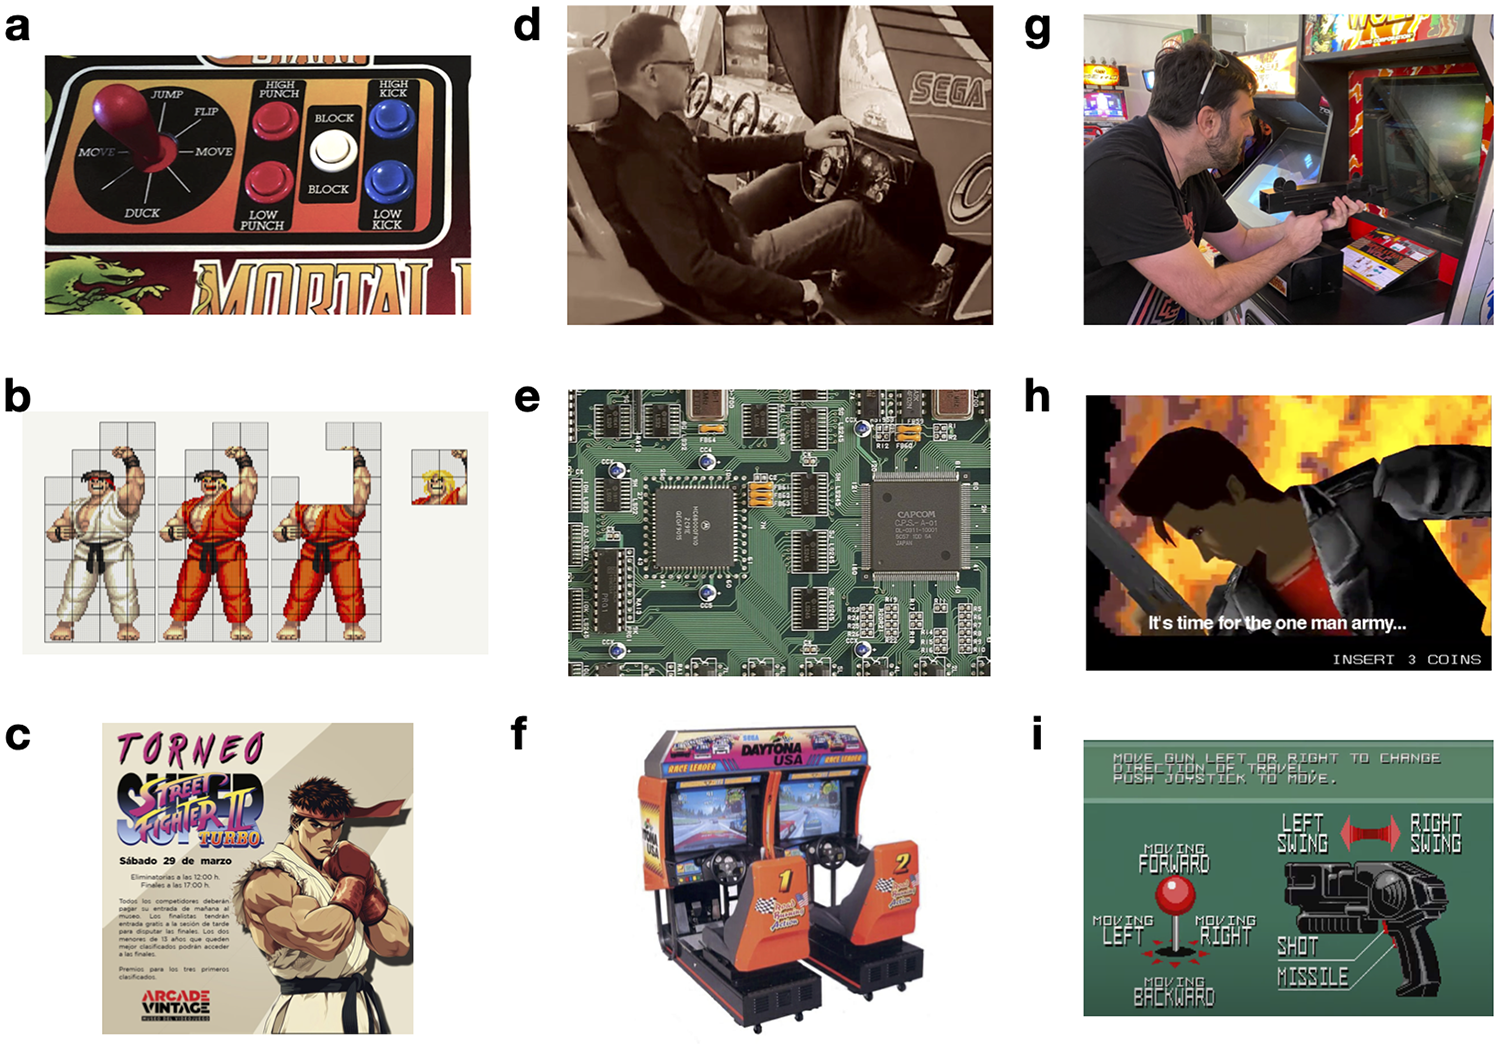
The arcade industry underwent a renovation during the 1990s. Following the saturation and collapse of early Maze and Shooter subgenres, new games emerged that successfully integrated hardware advances, gameplay mechanics, and cultural practices. These arcade machines did not merely upgrade components; they redefined the structural and aesthetic logic of arcade entertainment. Three genres—Fighter/Versus, Driving/Racer, and Shooter/Gun—exemplify this transition. Each occupied a distinct region of morphospace with specific configurations of CPU speed, ROM capacity, and peripheral technologies (Figure 8). Their success was grounded in combinatorial innovation, supported by collaboration networks that spanned technical and organisational domains.
Gameplay and hardware innovations in the 1990s. Left: Fighter/Versus games: (a) six-button input layout enabled complex combos; (b) Capcom’s graphics pipeline supported large sprite animation and efficient storage; (c) tournament culture reinforced mastery and prestige. Middle: Driving games: (d) realistic analog controls enhanced immersion; (e) multi-board CPU systems supported real-time graphics and complex physics simulation; (f) networked cabinets enabled multiplayer racing. Right: Shooter/Gun games: (g) light-gun input introduced physical targeting; (h) cinematic pacing blended action and narrative; (i) branching level design promoted replayability.

Fighter/Versus games— exemplified by Street Fighter II (Capcom, 1991) and Mortal Kombat (Midway, 1992)—defined novel input schemes, character-specific move sets, and complex combo mechanics. This genre also advanced by cultivating competitive communities, tournament circuits, and enduring brands. Hardware innovations centre on Capcom’s CPS-1 and CPS-2 boards, which enabled larger ROM footprints and advanced sprite handling, accommodating diverse character libraries and layered visual effects.
Driving games, such as Daytona USA (Sega, 1994), introduced immersive control systems including force-feedback steering and analogue pedals, all housed in modular cabinet designs. These setups relied on high CPU throughput and multi-board architectures to manage real-time physics, graphics, and audio independently. Networked cabinets supported synchronous multiplayer gameplay, reinforcing both immersion and competitive replayability.
Shooter/Gun games, including Time Crisis (Namco, 1995), extended the arcade shooter lineage through cinematic pacing, light-gun peripherals, and immersive cabinet enclosures. Operation Gunbuster (Taito, 1992) introduced replayability through a departure from the on-rails format, offering free-roaming, first-person movement. This spatial freedom enabled branching level design and emergent exploration—mechanics that would later influence hybrid arcade–FPS formats.
Across all three genres, long-term viability was driven by creative recombination—the integration of heterogeneous traits spanning hardware platforms, gameplay mechanics, and social networks. These arcade genres illustrate how innovation and collaboration enabled their persistence as complex cultural-technological assemblages, despite shifting market pressures and technological constraints.
These findings reinforce the deeply path-dependent nature of cultural and technological evolution: Once a niche becomes entrenched in an imitative regime, its capacity to innovate—and survive—is sharply reduced. Niches with low b values are geometrically restricted (i.e., “canalysed”) in morphospace, confined to narrow corridors of viable configurations defined by underlying trait-scaling constraints (see Appendix C). What may appear as steady technical progress can, in fact, mask a hidden contraction in the diversity of design options—a signature of trait canalisation that links cultural collapse to structural constraint.
6. Discussion
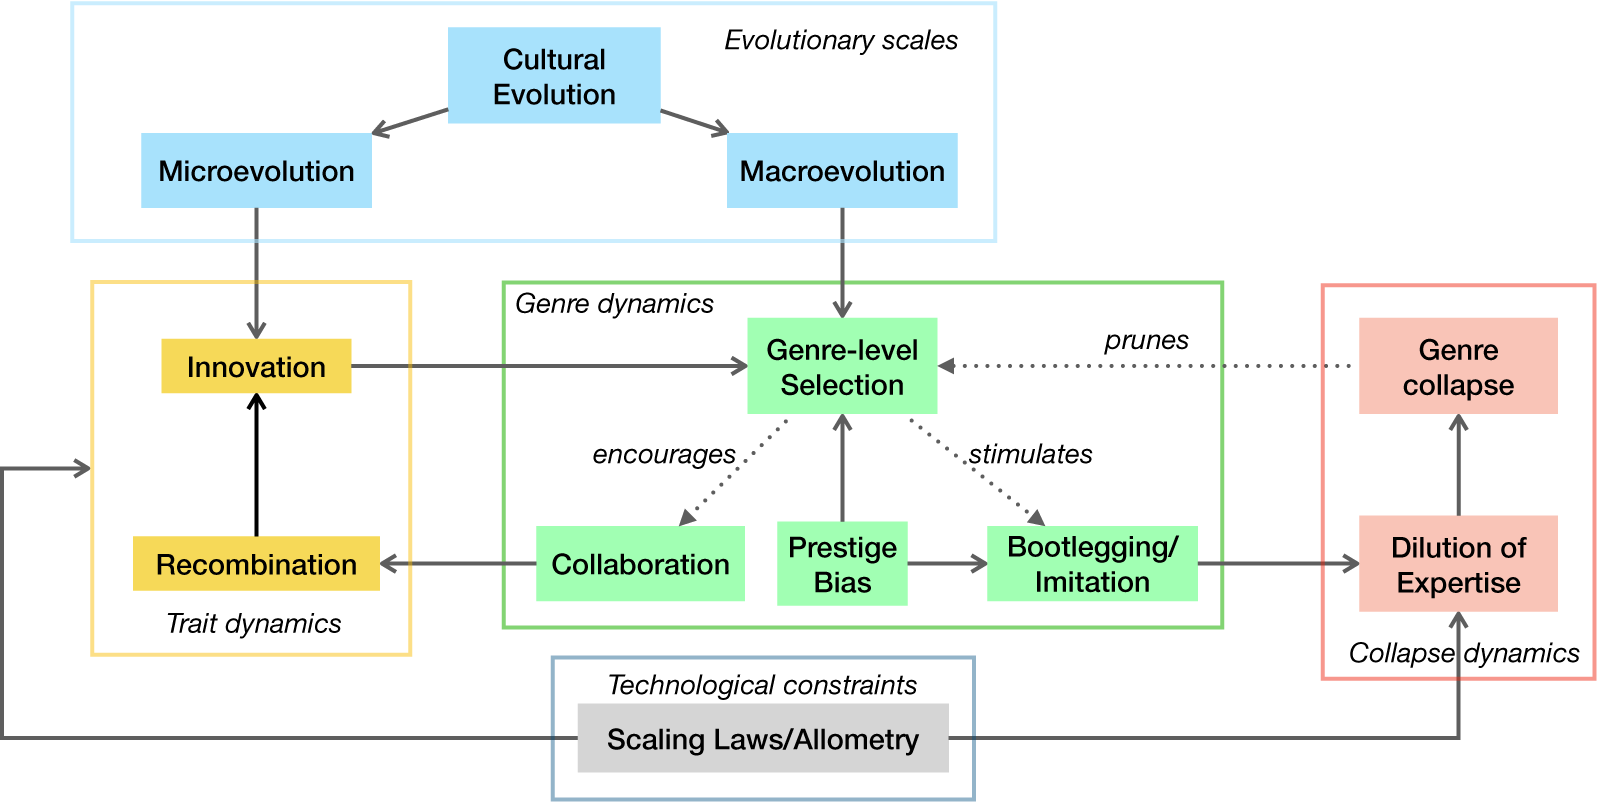
Understanding how and why cultural traits persist, diversify, or disappear is central to cultural evolution research (Zhang & Mace, Reference Zhang and Mace2021; Enquist et al., Reference Enquist, Jansson, Ghirlanda and Michaud2024). The case of arcade video games—rich in technical constraints, cultural feedback, and aesthetic conventions—offers a powerful model system for studying how innovations emerge, stabilise, or collapse under selective pressure. Figure 9 synthesises our findings into a multi-scale framework of arcade game evolution, highlighting feedback loops between trait-level dynamics, genre-level selection, and the broader cultural ecology. Rather than a linear process, genre persistence emerges through multi-level interactions shaped by the interplay of technological constraints and social reinforcement.
A multi-scale framework for cultural evolution in arcade games. Genres are modelled as higher-level cultural-ecological units that mediate between innovation, persistence, and collapse across four interacting domains: (1) Trait Diversification (gold, left) captures microevolutionary novelty via innovation and recombination; (2) Genre Dynamics (green, centre) represent macroevolutionary reinforcement, niche structuring, and selection; (3) Collapse Dynamics (red, right) reflect the erosion of genre integrity through imitation and dilution of expertise; (4) Technological Constraints (grey, bottom) ground the system through scaling laws that constrain viable innovations. Solid arrows indicate causal influences; dotted lines denote feedback and filtering. Together, these processes illustrate how multi-scale feedback loops shape cultural evolution in arcade games (see Discussion).

6.1. Trait diversification: Innovation, scaling, and modularity
At the microevolutionary level, arcade novelty emerged from the interaction between innovation, recombination, and technical feasibility. As shown in the left (gold) portion of Figure 9, two major forces shaped trait diversification: hardware constraints and creative reuse. Innovations in animation fluidity, control responsiveness, or AI behaviour were tightly bound by CPU speed and ROM size. These parameters defined not just the limits of performance but the design space itself – what could be rendered, stored, or executed at the time.
Our analysis reveals that arcade evolution followed robust scaling laws between CPU and ROM capacity (Equation 1), suggesting that constraints were not merely limits but structuring forces. These scaling relationships resemble biological allometries (West et al., Reference West, Brown and Enquist1997; Brown et al., Reference Brown, Gillooly, Allen, Savage and West2004), where functional traits co-vary along developmental axes (Gould, Reference Gould1974; Evans et al., Reference Evans, Pollock, Cleuren, Parker, Richards, Garland, Fitzgerald, Wilson, Hocking and Adams2021). In cultural systems, such allometric relationships can induce canalisation—restricting trait variation along a constrained manifold despite underlying diversity.
Despite these constraints, creativity can thrive through reuse. Designers frequently hybridised existing mechanics, forming novel gameplay configurations from prior templates. This reflects how cultural change, unlike genetic mutation, often proceeds through the recombination of known elements (Boyd & Richerson, Reference Boyd and Richerson1988; Valverde & Solé, Reference Valverde and Solé2015; Koppl et al., Reference Koppl, Gatti, Devereaux, Fath, Herriot, Hordijk, Kauffman, Ulanowicz and Valverde2023).
6.2. Genre dynamics: Selection, prestige bias, and collaboration
While trait-level innovation occurred locally, long-term viability was determined at the genre level. Genres acted as higher-order cultural entities that filtered and stabilised viable traits. As shown in the central (green) portion of Figure 9, genre categories did not emerge solely from gameplay mechanics but from a combination of community recognition, industrial reinforcement, and narrative framing (Therrien, Reference Therrien2015).
In this framework, genres resemble ‘species’ in biological macroevolution (Stanley, Reference Stanley1975; Eldredge, Reference Eldredge1979): They define selective regimes and constrain novelty. Genres with strong social networks—such as Fighter games, supported by tournaments, social visibility, and co-development—exhibited greater resilience. These genres accrued prestige and cultural capital, becoming entrenched through player endorsement and competitive play (Henrich & Gil-White, Reference Henrich and Gil-White2001; Kocurek, Reference Kocurek2015).
Conversely, niches dominated by imitation but lacking collaboration were more vulnerable to collapse. Bootlegging, while initially facilitating diffusion, ultimately eroded genre integrity by flooding the ecosystem with redundant and lower-quality clones—a process we describe as ‘dilution of expertise.’ This phenomenon, highlighted in Table 1, is not just a social effect but also the downstream outcome of scaling-induced constraints on trait diversity (see Figure 9).
Comparative analysis of arcade game niches, examining imitation, the role of collaboration, and scaling exponents a (technical complexity) and b (trait diversity). Low b values indicate redundant designs, while high b values reflect sustained diversification. Successful niches avoided cultural collapse through creative recombination and collaborative openness, rather than solely increasing technical capacity

6.3. Collapse dynamics and feedback loops: Dilution, stagnation, and reemergence
Genre collapse often resulted not from technological obsolescence but from ecological saturation and cultural exhaustion. As illustrated in the right (red) portion of Figure 9, early Maze and Shooter games underwent rapid proliferation followed by stagnation and decline—a rise-and-fall pattern typical of reduced innovation. Once a design space was thoroughly explored, novelty diminished and attention shifted elsewhere.
This collapse was frequently compounded by low collaboration. Our analysis of team metadata shows that genres with more collaborative projects sustained higher trait diversity and longer persistence. In contrast, genres dominated by isolated or bootleg production showed reduced innovation and faster decline. Cultural niches can fail not only due to underperformance but also due to overexposure and creative fatigue.
Importantly, cultural collapse was not always terminal or irreversible. Several subgenres, such as multidirectional shooters (e.g., Gun Fight), reemerged decades later, often facilitated by new technologies and cultural shifts (Qin et al., Reference Qing, Ferrara, Radicchi and Flammini2015). This resembles latent developmental pathways in biology (Barnett et al., Reference Barnett, Meister and Rainey2025) and macroevolutionary patterns observed in both biological and cultural systems (Duran-Nebreda et al., Reference Duran-Nebreda, Bentley, Vidiella, Spiridonov, Eldredge, O’Brien and Valverde2024).
6.4. Synthesis: Cultural evolution beyond games
Bringing these dynamics together, Figure 9 presents a conceptual model in which traits, genres, constraints, and collapse interact across multiple scales. Trait innovation arises through recombination and technical feasibility; genres filter and reinforce viable forms; collapse results from oversaturation or dilution of expertise. These components interact through recursive feedback loops: Bottom-up innovation reshapes genres, which in turn constrain future developments.
At the centre of our macroevolutionary framework is the concept of genre—not as a static category, but as a culturally constructed niche shaped by interaction among developers, players, infrastructure, and markets. Rather than fixed taxonomies, we treat genres as evolving macro-units, comparable to geobiomes or paleobiological systems defined by temporal and ecological boundaries (Spiridonov & Eldredge, Reference Spiridonov and Eldredge2024). Genres maintain coherence through constraint and recombination, even as their internal configurations shift over time.
In cultural macroevolution (Mesoudi, Reference Mesoudi2011; Turchin & Gavrilets, Reference Turchin and Gavrilets2021), higher-order cultural forms—like styles, traditions, or technological paradigms—shape the evolutionary landscape of lower-level traits. Under theories of downward causation (Tëmkin & Eldredge, Reference Tëmkin and Eldredge2007), emergent structures guide the viability of their parts. In arcade evolution, genres served this role, influencing which traits were retained, recombined, or abandoned.
Similarly, Cultural Attraction Theory (CAT) (Sperber, Reference Sperber1996; Claidière et al., Reference Claidière, Scott-Phillips and Sperber2014) emphasises the constructive nature of cultural transmission. According to CAT, the stability of cultural traits can arise not through faithful copying, but through recurrent transformation that converges probabilistically on preferred forms. These “cultural attractors” represent statistical regularities in the cultural landscape, shaped by psychological, contextual, and ecological biases.
While our model shares CAT’s focus on how convergence shapes cultural form, the arcade ecosystem reveals a contrasting dynamic: Under conditions of high constraint and market saturation, excessive fidelity—rather than transformation—can become maladaptive. Genres can collapse through the proliferation of clones and lost distinctiveness. In certain morphospaces, imitation is not merely insufficient (as CAT proposes), but can actively undermine diversity and resilience.
Arcade games, then, offer more than nostalgia or entertainment—they provide a model for how cultural evolution unfolds under constraint, hierarchy, and feedback. The fragility of imitation, the resilience of modularity, and the structuring role of genres are patterns that recur across domains—from software to science. By formalising these dynamics, we move toward a general theory of cultural macroevolution—one that accounts not just for the tempo and mode of innovation but for the architecture that sustains it.
Supplementary material
The supplementary material for this article can be found at https://doi.org/10.1017/ehs.2025.10015.
Acknowledgements
We thank our colleague Josep Sardanyés for his critical review of our article and the technical assistance of Eduardo Arancibia, José María Litarte, and Juan Carlos Pastor from the Arcade Vintage Museum (Ibi, Alicante, Spain) and Tomás García-Merás (Recreativas.org).
Author contributions
S. V., A. S. and R. A. B. conceptualised the study. S. V. developed the methodology and curated the dataset. B. V. and S. V. handled data visualisation. S. V., R. A. B. and A. S. contributed to writing. All authors reviewed and approved the final submitted draft.
Financial support
S. V. was supported by the grant PID2020-117822GB-I00, funded by the Ministerio de Ciencia, Innovación y Universidades (MICIU) / Agencia Estatal de Investigación (AEI) / 10.13039 / 501100011033. A. S. was supported by the grant S-MIP-24-62 BretEvoGeneralized.
Competing interests
The Authors S. V., B. V., A. S. and R. A. B. declare no competing interests.
Research transparency and reproducibility
All data processing scripts, model code, and analysis notebooks used in this study are publicly available in the GitHub repository: https://github.com/svalver/arcade-macroevolution. This includes scripts to reproduce all main text and supplementary figures, as well as the complete scaling table of genres and subgenres. To ensure reproducibility and long-term preservation, an archived version of the repository has been deposited in Zenodo and is accessible at https://doi.org/10.5281/zenodo.17079589.
Data availability statement
The dataset analysed in this study was derived from metadata collected through the MAME project (https://www.mamedev.org), an open-source emulator dedicated to preserving the history of arcade video games. The curated dataset used in our analysis—including game traits, genre structure, and collaboration labels—is available in CSV format in our GitHub repository at https://github.com/svalver/arcade-macroevolution. An archived version of this dataset is also available through Zenodo at https://doi.org/10.5281/zenodo.17079589.
Appendix A. Glossary of Key Terms

Appendix B. Arcade Video Game Dataset
The Multiple Arcade Machine Emulator (MAME) is an open-source project dedicated to preserving the history of arcade games by emulating a wide range of legacy hardware systems. Originally designed for accurate hardware emulation, MAME has evolved into a comprehensive public archive containing metadata on thousands of machines, including information on game titles, manufacturers, release years, hardware configurations, and gameplay genres (MAME, 2023). The dataset includes 7,205 unique game titles. However, because some games involved multiple firms (e.g., in licensing or regional distribution), the full dataset contains 7,822 firm–game entries. This reflects a bipartite network between developers and games, with each edge corresponding to a collaborative relationship. All diversity and scaling analyses are based on de-duplicated game entries unless stated otherwise.
To construct our arcade game dataset, we extracted game records from MAME’s internal database by generating an XML dump of all available entries. This file can be created using the following command:
We developed a custom Python parser to process this file. For each game, we retrieved metadata such as title, manufacturer, release year, ROM size (bytes), and CPU clock speed (Hz). To facilitate evolutionary and macro-level analysis, these continuous variables were log-transformed. In parallel, genre information (main and sub-category) was obtained from external community-maintained classification files – specifically catver.ini and category.ini – which are periodically updated by MAME contributors and curatorial groups such as ArcadeItalia and MAMEUI. These files reflect a retrospective, crowd-sourced consensus about genre classification, developed over decades of community curation and gameplay documentation. Our analysis focused on games belonging to seven core genres: Arcade, Shooter, Platform, Fighter, Driving, Maze, and Ball & Paddle. We excluded entries marked as ‘hack’ to ensure that only officially released games contributed to our tree and diversity metrics.
These classifications are inherently historical rather than theoretical in nature. Following Todorov’s distinction (Todorov, Reference Todorov1975), the genre categories used here are best understood as historical genres – emerging through retrospective interpretation and collective usage – rather than theoretical genres defined by formal gameplay rules or design taxonomies. The classification system embedded in MAME is the outcome of ongoing interactions among a heterogeneous community that includes players, arcade historians, emulation software developers, and preservation practitioners. As such, these labels do not reflect a universal taxonomy established at the time of release, but rather a socially constructed, evolving scaffold that structures collective memory and supports systematic comparison across decades of arcade game development.
While we preserve the original main and sub-genre classifications from the community files without alteration, we introduce one analytical coarse-graining step to define the ‘Shooter / Aerial Combat’ group, which combines six closely related subcategories. This grouping, used exclusively in Figures 7b and 7d to enhance the statistical fit of diversity curves, does not alter the underlying dataset and is defined explicitly in the source code as:
where the category id’s correspond to the Shooter subgenres ‘Flying’ (0), ‘Flying Diagonal’ (52), ‘Flying Vertical’ (21), ‘Flying Horizontal’ (26), ‘Flying 1st Person’ (14) and ‘Flying (chase view)’ (47).
We reconstruct a genre tree by interpreting the main and sub-genre labels as a branching structure that reflects the diversification of gameplay mechanics over time. While the XML file itself does not define this structure, we use the earliest known appearance of each subgenre to order the tree temporally. The resulting visualization (Figure 1) is not a genealogical tree in the biological sense, but a heuristic representation of gameplay differentiation, consistent with models of cultural and technological evolution. It allows us to analyse patterns of niche expansion, genre saturation, and the long-term persistence of arcade game forms.
Appendix C. Trait Canalization in Tecnological Morphospaces
Innovation in cultural systems takes place within structured morphospaces where some directions are more accessible than others due to technological, economic, or historical constraints. In arcade video games, two key hardware traits – ROM size (M) and CPU speed (S) – co-evolved under a scaling law of the form  $S \sim M^a$ (Equation 1). This empirical relationship, analogous to biological allometries, defines a constrained surface within the larger design space of possible arcade configurations.
At the same time, the observed diversity of these traits across games within a given niche scales with output volume. That is, the number of unique ROM values,  $V_M(N)$, and unique CPU values, $ V_S(N)$, both tend to follow power-law relationships of the form:
 \begin{equation*}
V_M(N) \sim N^{b_M}, \quad V_S(N) \sim N^{b_S}
\end{equation*}
\begin{equation*}
V_M(N) \sim N^{b_M}, \quad V_S(N) \sim N^{b_S}
\end{equation*}where N is the number of games and  $b_M, b_S \in [0,1]$ are scaling exponents that quantify the rate at which diversity in each trait accumulates. Low exponents (e.g., b < 0.4) indicate stagnation or repetition, while values closer to 1 reflect ongoing exploration and recombination. Figure 7 in the main text illustrates these dynamics across several arcade subgenres.
The interplay between the two scaling relations – one describing the geometric constraint  $S \sim M^a$, the other capturing how each trait diversifies with N – reveals a deeper dynamic of constraint amplification. To see this, suppose ROM values diversify as $V_M(N) \sim N^{b_M}$, and CPU speed is determined entirely by ROM via the scaling law $S = k M^a$. Because this mapping is deterministic and monotonic, each distinct ROM value corresponds to a unique CPU value, implying $ V_S(N) \sim V_M(N)$.
Taking logarithms of both sides of the scaling law, we obtain  $\log S = \log k + a \log M$, so the spread of CPU speeds is linearly proportional to the spread of ROM values, scaled by the exponent a. It follows that:
 \begin{equation*}
b_S \sim a \cdot b_M
\end{equation*}
\begin{equation*}
b_S \sim a \cdot b_M
\end{equation*}This result implies a constraint on how rapidly CPU diversity can grow, given the pace of ROM diversification and the steepness of the scaling curve. In collapsing niches, where ROM diversification is slow ( $b_M \ll 1$), even a relatively steep scaling exponent a cannot prevent trait space from becoming narrowly canalized.
We use ‘canalization’ here in an extended sense: originally introduced in developmental biology and later formalized in complex systems theory (Kauffman, Reference Kauffman1969), canalization describes how systemic constraints suppress sensitivity and guide trajectories toward stable or limited outcomes. In our context, it means that evolutionary trajectories through arcade morphospace – while technically improving – may become geometrically confined, with limited exploration across orthogonal trait dimensions. In other words, even as hardware performance grows, design diversity shrinks.
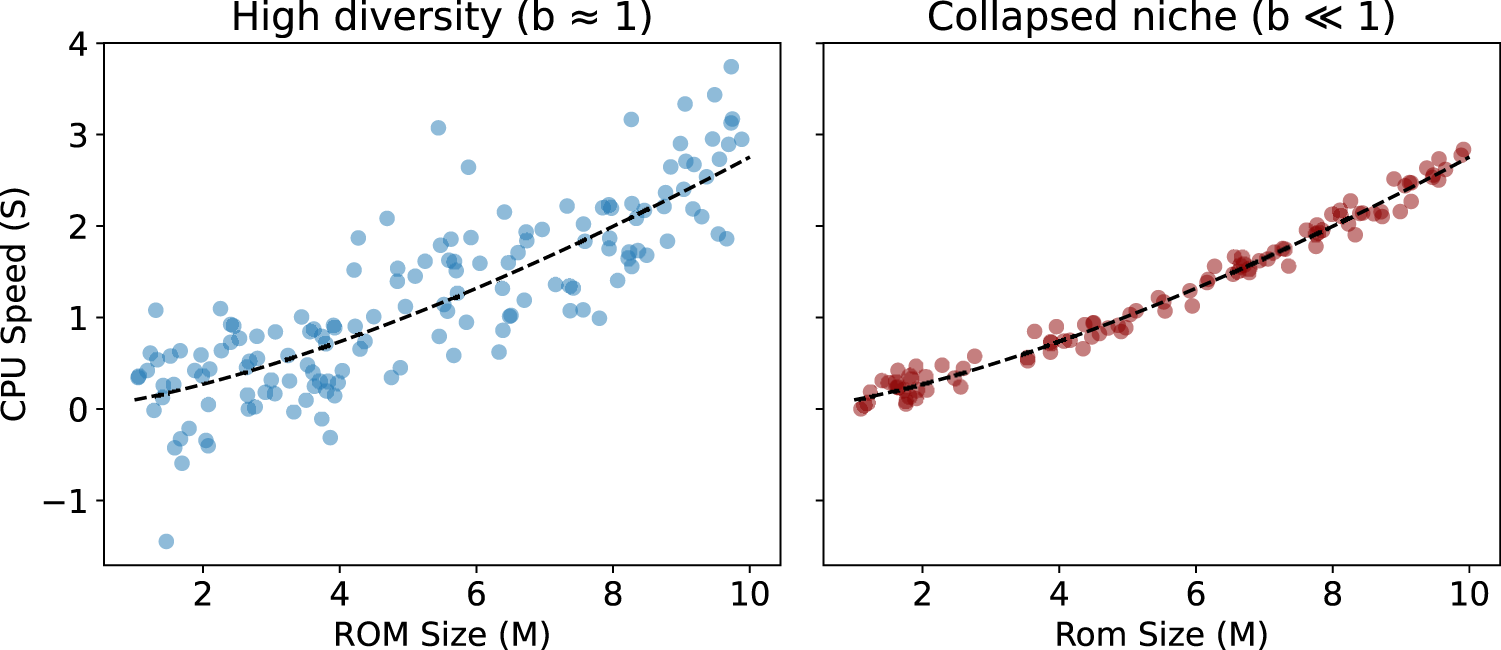
Figure C1 illustrates how different diversification regimes map onto the structure of the arcade hardware space. High-diversity niches scatter broadly around the scaling curve, exploring both its trajectory and its neighbourhood. Collapsing niches instead trace the curve tightly, with minimal variation. What may appear as steady technological progress can thus mask an underlying constraint in design possibilities.
Trait canalization in arcade morphospace. Theoretical morphospace illustrating the effect of scaling constraints on niche trajectories. The dashed curve represents the scaling law 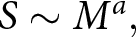 $S \sim M^a,$ defining the feasible region of hardware configurations (CPU speed vs. ROM size). In high-diversification regimes (left panel), niches explore a broad area around the scaling law. In collapsing niches (right panel), diversification slows and trajectories become canalized along the curve, exhibiting limited variation in either dimension. This narrowing reflects the effect of low b exponents on trait-specific diversity, consistent with the bound $b_S \sim a \cdot b_M$ (see text). In all panels a = 1.44.







 Open access

