


1. Introduction
The unified model of active galactic nuclei (AGN) postulates the existence of ionisation bi-cones, delineating the narrow line region (NLR; Antonucci Reference Antonucci1993; Urry & Padovani Reference Urry and Padovani1995). Within the bi-cone, winds from the accretion disk are expected to be observed. Indeed, these conical-shaped structures were seen in early ground-based images (Wilson & Tsvetanov Reference Wilson and Tsvetanov1994). However, later, [O iii]λ5007 high-resolution narrow-band images obtained with the Hubble Space Telescope (HST) showed that the conical morphology is not as common as previously thought (e.g. Schmitt et al. Reference Schmitt, Donley, Antonucci, Hutchings, Kinney and Pringle2003). Fischer et al. (Reference Fischer, Crenshaw, Kraemer and Schmitt2013) used HST long-slit observations of a sample of 48 AGN to map the [O iii] kinematics and found that only 35% of the galaxies with extended NLR show outflows. Integral field spectroscopy (IFS) on 8–10-m telescopes is a powerful tool to map the central region of active galaxies, as they provide the spatial and spectral resolutions and spatial coverage, needed to properly map the NLR kinematics and geometry (e.g. Riffel et al. Reference Riffel, Storchi-Bergmann, Winge and Barbosa2006; Barbosa et al. Reference Barbosa, Storchi-Bergmann, Cid Fernandes, Winge and Schmitt2009; Riffel, Storchi-Bergmann, & Winge Reference Riffel, Storchi-Bergmann and Winge2013; Riffel, Storchi-Bergmann, & Riffel Reference Riffel, Storchi-Bergmann and Riffel2015; Medling et al. Reference Medling2015; Lena et al. Reference Lena, Robinson, Storchi-Bergmann, Couto, Schnorr-Müller and Riffel2016; Fischer et al. Reference Fischer2017; Thomas et al. Reference Thomas2017;Wylezalek et al. Reference Wylezalek2017; Freitas et al. Reference Freitas2018).
We present near-infrared (near-IR) IFS of the inner 5 arcsec × 7 arcsec region of the Seyfert 2 galaxy NGC 5643, obtained with the Gemini Multi-Object Spectrograph (GMOS). NGC 5643 is a widely studied spiral galaxy, morphologically classified as SBc and located at a distance of 11.8 Mpc, for which 1 arcsec corresponds to 57 pc at the galaxy (de Vaucouleurs, de Vaucouleurs, & Corwin Reference de Vaucouleurs, de Vaucouleurs and Corwin1976; Fischer et al. Reference Fischer, Crenshaw, Kraemer and Schmitt2013). It harbours a Seyfert 2 nucleus and its optical spectra show high-ionisation lines (Sandage Reference Sandage1978; Phillips, Charles, & Baldwin Reference Phillips, Charles and Baldwin1983).
Ground-based [O iii]λ5007 and Hα+[N ii]λλ6548,84 narrow-band images of NGC 5643 show an elongated structure with the size of 30 arcsec (1.9 kpc) aligned along the east–west direction, with higher excitation gas observed to the east of the nucleus (Schmitt, Storchi-Bergmann, & Baldwin Reference Schmitt, Storchi-Bergmann and Baldwin1994). High-resolution narrow-band images obtained with the HST have confirmed the presence of higher excitation gas to the east of the nucleus and reveal a well-defined one-sided cone with vertex at the location of the continuum emission peak and oriented to the east (Simpson et al. Reference Simpson, Wilson, Bower, Heckman, Krolik and Miley1997). Such structure is also detected in soft X-ray images (Bianchi, Guainazzi, & Chiaberge Reference Bianchi, Guainazzi and Chiaberge2006). Based on Fabry-Perot spectra of NGC 5643, Morris et al. (Reference Morris, Ward, Whittle, Wilson and Taylor1985) found evidence of gas flowing towards the center along a large scale bar and report the detection of blue wings in the optical emission lines from a region west of the nucleus. Fischer et al. (Reference Fischer, Crenshaw, Kraemer and Schmitt2013) used HST narrow-band images and long-slit spectroscopy of the NLR of NGC 5643 and found that the [O iii] kinematics is consistent with outflows within a cone oriented along position angle (PA) of 80°, with inclination of 25° and maximum opening angle of 55°.
Cresci et al. (Reference Cresci2015) used high-quality IFS of NGC 5643, obtained with the MUSE instrument on the Very Large Telescope (VLT), to map the gas ionisation and kinematics in the inner 25 arcsec × 10 arcsec region. They found a double-sided ionisation cone along the east–west direction and argue that the ionised gas kinematics at the centre of the ionisation cone is consistent with outflows, based on the detection of a blueshifted asymmetric wing of the [O iii]λ5007 emission line, with a projected velocity of up to −450 km s−1. In addition, they found that the outflow points in the direction of two star-forming regions and suggest that these regions are due to a positive feedback induced by the gas compression by the outflowing gas.
Near-IR IFS of the inner 8 arcsec × 8 arcsec region of NGC 5643, obtained with the VLT, reveals that the Brγ emission line shows a similar flux distribution to the optical lines, while the H21 – 0 S(1) flux distribution presents two clear spiral arms, one to the northwest and another to the southeast (Davies et al. Reference Davies2014; Menezes et al. Reference Menezes, da Silva, Ricci, Steiner, May and Borges2015). The H2 velocity field shows kinematic structures associated with the spiral arms seen in the H2 flux distribution and consistent with gas flows towards the nucleus along a bar. To the northeast, the H2 kinematics is consistent with outflows of molecular gas excited around the edge of the ionisation cone. These authors found also that the Brγ emission traces the ionisation cone with velocities of up to 150 km s−1. The stellar velocity field of the central region of NGC 5643, derived by fitting the K-band CO absorption band heads, shows regular rotation with the line of nodes oriented along a PA of –39° and a projected velocity amplitude of ∼100 km s−1 (Hicks et al. Reference Hicks, Davies, Maciejewski, Emsellem, Malkan, Dumas, Müller-Sánchez and Rivers2013; Davies et al. Reference Davies2014).
Recently, Alonso-Herrero et al. (Reference Alonso-Herrero2018) presented high-resolution 12CO(2–1) line and 232-GHz continuum observations of NGC 5643 obtained with the Atacama Large Millimeter/submillimeter Array (ALMA) with spatial resolutions of 9–21 pc. The CO intensity map shows a two-arm nuclear spiral extending up to ∼10 arcsec and following the previously known dusty spiral structures (e.g. Davies et al. Reference Davies2014). They describe the CO kinematics as presenting two components, one due to gas rotation and another due to the interaction of the AGN outflow with the molecular gas. In addition, they derived a total molecular gas mass of 1.1 × 10⁷ M⊙ for the nuclear disk.
This paper is organised as follows. Section 2 presents the observations and data treatment, and Section 3 shows the two-dimensional maps for the emission line flux distribution and kinematics, as well as for the stellar kinematics. These results are discussed in Section 4 and the conclusions of this work are presented in Section 5.
2. Observations and Data Reduction
We use Gemini Observatory archival data of NGC 5643 obtained with the Gemini Multi-Object Spectrograph integral Field Unit (GMOS IFU; Allington-Smith et al. Reference Allington-Smith2002; Hook et al. Reference Hook, Jørgensen, Allington-Smith, Davies, Metcalfe, Murowinski and Crampton2004) on the Gemini South Telescope. The observations were done in the two-slit mode, resulting in a field of view (FoV) of 5 arcsec × 7 arcsec, centred at the nucleus of the galaxy. The R400 grating in combination with the G5325 filter results in a spectral range of 7 750–9 950 Å. The total on-source exposure time was 65 min, divided in three individual exposures of 22 min each.
The data reduction followed the standard procedures (e.g. Lena Reference Lena2014; Brum et al. Reference Brum, Riffel, Storchi-Bergmann, Robinson, Schnorr Müller and Lena2017) using the gemini package in iraf software (Tody Reference Tody1986, Reference Tody1993). These procedures include trimming of the images, bias subtraction, flat-fielding, cosmic rays cleaning, extraction of the spectra, wavelength calibration using as reference the observed spectra of Ar lamps, and sky subtraction. The flux calibration is performed using a sensitivity function generated from the spectrum of a photometric standard. Individual datacubes for each exposure were created at an angular sampling of 0.05 arcsec × 0.05 arcsec. These datacubes were then median combined using a sigma clipping algorithm to remove spurious features, and the location of the continuum peak was used to perform the alignment among the cubes.
The final datacube of NGC 5643 covers the inner 5 arcsec × 7 arcsec (285 × 400 pc) at an angular resolution of 0.8 arcsec (∼45 pc), as obtained from the measurement of the full width at half maximum (FWHM) of the flux distribution of the standard star. The velocity resolution is ∼95 km s−1, as measured from the FWHM of typical arc lamp lines used to the wavelength calibration of the spectra.
3. Results
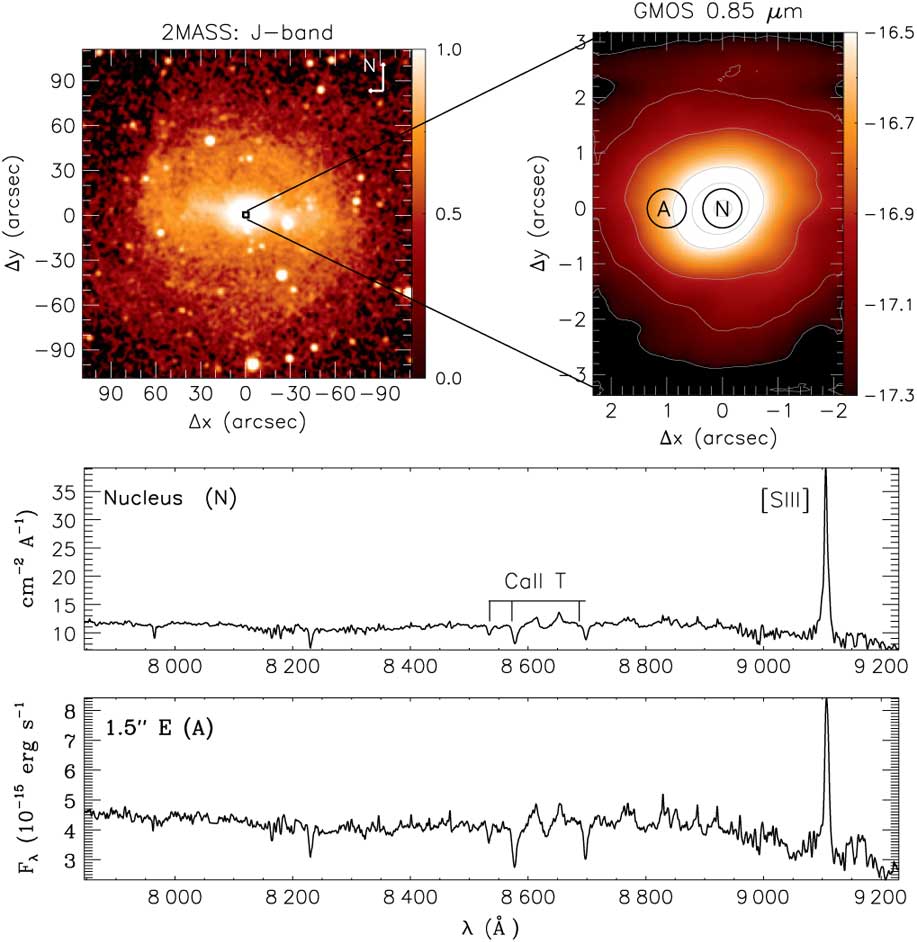
Figure 1 (on the top) shows a large-scale J-band image of NGC 5643 obtained from the Two Micron All Sky Survey (2MASS; Jarrett et al. Reference Jarrett, Chester, Cutri, Schneider and Huchra2003). This image clearly reveals the presence of a bar oriented along the east–west direction. The top right panel of Figure 1 shows the continuum image obtained from the GMOS datacube, by averaging the fluxes within a spectral window of 300 Å centred at 8 500 Å. One can observe that the GMOS flux contours are slightly more elongated along the orientation of the bar. The bottom panels show the integrated spectra within apertures of 0.7 arcsec diameter centred at the nucleus (labelled as N in the top-right panel) and at 1.5 arcsec east of it (labelled as A). The [S iii]λ9069 emission line and Ca iiλλλ8498,8542,8662 absorption triplet are identified in the nuclear spectrum. These features are used to map the gas kinematics and distribution and the stellar kinematics.
Top panels—Left: Large-scale J-band image of NGC 5643 from 2MASS (Jarrett et al. Reference Jarrett, Chester, Cutri, Schneider and Huchra2003). The colour bar shows the flux in arbitrary units. Right: 0.85-μm continuum image obtained from the GMOS datacube, by averaging the fluxes within a 300-Å spectral range. The colour bar shows the fluxes in logarithmic units of erg s−1 cm−2 Å−1 spaxel−1. Bottom panels show the spectra extracted within the circular apertures of 0.7 arcsec diameter centred at the nucleus (N) and at 1.5 arcsec of it (A).
3.1. Stellar kinematics
In order to obtain measurements of the line-of-sight velocity ( $$V_{\rm los\star}$$) and velocity dispersion (
 $$\sigma_\star$$) of the stars in NGC 5643, we used the penalised pixel-fitting (ppxf) method (Cappellari & Emsellem Reference Cappellari and Emsellem2004; Cappellari Reference Cappellari2017) to fit the Ca iiλλλ8498,8542,8662 absorption triplet present in the galaxy spectra. As spectral templates, we used selected spectra from the stellar library of Cenarro et al. (Reference Cenarro, Cardiel, Gorgas, Peletier, Vazdekis and Prada2001), which cover the spectral range of 8 348–9 020 Å at a spectral resolution of 1.5 Å. The choice of this spectral library was done because it spans a wide range in stellar atmospheric parameters, and the spectral resolution of the spectra is similar to that of our GMOS data.
Before fitting the observed spectra, we have rebinned the datacube to 0.15 arcsec × 0.15 arcsec spaxels in order to increase the signal-to-noise ratio (SNR) and allow reliable measurements. In Figure 2, we show the  $$V_{\rm los\star}$$ (left) and
  $$\sigma_\star$$ (right) maps for NGC 5643. The systemic velocity of the galaxy (1 241 km s−1, as derived in Section 4.1) was subtracted from the observed velocity field, and the white/grey regions in the
  $$V_{\rm los\star}$$/
 $$\sigma_\star$$ maps represent locations where the SNR was not high enough to obtain reliable fits of the observed spectra. At these locations, the uncertainties in
  $$V_{\rm los\star}$$ and
  $$\sigma_\star$$ are higher than 30 km s−1.
Stellar velocity field (left) and stellar velocity dispersion map (right). The white/grey regions in the velocity/ $$\sigma_\star$$ map are masked locations due to the low SNR of the spectra. The colour bars show the velocities in km s−1 units and the central cross marks the position of the continuum peak. The continuous lines shown in the
  $$\sigma_\star$$ map mark the location of the main dust structures as seen in the V–H colour map of Davies et al. (Reference Davies2014).
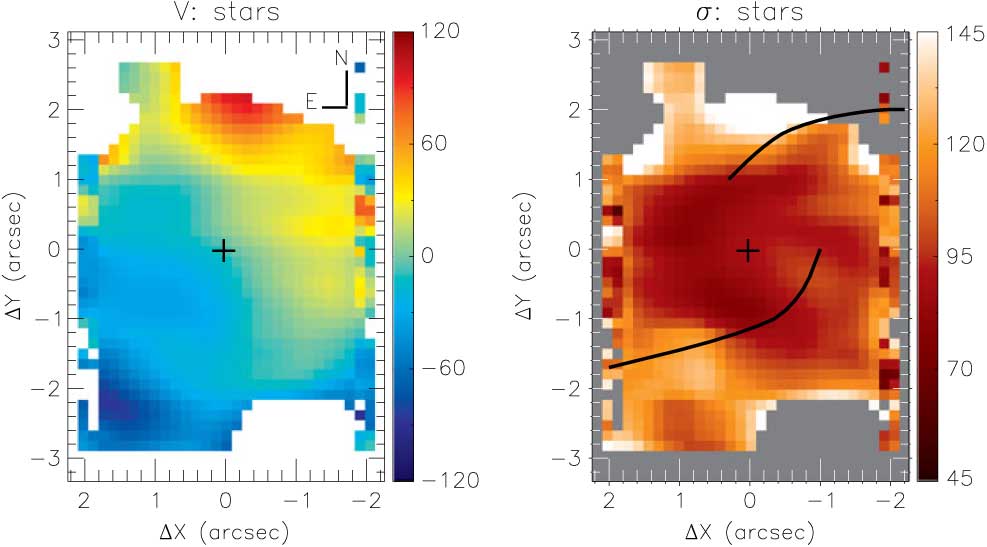
The stellar velocity field (left panel of Figure 2) of NGC 5643 shows a projected velocity amplitude of ∼100 km s−1, with redshifts observed to the northwest and blueshifts to the southeast. The stellar velocity dispersion map (right panel of Figure 2) shows values ranging from 50 to 140 km s−1, with the highest values seen mostly to the north and southeast of the nucleus. Surrounding the nucleus, the lowest  $$\sigma_\star$$ are observed and seem to delineate a partial ring with radius ∼1 arcsec. In Figure 3, we present an one-dimensional cut along the major axis of the galaxy (ψ 0 = −36°), extracted within a pseudo slit of 0.45 arcsec width. This plot clearly shows the ring of lower
  $$\sigma_\star$$ values. At the nucleus, the
  $$\sigma_\star$$ values are around 110 km s−1, then they decrease to
  $$\sigma_\star$$ ∼ 80 km s−1 at the ring region and increase again at larger distances.
One-dimensional cut in the  $$\sigma_\star$$ map along the major axis of the galaxy (ψ 0 = −36°).
3.2 [S iii] λ9069 flux distribution and kinematics
We used the emission line PROfile FITting (profit) routine (Riffel Reference Riffel2010) to fit the observed [S iii]λ9069 profile at each spaxel by Gaussian curves and obtain measurements for its flux, centroid velocity (V S iii), and velocity dispersion (σ S iii). Figure 4 shows the corresponding maps. The masked locations correspond to regions where the SNR of the [S iii]λ9069 line was not high enough to obtain good fits. In these maps, we excluded regions farther than 1.8 arcsec to the north and south directions, where no line emission was detected.
[S iii] λ9069 flux map (top), velocity field, after the subtraction of the systemic velocity (middle) and velocity dispersion map (bottom). White and grey regions correspond to masked locations due to poor fit or non-detection of the line. The fluxes are shown in logarithmic units of erg s−1 cm−2 spaxel−1 and the velocities are shown in km s−1. The crosses mark the location of the continuum peak.
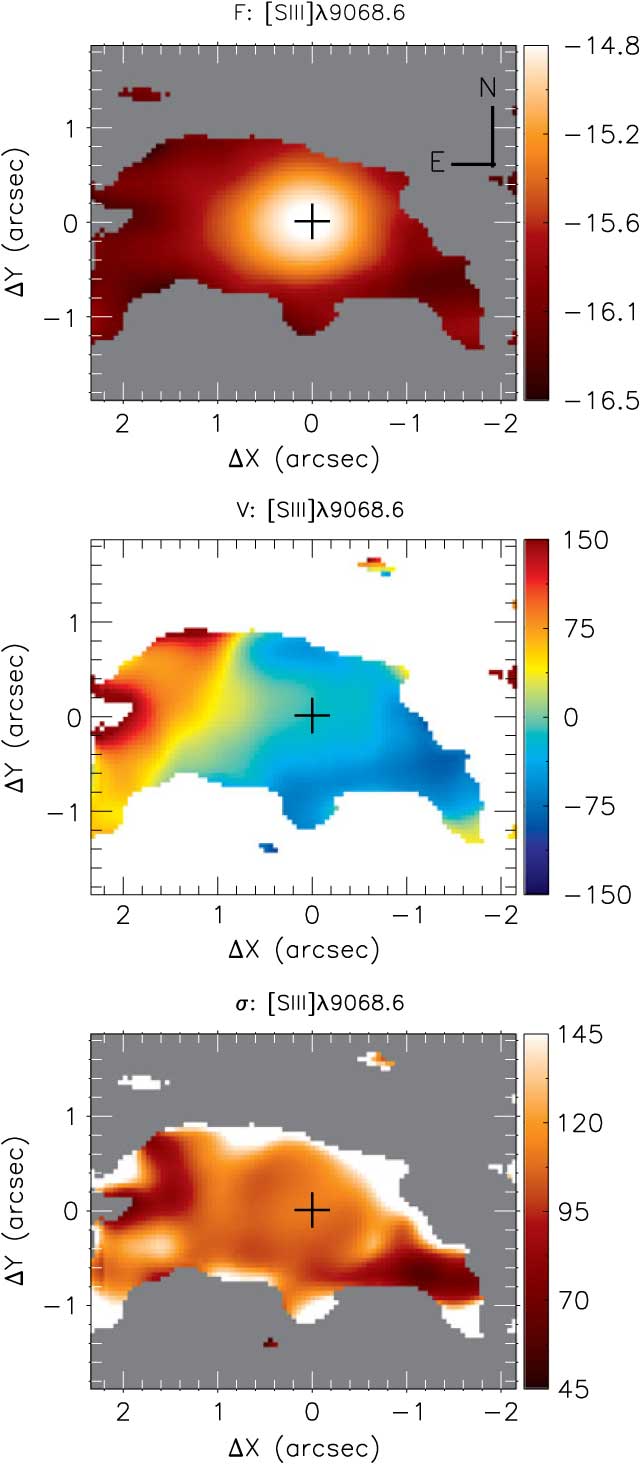
The top panel of Figure 4 presents the [S iii]λ9069 flux distribution, which shows an elongated structure along the east–west direction. This structure extends up to 2.2 arcsec to the east of the nucleus and is narrower to the west side of it, extending to 1.8 arcsec. Along the north–south direction, the [S iii] shows extended emission only at locations closer than 1 arcsec of the nucleus of the galaxy.
The [S iii] velocity field is shown in the middle panel of Figure 4, after the subtraction of the systemic velocity of the galaxy, as obtained by the fitting of the stellar velocity field by a rotation disk model (see Section 4.1). The highest redshifts of up to 150 km s−1 are seen east of the nucleus, while similar velocities in blueshifts are observed west of the nucleus.
The bottom panel of Figure 4 shows the resulting σ Siii map. The σ Siii values were corrected for the instrumental broadening and range from 40 to 150 km s−1. At most locations σ Siii ≈ 90 – 120 km s−1.
The relatively high spectral resolution of the GMOS spectra has allowed us to slice the [S iii] emission line profile into a sequence of velocity bins and construct the velocity channel maps, shown in Figure 5. These maps allow a better sample of the gas kinematics over the whole velocity distribution, including the wings of the line profiles. The velocity slices within bins of ∼70 km s−1 (corresponding to three spectral pixels) were obtained after subtraction of the continuum, determined as averages of the fluxes from both sides of the emission line. Each panel presents flux levels in logarithmic units for the velocity slice shown. The zero velocity is adopted as the value obtained from the modelling of the stellar velocity field (Section 4.1). The continuous line shown in each panel of Figure 5 represents the orientation of the line-of-nodes of the galaxy, the dotted lines delineate the bi-cone geometry, as obtained by Fischer et al. (Reference Fischer, Crenshaw, Kraemer and Schmitt2013), and the central cross marks the location of the nucleus.
Velocity channel maps along the [S iii]λ9069 emission line profile for a velocity bin of ∼70 km s−1 (3 pixels). The colour bar shows the fluxes logarithmic units of erg s−1 cm−2 spaxel−1. The velocities relative to the systemic velocity of the galaxy are shown in the top-left corner of each panel. The continuous green lines represent the orientation of the line of nodes, as derived from the stellar velocity field. The dotted lines delineate the walls of the bi-cone, derived by Fischer et al. (Reference Fischer, Crenshaw, Kraemer and Schmitt2013). The central crosses mark the location of the continuum peak.
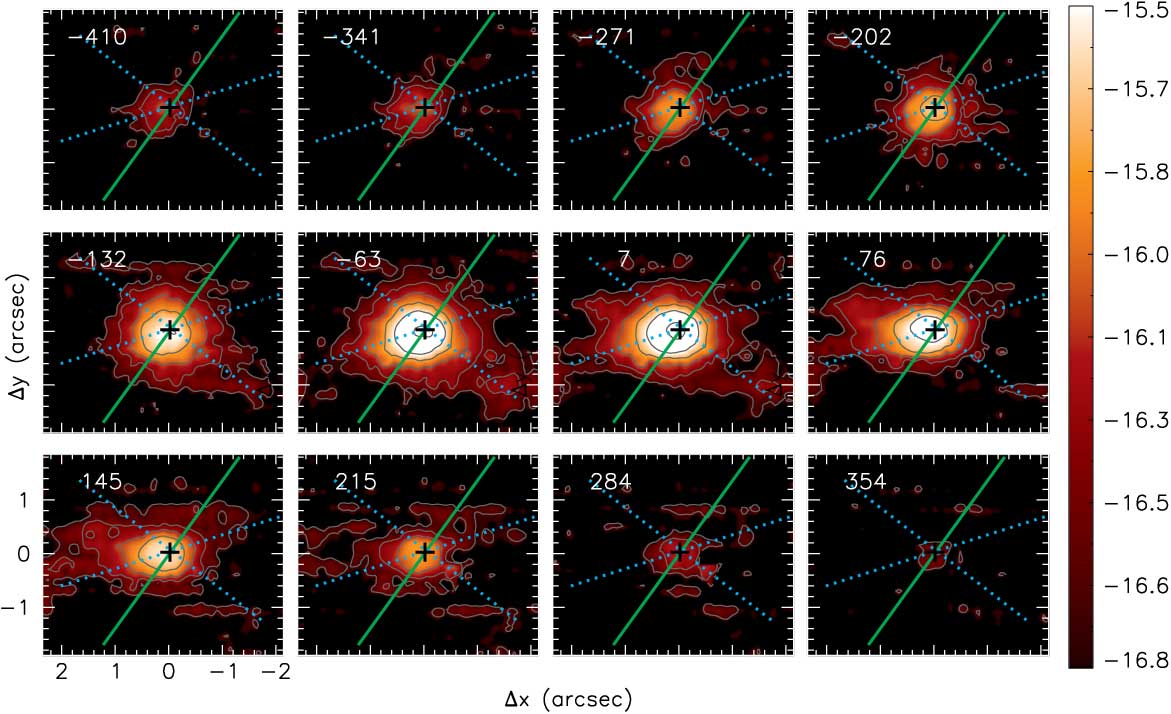
The channel maps trace the gas from negative velocities (blueshifts) to positive values (redshifts) relative to the systemic velocity of the galaxy. The highest blueshifts (of up to −410 km s−1) and redshifts (of up to 350 km s−1) are observed mainly at the nucleus of the galaxy. For smaller blueshifts, besides the nuclear emission, an elongated structure to the west–southwest is observed, co-spatial with the stripe seen in the [S iii] flux map (top panel of Figure 4). A similar redshifted structure is observed to the east. In addition, some emission northwest of the nucleus is seen in redshift, following the orientation of the major axis of the galaxy (green line), clearly seen at channel maps centred in velocities in the range of 76–215 km s−1. A slightly elongated structure along the major axis of the galaxy is also seen in blueshifts to the southeast, clearly observed in panels centred at −341 and −271 km s−1.
4. Discussions
4.1. Stellar kinematics
The stellar velocity field (Figure 2) of NGC 5643 shows a clear rotation pattern with the northwest side of the galaxy receding and the southeast side approaching, consistent with the velocity field presented by Davies et al. (Reference Davies2014), as obtained from the fit of the CO λ2.3 μm bands using VLT SINFONI observations. In addition, a similar behaviour is seen in the velocity field for the cold molecular gas as obtained from ALMA 12CO(2–1) line observations by Alonso-Herrero et al. (Reference Alonso-Herrero2018), but the CO presents smaller velocity dispersion values than that of the stars, consistent with the fact that the cold molecular gas being located on a thin disk, whereas the bulge stars contribute to the observed stellar kinematics.
We fitted the observed  $$V_{\rm los\star}$$ by an analytical model, under the assumption that the stars move in circular orbits in the plane of the galaxy, within a central gravitational potential (Bertola et al. Reference Bertola, Bettoni, Danziger, Sadler, Sparke and de Zeeuw1991). In this model, the rotation velocity field is given by
 \begin{equation}
\begin{array}
V_{\rm mod}(R,\psi)=\\
V_{\rm s}+\dfrac{AR\cos(\psi-\psi_{0})\sin(i){\cos^{p}(i)}}{\{R^{2}[\!\sin^{2}(\psi-\psi_{0})+\cos^{2}(i)\cos^{2}(\psi-\psi_{0})]+{c_{0}}^{2}\cos^{2}(i)\}^{\frac{p}{2}}},\\\\[-11pt]
\end{array}\vspace*{6pt}
\end{equation}
\begin{equation}
\begin{array}
V_{\rm mod}(R,\psi)=\\
V_{\rm s}+\dfrac{AR\cos(\psi-\psi_{0})\sin(i){\cos^{p}(i)}}{\{R^{2}[\!\sin^{2}(\psi-\psi_{0})+\cos^{2}(i)\cos^{2}(\psi-\psi_{0})]+{c_{0}}^{2}\cos^{2}(i)\}^{\frac{p}{2}}},\\\\[-11pt]
\end{array}\vspace*{6pt}
\end{equation}
where R and ψ are the coordinates of each spaxel in the plane of the sky, V s is the systemic velocity of the galaxy, A is the velocity amplitude, ψ 0 is the PA of the major axis, and i is the disc inclination relative to the plane of the sky. The p parameter and italic fonts. Kindly check and suggest if any modifications needed. measures the slope of the rotation curve where it flattens, being limited between 1 ≤ p ≤ 3/2. For p = 1 the rotation curve at large radii is asymptotically flat while for p = 3/2 the system has a finite mass. c 0 is a concentration parameter, defined as the radius where the rotation curve reaches 70% of its velocity amplitude.
We fitted the model to the observed velocities using the mpfitfun routine (Markwardt Reference Markwardt, Bohlender, Durand and Dowler2009) to perform a least-squares fit, in which initial guesses are given for the free parameters. As the GMOS FoV is small, the position of the kinematical centre was kept fixed to the location of the continuum peak and the disc inclination was fixed to i = 34° (Davies et al. Reference Davies2014).
Figure 6 shows the stellar velocity field (left panel), the resulting best fit model (middle), and a residual map (right), obtained by subtracting the model from the observed velocity field. The residuals are smaller than 30 km s−1 at all locations, indicating that the observed velocities are well reproduced by the model.
Left: stellar velocity field. Middle: rotating disc model for the stellar velocity field. Right: residual map between the observed and modelled velocities. The colour bar shows the range of velocities in km s−1 and the cross marks the position of the nucleus.
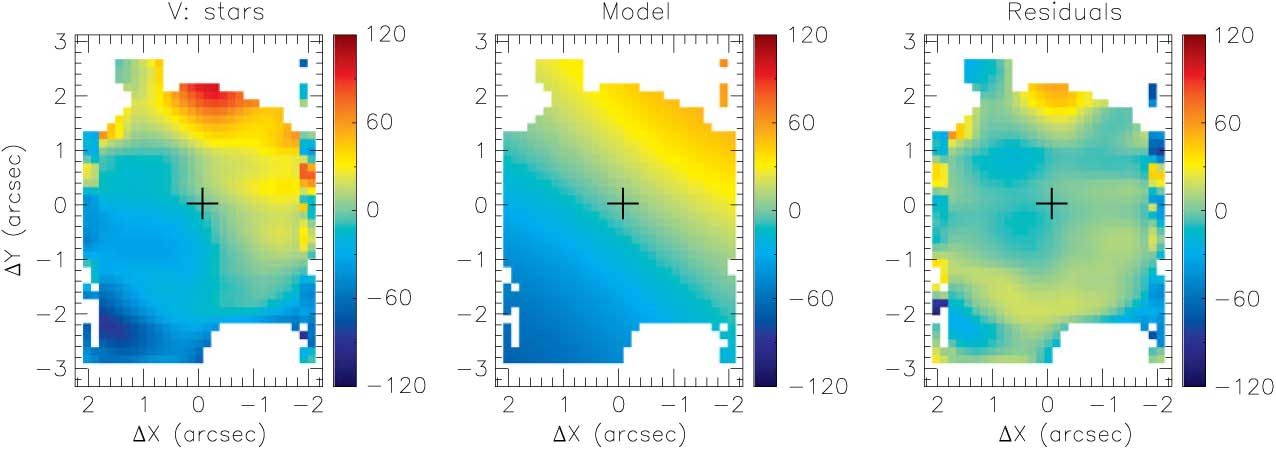
The resulting parameters for the best fit model are Vs+1 241±7 km s−1, relative to the heliocentric rest frame, A = 172 ± 22 km s−1, ψ 0 = −36° ± 3°, p = 1, and c 0 = 3.7 arcsec ± 0.6 arcsec. The systemic velocity is about 40 km s−1 larger than the one obtained from 21 cm H i line (1 199 ± 2 km s−1; Koribalski et al. Reference Koribalski2004), possibly due to the very distinct apertures used in the H i and GMOS observations. The orientation of the line of nodes is consistent with the value presented by Davies et al. (Reference Davies2014) derived from the stellar kinematics measured by fitting the CO absorption bandheads in the K-band.
The velocity residual map shows small values at all locations, with a mean absolute value of ∼10 km s−1, and the deprojected velocity amplitude is larger than the  $$\sigma_\star$$ values, indicating that the stellar kinematics in the inner region of NGC 5643 is dominated by regular rotation. This result can be compared with previous studies for nearby galaxies. In Riffel et al. (Reference Riffel, Storchi-Bergmann, Riffel, Dahmer-Hahn, Diniz, Schönell and Dametto2017), we presented stellar kinematics measurements for 16 nearby Seyfert galaxies, derived by the fitting of the CO absorption bandheads in the K-band using Gemini Near-Infrared Integral Field Spectrograph (NIFS) observations. We found that the stellar kinematics in the inner few of hundred parsecs is dominated by a disk-like component and the stellar velocity fields are well reproduced by a rotating disk model, with kinematic axes that follow the same orientation of large-scale disk. Dumas et al. (Reference Dumas, Mundell, Emsellem and Nagar2007) used optical IFS to map the stellar kinematics of a sample of 39 active galaxies and a matched control sample of inactive galaxies, selected to have similar blue magnitudes, Hubble type, and inclinations. They found that for both active and inactive galaxies, the stellar kinematics in the central region is dominated by a disk component. Similar results were also found by other authors for nearby galaxies (Barbosa et al. Reference Barbosa, Storchi-Bergmann, Cid Fernandes, Winge and Schmitt2006; Falcón-Barroso et al. Reference Falcón-Barroso2006). Thus, our results for NGC 5643 are in agreement with previous studies and suggest that the motion of the stars in the inner 200 pc is dominated by circular orbits at the plane of the galaxy due to the gravitational potential of the bulge, as the FoV of our observations is smaller than the bulge length of NGC 5643.
The stellar velocity dispersion map (right panel of Figure 2) shows values in the range of 50–140 km s−1. This range is similar to that derived using the CO absorptions at 2.3 μm presented by Hicks et al. (Reference Hicks, Davies, Maciejewski, Emsellem, Malkan, Dumas, Müller-Sánchez and Rivers2013). However, their map is much noisier than ours, which suggests in addition a ring of low  $$\sigma_\star$$ values (∼70–80 km s−1) surrounding the nucleus (for which
  $$\sigma_\star$$ ∼ 100 km s−1) at a distance of 0.8 arcsec (∼50 pc). Similar rings have been observed for other Seyfert galaxies at scales of a few hundred parsecs and attributed to young/intermediate age stellar populations (e.g. Riffel et al. Reference Riffel, Storchi-Bergmann, Riffel and Pastoriza2010, Reference Riffel, Riffel, Ferrari and Storchi-Bergmann2011, Reference Riffel, Storchi-Bergmann, Riffel, Dahmer-Hahn, Diniz, Schönell and Dametto2017; Diniz et al. Reference Diniz, Riffel, Riffel, Crenshaw, Storchi-Bergmann, Fischer, Schmitt and Kraemer2017). We do not observe any clear correlation between the structures seen in the
  $$\sigma_\star$$ map and the known dust structures (Martini et al. Reference Martini, Regan, Mulchaey and Pogge2003; Davies et al. Reference Davies2014), as indicated by the lines drawn on the
  $$\sigma_\star$$ map (Figure 2), which trace the main dusty structures seen in the V–H colour map of Davies et al. (Reference Davies2014).
4.2. The [S iii] emission and kinematics
The HST (Simpson et al. Reference Simpson, Wilson, Bower, Heckman, Krolik and Miley1997; Fischer et al. Reference Fischer, Crenshaw, Kraemer and Schmitt2013) and VLT MUSE (Cresci et al. Reference Cresci2015) [O iii]λ5007 flux distributions for NGC 5643 reveal a well-defined triangular emission region east of the nucleus, extending up to 1.8 kpc and showing several knots of emission. The collimated structure is seen also in high-resolution flux maps for the Brγ (from VLT SINFONI observations—Davies et al. Reference Davies2014; Menezes et al. Reference Menezes, da Silva, Ricci, Steiner, May and Borges2015) and for the Hα (from VLT MUSE observations—Cresci et al. Reference Cresci2015) emission lines. Besides the emission region east of the nucleus, the Brγ and Hα maps clearly show extended emission to the west–southwest of the nucleus. Our [S iii]λ9069 flux map (Figure 4) is consistent with the [O iii]λ5007 and Brγ flux maps, considering that the GMOS angular resolution is worse than that of HST and VLT SINFONI.
The [S iii] velocity field (Figure 4) is similar to that of Brγ (Davies et al. Reference Davies2014; Menezes et al. Reference Menezes, da Silva, Ricci, Steiner, May and Borges2015), showing redshifts to the east of the nucleus and blueshifts to the west. The [S iii] kinematics is also consistent with the orientation of the outflows observed in [O iii] by Cresci et al. (Reference Cresci2015). The [O iii] kinematics is modelled by Fischer et al. (Reference Fischer, Crenshaw, Kraemer and Schmitt2013) as a bi-cone with axis oriented along PA = 80°, being displaced by i cone = 65° from the line-of-sight and with inner and outer opening angles of θ min = 50° and θ max = 55°, respectively. Davies et al. (Reference Davies2014) argue that the Brγ and H2 1–0 S(1) kinematics are consistent with this model. Besides the [S iii] velocity field, the velocity channel maps are consistent with outflows within a bi-cone, as most of the redshifts and blueshifts are seen within the doted lines in Figure 5, that delineates the geometry of the bi-cone model of Fischer et al. (Reference Fischer, Crenshaw, Kraemer and Schmitt2013). Thus, we conclude that the [S iii] emission is originated from the same outflowing gas that originates the [O iii] and Brγ emission. This interpretation is further supported by the CO velocity residual map presented by Alonso-Herrero et al. (Reference Alonso-Herrero2018), which shows redshifts to the east and blueshifts to the west of the nucleus, being interpreted by the authors as due to radial movements of material being pushed outwards in the galaxy disk by the ionised gas outflow.
Aside from the outflowing gas component, the [S iii] velocity channel maps (Figure 5) show a structure in redshifts northwest of the nucleus, extending up to 1.5 arcsec (clearly observed in velocity slices from 76 to 215 km s−1). Another slightly elongated structure is seen in blueshifts to the southeast (clearly seen in panels centred at −341 and −271 km s−1). These structures are seen at the same orientation of the kinematic major axis of the galaxy, as observed in the stellar (Figure 2) and CO (Alonso-Herrero et al. Reference Alonso-Herrero2018) velocity fields, that shows redshifts to the northwest and blueshifts to the southeast. The most plausible interpretation of these [S iii] kinematic components is that they are due to emission of gas at the plane of the disc, possibly heated by the outflowing gas and AGN radiation, as the bi-cone intercepts the disc plane.
Considering that the bulk of the [S iii] kinematics is consistent with outflows within a bi-cone, we can use the geometric parameters of the bi-cone, in combination with our velocity measurements to estimate the mass outflow rate in ionised gas. Assuming that the redshifts seen to the east are originated from gas located in the front wall of the bi-cone, the observed projected velocity of ∼100 km s−1 (from Figure 4) corresponds to outflows with velocity of v out ≈ 100/sin(i cone – (θ max – θ min)/2) ≈ 330 km s−1. We used the geometric parameters of the bi-cone from Fischer et al. (Reference Fischer, Crenshaw, Kraemer and Schmitt2013), and we note that v out is consistent with their model (their Figure 22). The ionised gas mass outflow rate can be estimated by
 \begin{equation}
\dot{M}=2\,m_{\textrm{p}}\,N_{\textrm{e}}\,A\, v_{\textrm{out}}\, f.
\end{equation}
\begin{equation}
\dot{M}=2\,m_{\textrm{p}}\,N_{\textrm{e}}\,A\, v_{\textrm{out}}\, f.
\end{equation}
The factor 2 is included to consider both sides of the bi-cone, m p is the proton mass, N e is the electron density, f is the filling factor, A = πr 2 (tan θ max − tan θ min) is the cross section of the outflow, and r is the distance from the nucleus along the bi-cone axis. Assuming typical values of f = 0.01 and N e = 500 cm−3 (e.g. Osterbrock & Ferland Reference Osterbrock and Ferland2006; Dors et al. Reference Dors, Cardaci, Hägele, Rodrigues, Grebel, Pilyugin, Freitas-Lemes and Krabbe2015) and r = 1 arcsec ≈ 50 pc, we obtain Ṁ ≈ 0.3 M⊙ yr−1 for NGC 5643.
The mass outflow rate derived for NGC 5643 is within the range of values observed in other Seyfert galaxies (10−2 − 101 M⊙ yr−1; Barbosa et al. Reference Barbosa, Storchi-Bergmann, Cid Fernandes, Winge and Schmitt2009; Riffel Reference Riffel2013; Revalski et al. Reference Revalski, Crenshaw, Kraemer, Fischer, Schmitt and Machuca2018). This value can be compared to the accretion rate necessary to power the AGN at the nucleus of NGC 5643, which can be derived by
 \begin{equation}
\dot{m}=\frac{L_{\rm bol}}{c^2\eta},
\end{equation}
\begin{equation}
\dot{m}=\frac{L_{\rm bol}}{c^2\eta},
\end{equation}
where L bol is the nuclear bolometric luminosity, η is the efficiency of conversion of the rest mass energy of the accreted material into radiation, and c is the light speed. Using L bol ≈ 1 × 1043 erg s−1 from Brightman et al. (Reference Brightman2017) and assuming η ≈ 0.1, which is a typical value for a ‘standard’ geometrically thin, optically thick accretion disc (e.g. Frank, King, & Raine Reference Frank, King and Raine2002), we obtain a mass accretion rate of ṁ ≈ 1.7 × 10⁻³ M⊙ yr−1.
The mass outflow rate (Ṁ) estimated for NGC 5643 is about two orders of magnitude larger than ṁ. This result is consistent with those obtained for other Seyfert galaxies (e.g. Riffel Reference Riffel2013) and indicates that most of the outflowing gas observed in the NLR of NGC 5643 does not originate in the AGN, but is a result of the interaction of winds launched by the accretion disk and the ambient gas, which is pushed away by the nuclear outflow.
Finally, we can use the derived mass outflow rate for NGC 5643 to verify if it follows the same AGN wind scaling relation between Ṁ and the bolometric luminosity (L bol) observed for a sample of 94 AGN (Fiore et al. Reference Fiore2017). Considering that NGC 5643 presents log L bol = 43 ± 0.5 (Brightman et al. Reference Brightman2017) and using the value of Ṁ ≈ 0.3 M⊙ yr−1 derived above, we note that NGC 5643 lies at the lower end of observed correlation between Ṁ and Lbol in ionised gas (see Figure 1 of Fiore et al. Reference Fiore2017), suggesting that the observed correlation can be extended to lower luminosity AGN.
5. Conclusions
We used GMOS IFU observations of the inner 285 × 400 pc2 of the Seyfert 2 galaxy NGC 5643 to map the gas and stellar kinematics at a velocity resolution of 95 km s−1 (FWHM) and spatial resolution of 45 pc. Our main conclusions are:
The [S iii]λ9069 flux map shows a triangular emission region east of the nucleus, extending up to the border of the FoV (140 pc). A more collimated structure is seen to the west–southwest up to 100 pc from the nucleus. The [S iii]λ9069 flux distribution is similar to that of [O iii]λ5007 and H i recombination lines (see previously published).
The [S iii] kinematics is dominated by outflows within a bi-cone oriented along PA ≈ 80°. The projected velocity of the outflow is about 100 km s−1 and we derive a mass outflow rate of 0.3 M⊙ yr−1 in ionised gas.
Velocity channel maps along the [S iii]λ9069 emission line profile reveal a secondary kinematic component, originated from gas located in the plane of the galaxy, possibly heated by the outflowing material.
The stellar velocity field shows regular rotation with a projected velocity amplitude of 100 km s−1 and is well reproduced by a model of a rotating disc with major axis oriented along ψ 0 = −36°.
The stellar velocity dispersion map shows values ranging from 50 to 140 km s−1 and suggests the presence of a ring of low
 $$\sigma_\star$$ values (80 km s−1) surrounding the nucleus at a distance of 50 pc from it. This structure is attributed to young/intermediate age stellar populations that still preserve the kinematics of the gas whence they were formed.

Author ORCIDs.
Rogemar A. Riffel, https://orcid.org/0000-0003-0483-3723.
Acknowledgements
We thank the two anonymous referees for valuable suggestions which helped to improve the paper. This work has been partially supported by the Conselho Nacional de Desenvolvimento Científico e Tecnológico (CNPq), Coordenação de Aperfeiçoamento de Pessoal de Nível Superior (CAPES), and Fundação de Amparo à Pesquisa do Estado do Rio Grande do Sul (FAPERGS). Based on observations obtained at the Gemini Observatory, acquired through the Gemini Observatory Archive and processed using the Gemini IRAF package, which is operated by the Association of Universities for Research in Astronomy, Inc., under a cooperative agreement with the NSF on behalf of the Gemini partnership: the National Science Foundation (United States), the National Research Council (Canada), CONICYT (Chile), Ministerio de Ciencia, Tecnología e Innovación Productiva (Argentina), and Ministério da Ciência, Tecnologia e Inovação (Brazil).


