

1. Introduction
Chromosomal inversion polymorphisms are one of the best-studied systems in population genetical studies. Chromosomal analyses can be utilized as genetic markers, for which chromosome inversions are considered as alleles, and are used to examine various population genetic parameters (Powell, Reference Powell1997). Inversions have also been used to study geographical clines, temporal cycles, meiotic drive and natural selection (McAllister, Reference McAllister2002; Ananina et al., Reference Ananina, Peixoto, Bitnermathe, Souza, Silva, Valente and Klaczko2004).
In natural populations of Drosophila, chromosomal polymorphism due to inversions is common and is an adaptive trait. Overdominance, frequency dependent selection, or variable selection in time or space can contribute to the adaptive character of chromosomal polymorphism. However, chromosomal polymorphism may be maintained by selection in a heterogeneous environment rather than by overdominance (Da Cunha, Reference Da Cunha1960; Dobzhansky, Reference Dobzhansky1970; Sperlich & Pfriem, Reference Sperlich, Pfriem, Ashburner, Carson and Thompson1986; Krimbas & Powell, Reference Krimbas, Powell, Krimbas and Powell1992; Iriarte & Hasson, Reference Iriarte and Hasson2000; Muntẻ et al., Reference Muntẻ, Rozas, Aguadẻ and Segarra2005; Kennington et al., Reference Kennington, Partridge and Hoffmann2006). The geographically widespread species of Drosophila are expected to be chromosomally more polymorphic because they are ecologically versatile (Da Cunha & Dobzhansky, Reference Da Cunha and Dobzhansky1954).
Drosophila ananassae, a member of the ananassae species complex of the ananassae subgroup of the melanogaster species group (Bock & Wheeler, Reference Bock and Wheeler1972), is a cosmopolitan and domestic species. It is largely circumtropical in distribution and shows a high degree of chromosomal polymorphism (Singh, Reference Singh1996). It occupies a unique status in the genus Drosophila due to certain peculiarities in its genetical behaviour (Singh, Reference Singh2000). D. ananassae harbours a large number of inversions in its natural populations. Among these, only three are cosmopolitan in distribution (Singh, Reference Singh1998). The population genetics of chromosomal polymorphism in Indian natural populations of D. ananassae have been studied (Singh, Reference Singh1998), showing that there is geographic differentiation of inversion polymorphism in Indian natural populations. In recent years, molecular studies have focused on the effect of population subdivision on genetic variation (Stephan, Reference Stephan1989; Stephan & Langely, Reference Stephan and Langely1989; Stephan & Mitchell, Reference Stephan and Mitchell1992; Stephan et al., Reference Stephan, Xing, Kirby and Braverman1998; Aulard et al., Reference Aulard, David and Lemeunier2002; Vogl et al., Reference Vogl, Das, Beaumont, Mohanty and Stephan2003; Das et al., Reference Das, Mohanty and Stephan2004; Pfeiler et al., Reference Pfeiler, Erez, Hurtado and Markow2007; Schug et al., Reference Schug, Smith, Tozier-Pearce and McEvey2007).
The intention of the present study was to explore the role of natural selection and genetic drift on the degree of inversion polymorphism. A country such as India, with its wide range of diversity in geo-climatic conditions, provides a very good platform for conducting such studies. By combining our new data with those from earlier surveys (done about two decades ago), we have generated a time series that enables us to explore the evolutionary dynamics of inversion polymorphism. Such long time series are rare but nonetheless crucial for studying the evolutionary dynamics of inversion polymorphism.
2. Materials and methods
(i) D. ananassae populations
D. ananassae flies were collected from 45 different ecogeographical localities of India ranging from Jammu in the north to Kanniyakumari in the south, and Dwarka in the west to Deemapur in the east (Table 1). Collections of flies were planned in such a way as to include regions with apparent differences in ecogeographical conditions, to determine the effect of geo-climatic factors on the dynamics of inversion polymorphism. For instance, in states on the coastline (all south Indian states, Orissa and West Bengal) collection was done from coastal regions and mainland regions, while for those states with no coastlines, collections were done from different altitudes (North east, Uttaranchal and Himachal Pradesh). For instance, in Haridwar (Uttaranchal) flies were collected from the periphery of the city and also from the Mansa Devi shrine located at a height of 3500 m in the heart of the city. In other locations such as Uttar Pradesh and Madhya Pradesh with no such geographical differences, collection was done from places spatially separated (about 200 km or more) from each other. In each case flies were collected from fruit and vegetable markets by the ‘net sweeping’ method. The geographical positions of the set of 45 localities are shown in Fig. 1.
Map of India showing the localities from where Drosophila ananassae flies were collected. JU, Jammu; DH, Dharamshala; KG, Kangra; DN, Dehradun; HD, Haridwar; MD, Mansa Devi; GT, Gangtok; LK, Lucknow; GU, Guwahati; RP, Raidopur; CW, Chowk; DM, Dimapur; SH, Shillong; PN, Patna; AB, Allahabad; IM, Imphal; GY, Gaya; UJ, Ujjain; BP, Bhopal; IN, Indore; JR, Jamnagar; HW, Howarah; SD, Sealdah; KL, Kolkata; RJ, Rajkot; DW, Dwarka; AD, Ahemdabad; PA, Paradeep; BN, Bhubneswar; PU, Puri; SI, Shirdi; NA, Nashik; MU, Mumbai; VP, Visakhapatnam; VD, Vijaywada; PJ, Panaji; MA, Madgaon; GK, Gokarna; ML, Manglore; BL, Banglore; YS, Yeswantpur; PC, Pondicherry; ER, Ernakulam; TR, Thiruvananthapuram; KR, Kanniyakumari.

Details of collections of D. ananassae

(ii) Chromosomal analyses
To estimate the inversion frequencies, wild females collected from natural populations were cultured individually in food vials and chromosomal analysis of F1 larvae was done using the lacto-aceto-orcein method. The present quantitative analysis is based on the identification of the karyotypes of only one F1 larva from each wild female. Breakpoints were determined by comparison with the standard map of polytene chromosomes of D. ananassae constructed by Ray-Chaudhuri & Jha (Reference Ray-Chaudhuri and Jha1966).
(iii) Statistical analyses
Simple correlations between frequencies of different inversions and correlation and multiple regression of angularly transformed inversion frequencies on latitude, longitude and altitude were analysed.
(iv) Genetic divergence
Nei's (Reference Nei1973) gene diversity formulae (HT, HS, GST and DM) and Nei's (Reference Nei1972) genetic identity (I) were used to evaluate the distribution of genetic diversity within and among populations and also the broad geographic trends in genetic diversity. Genetic distance was also estimated to determine the temporal divergence between the same populations studied two decades earlier and analysed during the present study (Singh, Reference Singh1984a, Reference Singhb, Reference Singh1989a, Reference Singhb, Reference Singh1991).
3. Results
(i) Chromosome inversions
All the populations showed the presence of the three cosmopolitan inversions, with alpha ranging from 48·9% (Haridwar) to 97·6% (Shillong), delta from 6·3% (Lucknow) to 77·7% (Kanniyakumari), and eta from 3·1% (Kangra) to 38·3% (Gangtok). Data on inversion frequencies are presented in Table 2. In general, inversions are more prevalent in the south and north-eastern parts of India while standard gene arrangements are more common in north Indian populations, thus showing a north–south trend in inversion frequencies. However, populations from the similar ecogeographic regions, i.e. from the same state, show more or less similar trends in inversion frequencies. The same is true for the level of inversion heterozygosity, which ranges from 0·18 in Sealdah to 1·85 in Pondicherry (Table 2). Quantitative data on the frequencies of the three cosmopolitan inversions in Indian natural populations of D. ananassae show that there are significant variations in the frequencies of these inversions and the level of inversion heterozygosity among the populations, and that the natural populations are geographically differentiated at the level of inversion polymorphism.
Frequencies (in per cent) of three inversions, namely AL (2L), DE (3L) and ET (3R), and the level of inversion heterozygosity in natural populations of D. ananassae

(ii) Statistical analyses
For the cosmopolitan inversions, a significant correlation with latitude, longitude and altitude was not found even after multiple regression analysis (Table 3). Correlations between frequencies of different inversions were positive but insignificant (Table 4).
Pearson correlation coefficients (r) and regression analysis of inversion frequencies with latitude, longitude and altitude
(P>0·05).
Pearson correlation coefficients (r) between frequencies of different inversions
(P>0·05).
(iii) Genetic differentiation (temporal and spatial) at the level of inversion polymorphism
Genetic distance was estimated to determine the temporal divergence between the same populations studied two decades earlier and analysed during the present study. Time of collection of initial populations (collected and analysed two decades earlier) and same populations (final populations) analysed in the present study along with D values and chi-square (χ2) values are given in Table 5. Among 12 such populations, D came closer to zero in each comparison, which shows no divergence on the temporal scale. Also, a 2× n χ2 test to measure differences in karyotypic (2L, 3L and 3R) frequencies was statistically insignificant in all comparisons. Estimates of Nei's gene diversity (Table 6) showed that total gene diversity (HT) values varied between 0·255 (GY) and 0·506 (JR) with an average of 0·456. Within-population diversity (HS) values ranged from 0·160 (ML) to 0·461 (PC) with an average of 0·308, while diversity among populations (GST) ranged from 0·054 (GY) to 0·638 (ML) with an average of 0·333. To determine broad geographic trends in genetic diversity, populations from the same state or province have been grouped together (Table 7). This gives a value for total diversity (HT) of 0·453, for within-population diversity (HS) of 0·315) and for among-population diversity (GST) of 0·311), while the magnitude of absolute gene differentiation (DM) is 0·220. The analysis showed that 31·1% of genetic differentiation could be attributable to the geographic location of the population. Genetic identity was also calculated among 45 natural populations to determine spatial divergence. Genetic identity values (given as supplementary data in Table S1) range from 0·564 (LK vs GK) to the maximum of 1·0 (DN vs UJ; KL vs SD and UJ vs IN). The 2× n χ2 values to measure the differences in karyotype frequencies (2L, 3L and 3R) among natural populations were calculated but the χ2 values and associated probabilities are not given here due to the size of the table. In an overall comparison, it is evident that most statistically significant differences in karyotypic frequencies are found between populations from different ecogeographic regions. However, in most of the comparisons between populations coming from similar regions, differences are statistically not significant. For instance, differences are highly significant (P<0·001) for LK vs GK but insignificant differences (P>0·05) are found for DN vs UJ; UJ vs IN pairs, etc. The comparisons by calculating 2× n χ2 values between populations corroborate the results obtained from the I values.
Values of genetic distance (D) and 2× n χ2 analysis between populations of D. ananassae analysed in the present study and the similar populations analysed previously

* P>0·05.
Abbreviations: Refer to localities listed in Table 1.
References: aSingh(Reference Singh1984a) ; bSingh (Reference Singh1984b) ; cSingh (Reference Singh1989a) ; dSingh (Reference Singh1989b) ; eSingh (Reference Singh1991) ; fpresent study.
Nei's gene diversity statistics and population differentiation parameters across 45 Indian natural populations of D. ananassae

Abbreviations: HT, total diversity; HS, diversity within populations; GST, diversity among populations; DM, absolute population differentiation.
Nei's gene diversity statistics and population differentiation parameters when 45 Indian natural populations of D. ananassae were grouped by regions

Abbreviations: HT, total diversity; HS, diversity within populations; GST, diversity among populations; DM, absolute population differentiation.
Genetic identity (l) estimated from the gene arrangement frequencies among the natural populations of D. ananassae

A dendrogram was constructed by UPGMA clustering of I values, among the 45 natural populations (see Fig. S1 in the supplementary material). As shown in the dendrogram, no definite trends could be revealed, barring a few cases where populations that are geographically separated and with entirely different climatic conditions show little genetic similarity, such as LK vs GK; CW vs ER and CW vs MA, etc. Here, LK and CW (in Uttar Pradesh) are inland regions while MA, GK and ER are coastal regions. The maximum similarity between KL and SD is reasonable as these are separated geographically by less than 10 km. In other cases, similarity and dissimilarity among the populations have nothing to do with either the geographic distances or geo-climatic factors. Also, there is no trend showing a positive relationship between genetic distance and geographic distance. KR shows the least genetic identity with the rest of the populations.
Dendrogram of natural populations of D. ananassae based on UPGMA clustering of genetic identity values.
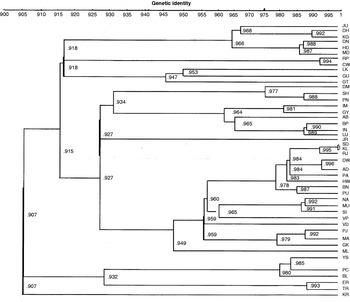
In all the pairwise comparisons, south Indian populations show a high level of genetic identity amongst themselves as well as with north Indian populations and north-eastern populations except PC and BL in some instances. Populations from West Bengal (KL, SD, HW), Gujarat (AD, JR, DW, RJ), Andhra Pradesh (VD, VP), Orissa (PU, PA, BN) and Maharashtra (MU, NA, SI) show higher identity with each other, which could be due to similarity in geo-climatic conditions as most of the populations from these regions were collected from coastal regions and adjoining areas. Surprisingly, ML shows little genetic identity with the KR, ER and TR populations, though these regions are geographically close and lie along the same coast (west coast of India). Bihar populations show a higher genetic identity with north-eastern populations. Thus, broadly all the population pairs from similar states that were collected at the same time show a higher genetic similarity with each other.
4. Discussion
The results of the present study confirm previous findings in a new way because of the total geographical areas covered, the time period spanned and the number of populations analysed from different parts of the country.
(i) Geographic pattern of inversion frequencies and level of inversion heterozygosity
Populations from similar geographic regions show similar patterns with respect to the frequency of three cosmopolitan inversions and the level of inversion heterozygosity. This could be due to identical habitat and similar geo-climatic conditions. There are, however, spatial differences, which could be due to inter-habitat differences. When populations were grouped by region, most genetic variation was found among populations between different regions rather than populations within regions. Changes in inversion frequencies in space provide strong evidence that inversion polymorphism is maintained by selection (Mettler et al., Reference Mettler, Voelkar and Mukai1977; Stalker, Reference Stalker1980; Kennington et al., Reference Kennington, Partridge and Hoffmann2006).
(ii) Temporal divergence
In one of the longest temporal studies conducted (nearly two decades), none of the populations showed temporal changes, i.e. there were no long-term directional changes and hence temporal constancy.
(iii) Spatial (geographical) divergence
It is evident from the present analysis (after including estimates of Nei's GST and I) that Indian natural populations of D. ananassae have undergone a considerable degree of genetic divergence at the level of inversion polymorphism. The results presented here indicate spatial changes, i.e. inter-habitat differences without temporal changes (inter-decadal differences) in inversion polymorphism of D. ananassae. Whereas spatial changes in the present study reflect flexibility, the lack of temporal changes reveals rigidity in the polymorphic system of D. ananassae – though, the terms flexible and rigid are not strictly fixed in their meaning (Dobzhansky, Reference Dobzhansky1962).
Studies of molecular genetic variation in Indian natural populations of D. ananassae to date with respect to the level of genetic differentiation show (FST estimates and NJ approach based on FST) that FST values of the order of 0·1 (much lower than our GST estimates) apply to Indian populations (Vogl et al., Reference Vogl, Das, Beaumont, Mohanty and Stephan2003; Das et al., Reference Das, Mohanty and Stephan2004; Schug et al., Reference Schug, Smith, Tozier-Pearce and McEvey2007). Schug et al. (Reference Schug, Smith, Tozier-Pearce and McEvey2007) have concluded that adaptive mutations have had a significant influence on molecular variation across broad regions of the genome. Even considering enzyme polymorphism studies, the main conclusion is that populations of D. ananassae have a moderate level of genetic variation and appear to be weakly differentiated in spite of their worldwide distribution (see Tobari, Reference Tobari1993, for references). If chromosome data are considered, D. ananassae populations typically show a high level of differentiation (see Singh, Reference Singh1998, for references).Thus, compared with allozymes and molecular markers, the picture of geographic differentiation appears to be different for chromosome rearrangements, which are more variable and more differentiated even over short distances. This could be partly due to the fact that allozymes and molecular markers are in general more ‘neutral’ than chromosome rearrangements.
The most important conclusion of the two-decade study, after comparing the present work with the previous study (Singh, Reference Singh1984a, Reference Singhb, Reference Singh1989a, Reference Singhb, Reference Singh1991), is that the three cosmopolitan inversions have continued to segregate within populations at fairly similar frequencies. The general geographic pattern has also remained similar, which could be due to similarity in geo-climatic conditions, hence pointing towards the role of natural selection. It could therefore be said that natural populations of D. ananassae are geographically differentiated due to their adaptation to varying environments, and natural selection operates to maintain the three cosmopolitan inversions.
Financial support from CSIR, New Delhi in the form of a Senior Research Fellowship to P. S. is gratefully acknowledged. We are grateful to Prof. B. Charlesworth, Associate Editor and three anonymous reviewers for their helpful suggestions on the manuscript. The research work of B. N. S. cited in this paper was supported by UGC and CAS in Zoology, Banaras Hindu University.


