

1. Introduction
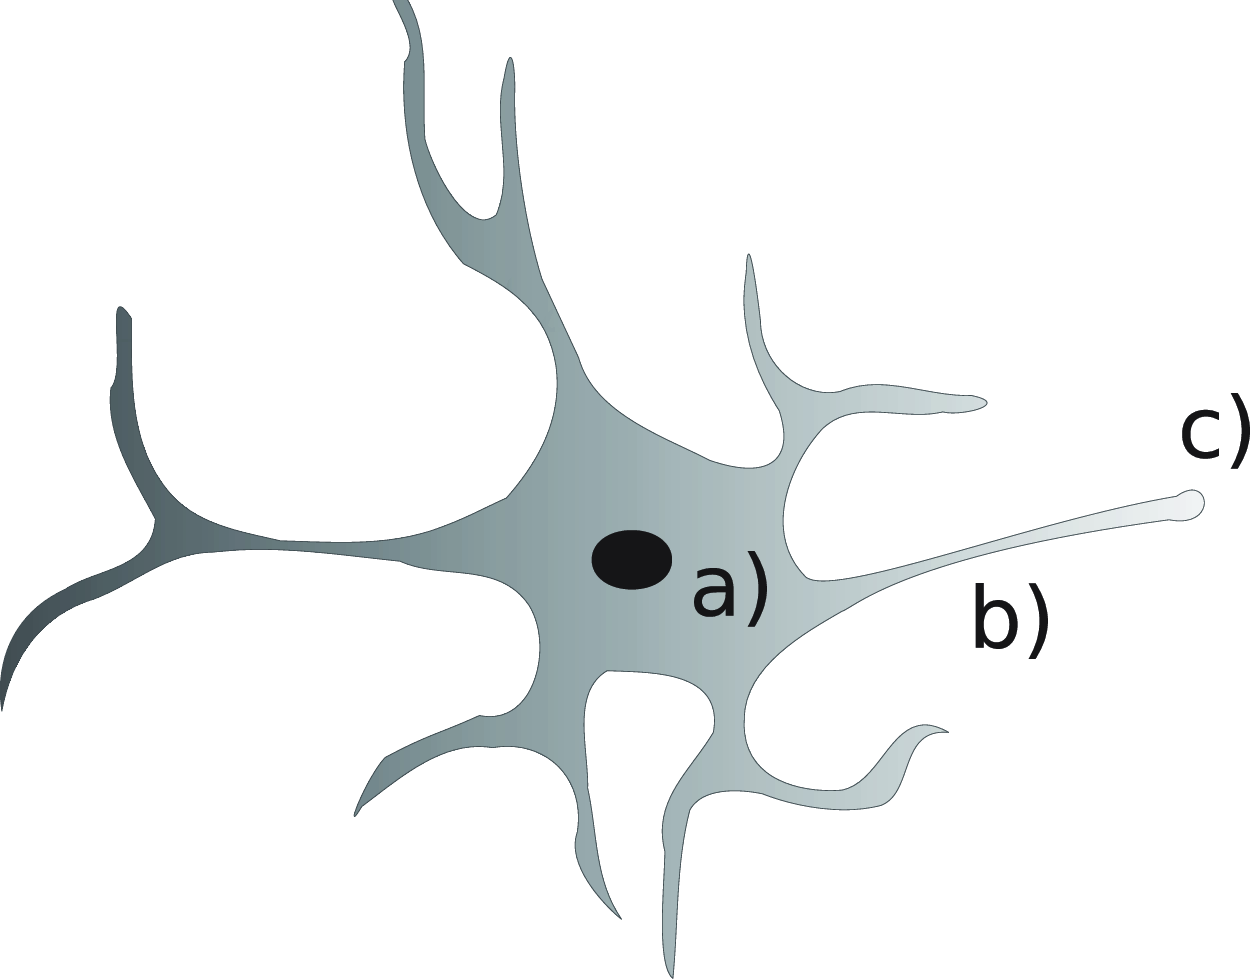
Mature neurons are highly polarised cells featuring functionally distinct compartments, the axons and the dendrites. Axons are ‘cables’ that have the ability to transmit electrical signals to other neurons and can extend up to a length of 1 m in humans. Dendrites form complex tree-like structures and act as recipients for axons of other neurons. This polarity is established during the maturing proceess as initially, newborn neurons feature several undifferentiated extensions of similar length called neurites that are highly dynamic [Reference Cooper8, Reference Hatanaka and Yamauchi18]. Eventually, one of these neurites is selected to become the axon. This is often called neurite outgrowth. The understanding of this process is still incomplete, despite progress in characterising the role of molecular mechanisms as well as influence of intra- and extracellular signaling molecules, see [Reference Takano, Xu, Funahashi, Namba and Kaibuchi30] for more details and further references. In this work, we focus on a single aspect of this process, namely the fact that the actual growth or shrinkage of neurites is due to the insertion or retraction of vesicles (i.e., circular structures composed of lipid membranes) at the outer tips of the neurites (growth cones). The vesicles themselves are produced in the cell body (soma) and then form complexes with motor proteins that allow for active transport along microtubules. The direction of transport is determined by the type of motor protein: kinesin results in anterograde transport (into the growth cones), while dynein motors move vesicles retrogradely to the soma. Both kinesins and dyneins are present on vesicles during their transport along microtubules, but only one of them is usually active at any given time [Reference Encalada, Szpankowski, Xia and Goldstein13, Reference Twelvetrees, Pernigo and Sanger33]; see Figure 1 for a sketch. The actual increase of the surface area of the plasma membrane is then due to the insertion of vesicles into the growth cone (exocytosis). Retraction, on the other hand, is accompanied by the removal of membrane material from the growth cone through endocytosis [Reference Pfenninger, Laurino and Peretti26, Reference Pfenninger27, Reference Tojima and Kamiguchi31]. Clearly, the (dis-)assembly of microtubules during growth and retraction is important, yet we neglect this effect in the present study in order to not further complicate the model and as we are primarily interested in the role of vesicle transport. Addition of microtubule dynamics is postponed to future work.
Sketch of a developing neuron. Here, a) represents the cell nucleus/soma where vesicles are produced, b) a neurite and c) a growth cone, that is, the location where vesicles are inserted/removed into the cell membrane.
1.1. Relation to existing work
While there are different models for the underlying biochemical processes of selecting the neurite which eventually becomes the axon (see also [Reference Oliveri and Goriely25] for a recent review), mathematical models examining the role of vesicle transport in this process are relatively scarce. On the other hand, there are several models for molecular motor-based transport, also in axons [Reference Bressloff and Levien5, Reference Friedman and Craciun15, Reference Friedman and Craciun16, Reference Newby and Bressloff24, Reference Smith and Simmons29]. All these models feature linear transport terms which do not take into account size exclusion or finite volume effects. Our starting point is a model with non-linear transport terms proposed in [Reference Bressloff and Karamched4] which, again, focuses on transport in a grown axon. In particular in [Reference Bressloff and Karamched4], a limited transport capacity inside the neurites is taken into account by size exclusion effects and antero- and retrogradely moving particles are modelled separately. We will use this approach as a basis for the transport within the neurites in our model. In [Reference Humpert, Di Meo, Püschel and Pietschmann19], a similar approach is taken, yet on a microscopic particle level. Furthermore, [Reference Humpert, Di Meo, Püschel and Pietschmann19] extends the model by coupling two copies of it to pools representing the amount of vesicles present at the soma and growth cones, respectively. The aim of this paper is to introduce a macroscopic model in the spirit of both [Reference Bressloff and Karamched4, Reference Humpert, Di Meo, Püschel and Pietschmann19], yet additionally allowing the length of the respective neurites to change. Different to [Reference Bressloff and Karamched4] (see also [Reference Burger, Di Francesco, Pietschmann and Schlake7]), our model will have linear diffusion but non-linear transport terms. Such a model can also be justified as limit of a discrete lattice model, see [Reference Bruna, Burger, Pietschmann, Wolfram, Bellomo, Carrillo and Tadmor6, Reference Kourbane-Houssene, Erignoux, Bodineau and Tailleur20]. We are able to show that the solution stays within a given interval (usually taken to be $[0,1]$
) so that the size exclusion property is preserved. Then, these equations which model transport inside the neurons are, as in [Reference Humpert, Di Meo, Püschel and Pietschmann19], coupled to ordinary differential equations for the evolution of the vesicle concentration at soma and tip, respectively. One of the main novelties is then to add a mechanism which allows for growth or shrinkage of the neurites depending on how many vesicles are present in the growth cones. Such free boundary models for neuron development have previously mostly been studies in the context of microtubule assembly, see [Reference Diehl, Henningsson, Heyden and Perna11, Reference Graham, Lauchlan and Mclean17, Reference McLean and Graham23]. These models focus on a single neurite in which transport of microtubules is modelled again by a linear diffusion advection equation on a domain of varying length. This is then coupled to an Ordinary Differential Equation (ODE) at one end of the domain accounting for the extension/retraction due to the microtubules. This coupling is sometimes performed via Dirichlet condition. Closer to our approach is the coupling through flux (Robin)-type boundary condition as in [Reference Bressloff and Levien5]. However, in this work, the authors only assume a linear relation for the boundary terms contrary to our study.
$[0,1]$
) so that the size exclusion property is preserved. Then, these equations which model transport inside the neurons are, as in [Reference Humpert, Di Meo, Püschel and Pietschmann19], coupled to ordinary differential equations for the evolution of the vesicle concentration at soma and tip, respectively. One of the main novelties is then to add a mechanism which allows for growth or shrinkage of the neurites depending on how many vesicles are present in the growth cones. Such free boundary models for neuron development have previously mostly been studies in the context of microtubule assembly, see [Reference Diehl, Henningsson, Heyden and Perna11, Reference Graham, Lauchlan and Mclean17, Reference McLean and Graham23]. These models focus on a single neurite in which transport of microtubules is modelled again by a linear diffusion advection equation on a domain of varying length. This is then coupled to an Ordinary Differential Equation (ODE) at one end of the domain accounting for the extension/retraction due to the microtubules. This coupling is sometimes performed via Dirichlet condition. Closer to our approach is the coupling through flux (Robin)-type boundary condition as in [Reference Bressloff and Levien5]. However, in this work, the authors only assume a linear relation for the boundary terms contrary to our study.
1.2. Contribution and outline
We make the following contributions:
-
• Based on [Reference Bressloff and Karamched4, Reference Humpert, Di Meo, Püschel and Pietschmann19], we introduce a macroscopic model for vesicle transport in developing neuron cells that includes multiple neurites, coupled with ODEs for the vesicle concentration in soma and growth cones. We use a non-linear transport mechanism to include finite size effects extending paradigm used in most of the previous models.
-
• We add a mechanism that allows for a change of neurite length depending on the respective vesicle concentration, which renders the model a free boundary problem.
-
• We rigorously prove existence and uniqueness of solutions, including box constraints corresponding to size exclusion effects due to the finite volume of vesicles.
-
• We provide a finite volume discretisation that preserves the box constraints.
-
• We perform a scaling of the model to biological reasonable regimes and then give some numerical experiments illustrating different behaviours of the model, in particular cycles of expansion and retraction as observed in experiments.
The paper is organised as follows. In Section 2, we present our model in detail. Section 3 contains some preliminaries and is then devoted to weak solutions, while Section 4 contains a brief discussion on (constant) stationary solutions. Section 5 provides a finite volume scheme, a non-dimensionalisation together with the introduction of biologically relevant scales. Section 6 is devoted to the numerical studies. Finally, Section 7 provides a brief conclusion and outlook.
2. Mathematical model
In this section, we present a mathematical model for the growth process based on the principles stated in the introduction. For the reader’s convenience, we will focus on the case of a two neurites connected to the soma, pointing out that the generalisation to multiple neurites is straightforward. For $j=1,2$
, the unknowns of our model read as follows:
$j=1,2$
, the unknowns of our model read as follows:
-
• $L_j(t)$
denotes the length of the respective neurite at time
$t$
;
$L_j(t)$
denotes the length of the respective neurite at time
$t$
; -
•
$f_{+,j}(t,x)$
and
$f_{-,j}(t,x)$
denote the density of motor protein complexes in the neurite
$j$
that move towards the growth cone (anterograde direction) and towards the soma (retrograde direction), respectively; -
•
$\Lambda _{\text{som}}(t)$
is the amount of vesicles present in the soma at time
$t$
; -
•
$\Lambda _j(t)$
is the amount of vesicles present in the tip of each neurite at time
$t$
.


Sketch of the model neuron: it consists of two neurites modelled by two intervals $(0, L_1(t))$
and
$(0, L_1(t))$
and $(0, L_2(t))$
. The squares correspond to pools where vesicles can be stored. More precisely, the pool in the middle corresponds to the soma, while the others stand for the corresponding growth cones. The interaction between neurites and pools is realised via boundary fluxes, and the parameters governing their respective strength are displayed along with arrows of the transport direction. For an easy visualisation,
$(0, L_2(t))$
. The squares correspond to pools where vesicles can be stored. More precisely, the pool in the middle corresponds to the soma, while the others stand for the corresponding growth cones. The interaction between neurites and pools is realised via boundary fluxes, and the parameters governing their respective strength are displayed along with arrows of the transport direction. For an easy visualisation, $(0, L_1(t))$
is illustrated as a mirrored copy of
$(0, L_1(t))$
is illustrated as a mirrored copy of $(0, L_2(t))$
.
$(0, L_2(t))$
.
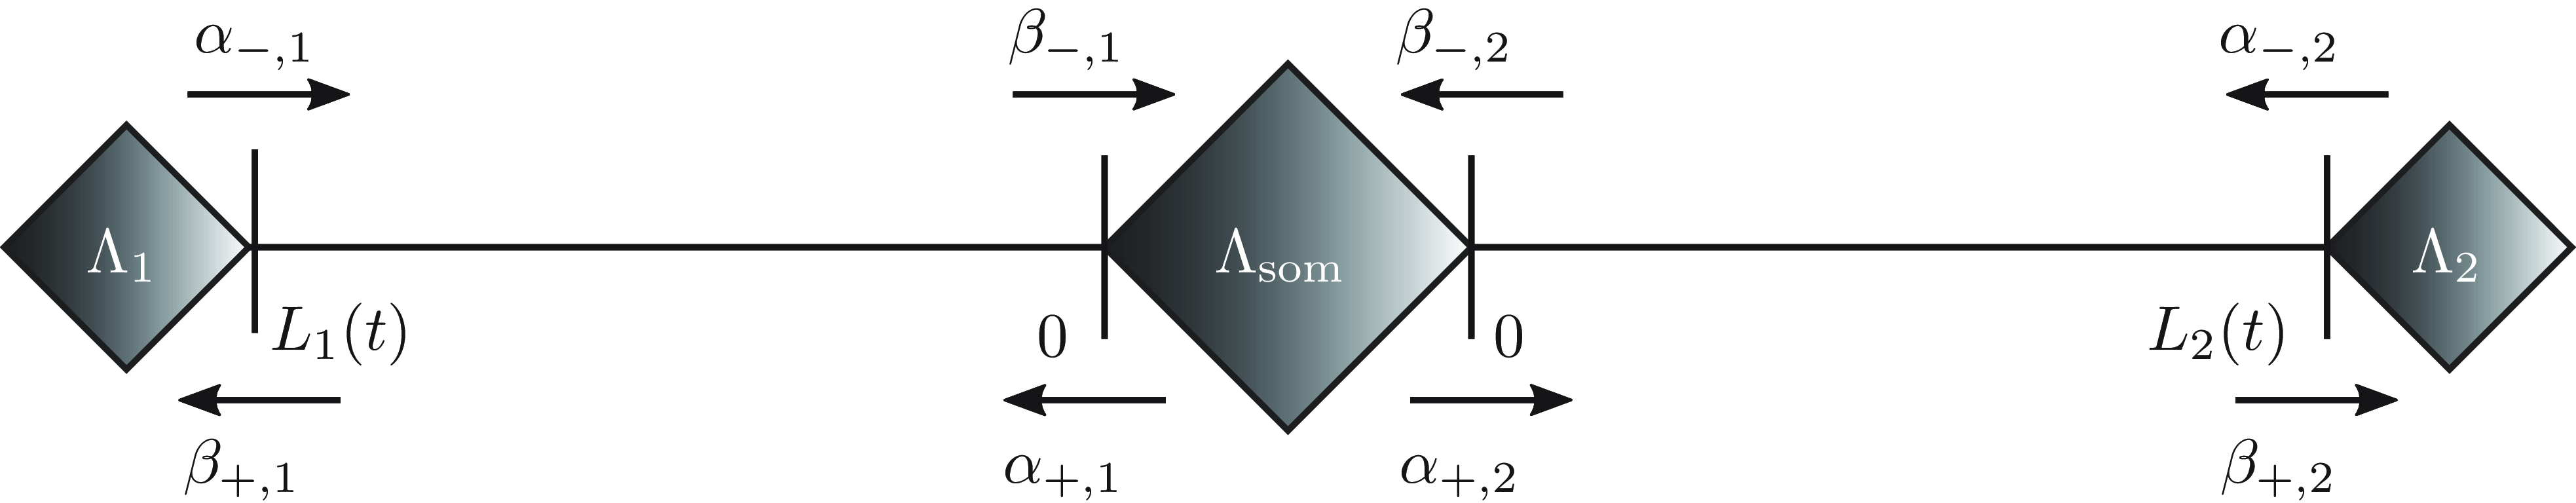
The complete model consists of equations governing the dynamics inside each neurite, coupled with ODEs at the soma and growth cones, respectively, as well as with equations accounting for the change of the neurites lengths, see Figure 2 for an illustration of the couplings. We will discuss each component separately.
1. Dynamics within the neurites. Let $v_0\gt 0$
be the velocity of vesicles as they move along neurites and let
$v_0\gt 0$
be the velocity of vesicles as they move along neurites and let $\rho _j = \rho _j(t,x) \;:\!=\; f_{+,j} + f_{-,j}$
be the total vesicle density,
$\rho _j = \rho _j(t,x) \;:\!=\; f_{+,j} + f_{-,j}$
be the total vesicle density, $j= 1, 2$
. We define the fluxes of antero- and retrogradely moving vesicle–motor complexes as:
$j= 1, 2$
. We define the fluxes of antero- and retrogradely moving vesicle–motor complexes as:
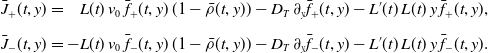
 \begin{equation} \begin{split} J_{+,j}&\;:\!=\; v_0\,f_{+,j}\,(1- \rho _j)- D_T\,\partial _x f_{+,j}, \quad J_{-,j}\;:\!=\; -v_0\,f_{-,j}\,(1- \rho _j)- D_T\,\partial _x f_{-,j}, \end{split} \end{equation}
respectively, where $D_T \gt 0$
is a positive diffusion constant. Let us emphasise again that compared to earlier models [Reference Bressloff and Levien5, Reference Friedman and Craciun15, Reference Friedman and Craciun16, Reference Newby and Bressloff24, Reference Smith and Simmons29], we include a non-linear transport term to account for finite size effects. We assume additionally that the complexes can (randomly, possibly via dissociation) change their direction with a given rate
$D_T \gt 0$
is a positive diffusion constant. Let us emphasise again that compared to earlier models [Reference Bressloff and Levien5, Reference Friedman and Craciun15, Reference Friedman and Craciun16, Reference Newby and Bressloff24, Reference Smith and Simmons29], we include a non-linear transport term to account for finite size effects. We assume additionally that the complexes can (randomly, possibly via dissociation) change their direction with a given rate $\lambda \ge 0$
. We obtain the following drift-diffusion-reaction equations, a copy of which holds true in each neurite separately,
$\lambda \ge 0$
. We obtain the following drift-diffusion-reaction equations, a copy of which holds true in each neurite separately,
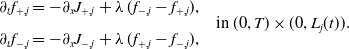 \begin{align} \begin{aligned} \partial _t f_{+,j}&= -\partial _x J_{+,j} + \lambda \, (f_{-,j} - f_{+,j}), \\[5pt] \partial _t f_{-,j}&= -\partial _x J_{-,j} + \lambda \, (f_{+,j} - f_{-,j}), \end{aligned} \quad \text{in } (0, T) \times (0, L_j(t)). \end{align}
Here, $L_j(t)$
is the current length of the domain and
$L_j(t)$
is the current length of the domain and $T\gt 0$
is a fixed final time. Note that the constants
$T\gt 0$
is a fixed final time. Note that the constants $v_0$
,
$v_0$
, $D_T$
and
$D_T$
and $\lambda$
do not depent on
$\lambda$
do not depent on $j$
as they are related to the characteristics of the transport of vesicle–motor protein complexes which are the same in every neurite.
$j$
as they are related to the characteristics of the transport of vesicle–motor protein complexes which are the same in every neurite.
2. Coupling to soma and pools. We assume that all neurites are connected to the soma at the point $x=0$
. There, we have the following effects:
$x=0$
. There, we have the following effects:
-
• Retrograde vesicles leave the neurite and enter the soma with rate
$\beta _{-,j}(\Lambda _{\text{som}})\, f_{-,j}$
. Here, the function
$\beta _{-,j}$
allows for a control of incoming vesicles in terms of the available quantity in the soma. The intuition is that the soma is less likely to allow for incoming vesicles when it already contains a larger number of them. -
• Anterograde vesicles can leave the soma and enter the lattice with a given rate
$\alpha _{+,j}(\Lambda _{\text{som}})\,g_{+,j}(f_{+,j}, f_{-,j})$
if there is enough space, that is, if
$\rho _j\lt 1$
. This is ensured by assuming that the non-negative function
$g_{+,j}$
satisfies
$g_{+,j}(f_{+,j}, f_{-,j}) = 0$
whenever
$\rho _j = f_{+,j} + f_{-,j}=1$
. The additional factor
$\alpha _{+,j}(\Lambda _{\text{som}})$
reflects that the number of vesicles entering the neurite depends on the amount which is available within the soma. In particular, we ask for
$\alpha _{+,j}(0)=0.$


At the point $x= L_j(t)$
, the neurite is connected to its respective pool and we have
$x= L_j(t)$
, the neurite is connected to its respective pool and we have
-
• Anterograde vesicles leave the lattice and enter the pool with rate
$\beta _{+,j}(\Lambda _j)\,f_{+,j}$
. -
• Retrograde particles move from the pool into the neurite, once again only if space in the domain is available, with rate
$\alpha _{-,j}(\Lambda _j)\,g_{-,j}(f_{+,j},f_{-,j})$
. Here, the functions
$\beta _{+,j}$
and
$\alpha _{-,j}$
serve the same purpose as
$\beta _{-,j}$
and
$\alpha _{+,j}$
previously, yet with pool instead of soma. Figure 2 provides a sketch of this situation. This behaviour is implemented by imposing the following flux boundary conditions (for each neurite):(2.3)
\begin{align} J_{+,j}(t,0) &= \alpha _{+,j}(\Lambda _{\text{som}}(t))\,g_{+,j}(\boldsymbol{f}_{j}(t,0)), \nonumber \\[5pt] -J_{-,j}(t,0) &= \beta _{-,j}(\Lambda _{\text{som}}(t))\,f_{-,j}(t,0), \nonumber \\[5pt] J_{+,j}(t, L_j(t))- L'_j(t)\, f_{+,j}(t, L_j(t)) &= \beta _{+,j}(\Lambda _j(t))\,f_{+,j}(t, L_j(t)), \nonumber \\[5pt] -J_{-,j}(t, L_j(t))+ L_j'(t)\, f_{-,j}(t, L_j(t)) &= \alpha _{-,j}(\Lambda _j(t))\,g_{-,j}({\boldsymbol{f}_{j}(t,L(t))}), \end{align}
$j=1,2$
, for suitable functions
$\alpha _{i,j},\,\beta _{i,j}$
, and
$g_{i,j}$
,
${i= +,-}, j=1,2$
, whose properties will be specified later, and with the shortened notation
$\boldsymbol{f}_j(\cdot \,, \cdot )\;:\!=\; (f_{+,j}(\cdot \,, \cdot ), f_{-,j}(\cdot \,, \cdot ))$
,
$j= 1, 2$
. The additional terms on the left-hand side of the boundary conditions at
$L_j(t)$
in (2.3) account for the mass flux of vesicles that occurs when the length of the neurite changes. They are especially important in order to keep track of the total mass in the system, see also [Reference Breden, Chainais-Hillairet and Zurek2, Reference Portegies and Peletier28] for similar constructions.


3. Dynamics of the free boundary. We assume that the length of each neurite $L_j$
satisfies the following ordinary differential equation:
$L_j$
satisfies the following ordinary differential equation:
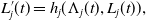 \begin{equation} L'_j(t) = h_j(\Lambda _j(t), L_j(t)), \end{equation}
where $h_j$
,
$h_j$
, $j= 1,2$
, are smooth functions to be specified. We think of
$j= 1,2$
, are smooth functions to be specified. We think of $h_j$
as functions that change sign at a critical concentration of
$h_j$
as functions that change sign at a critical concentration of $\Lambda _j$
(i.e., switch between growth or shrinkage), which may depend on the current length of the neurite itself (e.g., in order to stop shrinkage at a minimal length).
$\Lambda _j$
(i.e., switch between growth or shrinkage), which may depend on the current length of the neurite itself (e.g., in order to stop shrinkage at a minimal length).
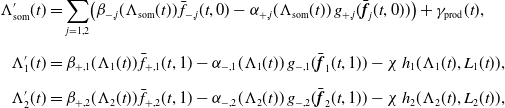
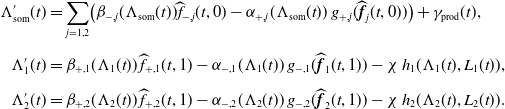
4. Dynamics in soma and growth cones. Finally, we describe the change of number of vesicles in the soma and the respective neurite growth cones, due to vesicles entering and leaving the pools. In addition, a production term is added at the soma, while for the growth cones we add terms that model the consumption or production of vesicles due to growth or shrinkage of the neurite, respectively. We obtain
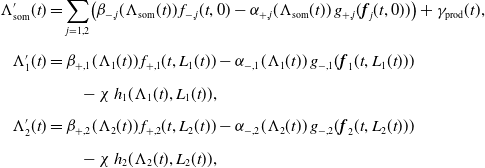 \begin{equation} \begin{aligned} \Lambda '_{\text{som}}(t) &= \sum _{j=1,2} \bigl ( \beta _{-,j}(\Lambda _{\text{som}}(t))\,f_{-,j}(t,0) - \alpha _{+,j}(\Lambda _{\text{som}}(t))\,g_{+,j}(\boldsymbol{f}_{j}(t,0)) \bigr ) + \gamma _{\text{prod}}(t), \\[5pt] \Lambda '_{1}(t) &= \beta _{+,1}(\Lambda _1(t))\,f_{+,1}(t, L_1(t))- \alpha _{-,1}(\Lambda _1(t))\, g_{-,1}(\boldsymbol{f}_{1}(t, L_1(t))) \\[5pt] & \qquad -\chi \, h_1(\Lambda _1(t), L_1(t)), \\[5pt] \Lambda '_{2}(t) &= \beta _{+,2}(\Lambda _2(t))\,f_{+,2}(t, L_2(t))- \alpha _{-,2}(\Lambda _2(t))\,g_{-,2}(\boldsymbol{f}_{2}(t, L_2(t))) \\[5pt] & \qquad -\chi \,h_2(\Lambda _2(t), L_2(t)), \end{aligned} \end{equation}
where $\chi \gt 0$
is a given parameter that has the units vesicles/length and describes the amount of vesicles needed for one unit of neurite length, while
$\chi \gt 0$
is a given parameter that has the units vesicles/length and describes the amount of vesicles needed for one unit of neurite length, while $\gamma _{\textrm{prod}}$
accounts for the amount of vesicles that are produced in the soma.
$\gamma _{\textrm{prod}}$
accounts for the amount of vesicles that are produced in the soma.
Remark 2.1. Note that, except for the influence of the growth term $\gamma _{\text{prod}}(t)$
, the total mass is preserved. It is defined by the following quantity:
$\gamma _{\text{prod}}(t)$
, the total mass is preserved. It is defined by the following quantity:
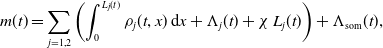 \begin{equation*} m(t) = \sum _{j=1,2}\left (\int _0^{L_j(t)} \rho _j(t,x)\,\textrm {d}x + \Lambda _j(t) + \chi \,L_j(t)\right ) + \Lambda _{\text {som}}(t), \end{equation*}
where we emphasise that also the material of which the neurites are made of need to be taken into account which is done via the terms $\chi \,L_j(t)$
. Then, a formal calculation yields the following equation of the evolution of the total mass:
$\chi \,L_j(t)$
. Then, a formal calculation yields the following equation of the evolution of the total mass:
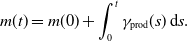 \begin{equation*} m(t) = m(0) + \int _0^t\gamma _{\text {prod}}(s)\,\mathrm ds. \end{equation*}
3. Existence of weak solutions
The aim of this section is to provide existence of a unique weak solution to the model (2.1)–(2.5). Let us first give some preliminaries.
3.1. Preliminaries
Let $L\gt 0$
and let
$L\gt 0$
and let $1 \le p\lt \infty$
. We denote by
$1 \le p\lt \infty$
. We denote by $L^p(0,L)$
and
$L^p(0,L)$
and $W^{1,p}(0,L)$
the usual Lebesgue and Sobolev spaces. For
$W^{1,p}(0,L)$
the usual Lebesgue and Sobolev spaces. For $p= 2$
, we write
$p= 2$
, we write $H^1({0,L})$
instead of
$H^1({0,L})$
instead of $W^{1,2}({0,L})$
. Furthermore,
$W^{1,2}({0,L})$
. Furthermore, $H^1({0,L})'$
is the dual space of
$H^1({0,L})'$
is the dual space of $H^1({0,L})$
.
$H^1({0,L})$
.
It is well known (see e.g., [Reference Adams1]) that there exists a unique linear, continuous map $\Gamma \colon W^{1,p}({0,L}) \to{\mathbb{R}}$
known as the trace map such that
$\Gamma \colon W^{1,p}({0,L}) \to{\mathbb{R}}$
known as the trace map such that $\Gamma (u)= u(0)$
for all
$\Gamma (u)= u(0)$
for all $u \in W^{1,p}({0,L}) \cap C([0,L])$
. In addition, let us recall the following trace estimate [Reference Brenner and Scott3, Theorem 1.6.6]:
$u \in W^{1,p}({0,L}) \cap C([0,L])$
. In addition, let us recall the following trace estimate [Reference Brenner and Scott3, Theorem 1.6.6]:
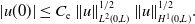 \begin{equation} |u(0)| \le C_{\text{e}}\,\|u\|_{L^2({0,L})}^{1/2}\,\|u\|_{H^1({0,L})}^{1/2}. \end{equation}
Let $T\gt 0$
and let
$T\gt 0$
and let $(B, \|\cdot \|_B)$
be a Banach space. For every
$(B, \|\cdot \|_B)$
be a Banach space. For every $1 \le r\lt \infty$
, we denote by
$1 \le r\lt \infty$
, we denote by $L^r(0,T; B)$
the Bochner space of all measurable functions
$L^r(0,T; B)$
the Bochner space of all measurable functions $u\colon [0,T] \to B$
such that
$u\colon [0,T] \to B$
such that $ \|u\|_{L^r(0,T; B)}^r\;:\!=\; \int _0^T \|u(t)\|_B^r \; \,\textrm{d}t \lt \infty .$
For
$ \|u\|_{L^r(0,T; B)}^r\;:\!=\; \int _0^T \|u(t)\|_B^r \; \,\textrm{d}t \lt \infty .$
For $r= \infty$
, the norm of the corresponding space
$r= \infty$
, the norm of the corresponding space $L^\infty (0,T; B)$
is given by
$L^\infty (0,T; B)$
is given by $ \|u\|_{L^\infty (0,T; B)}\;:\!=\; \mathrm{ess \,sup}_{0 \le t \le T} \|u(t)\|_B.$
Finally,
$ \|u\|_{L^\infty (0,T; B)}\;:\!=\; \mathrm{ess \,sup}_{0 \le t \le T} \|u(t)\|_B.$
Finally, $C([0, T]; B)$
contains all continuous functions
$C([0, T]; B)$
contains all continuous functions $u\colon [0, T] \to B$
such that
$u\colon [0, T] \to B$
such that
 \begin{equation*} \|u\|_{C([0, T]; B)}\;:\!=\; \max _{0 \le t \le T} \|u(t)\|_B\lt \infty . \end{equation*}
We refer to [Reference Evans14] as a reference for Bochner spaces. For every $a \in{\mathbb{R}}$
, we set
$a \in{\mathbb{R}}$
, we set $a^{\pm }\;:\!=\; \max \{\pm a, 0\}$
and for
$a^{\pm }\;:\!=\; \max \{\pm a, 0\}$
and for $u \in W^{1,p}({0,L})$
we define
$u \in W^{1,p}({0,L})$
we define $u^\pm (\cdot )\;:\!=\; u(\cdot )^\pm$
and will use the fact that
$u^\pm (\cdot )\;:\!=\; u(\cdot )^\pm$
and will use the fact that $u^\pm \in W^{1,p}(0,L)$
.
$u^\pm \in W^{1,p}(0,L)$
.
3.2. Transformation for a fixed reference domain
Before we give our definition of weak solutions, state the necessary assumptions and our main theorem, we transform (3.6) into an equivalent system set on a fixed reference domain. This facilitates the proofs and also the spaces that we need to work in. To this end, we make the following change of variables:
 \begin{equation*} y= y(t, x)=: \frac {x}{L(t)} \quad \longleftrightarrow \quad x= L(t) y. \end{equation*}
Then we define the functions $ \bar{f}_i(t, y)= f_i(t, x)= f_i(t, L(t) y)$
and observe that
$ \bar{f}_i(t, y)= f_i(t, x)= f_i(t, L(t) y)$
and observe that
 \begin{equation} \begin{split} \partial _x f_i= \frac{1}{L(t)}\, \partial _y \bar{f}_i, \quad \partial _t f_i= \partial _t \bar{f}_i- L'(t)\,y\, \partial _x f_i= \partial _t \bar{f}_i- \frac{L'(t)}{L(t)}\, y\, \partial _y \bar{f}_i, \quad \,\textrm{d}x= L(t) \,\textrm{d}y. \end{split} \end{equation}
Using (3.2), taking into account that, by the product rule, $y\, \partial _y \bar{f}_+= \partial _y(y\, \bar{f}_+)- \bar{f}_+$
and rearranging, the first equation of (2.2) reads as:
$y\, \partial _y \bar{f}_+= \partial _y(y\, \bar{f}_+)- \bar{f}_+$
and rearranging, the first equation of (2.2) reads as:
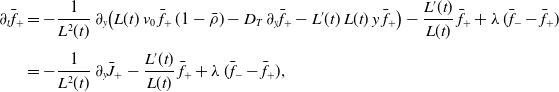 \begin{align} \partial _t \bar{f}_+&= -\frac{1}{L^2(t)}\, \partial _y \big (L(t)\, v_0\, \bar{f}_+\,(1- \bar{\rho })- D_T\, \partial _y \bar{f}_+ - L'(t)\,L(t)\, y\, \bar{f}_+\big ) - \frac{L'(t)}{L(t)}\, \bar{f}_++ \lambda \,(\bar{f}_- - \bar{f}_+) \nonumber \\[5pt] &= -\frac{1}{L^2(t)}\, \partial _y \bar{J}_+- \frac{L'(t)}{L(t)}\, \bar{f}_++ \lambda \,(\bar{f}_- - \bar{f}_+), \end{align}
and with similar arguments:
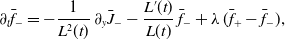 \begin{equation*} \partial _t \bar {f}_- = -\frac 1{L^2(t)}\,\partial _y \bar {J}_- - \frac {L'(t)}{L(t)}\, \bar {f}_- +\lambda \,(\bar {f}_+ - \bar {f}_-), \end{equation*}
where the fluxes are defined by:
 \begin{align*} \bar{J}_+(t,y) &= \phantom{-}L(t)\,v_0\,\bar{f}_+(t,y)\,(1- \bar{\rho }(t,y))- D_T\, \partial _y \bar{f}_+(t,y) - L'(t)\,L(t)\,y\,\bar{f}_+(t,y), \\[5pt] \bar{J}_-(t,y) &= -L(t)\,v_0\,\bar{f}_-(t,y)\,(1- \bar{\rho }(t,y))- D_T\, \partial _y \bar{f}_-(t,y) - L'(t)\,L(t)\,y\,\bar{f}_-(t,y). \end{align*}
Note that the fluxes $J_+$
and
$J_+$
and $\bar{J}_+$
are related to each other via
$\bar{J}_+$
are related to each other via
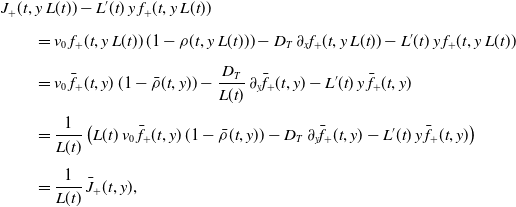 \begin{align*} & J_+(t, y\,L(t))- L'(t)\, y\, f_+(t, y\,L(t)) \\[5pt] &\qquad = v_0 \,f_+(t, y\,L(t))\, (1- \rho (t, y\,L(t)))- D_T\, \partial _x f_+(t, y\,L(t))- L'(t)\,y\,f_+(t, y\,L(t)) \\[5pt] &\qquad = v_0 \,\bar{f}_+(t,y)\,(1- \bar{\rho }(t, y))- \frac{D_T}{L(t)}\, \partial _y \bar{f}_+(t,y)- L'(t) \,y\,\bar{f}_+(t,y) \\[5pt] &\qquad =\frac{1}{L(t)}\, \big (L(t)\, v_0\, \bar{f}_+(t,y)\,(1- \bar{\rho }(t,y)) - D_T\, \partial _y \bar{f}_+(t,y)- L'(t)\,y\,\bar{f}_+(t,y)\big ) \\[5pt] &\qquad = \frac{1}{L(t)} \,\bar{J}_+(t,y), \end{align*}
and a similar relation can be deduced for $J_-$
and
$J_-$
and $\bar{J}_-$
. The boundary conditions (2.3) in the reference configuration then read
$\bar{J}_-$
. The boundary conditions (2.3) in the reference configuration then read
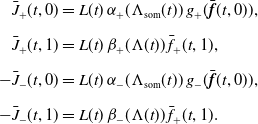 \begin{equation} \begin{aligned} \bar{J}_+(t,0) &= L(t)\,\alpha _+(\Lambda _{\text{som}}(t))\,g_+(\bar{\boldsymbol{f}}(t,0)), \\[5pt] \bar{J}_+(t,1) &= L(t)\,\beta _+(\Lambda (t))\,\bar{f}_+(t, 1), \\[5pt] -\bar{J}_-(t,0) &= L(t)\,\alpha _-(\Lambda _{\text{som}}(t))\,g_-(\bar{\boldsymbol{f}}(t,0)), \\[5pt] -\bar{J}_-(t,1) &= L(t)\,\beta _-(\Lambda (t))\,\bar{f}_+(t, 1). \end{aligned} \end{equation}
The ODE (2.4) remains unchanged, while for (2.5) quantities are evaluated at $y=1$
instead of
$y=1$
instead of $x=L_j(t)$
, which results in
$x=L_j(t)$
, which results in
 \begin{equation} \begin{aligned} \Lambda '_{\text{som}}(t) &= \sum _{j=1,2} \bigl ( \beta _{-,j}(\Lambda _{\text{som}}(t))\,\bar{f}_{-,j}(t,0) - \alpha _{+,j}(\Lambda _{\text{som}}(t))\,g_{+,j}(\bar{\boldsymbol{f}}_{j}(t,0)) \bigr ) + \gamma _{\text{prod}}(t), \\[5pt] \Lambda '_{1}(t) &= \beta _{+,1}(\Lambda _1(t))\,\bar{f}_{+,1}(t, 1)- \alpha _{-,1}(\Lambda _1(t))\, g_{-,1}(\bar{\boldsymbol{f}}_{1}(t, 1)) -\chi \, h_1(\Lambda _1(t), L_1(t)), \\[5pt] \Lambda '_{2}(t) &= \beta _{+,2}(\Lambda _2(t))\,\bar{f}_{+,2}(t, 1)- \alpha _{-,2}(\Lambda _2(t))\,g_{-,2}(\bar{\boldsymbol{f}}_{2}(t, 1)) -\chi \, h_2(\Lambda _2(t), L_2(t)), \end{aligned} \end{equation}
for $t\in (0,T)$
.
$t\in (0,T)$
.
3.3. Notion of weak solution and existence result
We now define the notion of weak solution to our problem. Whenever not differently specified, we assume $i \in \{+,-\}$
as well as
$i \in \{+,-\}$
as well as $j \in \{1,2\}$
,
$j \in \{1,2\}$
, $k \in \{1,2, \text{som}\}$
, while
$k \in \{1,2, \text{som}\}$
, while $C\gt 0$
denotes a constant that may change from line to line but always depends only on the data. From now on, we always write
$C\gt 0$
denotes a constant that may change from line to line but always depends only on the data. From now on, we always write $f_{i,j}$
instead of
$f_{i,j}$
instead of $\bar{f}_{i,j}$
as we always work with the equations on the reference interval.
$\bar{f}_{i,j}$
as we always work with the equations on the reference interval.
Definition 3.1. We say that $(\boldsymbol{f}_1, \boldsymbol{f}_2, \Lambda _{\textit{som}}, \Lambda _1, \Lambda _2, L_1, L_2)$
is a weak solution to (3.3)–(3.5), (2.4) if
$(\boldsymbol{f}_1, \boldsymbol{f}_2, \Lambda _{\textit{som}}, \Lambda _1, \Lambda _2, L_1, L_2)$
is a weak solution to (3.3)–(3.5), (2.4) if
-
(a)
$0\le f_{i,j} \le 1$
as well as
$\rho _j\;:\!=\; f_{+,j}+ f_{-,j} \le 1$
a.e. in
$(0,T)\times (0,1)$
; -
(b)
$ f_{i,j} \in L^2(0,T; H^1(0, 1))$
with
$\partial _t f_{i,j} \in L^2(0,T; H^1(0, 1)')$
; -
(c)
$\boldsymbol{f}_j$
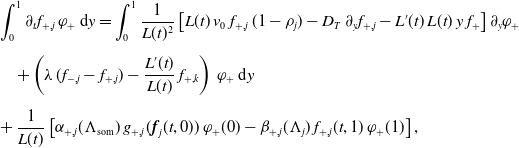
solves (3.3)–(3.4) in the following weak sense(3.6)for every
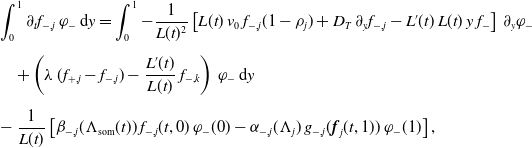
\begin{equation} \begin{aligned} \int _0^1 \partial _t f_+\, \varphi _+\,\mathrm dy &= \int _0^1 \frac{1}{L^2(t)} \Big [L(t)\,v_0\,f_+\,(1- \rho ) - D_T\,\partial _y f_+ - L'(t)\,L(t)\,y\,f_+\Big ]\,\partial _y \varphi _+ \\[5pt] &\quad + \Big (\lambda (f_- - f_+) -\frac{L'(t)}{L(t)}\,f_+\Big ) \,\varphi _+ \,\mathrm dy \\[5pt] & \quad + \frac{1}{L(t)}\,\alpha _+(\Lambda _{\textrm{som}}(t))\,g_+(\boldsymbol{f}(t,0))- \frac{1}{L(t)} \,\beta _+(\Lambda (t))\, f_+(t, 1) \,\varphi _+(1), \\[5pt] \int _0^1 \partial _t f_-\,\varphi _-\, \mathrm dy &= \int _0^1 \frac{1}{L^2(t)} \Big [-L(t)\,v_0\,f_-\,(1- \rho )- D_T\, \partial _y f_- - L'(t)\,L(t)\,y\, f_-\Big ]\,\partial _y \varphi _- \\[5pt] &\quad + \Big (\lambda (f_+ - f_-)-\frac{L'(t)}{L(t)} f_-\Big )\, \varphi _- \,\mathrm dy \\[5pt] & \quad -\frac 1{L(t)}\,\beta _-(\Lambda _{\textrm{som}}(t))\,f_-(t,0)\,\varphi _-(0) + \frac{1}{L(t)} \,\alpha _-(\Lambda (t))\,g_-(\boldsymbol{f}(t,1))\,\varphi _-(1), \end{aligned} \end{equation}
$\varphi _+, \varphi _- \in H^1(0, 1)$
and almost all
$t\in (0,T)$
.
-
(d)
$L_j(0)= L_j^0$
,
$\Lambda _k(0)= \Lambda _k^0$
, and
$\boldsymbol{f}_j(0, y)= \boldsymbol{f}^0_j(y)$
for almost all
$y\in (0,1)$
, for suitable
$L_j^0, \Lambda _k^0$
and
$f_{i,j}^0$
; -
(e)
$\Lambda _k \in{C^1([0, T])}$
solves (3.5); -
(f)
$L_j \in{C^1([0, T])}$
solves (2.4).


We next state the assumptions on the data and non-linearities which read as follows:
-
(H0)
$\Lambda _k^0\gt 0$
and
$L_j^0 \ge L_{\text{min}, j}$
, where
$L_{\text{min}, j}\gt 0$
is given. -
(H1) For
$f_{+,j}^0, f_{-,j}^0 \in L^2(0,1)$
it holds
$ f_{+,j}^0, f_{-,j}^0 \ge 0$
and
$0 \le \rho _j^0 \le 1$
a.e. in
$(0,1)$
, where
$\rho _j^0\;:\!=\; f_{+,j}^0+ f_{-,j}^0$
. -
(H2) The non-linearities
$g_{i,j}\colon{\mathbb{R}}^2 \to{\mathbb{R}}_+$
, are Lipschitz continuous and such that
$g_{i,j}(s,t)= 0$
whenever
$s+t = 1$
as well as
$g_{-,j}(s,0) = g_{+,j}(0,s) = 0$
for all
$0 \le s \le 1$
. -
(H3) The functions
$h_j\colon{\mathbb{R}}_+ \times [ L_{\text{min}, j},+\infty ) \to{\mathbb{R}}$
are such that-
(i) there exist non-negative functions
$K_{h_j} \in L^\infty ((0,\infty ))$
such thatfor all
\begin{equation*} |h_j(t,a) - h_j(t,b)| \le K_{h_j}(t)|a-b|, \end{equation*}
$a,\,b \in [ L_{\text{min}, j},+\infty )$
;
-
(ii)
$h_j(s, L_{\text{min}, j})\ge 0$
for every
$s\ge 0$
.
-
-
(H4) The functions
$\alpha _{i,j}\colon{\mathbb{R}}_+ \to{\mathbb{R}}_+$
are increasing and Lipschitz continuous. Moreover,
$\alpha _{-,j}(t) \ge 0$
for all
$t\gt 0$
and
$\alpha _{-,j}(0)= 0$
. -
(H5) The functions
$\beta _{i,j}\colon{\mathbb{R}}_+ \to{\mathbb{R}}_+$
are nonnegative and Lipschitz continuous. Moreover, there exists
$\Lambda _{j, \text{max}}\gt 0$
such that
$\beta _{+,j}(\Lambda _{j, \text{max}})= 0$
. -
(H6) The parameters satisfy
$ v_0, D_T, \chi \gt 0$
and
$ \lambda \ge 0$
. -
(H7) The function
$\gamma _{\text{prod}} \colon{\mathbb{R}}_+ \to{\mathbb{R}}_+$
is such that
$\lim _{t\to \infty } \gamma _{\text{prod}}(t) =0$
.


Remark 3.2 (Interpretation of the assumptions). Let us briefly discuss the meaning of the assumptions in terms of our application. Assumption (H $_0$
) states that we start with a predefined number of neurites with length above a fixed minimal length and that all pools as well as the soma are non-empty. (H
$_0$
) states that we start with a predefined number of neurites with length above a fixed minimal length and that all pools as well as the soma are non-empty. (H $_1$
) is necessary as
$_1$
) is necessary as $f_{+,j}^0, f_{-,j}^0$
model densities and must therefore be non-negative and as we assume that there is a maximal density (due to the limited space in the neurites) normalised to
$f_{+,j}^0, f_{-,j}^0$
model densities and must therefore be non-negative and as we assume that there is a maximal density (due to the limited space in the neurites) normalised to $1$
. In (H
$1$
. In (H $_2$
), the regularity is needed for the analysis and only a mild restriction. The remaining requirements are necessary to ensure that all densities remain between
$_2$
), the regularity is needed for the analysis and only a mild restriction. The remaining requirements are necessary to ensure that all densities remain between $0$
and
$0$
and $1$
. (H
$1$
. (H $_3$
) ensures that there is a lower bound for the length of the neurites meaning that neurites cannot vanish as it is observed in practice. (H
$_3$
) ensures that there is a lower bound for the length of the neurites meaning that neurites cannot vanish as it is observed in practice. (H $_4$
) ensures that vesicles can only enter neurites if there are some available in growth cone or soma, respectively, while (H
$_4$
) ensures that vesicles can only enter neurites if there are some available in growth cone or soma, respectively, while (H $_5$
) allows the pools to decrease the rate of entering vesicles when they become too crowded. Finally, (H
$_5$
) allows the pools to decrease the rate of entering vesicles when they become too crowded. Finally, (H $_6$
) states that diffusion, transport and reaction effects are all present at all times (yet with possible different strengths) and (H
$_6$
) states that diffusion, transport and reaction effects are all present at all times (yet with possible different strengths) and (H $_7$
) finally postulates the production of vesicles within the soma. We point out that assumption (H
$_7$
) finally postulates the production of vesicles within the soma. We point out that assumption (H $_7$
) is only needed to guarantee existence of stationary solutions.
$_7$
) is only needed to guarantee existence of stationary solutions.
Then we can state our existence result.


3.4. Proof of Theorem 3.3
The proof of Theorem3.3 is based on a fixed point argument applied to an operator obtained by concatenating linearised versions of (3.6), (2.4) and (3.5). Let us briefly sketch our strategy before we provide the corresponding rigorous results. We work in the Banach space
 \begin{equation*} X= \prod _{j=1,2} L^2(0,T; H^1(0, 1))^2 \end{equation*}
endowed with the norm
 \begin{equation*} \|(\boldsymbol{f}_1, \boldsymbol{f}_2 )\|^2_X= \sum _{j=1,2} \sum _{i=+,-} \|f_{i,j}\|^2_{L^2(0,T; H^1(0, 1))}. \end{equation*}
Given $(\widehat{\boldsymbol{f}}_1, \widehat{\boldsymbol{f}}_2 ) \in X$
, let
$(\widehat{\boldsymbol{f}}_1, \widehat{\boldsymbol{f}}_2 ) \in X$
, let $\boldsymbol{\Lambda }\;:\!=\;(\Lambda _{\text{som}}, \Lambda _1, \Lambda _2) \in C^1([0,T])^3$
be the unique solution to the ODE system
$\boldsymbol{\Lambda }\;:\!=\;(\Lambda _{\text{som}}, \Lambda _1, \Lambda _2) \in C^1([0,T])^3$
be the unique solution to the ODE system
 \begin{equation} \begin{aligned} \Lambda _{\text{som}}'(t) &= \sum _{j=1,2} \bigl ( \beta _{-,j}(\Lambda _{\text{som}}(t)) \widehat{f}_{-,j}(t,0) - \alpha _{+,j}(\Lambda _{\text{som}}(t))\, g_{+,j}(\widehat{\boldsymbol{f}}_{j}(t,0)) \bigr ) + \gamma _{\text{prod}}(t), \\[5pt] \Lambda _{1}'(t) &= \beta _{+,1}(\Lambda _1(t))\,\widehat{f}_{+,1}(t, 1)- \alpha _{-,1}(\Lambda _1(t))\,g_{-,1}(\widehat{\boldsymbol{f}}_{1}(t, 1)) - \chi \, h_1(\Lambda _1(t), L_1(t)), \\[5pt] \Lambda _{2}'(t) &= \beta _{+,2}(\Lambda _2(t))\,\widehat{f}_{+,2}(t, 1)- \alpha _{-,2}(\Lambda _2(t))\,g_{-,2}(\widehat{\boldsymbol{f}}_{2}(t, 1)) - \chi \,h_2(\Lambda _2(t), L_2(t)). \end{aligned} \end{equation}
We denote the mapping $(\widehat{\boldsymbol{f}}_1, \widehat{\boldsymbol{f}}_2) \mapsto \boldsymbol{\Lambda }$
by
$(\widehat{\boldsymbol{f}}_1, \widehat{\boldsymbol{f}}_2) \mapsto \boldsymbol{\Lambda }$
by $\mathcal{B}_1$
. This
$\mathcal{B}_1$
. This $\boldsymbol{\Lambda }$
is now substituted into (2.4), that is, we are looking for the unique solution
$\boldsymbol{\Lambda }$
is now substituted into (2.4), that is, we are looking for the unique solution $\boldsymbol{L}=(L_1, L_2) \in C^1([0,T])^2$
to the ODE problems
$\boldsymbol{L}=(L_1, L_2) \in C^1([0,T])^2$
to the ODE problems
 \begin{equation} L_j'(t)= h_j(\Lambda _j(t), L_j(t)), \end{equation}
and the corresponding solution operator is denoted by $\mathcal{B}_2$
. Finally, these solutions
$\mathcal{B}_2$
. Finally, these solutions $\boldsymbol{\Lambda }$
and
$\boldsymbol{\Lambda }$
and $\boldsymbol{L}$
are substituted into (3.6), and we look for the unique solution
$\boldsymbol{L}$
are substituted into (3.6), and we look for the unique solution $\boldsymbol{f}_j \in L^2(0, T; H^1(0, 1))^2$
, with
$\boldsymbol{f}_j \in L^2(0, T; H^1(0, 1))^2$
, with $\partial _t \boldsymbol{f}_j \in L^2(0, T; H^1(0, 1)^{\prime })^2$
, to the (still non-linear) PDE problem
$\partial _t \boldsymbol{f}_j \in L^2(0, T; H^1(0, 1)^{\prime })^2$
, to the (still non-linear) PDE problem
 \begin{align} & \int _0^{1} \partial _t f_{+,j} \,\varphi _+ \,\textrm{d}y = \int _0^{1} \frac{1}{L(t)^2}\left [L(t)\,v_0\,f_{+,j}\,(1- \rho _j)- D_T\,\partial _y f_{+,j} - L'(t)\,L(t)\,y\,f_+ \right ] \partial _y \varphi _+ \\[5pt] &\quad +\left (\lambda \, (f_{-,j}- f_{+,j}) - \frac{L'(t)}{L(t)}\,f_{+,k}\right )\, \varphi _+ \,\textrm{d}y \nonumber \\[5pt] & + \frac{1}{L(t)}\left [\alpha _{+,j}(\Lambda _{\text{som}})\,g_{+,j}(\boldsymbol{f}_{j}(t, 0))\,\varphi _+(0) - \beta _{+,j}(\Lambda _j)\,f_{+,j}(t, 1)\,\varphi _+(1)\right ], \nonumber \end{align}
 \begin{align} & \int _0^{ 1} \partial _t f_{-,j}\,\varphi _- \,\textrm{d}y = \int _0^{ 1} - \frac{1}{L(t)^2}\left [L(t)\,v_0\,f_{-,j}(1- \rho _j)+ D_T\,\partial _y f_{-,j} - L'(t)\,L(t)\,y\,f_-\right ]\, \partial _y \varphi _-\\[5pt] &\quad +\left (\lambda \, (f_{+,j}- f_{-,j}) - \frac{L'(t)}{L(t)}\,f_{-,k}\right )\, \varphi _- \,\textrm{d}y \nonumber \\[5pt] &-\frac{1}{L(t)}\left [\beta _{-,j}(\Lambda _{\text{som}}(t)) \,f_{-,j}(t, 0)\,\varphi _-(0) - \alpha _{-,j}(\Lambda _j)\,g_{-,j}(\boldsymbol{f}_{j}(t, 1))\,\varphi _-(1)\right ],\nonumber \end{align}
for every $\varphi _+, \varphi _- \in H^1(0, 1)$
. We call the resulting solution operator
$\varphi _+, \varphi _- \in H^1(0, 1)$
. We call the resulting solution operator $(\boldsymbol{\Lambda }, \boldsymbol{L}) \mapsto (\boldsymbol{f}_1, \boldsymbol{f}_2 )$ $\mathcal{B}_3$
. Then, given an appropriate subset
$\mathcal{B}_3$
. Then, given an appropriate subset $\mathcal{K} \subset X$
, we define the (fixed point) operator
$\mathcal{K} \subset X$
, we define the (fixed point) operator $\mathcal{B} \colon \mathcal{K} \to X$
as
$\mathcal{B} \colon \mathcal{K} \to X$
as
 \begin{equation*} \mathcal {B}(\widehat {\boldsymbol{f}}_1, \widehat {\boldsymbol{f}}_2 )= \mathcal {B}_3 \bigl (\mathcal {B}_1(\widehat {\boldsymbol{f}}_1, \widehat {\boldsymbol{f}}_2), \mathcal {B}_2(\mathcal {B}_1(\widehat {\boldsymbol{f}}_1, \widehat {\boldsymbol{f}}_2 )\bigr )= (\boldsymbol{f}_1, \boldsymbol{f}_2 ). \end{equation*}
We show that $\mathcal{B}$
is self-mapping and contractive, so that existence is a consequence of the Banach’s fixed point theorem.
$\mathcal{B}$
is self-mapping and contractive, so that existence is a consequence of the Banach’s fixed point theorem.
Let us begin with system (3.7).
Lemma 3.4. Let $(\widehat{\boldsymbol{f}}_1, \widehat{\boldsymbol{f}}_2) \in X$
, then, there exists a unique
$(\widehat{\boldsymbol{f}}_1, \widehat{\boldsymbol{f}}_2) \in X$
, then, there exists a unique $\boldsymbol{\Lambda }= (\Lambda _{\textit{som}}, \Lambda _1, \Lambda _2) \in C^1([0, T])^3$
that solves (3.7) with initial conditions
$\boldsymbol{\Lambda }= (\Lambda _{\textit{som}}, \Lambda _1, \Lambda _2) \in C^1([0, T])^3$
that solves (3.7) with initial conditions
 \begin{equation} \Lambda _k(0)= \Lambda _k^{0}, \quad k= \textit{som}, 1, 2. \end{equation}
Proof. This result is an application of the Cauchy-Lipschitz theorem, since the right-hand sides of (3.7) are Lipschitz continuous with respect to $\Lambda _k$
thanks to hypotheses (H
$\Lambda _k$
thanks to hypotheses (H $_4$
) and (H
$_4$
) and (H $_5$
).
$_5$
).
Lemma 3.5. Let $\mathcal{B}_1\colon X \to C([0, T])^3$
be the operator that maps
$\mathcal{B}_1\colon X \to C([0, T])^3$
be the operator that maps $(\widehat{\boldsymbol{f}}_1, \widehat{\boldsymbol{f}}_2) \in X$
to the solution
$(\widehat{\boldsymbol{f}}_1, \widehat{\boldsymbol{f}}_2) \in X$
to the solution $\boldsymbol{\Lambda }$
to (3.7). Then,
$\boldsymbol{\Lambda }$
to (3.7). Then, $\mathcal{B}_1$
is Lipschitz continuous.
$\mathcal{B}_1$
is Lipschitz continuous.
Proof. From Lemma3.4, $\mathcal{B}_1$
is well defined. Let now
$\mathcal{B}_1$
is well defined. Let now $(\widehat{\boldsymbol{f}}_1^{(1)},\widehat{\boldsymbol{f}}_2^{(1)}),$ $(\widehat{\boldsymbol{f}}_1^{(2)}, \widehat{\boldsymbol{f}}_2^{(2)} ) \in X$
and let
$(\widehat{\boldsymbol{f}}_1^{(2)}, \widehat{\boldsymbol{f}}_2^{(2)} ) \in X$
and let $\boldsymbol{\Lambda }^{(1)}=: \mathcal{B}_1(\widehat{\boldsymbol{f}}_1^{(1)}, \widehat{\boldsymbol{f}}_2^{(1)})$
and
$\boldsymbol{\Lambda }^{(1)}=: \mathcal{B}_1(\widehat{\boldsymbol{f}}_1^{(1)}, \widehat{\boldsymbol{f}}_2^{(1)})$
and $\boldsymbol{\Lambda }^{(2)}=: \mathcal{B}_1(\widehat{\boldsymbol{f}}_1^{(2)}, \widehat{\boldsymbol{f}}_2^{(2)})$
be solutions to (3.7) satisfying the same initial condition (3.11). We fix
$\boldsymbol{\Lambda }^{(2)}=: \mathcal{B}_1(\widehat{\boldsymbol{f}}_1^{(2)}, \widehat{\boldsymbol{f}}_2^{(2)})$
be solutions to (3.7) satisfying the same initial condition (3.11). We fix $t \in [0, T]$
and consider
$t \in [0, T]$
and consider
 \begin{equation*} \begin{split} (\Lambda _{j}^{(a)})'(t)&= \beta _{+,j}(\Lambda _j^{(a)}(t)) \,\widehat{f}_{+,j}^{(a)}(t, 1)- \alpha _{-,j}(\Lambda _j^{(a)}(t)) \,g_{-,j}(\widehat{\boldsymbol{f}}_{j}^{(a)}(t, 1)) \\[5pt] & \qquad - \chi \, h_j(\Lambda _j^{(a)}(t), 1), \end{split} \end{equation*} $a=1,2$
. Taking the difference of the two equations, setting
$a=1,2$
. Taking the difference of the two equations, setting $\delta \Lambda _j\;:\!=\; \Lambda _j^{(1)}- \Lambda _j^{(2)}$
, exploiting hypotheses (H
$\delta \Lambda _j\;:\!=\; \Lambda _j^{(1)}- \Lambda _j^{(2)}$
, exploiting hypotheses (H $_2$
)–(H
$_2$
)–(H $_5$
) and summarising the constants give
$_5$
) and summarising the constants give
 \begin{equation*} \begin{split} & |(\delta \Lambda _j)'(t)| \le C |\delta \Lambda _j(t)| + C \left (|(\widehat{f}_{+,j}^{(1)}- \widehat{f}_{+,j}^{(2)})(t, 1)|+ |(\widehat{f}_{-,j}^{(1)}- \widehat{f}_{-,j}^{(2)})(t, 1)| \right ), \end{split} \end{equation*}
while the trace inequality (3.1) and a Gronwall argument imply
 \begin{align*} |\Lambda _j^{(1)}(t)- \Lambda _j^{(2)}(t)| & \le C\, \|\widehat{\boldsymbol{f}}_j^{(1)}- \widehat{\boldsymbol{f}}_j^{(2)} \|_{L^2(0, T; H^1(0, 1))^2} . \end{align*}
A similar argument holds for the equation for $\Lambda _{\text{som}}$
, and we eventually have
$\Lambda _{\text{som}}$
, and we eventually have
 \begin{equation} \|\boldsymbol{\Lambda }^{(1)}- \boldsymbol{\Lambda }^{(2)}\|_{C([0, T])^3} \le C \,\|(\widehat{\boldsymbol{f}}_1^{(1)}, \widehat{\boldsymbol{f}}_2^{(1)})- (\widehat{\boldsymbol{f}}_1^{(2)}, \widehat{\boldsymbol{f}}_2^{(2)})\|_X. \end{equation}
We next show the following existence result for equation (3.8).
Lemma 3.6. Let $\boldsymbol{\Lambda } \in C^1([0, T])^3$
be the unique solution to (3.7). Then, there exists a unique
$\boldsymbol{\Lambda } \in C^1([0, T])^3$
be the unique solution to (3.7). Then, there exists a unique $\boldsymbol{L}= (L_1, L_2) \in C^1([0, T])^2$
that solves (3.8) with initial condition
$\boldsymbol{L}= (L_1, L_2) \in C^1([0, T])^2$
that solves (3.8) with initial condition $ L_j(0)= L_j^{(0)}$
. Furthermore,
$ L_j(0)= L_j^{(0)}$
. Furthermore, $\text{for all } t \in (0, T)$
it holds
$\text{for all } t \in (0, T)$
it holds
 \begin{align} & L_{\textit{min}, j} \le L_j(t) \le L_j^{(0)}+ T \,\|h_j\|_{L^{\infty }({\mathbb{R}}^2)}, \end{align}
 \begin{align} & \frac{|L_j'(t)|}{L_j(t)} \le \frac{\|h_j\|_{L^{\infty }({\mathbb{R}}^2)}}{L_{\textit{min}, j}}. \end{align}
Proof. The existence and uniqueness follow as before. The lower bound in (3.13) can be deduced by applying TheoremA.1 ( [Reference Deimling10, Theorem 5.1]) in the appendix with $X={\mathbb{R}}$
,
$X={\mathbb{R}}$
, $\Omega = [L_{\text{min}, j},\infty )$
and
$\Omega = [L_{\text{min}, j},\infty )$
and $f=h_j$
. Assumption (A1) in the theorem is satisfied as, due to (H
$f=h_j$
. Assumption (A1) in the theorem is satisfied as, due to (H $_3)$
, the choice
$_3)$
, the choice $\omega = K_{h_j}$
fulfils the requirements. For (A2), we note that the unit outward normal of the set
$\omega = K_{h_j}$
fulfils the requirements. For (A2), we note that the unit outward normal of the set $[L_{\text{min}, j},\infty )$
at
$[L_{\text{min}, j},\infty )$
at $L_{\text{min},j}$
is
$L_{\text{min},j}$
is $-1$
and that
$-1$
and that $h_j(s, L_{\text{min}, j})\ge 0$
for every
$h_j(s, L_{\text{min}, j})\ge 0$
for every $s\ge 0$
(again by (H
$s\ge 0$
(again by (H $_3$
)). This yields
$_3$
)). This yields $(h_j(s, L_{\text{min}, j}),-1) = -h_j(s, L_{\text{min}, j}) \le 0$
as needed. In order to prove the upper bound in (3.13), we fix
$(h_j(s, L_{\text{min}, j}),-1) = -h_j(s, L_{\text{min}, j}) \le 0$
as needed. In order to prove the upper bound in (3.13), we fix $t \in (0,T)$
, integrate (3.8) and use (H
$t \in (0,T)$
, integrate (3.8) and use (H $_3$
)-(i) to have
$_3$
)-(i) to have
 \begin{equation*} L_j(t)= L_j^{(0)}+ \int _0^t h_j(\Lambda _j(s), L_j(s)) \,{\,\textrm {d}s} \le L_j^{(0)}+ T\, \|h_j\|_{L^{\infty }({\mathbb {R}}^2)}. \end{equation*}
In addition, we observe that (3.8) gives $|L_j'(t)| \le \|h_j\|_{L^{\infty }({\mathbb{R}}^2)}$
. Then, the fact that
$|L_j'(t)| \le \|h_j\|_{L^{\infty }({\mathbb{R}}^2)}$
. Then, the fact that $L_j(t) \ge L_{\text{min}, j}$
allows us to conclude (3.14).
$L_j(t) \ge L_{\text{min}, j}$
allows us to conclude (3.14).
Lemma 3.7. The operator $\mathcal{B}_2 \colon C([0, T])^3 \to C([0, T])^2$
that maps
$\mathcal{B}_2 \colon C([0, T])^3 \to C([0, T])^2$
that maps $\boldsymbol{\Lambda }$
to the solution
$\boldsymbol{\Lambda }$
to the solution $\boldsymbol{L}$
to (3.8) is Lipschitz continuous in the sense of
$\boldsymbol{L}$
to (3.8) is Lipschitz continuous in the sense of
 \begin{equation} \|\boldsymbol{L}^{(1)}- \boldsymbol{L}^{(2)}\|_{C([0, T])^2} \le T\, \max _{j= 1,2}\bigl \{L_{h_j}\, e^{2\,T\,L_{h_j}} \bigr \} \|\boldsymbol{\Lambda }^{(1)}- \boldsymbol{\Lambda }^{(2)}\|_{C([0, T])^3}, \end{equation}
where $L_{h_j}$
is the Lipschitz constant of
$L_{h_j}$
is the Lipschitz constant of $h_j$
. If
$h_j$
. If $T \,\max _{j= 1,2}\bigl \{L_{h_j}\, e^{2\,T\,L_{h_j}} \bigr \}\lt 1$
, then
$T \,\max _{j= 1,2}\bigl \{L_{h_j}\, e^{2\,T\,L_{h_j}} \bigr \}\lt 1$
, then $\mathcal{B}_2$
is contractive.
$\mathcal{B}_2$
is contractive.
Proof. The proof works as for Lemma3.5 so we omit it.
We next investigate the existence of solutions to system (3.9)–(3.10).
Theorem 3.8. Let $\boldsymbol{\Lambda }$
and
$\boldsymbol{\Lambda }$
and $ \boldsymbol{L}$
be the unique solution to (3.7) and (3.8), respectively. Then, there exists a unique solution
$ \boldsymbol{L}$
be the unique solution to (3.7) and (3.8), respectively. Then, there exists a unique solution $(\boldsymbol{f}_1, \boldsymbol{f}_2) \in X$
to (3.9)–(3.10) such that
$(\boldsymbol{f}_1, \boldsymbol{f}_2) \in X$
to (3.9)–(3.10) such that $f_{i,j}(t,y)\in [0,1]$
for a.e.
$f_{i,j}(t,y)\in [0,1]$
for a.e. $y \in (0, 1)$
and
$y \in (0, 1)$
and $t \in [0, T]$
.
$t \in [0, T]$
.
Proof. To simplify the notation, in this proof we will drop the use of the $j$
-index and, for the reader’s convenience, we split the proof in several steps.
$j$
-index and, for the reader’s convenience, we split the proof in several steps.
Step 1: Approximation by truncation. Given a generic function $a$
we introduce the truncation
$a$
we introduce the truncation
 \begin{equation} a_{\text{tr}}= \begin{cases} a & \text{if } 0 \le a \le 1, \\[5pt] 0 & \text{otherwise}. \end{cases} \end{equation}
We apply this to the non-linear transport terms $f_{\pm }\,(1-\rho )$
in (3.6) which yields (after summing up)
$f_{\pm }\,(1-\rho )$
in (3.6) which yields (after summing up)
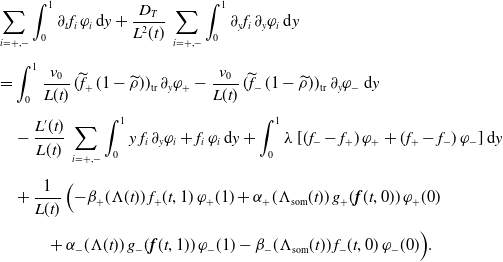
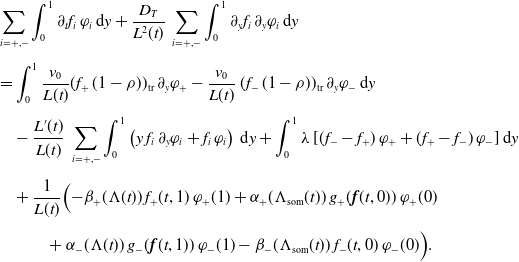 \begin{equation} \begin{split} &\sum _{i= +,-}\int _0^1 \partial _t f_i \,\varphi _i \,\textrm{d}y+ \frac{D_T}{L^2(t)} \,\sum _{i= +,-} \int _0^ 1 \partial _y f_i \, \partial _y \varphi _i \,\textrm{d}y \\[5pt] &= \int _0^1 \frac{v_0}{L(t)} (f_+ \,(1-\rho ))_{\text{tr}} \, \partial _y \varphi _+ - \frac{v_0}{L(t)}\, (f_-\,(1-\rho ))_{\text{tr}} \, \partial _y \varphi _- \,\textrm{d}y \\[5pt] & \quad - \frac{L'(t)}{L(t)}\, \sum _{i= +,-} \int _0^1 \left (y \,f_i \,\partial _y \varphi _i + f_i\, \varphi _i \right )\,\textrm{d}y+ \int _0^1 \lambda \,[(f_- - f_+)\, \varphi _+ + (f_+- f_-)\,\varphi _-] \,\textrm{d}y \\[5pt] & \quad +\frac{1}{L(t)} \Big (\!-\! \beta _{+}(\Lambda (t)) \, f_{+}(t, 1)\,\varphi _+(1) + \alpha _{+}(\Lambda _{\text{som}}(t))\, g_{+}(\boldsymbol{f}(t, 0))\,\varphi _+(0) \\[5pt] & \quad \qquad +\alpha _{-}(\Lambda (t))\, g_{-}(\boldsymbol{f}(t, 1))\,\varphi _-(1) - \beta _{-}(\Lambda _{\text{som}}(t)) \, f_{-}(t, 0)\,\varphi _-(0)\Big ). \end{split} \end{equation}
We solve (3.17) by means of the Banach fixed point theorem. We follow [Reference Egger, Pietschmann and Schlottbom12], pointing out that a similar approach has been used also in [Reference Marino, Pietschmann and Pichler22], yet in a different context.
Let us set $Y\;:\!=\; (L^{\infty }((0,T); L^2(0,1)))^2$
and introduce the following nonempty, closed set
$Y\;:\!=\; (L^{\infty }((0,T); L^2(0,1)))^2$
and introduce the following nonempty, closed set
 \begin{equation*} \mathcal {M}= \left \{{\boldsymbol{f}}= (f_+, f_-) \in Y: \, \|{\boldsymbol{f}}\|_{Y} \le C_{\mathcal {M}}\right \}, \end{equation*}
with $T, C_{\mathcal{M}}\gt 0$
to be specified. Then we define the mapping
$T, C_{\mathcal{M}}\gt 0$
to be specified. Then we define the mapping $\Phi \colon \mathcal{M} \to Y$
such that
$\Phi \colon \mathcal{M} \to Y$
such that $\Phi (\widetilde{\boldsymbol{f}})={\boldsymbol{f}}$
where, for fixed
$\Phi (\widetilde{\boldsymbol{f}})={\boldsymbol{f}}$
where, for fixed $\widetilde{\boldsymbol{f} }\in \mathcal{M}$
,
$\widetilde{\boldsymbol{f} }\in \mathcal{M}$
, $\boldsymbol{f}$
solves the following linearised equation (cf. [Reference Lieberman21, Chapter III])
$\boldsymbol{f}$
solves the following linearised equation (cf. [Reference Lieberman21, Chapter III])
 \begin{equation} \begin{split} &\sum _{i= +,-}\int _0^1 \partial _t f_i \,\varphi _i \,\textrm{d}y+ \frac{D_T}{L^2(t)} \,\sum _{i= +,-} \int _0^ 1 \partial _y f_i \, \partial _y \varphi _i \,\textrm{d}y \\[5pt] &= \int _0^1 \frac{v_0}{L(t)} \,(\widetilde{f}_+\, (1-\widetilde{\rho }))_{\text{tr}} \, \partial _y \varphi _+ - \frac{v_0}{L(t)} \,(\widetilde{f}_-\,(1-\widetilde{\rho }))_{\text{tr}} \, \partial _y \varphi _- \,\textrm{d}y \\[5pt] & \quad - \frac{L'(t)}{L(t)} \, \sum _{i= +,-} \int _0^1 y\, f_i \,\partial _y \varphi _i + f_i \,\varphi _i \,\textrm{d}y+ \int _0^1 \lambda \, [(f_- - f_+)\, \varphi _+ +(f_+- f_-)\,\varphi _-] \,\textrm{d}y \\[5pt] & \quad +\frac{1}{L(t)}\, \Big (\!-\!\beta _{+}(\Lambda (t)) \, f_{+}(t, 1)\,\varphi _+(1) + \alpha _{+}(\Lambda _{\text{som}}(t))\, g_{+}(\boldsymbol{f}(t, 0))\,\varphi _+(0) \\[5pt] & \quad \qquad +\alpha _{-}(\Lambda (t))\, g_{-}(\boldsymbol{f}(t, 1))\,\varphi _-(1) - \beta _{-}(\Lambda _{\text{som}}(t)) \, f_{-}(t, 0)\,\varphi _-(0)\Big ). \end{split} \end{equation} $\underline{\textrm{Step 2:}\; \Phi\; \textrm{is self-mapping.}}$
We show that
$\underline{\textrm{Step 2:}\; \Phi\; \textrm{is self-mapping.}}$
We show that
 \begin{equation} \|{\boldsymbol{f}}\|_Y \le C_{\mathcal{M}}. \end{equation}
We choose $\varphi _i= f_i$
in (3.18) and estimate the several terms appearing in the resulting equation separately. From (3.13), on the left-hand side we have
$\varphi _i= f_i$
in (3.18) and estimate the several terms appearing in the resulting equation separately. From (3.13), on the left-hand side we have
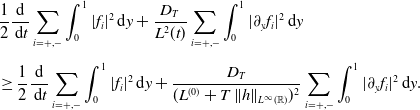 \begin{equation*} \begin{split} & \frac{1}{2} \frac{\textrm{d}}{\,\textrm{d}t} \sum _{i= +,-} \int _0^1 |f_i|^2 \,\textrm{d}y+ \frac{D_T}{L^2(t)} \sum _{i= +,-} \int _0^ 1 |\partial _y f_i|^2 \,\textrm{d}y \\[5pt] & \ge \frac{1}{2} \frac{\textrm{d}}{\,\textrm{d}t} \sum _{i= +,-} \int _0^1 |f_i|^2 \,\textrm{d}y+ \frac{D_T}{(L^{(0)}+ T\, \|h\|_{L^\infty ({\mathbb{R}})})^2} \sum _{i= +,-} \int _0^ 1 |\partial _y f_i|^2 \,\textrm{d}y. \end{split} \end{equation*}
On the right-hand side we first use equation (3.14) along with Young’s inequality for some $\varepsilon _1\gt 0$
and the fact that
$\varepsilon _1\gt 0$
and the fact that $y \in (0,1)$
to achieve
$y \in (0,1)$
to achieve
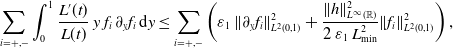 \begin{equation*} \sum _{i= +,-} \int _0^1 \frac {L'(t)}{L(t)} \,y\,f_i\,\partial _y f_i \,\textrm {d}y \le \sum _{i= +,-} \left (\varepsilon _1 \,\|\partial _y f_i\|_{L^2(0,1)}^2+ \frac {\|h\|_{L^\infty ({\mathbb {R}})}^2}{2\,\varepsilon _1 \,L_{\text {min}}^2} \|f_i\|_{L^2(0,1)}^2 \right ), \end{equation*}
while (3.14) once again gives
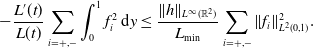 \begin{equation*} -\frac {L'(t)}{L(t)} \sum _{i=+,-} \int _0^1 f_i^2 \,\textrm {d}y \le \frac {\|h\|_{L^\infty ({\mathbb {R}}^2)}}{L_{\text {min}}} \sum _{i=+,-} \|f_i\|_{L^2(0,1)}^2. \end{equation*}
On the other hand, (3.13), Young’s inequality for some $\varepsilon _2\gt 0$
and (3.16) give
$\varepsilon _2\gt 0$
and (3.16) give
 \begin{equation*} \pm \int _0^1 \frac {v_0}{L(t)} \bigl (\widetilde {f}_i \,(1- \widetilde {\rho })\bigr )_{\text {tr}}\, \partial _y f_i \,\textrm {d}y \le C + \varepsilon _2 \|\partial _y f_i\|_{L^2(0,1)}^2. \end{equation*}
We further observe that
 \begin{equation*} \lambda \int _0^1 (f_- - f_+)\, f_+ + (f_+ - f_-)\,f_- \,\textrm {d}y= -\lambda \int _0^1 (f_+ + f_-)^2 \,\textrm {d}y \le 0. \end{equation*}
Finally we estimate the boundary terms. We use hypotheses (H $_2$
), (H
$_2$
), (H $_4$
), (H
$_4$
), (H $_5$
) and equation (3.13) together with Young’s inequality with some
$_5$
) and equation (3.13) together with Young’s inequality with some $\varepsilon _3, \dots, \varepsilon _6\gt 0$
and the trace inequality (3.1) to achieve
$\varepsilon _3, \dots, \varepsilon _6\gt 0$
and the trace inequality (3.1) to achieve
 \begin{equation*} \begin{split} \frac{1}{L(t)}\, \beta _+(\Lambda (t)) \,f_+^2(t, 1) & \le C \,\|f_+\|_{L^2(0,1)}^2+ \varepsilon _3 \, \|\partial _y f_+\|_{L^2(0,1)}^2, \\[5pt] \frac{1}{L(t)} \,\alpha _{+}(\Lambda _{\text{som}}(t))\,g_{+}(\widetilde{\boldsymbol{f}}_{+}(t, 0))\,f_+(t, 0) & \le C\,\|f_+\|_{L^2(0,1)}^2+ \varepsilon _4 \, \|\partial f_+\|^2_{L^2(0,1)}, \\[5pt] \frac{1}{L(t)} \,\alpha _{-}(\Lambda (t))\,g_{-}( \widetilde{\boldsymbol{f}}_{+}(t, 1))\,f_-(t,1) & \le C \, \|f_-\|_{L^2(0,1)}^2 + \varepsilon _5\,\|\partial _y f_-\|^2_{L^2(0,1)}, \\[5pt] \frac{1}{L(t)} \, \beta _{-}(\Lambda _{\text{som}}(t)) \,f_{-}^2(t, 0) & \le C \, \|f_-\|_{L^2(0,1)}^2 + \varepsilon _6\, \|\partial _y f_-\|_{L^2(0,1)}^2. \end{split} \end{equation*}
We choose $\varepsilon _{\kappa }$
,
$\varepsilon _{\kappa }$
, $\kappa =1, \dots, 6$
, in such a way that all the terms of the form
$\kappa =1, \dots, 6$
, in such a way that all the terms of the form $\|\partial _y f_i\|_{L^2(0,1)}$
can be absorbed on the left-hand side of (3.18), which simplifies to
$\|\partial _y f_i\|_{L^2(0,1)}$
can be absorbed on the left-hand side of (3.18), which simplifies to
 \begin{equation*} \frac {\textrm {d}}{\,\textrm {d}t} \sum _{i= +,-} \int _0^1 |f_i|^2 \,\textrm {d}y \le C \sum _{i= +,-} \|f_i\|_{L^2(0,1)}^2+ C. \end{equation*}
We then use a Gronwall argument to infer
 \begin{equation*} \sup _{t \in (0, T)} \|f_i(t, \cdot )\|_{L^2(0,1)}^2 \le C=: C_{\mathcal {M}}^2. \end{equation*}
This implies that (3.19) is satisfied and therefore $\Phi$
is self-mapping.
$\Phi$
is self-mapping. $\underline{\textrm{Step 3:}\; \Phi \textrm{is a contraction.}}$
Let
$\underline{\textrm{Step 3:}\; \Phi \textrm{is a contraction.}}$
Let $\widetilde{\boldsymbol{f}}_1, \widetilde{\boldsymbol{f}}_2 \in \mathcal{M}$
and let
$\widetilde{\boldsymbol{f}}_1, \widetilde{\boldsymbol{f}}_2 \in \mathcal{M}$
and let ${\boldsymbol{f}_1}=: \Phi (\widetilde{\boldsymbol{f}}_1)$
and
${\boldsymbol{f}_1}=: \Phi (\widetilde{\boldsymbol{f}}_1)$
and ${\boldsymbol{f}_2}=: \Phi (\widetilde{\boldsymbol{f}}_2)$
be two solutions to (3.18) with the same initial datum
${\boldsymbol{f}_2}=: \Phi (\widetilde{\boldsymbol{f}}_2)$
be two solutions to (3.18) with the same initial datum $\boldsymbol{f}^0$
. We then consider the difference of the corresponding equations and choose
$\boldsymbol{f}^0$
. We then consider the difference of the corresponding equations and choose $\varphi _i= f_{i, 1}- f_{i, 2}$
.
$\varphi _i= f_{i, 1}- f_{i, 2}$
.
Reasoning as in Step 2 and exploiting the Lipschitz continuity of the functions
 \begin{equation} {\mathbb{R}}^2 \ni (a,b) \mapsto (a\,(1- a- b))_{\text{tr}} \quad \text{and} \quad{\mathbb{R}}^2 \ni (a,b) \mapsto (b\,(1- a- b))_{\text{tr}} \end{equation}
we get
 \begin{equation*} \begin{split} & \frac{\textrm{d}}{\,\textrm{d}t} \sum _{i= +,-} \|f_{i, 1}- f_{i, 2}\|_{L^2(0,1)}^2 \le C \sum _{i= +,-} \Big (\|f_{i, 1}- f_{i, 2}\|_{L^2(0,1)}^2+\|\widetilde{f}_{i, 1}- \widetilde{f}_{i, 2}\|_{L^2(0,1)}^2\Big ). \end{split} \end{equation*}
Again by means of a Gronwall argument we have
 \begin{equation*} \sum _{i= +,-} \|(f_{i, 1}- f_{i, 2})(t, \cdot )\|_{L^2(0,1)}^2 \le C\,T\, e^{CT} \sum _{i= +,-} \|\widetilde {f}_{i, 1}- \widetilde {f}_{i, 2}\|_{L^{\infty }(0,T; L^2(0,1))}^2, \end{equation*}
and then $\Phi$
is a contraction if
$\Phi$
is a contraction if $T\gt 0$
is small enough so that
$T\gt 0$
is small enough so that $ C\, T\, e^{C\, T}\lt 1$
. Then Banach’s fixed point theorem applies and we obtain a solution
$ C\, T\, e^{C\, T}\lt 1$
. Then Banach’s fixed point theorem applies and we obtain a solution $\boldsymbol{f} \in (L^{\infty }(0,T; L^2(0,1)))^2$
to (3.17). A standard regularity theory then gives
$\boldsymbol{f} \in (L^{\infty }(0,T; L^2(0,1)))^2$
to (3.17). A standard regularity theory then gives $\boldsymbol{f} \in (L^2(0,T; H^1(0,1)))^2$
, with
$\boldsymbol{f} \in (L^2(0,T; H^1(0,1)))^2$
, with $\partial _t \boldsymbol{f} \in (L^2(0,T; H^1(0,1)')^2$
.
$\partial _t \boldsymbol{f} \in (L^2(0,T; H^1(0,1)')^2$
.
Step 4: Box constraints. We show that such $\boldsymbol{f}$
obtained in Step 4 is actually a solution to (3.6), because it satisfies the box constraint
$\boldsymbol{f}$
obtained in Step 4 is actually a solution to (3.6), because it satisfies the box constraint $ f_+, f_- \ge 0$
and
$ f_+, f_- \ge 0$
and $\rho \le 1$
.
$\rho \le 1$
.
We start by showing that $f_+ \ge 0$
, and to this end we consider only the terms involving the
$f_+ \ge 0$
, and to this end we consider only the terms involving the $\varphi _+$
-functions in (3.17), that is,
$\varphi _+$
-functions in (3.17), that is,
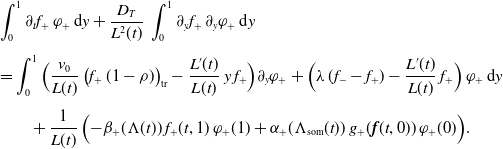 \begin{equation} \begin{split} &\int _0^1 \partial _t f_+\,\varphi _+ \,\textrm{d}y+ \frac{D_T}{L^2(t)}\, \int _0^1 \partial _y f_+ \, \partial _y \varphi _+ \,\textrm{d}y \\[5pt] &= \int _0^1 \Big ( \frac{v_0}{L(t)} \, \bigl (f_+ \,(1- \rho )\bigr )_{\text{tr}} - \frac{L'(t)}{L(t)}\, y\, f_+ \Big ) \partial _y \varphi _+ + \Big (\lambda \,( f_- - f_+)- \frac{L'(t)}{L(t)} \,f_+ \Big )\,\varphi _+ \,\textrm{d}y \\[5pt] & \qquad +\frac{1}{L(t)}\, \Big (\!-\! \beta _{+}(\Lambda (t))\,f_{+}(t, 1) \, \varphi _+(1)+ \alpha _{+}(\Lambda _{\text{som}}(t))\,g_{+}( \boldsymbol{f}(t, 0))\,\varphi _+(0)\Big ). \end{split} \end{equation}
For every $\varepsilon \gt 0$
we consider the function
$\varepsilon \gt 0$
we consider the function $\eta _\varepsilon \in W^{2, \infty }({\mathbb{R}})$
given by
$\eta _\varepsilon \in W^{2, \infty }({\mathbb{R}})$
given by
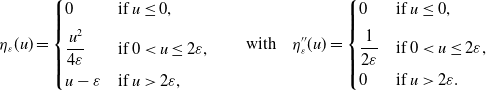 \begin{equation} \eta _\varepsilon (u)= \begin{cases} 0 & \text{if } u \le 0, \\[5pt] \displaystyle \frac{u^2}{4\varepsilon } & \text{if } 0\lt u \le 2\varepsilon, \\[5pt] u- \varepsilon & \text{if } u \gt 2\varepsilon, \end{cases} \qquad \text{with} \quad \eta ''_\varepsilon (u)= \begin{cases} 0 & \text{if } u \le 0, \\[5pt] \displaystyle \frac{1}{2\varepsilon } & \text{if } 0\lt u \le 2\varepsilon, \\[5pt] 0 & \text{if } u \gt 2\varepsilon . \end{cases} \end{equation}
Next we choose $\varphi _+= -\eta _\varepsilon '(\!-\!f_+)$
and observe that by the chain rule we have
$\varphi _+= -\eta _\varepsilon '(\!-\!f_+)$
and observe that by the chain rule we have $\partial _y \varphi _+= \eta _\varepsilon ''(\!-\!f_+)\,\partial _y f_+$
. Using such
$\partial _y \varphi _+= \eta _\varepsilon ''(\!-\!f_+)\,\partial _y f_+$
. Using such $\varphi _+$
in (3.21) gives
$\varphi _+$
in (3.21) gives
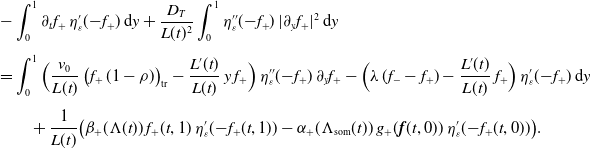 \begin{equation*} \begin{split} & -\int _0^1 \partial _t f_+\, \eta _\varepsilon '(\!-\!f_+) \,\textrm{d}y+ \frac{D_T}{L(t)^2} \int _0^ 1 \eta _\varepsilon ''(\!-\!f_+)\, |\partial _y f_+|^2 \,\textrm{d}y \\[5pt] & = \int _0^1 \Big (\frac{v_0}{L(t)} \, \bigl (f_+\, (1- \rho )\bigr )_{\text{tr}} - \frac{L'(t)}{L(t)}\, y\, f_+ \Big ) \,\eta ''_\varepsilon (\!-\!f_+) \,\partial _y f_+ - \Big (\lambda \,(f_- - f_+) - \frac{L'(t)}{L(t)} \,f_+ \Big )\, \eta '_\varepsilon (\!-\!f_+) \,\textrm{d}y \\[5pt] & \qquad + \frac{1}{L(t)} \big ( \beta _+(\Lambda (t))\, f_+(t,1)\, \eta _\varepsilon '(\!-\!f_+(t, 1)) -\alpha _+(\Lambda _{\text{som}}(t)) \,g_+(\boldsymbol{f}(t,0))\,\eta _\varepsilon '(\!-\!f_+(t,0))\big ). \end{split} \end{equation*}
Thanks to Young’s inequality with a suitable $\kappa \gt 0$
and to (3.16) we have
$\kappa \gt 0$
and to (3.16) we have
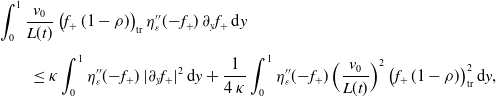 \begin{equation*} \begin{split} &\int _0^1 \frac{v_0}{L(t)}\, \bigl (f_+\,(1- \rho )\bigr )_{\text{tr}}\, \eta _\varepsilon ''(\!-\!f_+)\,\partial _y f_+ \,\textrm{d}y \\[5pt] &\qquad \le \kappa \int _0^1 \eta _\varepsilon ''(\!-\!f_+)\,|\partial _y f_+|^2 \,\textrm{d}y+ \frac{1}{4\,\kappa } \int _0^1 \eta _\varepsilon ''(\!-\!f_+) \,\Big (\frac{v_0}{L(t)}\Big )^2 \,\bigl (f_+\, (1- \rho )\bigr )_{\text{tr}}^2 \,\textrm{d}y, \end{split} \end{equation*}
as well as
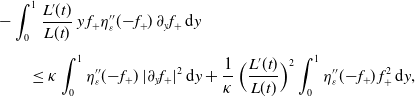 \begin{align*} & -\int _0^1 \frac{L'(t)}{L(t)}\, y\, f_+ \eta _\varepsilon ''(\!-\!f_+)\, \partial _y f_+ \,\textrm{d}y \\[5pt] & \qquad \le \kappa \int _0^1 \eta _\varepsilon ''(\!-\!f_+)\, |\partial _y f_+|^2 \,\textrm{d}y+ \frac{1}{\kappa } \,\Big (\frac{L'(t)}{L(t)}\Big )^2 \int _0^1 \eta _\varepsilon ''(\!-\!f_+)\, f_+^2 \,\textrm{d}y, \end{align*}
where $\kappa$
depends on the lower and upper bounds on
$\kappa$
depends on the lower and upper bounds on $L(t)$
, see Lemma3.6. Choosing
$L(t)$
, see Lemma3.6. Choosing $\kappa$
sufficiently small and taking into account that the term involving
$\kappa$
sufficiently small and taking into account that the term involving $\alpha _+$
is non-negative we obtain
$\alpha _+$
is non-negative we obtain
 \begin{equation} \begin{split} & \frac{\textrm{d}}{\,\textrm{d}t} \int _0^1 \eta _\varepsilon (\!-\!f_+) \,\textrm{d}y = -\int _0^1 \partial _t f_+ \,\eta _\varepsilon '(\!-\!f_+) \,\textrm{d}y \\[5pt] & \le C \int _0^1 \, \eta _\varepsilon ''(\!-\!f_+) \Big [\Big (\frac{v_0}{L(t)}\Big )^2\, \bigl (f_+\, (1- \rho )\bigr )_{\text{tr}}^2+ \Big (\frac{L'(t)}{L(t)}\Big )^2\, f_+^2\Big ] -\left (\lambda \,(f_- - f_+)- \frac{L'(t)}{L(t)}\, f_+ \right ) \eta '_\varepsilon (\!-\!f_+) \,\textrm{d}y \\[5pt] & \qquad + \frac{1}{L(t)}\, \beta _+(\Lambda (t))\,f_+(t,1)\,\eta _\varepsilon '(\!-\!f_+(t, 1)). \end{split} \end{equation}
To gain some sign information on the right-hand side of (3.23), we introduce the set
 \begin{equation} \Omega _\varepsilon \;:\!=\; \{y \in (0,1): \, 0 \lt f_+(t, y), f_-(t, y) \le 2\varepsilon \}. \end{equation}
We first use (3.13), (3.22), and the Lipschitz continuity of (3.20) to have
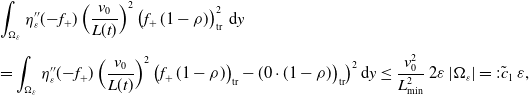 \begin{equation*} \begin{split} & \int _{\Omega _\varepsilon } \eta _\varepsilon ''(\!-\!f_+)\, \Big (\frac{v_0}{L(t)}\Big )^2 \,\bigl (f_+\,(1-\rho )\bigr )_{\text{tr}}^2\; \,\textrm{d}y \\[5pt] &= \int _{\Omega _\varepsilon } \eta _\varepsilon ''(\!-\!f_+)\, \Big (\frac{v_0}{L(t)}\Big )^2 \,\bigl (f_+\,(1-\rho )\bigr )_{\text{tr}} -(0 \cdot (1-\rho )\bigr )_{\text{tr}}\bigr ) ^2 \,\textrm{d}y \le \frac{v_0^2}{L_{\text{min}}^2}\,2 \varepsilon \, |\Omega _\varepsilon |=: \tilde{c}_1\,\varepsilon, \end{split} \end{equation*}
as well as
 \begin{align*} \int _{\Omega _\varepsilon } \eta _\varepsilon ''(\!-\!f_+)\, \Big (\frac{L'(t)}{L(t)}\Big )^2\, f_+^2 \,\textrm{d}y \le \frac{\|h\|_{L^\infty ({\mathbb{R}}^2)}^2}{L_{\text{min}}^2}\, |\Omega _\varepsilon |\, 2 \varepsilon \;:\!=\; \tilde{c}_2\, \varepsilon, \end{align*}
and
 \begin{align*} \frac{L'(t)}{L(t)} \int _{\Omega _\varepsilon } f_+ \,\eta _\varepsilon '(f_+) \,\textrm{d}y \le \frac{\|h\|_{L^\infty ({\mathbb{R}}^2)}^2}{L_{\text{min}}^2}\, |\Omega _\varepsilon |\, 2 \varepsilon = \tilde{c}_2\, \varepsilon . \end{align*}
On the other hand, from (3.24) it follows that $-2\varepsilon \lt f_+- f_- \le 2\varepsilon$
, which implies
$-2\varepsilon \lt f_+- f_- \le 2\varepsilon$
, which implies
 \begin{equation*} -\int _{\Omega _\varepsilon } \lambda \,(f_- - f_+) \,\textrm {d}y \le 2\varepsilon \,\lambda \,|\Omega _\varepsilon |=: \tilde {c}_3\,\varepsilon . \end{equation*}
Concerning the boundary term, we note that by definition the function $\eta _\varepsilon '$
is nonzero only if its argument is nonnegative, which in any case gives
$\eta _\varepsilon '$
is nonzero only if its argument is nonnegative, which in any case gives
 \begin{equation*} \frac {1}{L(t)}\, \beta _+(\Lambda )\,f_+(t,1)\, \eta _\varepsilon '(\!-\!f_+(t, 1)) \le 0. \end{equation*}
Summarising, from (3.23) we have
 \begin{align*} \frac{\textrm{d}}{\textrm{d} t} \int _0^1 (f_+)_- \,\textrm{d}y= \lim _{\varepsilon \to 0} \frac{\textrm{d}}{\textrm{d} t} \int _{\Omega _\varepsilon } \eta _\varepsilon (\!-\!f_+) \,\textrm{d}y \le 0, \end{align*}
which implies
 \begin{align*} \int _0^1 (f_+)_- \,\textrm{d}y \le \int _0^1 (f_+^0)_- \,\textrm{d}y= 0, \end{align*}
where the last equality holds thanks to assumption (H $_1$
). It follows that
$_1$
). It follows that $f_+ \ge 0$
. The proof that
$f_+ \ge 0$
. The proof that $f_- \ge 0$
works in a similar way, starting again from equation (3.17) and taking into account only the terms involving the
$f_- \ge 0$
works in a similar way, starting again from equation (3.17) and taking into account only the terms involving the $\varphi _-$
-functions.
$\varphi _-$
-functions.
We now show that $\rho \le 1$
and to this aim start from (3.17) with
$\rho \le 1$
and to this aim start from (3.17) with $\varphi _i\;:\!=\; \varphi$
, for
$\varphi _i\;:\!=\; \varphi$
, for $i=+,-$
. This gives
$i=+,-$
. This gives
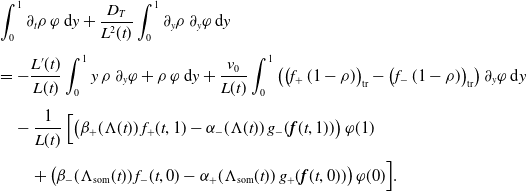 \begin{equation*} \begin{split} & \int _0^1 \partial _t \rho \,\varphi \,\textrm{d}y+ \frac{D_T}{L^2(t)} \int _0^ 1 \partial _y \rho \,\partial _y \varphi \,\textrm{d}y \\[5pt] &= -\frac{L'(t)}{L(t)} \int _0^1 y \,\rho \, \partial _y \varphi + \rho \, \varphi \,\textrm{d}y+ \frac{v_0}{L(t)} \int _0^1 \left (\bigl (f_+\,(1- \rho )\bigr )_{\text{tr}} - \bigl (f_-\,(1- \rho )\bigr )_{\text{tr}}\right ) \partial _y \varphi \,\textrm{d}y \\[5pt] &\quad - \frac{1}{L(t)}\, \Big [ \big (\beta _{+}(\Lambda (t)) \,f_{+}(t, 1)-\alpha _{-}(\Lambda (t))\,g_{-}(\boldsymbol{f}(t, 1))\big ) \,\varphi (1) \\[5pt] & \quad \quad +\big (\beta _{-}(\Lambda _{\textrm{som}}(t))\, f_{-}(t, 0)- \alpha _{+}(\Lambda _{\text{som}}(t))\, g_{+}(\boldsymbol{f}(t, 0))\big ) \, \varphi (0)\Big ]. \end{split} \end{equation*}
We choose $\varphi = \eta _\varepsilon '(\rho -1)$
,
$\varphi = \eta _\varepsilon '(\rho -1)$
, $\widetilde{\Omega }_\varepsilon = \{y \in (0,1): \, 1 \le \rho (t, y) \le 1+ 2\varepsilon \}$
, and reason as before exploiting hypothesis (H
$\widetilde{\Omega }_\varepsilon = \{y \in (0,1): \, 1 \le \rho (t, y) \le 1+ 2\varepsilon \}$
, and reason as before exploiting hypothesis (H $_2$
). Then the limit as
$_2$
). Then the limit as $\varepsilon \to 0$
entails
$\varepsilon \to 0$
entails
 \begin{equation*} 0 \le \int _0^1 (\rho -1)^+ \,\textrm {d}y \le \int _0^1 (\rho ^0-1)^+ \,\textrm {d}y= 0, \end{equation*}
thanks again to (H $_1$
). It follows that
$_1$
). It follows that $\rho \le 1$
, then the claim is proved.
$\rho \le 1$
, then the claim is proved.
Step 5: Conclusion. Using the original notation, we have shown the existence of a solution $\bar{\boldsymbol{f}}$
to (3.6) such that
$\bar{\boldsymbol{f}}$
to (3.6) such that $\bar{f}_+, \bar{f}_- \ge 0$
and
$\bar{f}_+, \bar{f}_- \ge 0$
and $\bar{\rho } \le 1$
for a.e.
$\bar{\rho } \le 1$
for a.e. $y \in (0,1)$
,
$y \in (0,1)$
, $t \in [0, T]$
. This implies that
$t \in [0, T]$
. This implies that $\boldsymbol{f}$
is a weak solution to (3.9)–(3.10) such that
$\boldsymbol{f}$
is a weak solution to (3.9)–(3.10) such that $f_+, f_- \ge 0$
and
$f_+, f_- \ge 0$
and $\rho \le 1$
for a.e.
$\rho \le 1$
for a.e. $x \in (0, L(t))$
,
$x \in (0, L(t))$
, $t \in [0, T]$
. The system is completely solved.
$t \in [0, T]$
. The system is completely solved.
Lemma 3.9. The operator $\mathcal{B}_3 \colon C([0, T])^3 \times C([0, T])^2 \to X$
, which maps a pair
$\mathcal{B}_3 \colon C([0, T])^3 \times C([0, T])^2 \to X$
, which maps a pair $(\boldsymbol{\Lambda }, \boldsymbol{L})$
to the unique solution
$(\boldsymbol{\Lambda }, \boldsymbol{L})$
to the unique solution $(\boldsymbol{f}_1, \boldsymbol{f}_2)$
of (3.9)–(3.10), is Lipschitz continuous.
$(\boldsymbol{f}_1, \boldsymbol{f}_2)$
of (3.9)–(3.10), is Lipschitz continuous.
Proof. Thanks to Theorem3.8, $\mathcal{B}_3$
is well defined. We choose
$\mathcal{B}_3$
is well defined. We choose $\boldsymbol{\Lambda }^{(a)} \in C([0,T])^3$
and
$\boldsymbol{\Lambda }^{(a)} \in C([0,T])^3$
and $\boldsymbol{L}^{(a)} \in C([0, T])^2$
and set
$\boldsymbol{L}^{(a)} \in C([0, T])^2$
and set $(\boldsymbol{f}_1^{(a)}, \boldsymbol{f}_2^{(a)} )\;:\!=\; \mathcal{B}_3(\boldsymbol{\Lambda }^{(a)}, \boldsymbol{L}^{(a)})$
,
$(\boldsymbol{f}_1^{(a)}, \boldsymbol{f}_2^{(a)} )\;:\!=\; \mathcal{B}_3(\boldsymbol{\Lambda }^{(a)}, \boldsymbol{L}^{(a)})$
, $a=1,2$
. Then we start from equations (3.9), (3.10) for the respective copies, take the corresponding differences and use a Gronwall inequality to achieve
$a=1,2$
. Then we start from equations (3.9), (3.10) for the respective copies, take the corresponding differences and use a Gronwall inequality to achieve
 \begin{align} &\|(\boldsymbol{f}_1^{(1)}, \boldsymbol{f}_2^{(1)})- (\boldsymbol{f}_1^{(2)}, \boldsymbol{f}_2^{(2)})\|_{\prod _{j=1,2} (L^2(0,T; H^1(0, 1)))^2} \nonumber \\[5pt] &\qquad \le \overline{C}\, e^{CT}\,\Big (\|\boldsymbol{\Lambda }^{(1)}-\boldsymbol{\Lambda }^{(2)}\|_{C([0,T])^3}^2 + \|\boldsymbol{L}^{(1)}- \boldsymbol{L}^{(2)}\|_{C([0, T])^2}^2\Big ), \end{align}
where the constant $\overline C$
is shown to be uniform.
$\overline C$
is shown to be uniform.
Proof of Theorem
3.3. We use the Banach fixed point theorem to show the existence of a unique solution $(\boldsymbol{f}_1, \boldsymbol{f}_2, \boldsymbol{\Lambda }, \boldsymbol{L})$
to (2.1)–(2.5). We consider the set
$(\boldsymbol{f}_1, \boldsymbol{f}_2, \boldsymbol{\Lambda }, \boldsymbol{L})$
to (2.1)–(2.5). We consider the set
 \begin{equation*} \mathcal {K}= \{(\boldsymbol{f}_1, \boldsymbol{f}_2) \in X : \, 0 \le f_{i, j}(t,x) \le 1 \text { for a.e. $x \in (0, 1)$ and $t \in [0, T]$}\}. \end{equation*}
Let $\mathcal{B} \colon \mathcal{K} \to X$
be given by
$\mathcal{B} \colon \mathcal{K} \to X$
be given by $\mathcal{B}(\boldsymbol{f}_1, \boldsymbol{f}_2) = \mathcal{B}_3(\mathcal{B}_1(\boldsymbol{f}_1, \boldsymbol{f}_2), \mathcal{B}_2(\mathcal{B}_1(\boldsymbol{f}_1, \boldsymbol{f}_2)))$
, where
$\mathcal{B}(\boldsymbol{f}_1, \boldsymbol{f}_2) = \mathcal{B}_3(\mathcal{B}_1(\boldsymbol{f}_1, \boldsymbol{f}_2), \mathcal{B}_2(\mathcal{B}_1(\boldsymbol{f}_1, \boldsymbol{f}_2)))$
, where $\mathcal{B}_1, \mathcal{B}_2, \mathcal{B}_3$
are defined in Lemmas3.5, 3.7, and 3.9, respectively. Thus,
$\mathcal{B}_1, \mathcal{B}_2, \mathcal{B}_3$
are defined in Lemmas3.5, 3.7, and 3.9, respectively. Thus, $\mathcal{B}$
is well defined, while Theorem3.8 implies that
$\mathcal{B}$
is well defined, while Theorem3.8 implies that $\mathcal{B}$
is self-mapping, that is,
$\mathcal{B}$
is self-mapping, that is, $\mathcal{B}\colon \mathcal{K} \to \mathcal{K}$
.
$\mathcal{B}\colon \mathcal{K} \to \mathcal{K}$
.
We next show that $\mathcal{B}$
is a contraction. Let
$\mathcal{B}$
is a contraction. Let $(\widehat{\boldsymbol{f}}_1^{(1)}, \widehat{\boldsymbol{f}}_2^{(1)}), (\widehat{\boldsymbol{f}}_1^{(2)}, \widehat{\boldsymbol{f}}_2^{(2)}) \in \mathcal{K}$
and set
$(\widehat{\boldsymbol{f}}_1^{(1)}, \widehat{\boldsymbol{f}}_2^{(1)}), (\widehat{\boldsymbol{f}}_1^{(2)}, \widehat{\boldsymbol{f}}_2^{(2)}) \in \mathcal{K}$
and set $( \boldsymbol{f}_1^{(1)}, \boldsymbol{f}_2^{(1)})\;:\!=\; \mathcal{B}(\widehat{\boldsymbol{f}}_1^{(1)}, \widehat{\boldsymbol{f}}_2^{(1)})$
as well as
$( \boldsymbol{f}_1^{(1)}, \boldsymbol{f}_2^{(1)})\;:\!=\; \mathcal{B}(\widehat{\boldsymbol{f}}_1^{(1)}, \widehat{\boldsymbol{f}}_2^{(1)})$
as well as $(\boldsymbol{f}_1^{(2)}, \boldsymbol{f}_2^{(2)})\;:\!=\; \mathcal{B}(\widehat{\boldsymbol{f}}_1^{(2)}, \widehat{\boldsymbol{f}}_2^{(2)})$
. Using (3.25), (3.15) and (3.12) and summarising the not essential constants gives
$(\boldsymbol{f}_1^{(2)}, \boldsymbol{f}_2^{(2)})\;:\!=\; \mathcal{B}(\widehat{\boldsymbol{f}}_1^{(2)}, \widehat{\boldsymbol{f}}_2^{(2)})$
. Using (3.25), (3.15) and (3.12) and summarising the not essential constants gives
 \begin{equation*} \begin{split} & \|(\boldsymbol{f}_1^{(1)}, \boldsymbol{f}_2^{(1)} )- (\boldsymbol{f}_1^{(2)}, \boldsymbol{f}_2^{(2)})\|_X \\[5pt] & \le C T e^{CT} \big (T \max _{j=1,2} \big \{L_{h_j} e^{2T L_{h_j}}\big \}+1 \big ) \|(\widehat{\boldsymbol{f}}_1^{(1)}, \widehat{\boldsymbol{f}}_2^{(1)})- (\widehat{\boldsymbol{f}}_1^{(2)}, \widehat{\boldsymbol{f}}_2^{(2)})\|_X, \end{split} \end{equation*}
from which the contractivity follows if $T\gt 0$
is small enough that
$T\gt 0$
is small enough that $C T e^{CT}\lt 1$
. Thanks to the Banach’s fixed point theorem, we then infer the existence of a unique
$C T e^{CT}\lt 1$
. Thanks to the Banach’s fixed point theorem, we then infer the existence of a unique $( \boldsymbol{f}_1, \boldsymbol{f}_2) \in \mathcal{K}$
such that
$( \boldsymbol{f}_1, \boldsymbol{f}_2) \in \mathcal{K}$
such that $(\boldsymbol{f}_1, \boldsymbol{f}_2)= \mathcal{B}( \boldsymbol{f}_1, \boldsymbol{f}_2)$
. From (3.12), this implies the uniqueness of
$(\boldsymbol{f}_1, \boldsymbol{f}_2)= \mathcal{B}( \boldsymbol{f}_1, \boldsymbol{f}_2)$
. From (3.12), this implies the uniqueness of $\boldsymbol{\Lambda }$
, too. Due to the uniform
$\boldsymbol{\Lambda }$
, too. Due to the uniform $L^\infty$
-bounds on
$L^\infty$
-bounds on $\boldsymbol{f}_j$
, a concatenation argument yields existence on the complete interval
$\boldsymbol{f}_j$
, a concatenation argument yields existence on the complete interval $[0,T]$
. The proof is thus complete.
$[0,T]$
. The proof is thus complete.
4. Stationary solutions
This section is dedicated to a brief investigation of stationary solutions $(\boldsymbol{f}_1^{\infty }, \boldsymbol{f}_2^{\infty }, \boldsymbol{\Lambda }^{\infty }, \boldsymbol{L}^{\infty })$
to (2.1)–(2.5). That is, they satisfy
$(\boldsymbol{f}_1^{\infty }, \boldsymbol{f}_2^{\infty }, \boldsymbol{\Lambda }^{\infty }, \boldsymbol{L}^{\infty })$
to (2.1)–(2.5). That is, they satisfy
 \begin{equation} \begin{aligned} 0&= -\frac{1}{(L_j^\infty )^2}\,\partial _x \left [L_j^\infty \,v_0\,f_{+,j}^{\infty }\,(1- \rho _j^{\infty })- D_T\,\partial _{x} f_{+,j}^{\infty } \right ] + \lambda \,(f_{-,j}^{\infty } - f_{+,j}^{\infty }), \\[5pt] 0&= -\frac{1}{(L_j^\infty )^2}\,\partial _x \left [-L_j^\infty \, v_0\,f_{-,j}^{\infty }\,(1- \rho _j^{\infty })- D_T\,\partial _{x} f_{-,j}^{\infty } \right ] + \lambda \, (f_{+,j}^{\infty } - f_{-,j}^{\infty }), \end{aligned} \quad \text{in } (0, 1), \end{equation}
with boundary conditions
 \begin{equation} \begin{aligned} J_{+,j}^{\infty }(0) &= L_j^\infty \alpha _{+,j}(\Lambda _{\text{som}}^\infty )\, g_{+,j}(\boldsymbol{f}_{j}^{\infty }(0)), &\quad -J_{-,j}^{\infty }(0)&= L_j^\infty \beta _{-,j}(\Lambda _{\text{som}}^{\infty })\,f_{-,j}^{\infty }(0),\\[5pt] J_{+,j}^{\infty }(1) &= L_j^\infty \beta _{+,j}(\Lambda _j^\infty )\,f_{+,j}^{\infty }(1), &\quad -J_{-,j}^{\infty }(1) &= L_j^\infty \alpha _{-,j}(\Lambda _j^\infty )\,g_{-,j}(\boldsymbol{f}_{j}^{\infty }(1)), \end{aligned} \end{equation}
while $\boldsymbol{\Lambda }^\infty$
and
$\boldsymbol{\Lambda }^\infty$
and $\boldsymbol{L}^\infty$
solve
$\boldsymbol{L}^\infty$
solve
 \begin{equation} \begin{aligned} 0 &= \sum _{j=1,2} \bigl ( \beta _{-,j}(\Lambda _{\text{som}}^{\infty })\,f_{-,j}^{\infty }(0) - \alpha _{+,j}(\Lambda _{\text{som}}^\infty )\, g_{+,j}(\boldsymbol{f}_{j}^{\infty }(0)) \bigr ), \\[5pt] 0 &= \beta _{+,j}(\Lambda _j^\infty )\,f_{+,j}^{\infty }(L_j^\infty )- \alpha _{-,j}(\Lambda _j^\infty )\, g_{-,j}(\boldsymbol{f}_{j}^{\infty }( L_j^\infty )) - \chi \,h_j(\Lambda _j^\infty, L_j^\infty ), \\[5pt] 0 &= h_j(\Lambda _j^\infty, L_j^\infty ), \end{aligned} \end{equation}
respectively. Notice that we assumed $\gamma _{\text{prod}}(t) \to 0$
as
$\gamma _{\text{prod}}(t) \to 0$
as $t\to \infty$
, cf. hypothesis (H
$t\to \infty$
, cf. hypothesis (H $_7$
), in order to guarantee a finite total mass of the stationary state (which, in turn, results in finite values of
$_7$
), in order to guarantee a finite total mass of the stationary state (which, in turn, results in finite values of $L_j^\infty$
). From the modelling point of view, this means that at the end of the growth phase, when the neuron is fully developed, there is no more production of vesicles in the soma. In addition to equations (4.1)–(4.3), stationary solutions are parametrised by their total mass:
$L_j^\infty$
). From the modelling point of view, this means that at the end of the growth phase, when the neuron is fully developed, there is no more production of vesicles in the soma. In addition to equations (4.1)–(4.3), stationary solutions are parametrised by their total mass:
 \begin{equation*} m_\infty \;:\!=\; \sum _{j=1,2} \left (L_j^\infty \int _0^{1} \rho _j^\infty (y)\,\textrm {d}y + \Lambda _j^\infty {+ \chi \,L_j^\infty }\right ) + \Lambda _{\text {som}}^\infty . \end{equation*}
For fixed $0\lt m_\infty \lt +\infty$
, we expect three possible types of stationary solutions (where the upper bound on
$0\lt m_\infty \lt +\infty$
, we expect three possible types of stationary solutions (where the upper bound on $m_\infty$
excludes neurites of infinite length):
$m_\infty$
excludes neurites of infinite length):
-
• No mass inside the neurites, that is,
$\rho _j^\infty = 0$
, and
$m_\infty = \Lambda _1^\infty + \Lambda _2^\infty + \chi \,L_1^\infty + \chi \,L_2^\infty + \Lambda _{\text{som}}^\infty$
. This solution is always possible as it automatically satisfies (4.2). The length depends on the fraction of mass stored in each
$\Lambda _j$
, which yields a family of infinite solutions. -
• Constant solutions with mass inside the neurites, that is,
$\boldsymbol{f}_j^\infty \neq (0,0)$
. In this case, for
$\lambda \gt 0$
, the reaction term enforces
$f_{-,j}^\infty = f_{+,j}^\infty =: f_j^\infty$
. However, such solutions only exist if the non-linearities at the boundary satisfy conditions so that (4.2) holds. In this case, compatibility with a given total mass
$m_\infty$
can be obtained by adjusting the concentration
$\Lambda _{\text{som}}^\infty$
, which decouples from the remaining equations. -
• Non-constant solutions, featuring boundary layers at the end of the neurites.


A natural question is the existence of non-constant stationary solutions as well as their uniqueness and stability properties which we postpone to future work. Instead, we focus on conditions for the existence of non-trivial constant solutions. Let us note, however, that even if the biological system reaches a stationary state in terms of the length of the neurites, we would still expect a flux of vesicles through the system (i.e., the system will still be out of thermodynamic equilibrium). Thus, the fluxes at the boundary would be non-zero and one would expect non-constant stationary solutions even in this case.
4.1. Constant stationary solutions
We assume a strictly positive reaction rate $\lambda \gt 0$
which requires
$\lambda \gt 0$
which requires $f_{+,j} = f_{-,j} =: f_j^\infty \in [0,1]$
. Assuming in addition
$f_{+,j} = f_{-,j} =: f_j^\infty \in [0,1]$
. Assuming in addition $f_j^\infty = \textrm{const}.$
, (4.1) is automatically satisfied (note that
$f_j^\infty = \textrm{const}.$
, (4.1) is automatically satisfied (note that $(L_j^\infty )'=0$
). Thus, the actual constants are determined via the total mass, the stationary solutions to the ODEs and the boundary couplings, only, where the fluxes take the form:
$(L_j^\infty )'=0$
). Thus, the actual constants are determined via the total mass, the stationary solutions to the ODEs and the boundary couplings, only, where the fluxes take the form:
 \begin{equation} J_{+,j}^{\infty }= -J_{-,j}^{\infty }= v_0\,f_{j}^{\infty }\,(1- \rho _j^{\infty })= v_0\,f_{j}^{\infty }\,(1- 2f_j^{\infty }). \end{equation}
Making the choice
 \begin{align} g_{+,j}(f_{+,j}, f_{-,j})= f_{+,j}\,(1- \rho _j) \quad \text{as well as} \quad g_{-,j}(f_{+,j}, f_{-,j})= f_{-,j}\,(1- \rho _j), \end{align}
the boundary conditions (4.2) become
 \begin{equation} \begin{split} J_{+,j}^{\infty }&={L_j^\infty }\alpha _{+,j}(\Lambda _{\text{som}}^\infty )\, f_j^{\infty }\,(1- \rho _j^{\infty })={L_j^\infty }\beta _{+,j}(\Lambda _j^{\infty })\, f_j^{\infty }, \\[5pt] -J_{-,j}^{\infty }&={L_j^\infty }\alpha _{-,j}(\Lambda _{j}^\infty )\,f_j^{\infty }\,(1- \rho _j^{\infty })={L_j^\infty }\beta _{-,j}(\Lambda _{\text{som}}^{\infty })\, f_j^{\infty }, \end{split} \end{equation}
which together with (4.4) yield
 \begin{equation*} \alpha _{+,j}(\Lambda _{\text {som}}^{\infty })= \alpha _{-,j}(\Lambda _j^{\infty })= \frac {v_0}{L_j^\infty } \quad \text {as well as} \quad \beta _{-,j}(\Lambda _{\text {som}}^{\infty })= \beta _{+,j}(\Lambda _j^{\infty })= \frac {v_0(1- \rho _j^{\infty })}{L_j^\infty }. \end{equation*}
Thus, fixing the values of $f_j^\infty$
, we obtain
$f_j^\infty$
, we obtain $\Lambda _j^\infty$
,
$\Lambda _j^\infty$
, $\Lambda _{\text{som}}^\infty$
by inverting
$\Lambda _{\text{som}}^\infty$
by inverting $\alpha _{+,j}$
,
$\alpha _{+,j}$
, $\alpha _{-,j}$
,
$\alpha _{-,j}$
, $\beta _{+,j}$
, and
$\beta _{+,j}$
, and $\beta _{-,j}$
, respectively, together with the compatibility conditions:
$\beta _{-,j}$
, respectively, together with the compatibility conditions:
 \begin{equation*} \alpha _{-,j}(\Lambda _j^\infty )(1-\rho _j^\infty ) = \beta _{+,j}(\Lambda _j^\infty ) \quad \text {as well as} \quad \alpha _{+,j}(\Lambda _{\text {som}}^\infty )(1- \rho _j^\infty )= \beta _{-,j}(\Lambda _{\text {som}}^\infty ). \end{equation*}
We further observe that the equations in (4.3) are the differences of in- and outflow at the respective boundaries, which in the case of constant $f_j^\infty$
-s read as:
$f_j^\infty$
-s read as:
 \begin{equation} \begin{split} 0&= \sum _{j=1,2} \left (\beta _{-,j}(\Lambda _{\text{som}}^\infty )\,f_j^\infty - \alpha _{+,j}(\Lambda _{\text{som}}^\infty )\,f_j^\infty \,(1- \rho _j^\infty )\right ), \\[5pt] 0&= \beta _{+,j}(\Lambda _j^\infty )\,f_j^\infty - \alpha _{-,j}(\Lambda _j^\infty )\,f_j^\infty \,(1- \rho _j^\infty ) - \chi \,h_j(\Lambda _j^\infty, L_j^\infty ). \end{split} \end{equation}
It turns out that (4.7) will be automatically satisfied as soon as (4.6) and (4.3) hold. In particular, the last equation in (4.3) will determine the values of $L_j^\infty$
. We make the choices
$L_j^\infty$
. We make the choices
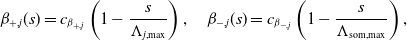 \begin{align} \beta _{+,j}(s)&= c_{\beta _{+,j}} \left (1- \frac{s}{\Lambda _{j, \text{max}}}\right ), \quad \beta _{-,j}(s)= c_{\beta _{-,j}} \left (1- \frac{s}{\Lambda _{\text{som}, \text{max}}}\right ), \end{align}
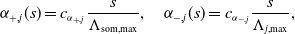 \begin{align} \alpha _{+,j}(s)&= c_{\alpha _{+,j}} \frac{s}{\Lambda _{\text{som}, \text{max}}}, \quad \alpha _{-,j}(s)= c_{\alpha _{-,j}} \frac{s}{\Lambda _{j, \text{max}}}, \end{align}
for some $c_{\beta _{i,j}}, c_{\alpha _{i,j}} \ge 0$
, with
$c_{\beta _{i,j}}, c_{\alpha _{i,j}} \ge 0$
, with $\Lambda _{\text{som}, \text{max}}$
and
$\Lambda _{\text{som}, \text{max}}$
and $\Lambda _{j,\text{max}}$
being the maximal capacity of soma and growth cones. Then, for given
$\Lambda _{j,\text{max}}$
being the maximal capacity of soma and growth cones. Then, for given $f_j^\infty \in (0,\frac{1}{2}]$
to be a stationary solution, we need
$f_j^\infty \in (0,\frac{1}{2}]$
to be a stationary solution, we need
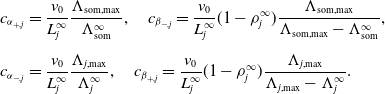 \begin{align*} c_{\alpha _{+,j}}&={\frac{v_0}{L_j^\infty }} \frac{\Lambda _{\text{som,max}}}{\Lambda _{\text{som}}^\infty }, \quad c_{\beta _{-,j}}={\frac{v_0}{L_j^\infty }}(1- \rho _j^\infty ) \frac{\Lambda _{\text{som,max}}}{\Lambda _{\text{som,max}}- \Lambda _{\text{som}}^\infty }, \\[5pt] c_{\alpha _{-,j}}&={\frac{v_0}{L_j^\infty }} \frac{\Lambda _{j, \text{max}}}{\Lambda _j^\infty }, \quad c_{\beta _{+,j}}={\frac{v_0}{L_j^\infty }}(1- \rho _j^\infty ) \frac{\Lambda _{j, \text{max}}}{\Lambda _{j, \text{max}}- \Lambda _j^\infty }. \end{align*}
The interesting question of stability of these states will be treated in future work.
5. Finite volume scheme and scaling
5.1. Finite volume scheme
We now present a computational scheme for the numerical solution of model (2.1)–(2.5). The scheme relies on a spatial finite volume discretisation of the conservation law (2.2) and adapted implicit–explicit time-stepping schemes. Starting point for the construction of a discretisation is the transformed equation (3.3). First, we introduce an equidistant grid:
 \begin{equation*} 0 = y_{-1/2} \lt y_{1/2} \lt \ldots \lt y_{n_e-1/2} \lt y_{n_e+1/2} = 1 \end{equation*}
of the interval $(0,1)$
and define control volumes
$(0,1)$
and define control volumes $I_k \;:\!=\; (y_{k-1/2},y_{k+1/2})$
,
$I_k \;:\!=\; (y_{k-1/2},y_{k+1/2})$
, $k=0,\ldots, n_e$
. The mesh parameter is
$k=0,\ldots, n_e$
. The mesh parameter is $h=y_{k+1/2}-y_{k-1/2} = (n_e+1)^{-1}$
. The cell averages of the approximate (transformed) solution are denoted by:
$h=y_{k+1/2}-y_{k-1/2} = (n_e+1)^{-1}$
. The cell averages of the approximate (transformed) solution are denoted by:
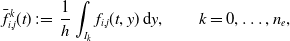 \begin{equation*} \bar {f}_{i,j}^k(t) \;:\!=\; \frac{1}{h} \int _{I_k} f_{i,j}(t,y)\,\textrm {d}y,\qquad k=0,\ldots, n_e, \end{equation*} $i\in \{+,-\}$
,
$i\in \{+,-\}$
, $j\in \{1,2\}$
. To shorten the notation, we omit the vesicle index
$j\in \{1,2\}$
. To shorten the notation, we omit the vesicle index $j\in \{1,2\}$
in the following. Integrating (3.3) over an arbitrary control volume
$j\in \{1,2\}$
in the following. Integrating (3.3) over an arbitrary control volume $I_k$
,
$I_k$
, $k=0, \ldots, n_e$
, yields
$k=0, \ldots, n_e$
, yields
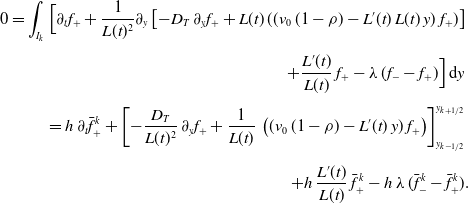 \begin{align*} 0 = \int _{I_k} \Big [ \partial _t f_+ + \frac{1}{L(t)^2} \partial _y\left [- D_T\,\partial _y f_+ + L(t)\,((v_0\,(1-\rho ) - L'(t)\,L(t)\,y)\,f_+)\right ]&\\[5pt] + \frac{L'(t)}{L(t)}\, f_+ - \lambda \,(f_- - f_+) \Big ]\,\textrm{d}y &\\[5pt] = h\,\partial _t \bar{f}_+^k + \left [- \frac{D_T}{L(t)^2}\,\partial _y f_+ + \frac {1}{L(t)}\, \left ((v_0\,(1-\rho ) - L'(t)\,y)\,f_+\right )\right ]_{y_{k-1/2}}^{y_{k+1/2}} &\\[5pt] + h\,\frac{L'(t)}{L(t)}\, \bar{f}_+^k - h\,\lambda \,(\bar{f}_-^k-\bar{f}_+^k)& . \end{align*}
We denote the convective flux by $\textbf{v}_+(t,y) \;:\!=\; v_0\,(1-\rho )-L'(t)\,y$
and use a Lax-Friedrichs approximation at the end points of the control volume:
$\textbf{v}_+(t,y) \;:\!=\; v_0\,(1-\rho )-L'(t)\,y$
and use a Lax-Friedrichs approximation at the end points of the control volume:
 \begin{equation*} F_+^{k+1/2}(t) \;:\!=\; \{\!\!\{(\textbf {v}_+\,\bar {f}_+)(t,y_{k+1/2})\}\!\!\} - \frac {1}{2}\,\{\!\{\bar {f}_+(t,y_{k+1/2})\}\} \approx (\textbf {v}_+\,f_+)(t,y_{k+1/2}), \end{equation*}
with $\{\{\cdot\}\}$
and
$\{\{\cdot\}\}$
and $[\![\!\cdot\!]\!]$
denoting the usual average and jump operators. For the diffusive fluxes, we use an approximation by central differences:
$[\![\!\cdot\!]\!]$
denoting the usual average and jump operators. For the diffusive fluxes, we use an approximation by central differences:
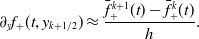 \begin{equation*} \partial _y f_+(t,y_{k+1/2}) \approx \frac {\bar {f}_+^{k+1}(t) - \bar {f}_+^{k}(t)}{h}. \end{equation*}
For the inner intervals $I_k$
with
$I_k$
with $k \in \{1,\ldots, n_e-1\}$
, this gives the equations:
$k \in \{1,\ldots, n_e-1\}$
, this gives the equations:
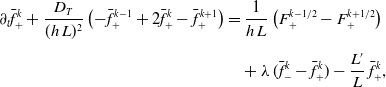 \begin{align} \partial _t \bar{f}_+^k + \frac{D_T}{(h\,L)^2}\left (-\bar{f}_+^{k-1} + 2\bar{f}_+^k - \bar{f}_+^{k+1}\right ) &= \frac 1{h\,L} \left (F_+^{k-1/2}-F_+^{k+1/2}\right ) \nonumber \\[5pt] & \quad + \lambda \,(\bar{f}_-^k - \bar{f}_+^k) - \frac{L'}{L}\,\bar{f}_+^k, \end{align}
while for $k=0$
and
$k=0$
and $k=n_e$
, we insert the boundary conditions (3.4) to obtain
$k=n_e$
, we insert the boundary conditions (3.4) to obtain
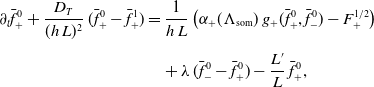 \begin{align} \partial _t\bar{f}_+^0 + \frac{D_T}{(h\,L)^2}\,(\bar{f}_+^0 - \bar{f}_+^1) &= \frac 1{h\,L}\left (\alpha _+(\Lambda _{\text{som}})\,g_+(\bar{f}_+^0, \bar{f}_-^0) - F_+^{1/2} \right ) \nonumber \\[5pt] & \quad + \lambda \,(\bar{f}_-^0 - \bar{f}_+^0) - \frac{L'}{L}\,\bar{f}_+^0, \end{align}
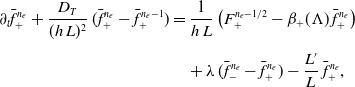 \begin{align} \partial _t\bar{f}_+^{n_e} + \frac{D_T}{(h\,L)^2}\,(\bar{f}_+^{n_e} - \bar{f}_+^{n_e-1}) &= \frac 1{h\,L} \left (F_+^{n_e-1/2} - \beta _+(\Lambda )\,\bar{f}_+^{n_e} \right ) \nonumber \\[5pt] & \quad + \lambda \,(\bar{f}_-^{n_e} - \bar{f}_+^{n_e}) - \frac{L'}{L}\,\bar{f}_+^{n_e}, \end{align}
almost everywhere in $(0,T)$
. In the same way, we deduce a semi-discrete system for
$(0,T)$
. In the same way, we deduce a semi-discrete system for $\bar{f}_-^k$
,
$\bar{f}_-^k$
, $k=0,\ldots, n_e$
, taking into account the corresponding boundary conditions from (3.4).
$k=0,\ldots, n_e$
, taking into account the corresponding boundary conditions from (3.4).
To treat the time dependency, we use an implicit–explicit time-stepping scheme. We introduce a time grid $t_n = \tau \,n$
, for
$t_n = \tau \,n$
, for $n=0,\ldots, n_t$
, and for some time-dependent function
$n=0,\ldots, n_t$
, and for some time-dependent function $g\colon [0,T]\to X$
we use the notation
$g\colon [0,T]\to X$
we use the notation $g(t_n) =: g^{(n)}$
. To deduce a fully discrete scheme, we replace the time derivatives in (5.1) by a difference quotient
$g(t_n) =: g^{(n)}$
. To deduce a fully discrete scheme, we replace the time derivatives in (5.1) by a difference quotient $\partial _t\bar{f}_{+}(t_{n+1}) \approx \tau ^{-1}(\bar{f}_+^{(n+1)}-\bar{f}_+^{(n)})$
and evaluate the remaining terms related to diffusion in the successive time point
$\partial _t\bar{f}_{+}(t_{n+1}) \approx \tau ^{-1}(\bar{f}_+^{(n+1)}-\bar{f}_+^{(n)})$
and evaluate the remaining terms related to diffusion in the successive time point $t_{n+1}$
and all convection and reaction related terms in the current time point
$t_{n+1}$
and all convection and reaction related terms in the current time point $t_n$
. This yields a system of linear equations of the form:
$t_n$
. This yields a system of linear equations of the form:
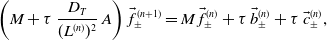 \begin{equation} \left (M+\tau \,\frac{D_T}{(L^{(n)})^2}\,A\right )\,\vec f_{\pm }^{(n+1)} = M\,\vec f_{\pm }^{(n)} + \tau \,\vec b_{\pm }^{(n)} + \tau \,\vec c_{\pm }^{(n)}, \end{equation}
with vector of unknowns $\vec f_\pm ^{(n)} = (f_\pm ^{0,(n)}, \ldots, f_\pm ^{n_e,(n)})^\top$
, mass matrix
$\vec f_\pm ^{(n)} = (f_\pm ^{0,(n)}, \ldots, f_\pm ^{n_e,(n)})^\top$
, mass matrix $M$
, diffusion matrix
$M$
, diffusion matrix $A$
, and a vector
$A$
, and a vector $\vec b_\pm ^{(n)}$
summarising the convection related terms and another vector for the reaction related terms
$\vec b_\pm ^{(n)}$
summarising the convection related terms and another vector for the reaction related terms $\vec c_\pm ^{(n)}$
. In the same way, we deduce equations for the discretised ordinary differential equations (2.5) and (2.4) which correspond to a standard backward Euler discretisation:
$\vec c_\pm ^{(n)}$
. In the same way, we deduce equations for the discretised ordinary differential equations (2.5) and (2.4) which correspond to a standard backward Euler discretisation:
 \begin{align} \Lambda _{\text{som}}^{(n+1)} &= \Lambda _{\text{som}}^{(n)} + \tau \,\sum _{j=1,2} \left ( \beta _{-,j}\,\bar{f}_{j,-}^{0, (n+1)} - \alpha _{+,j}(\Lambda _{\text{som}}^{(n+1)})\, g_{+}(\bar{f}_{+,j}^{0,(n+1)}, \bar{f}_{-,j}^{0,(n+1)}) \right ) + \tau \,\gamma _{\text{prod}}^{(n)}, \end{align}
 \begin{align} \Lambda _j^{(n+1)} &= \Lambda _j^{(n)} + \tau \,\beta _{+,j}(\Lambda _j^{(n+1)})\,\bar{f}_{+,j}^{n_e,(n+1)} \end{align}
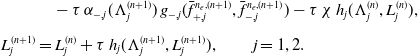 \begin{align} &\quad -\tau \,\alpha _{-,j}(\Lambda _j^{(n+1)})\,g_{-,j}(\bar{f}_{+,j}^{n_e,(n+1)}, \bar{f}_{-,j}^{n_e,(n+1)}) - \tau \,\chi \, h_j(\Lambda _j^{(n)}, L_j^{(n)}), \nonumber \\[5pt] L_j^{(n+1)} &= L_j^{(n)} + \tau \,h_j(\Lambda _j^{(n+1)}, L_j^{(n+1)}),\qquad j=1,2. \end{align}
Equations (5.2)–(5.5) even decouple. One after the other, we can compute
 \begin{equation*} \boldsymbol{f}^0, L_j^0, \Lambda _k^0\;\rightarrow \; \vec f_{\pm, j}^{(1)}\;\rightarrow \; \Lambda _{k}^{(1)}\;\rightarrow \; L_j^{(1)} \; \rightarrow \; \vec f_{\pm, j}^{(2)}\;\rightarrow \; \Lambda _k^{(2)}\;\rightarrow \; L_j^{(2)} \;\rightarrow \;\ldots \end{equation*}
for $k\in \{1,2,\text{som}\}$
and
$k\in \{1,2,\text{som}\}$
and $j\in \{1,2\}$
.
$j\in \{1,2\}$
.
5.2. Non-dimensionalisation of the model
To transform the model to a dimensionless form, we introduce a typical time scale $\tilde{t}$
, a typical length
$\tilde{t}$
, a typical length $\tilde{L}$
, etc., and dimensionless quantities
$\tilde{L}$
, etc., and dimensionless quantities $\bar{t},\, \bar{L}$
such that
$\bar{t},\, \bar{L}$
such that $t = \tilde{t} \bar{t}$
,
$t = \tilde{t} \bar{t}$
, $L = \tilde{L} \bar{L}$
. This is performed on the original system from Section 2, not on the one transformed to the unit interval, as we want to work with appropriate physical units for all quantities, including the length of the neurites. Realistic typical values are taken from [Reference Humpert, Di Meo, Püschel and Pietschmann19] (see also [Reference Pfenninger27, Reference Tsaneva-Atanasova, Burgo, Galli and Holcman32, Reference Urbina, Gomez and Gupton34]) which yield the following choices: the typical length is
$L = \tilde{L} \bar{L}$
. This is performed on the original system from Section 2, not on the one transformed to the unit interval, as we want to work with appropriate physical units for all quantities, including the length of the neurites. Realistic typical values are taken from [Reference Humpert, Di Meo, Püschel and Pietschmann19] (see also [Reference Pfenninger27, Reference Tsaneva-Atanasova, Burgo, Galli and Holcman32, Reference Urbina, Gomez and Gupton34]) which yield the following choices: the typical length is $\tilde{L} = 25 \,\mu \text{m}$
, the typical time is
$\tilde{L} = 25 \,\mu \text{m}$
, the typical time is $\tilde{t} = 7200 \,\text{s}$
, the diffusion constant is
$\tilde{t} = 7200 \,\text{s}$
, the diffusion constant is $D_T = 0.5\, \frac{\mu \text{m}^2}{\text{s}}$
, and the velocity is
$D_T = 0.5\, \frac{\mu \text{m}^2}{\text{s}}$
, and the velocity is $\tilde{v}_0 = 50 \frac{\mu \text{m}}{\text{min}} = \frac 56\,\frac{\mu \text{m}}{\text{s}}$
. For the reaction rate, we assume
$\tilde{v}_0 = 50 \frac{\mu \text{m}}{\text{min}} = \frac 56\,\frac{\mu \text{m}}{\text{s}}$
. For the reaction rate, we assume $\tilde{\lambda } = \frac{1}{s}$
. The typical influx and outflow velocity is
$\tilde{\lambda } = \frac{1}{s}$
. The typical influx and outflow velocity is $\tilde{\alpha } = \tilde{\beta } = 0.4\, \frac{\mu \text{m}}{\text{s}}$
. Finally, we choose a typical production of
$\tilde{\alpha } = \tilde{\beta } = 0.4\, \frac{\mu \text{m}}{\text{s}}$
. Finally, we choose a typical production of $\tilde{\gamma } = 10\, \text{vesicles}/\text{sec}$
.
$\tilde{\gamma } = 10\, \text{vesicles}/\text{sec}$
.
The remaining quantities to be determined are the maximal density of vesicles inside the neurites, the factor which translates a given number of vesicles with length change of the neurite and the maximal capacity of soma and growth cones.
Maximal density
We assume the neurite to be tube-shaped, pick a circular cross section at an arbitrary point and calculate the maximal number of circles having the diameter of the vesicles that fit the circle whose diameter is that of the neurite. In this situation, hexagonal packing of the smaller circles is optimal, which allows to cover about $90\,\%$
of the area (neglecting boundary effects). As the typical diameter of one vesicle is
$90\,\%$
of the area (neglecting boundary effects). As the typical diameter of one vesicle is $130\,\textrm{nm}$
and the neurite diameter is 1
$130\,\textrm{nm}$
and the neurite diameter is 1 $\mu$
m, we obtain the condition:
$\mu$
m, we obtain the condition:
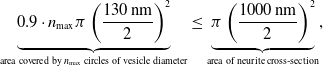 \begin{align*} \underbrace{0.9\cdot n_{\text{max}}\pi \left (\frac{130\,\textrm{nm}}{2}\right )^2}_{\text{area covered by $n_{\text{max}}$ circles of vesicle diameter}}\le \underbrace{\pi \left (\frac{1000\,\textrm{nm}}{2}\right )^2}_{\text{area of neurite cross-section}}, \end{align*}
which implies $n_{\text{max}} \le 65$
. Now for a tube segment of length
$n_{\text{max}} \le 65$
. Now for a tube segment of length $1\,\mathrm{\mu m}$
, one can stack
$1\,\mathrm{\mu m}$
, one can stack $7$
fully packed cross-sectional slices, each of which has the diameter of the vesicles, that is,
$7$
fully packed cross-sectional slices, each of which has the diameter of the vesicles, that is, $130\,\textrm{nm}$
. This results in a maximal density of
$130\,\textrm{nm}$
. This results in a maximal density of $455 \frac{\text{vesicles}}{\mu m}$
. As the neurite also contains microtubules and as an optimal packing is biologically unrealistic, we take one-third of this value as maximal density, which yields
$455 \frac{\text{vesicles}}{\mu m}$
. As the neurite also contains microtubules and as an optimal packing is biologically unrealistic, we take one-third of this value as maximal density, which yields $ \rho _{\text{max}} = 155 \frac{\text{vesicles}}{\mathrm{\mu m}}.$
The typical density of anterograde and retrograde particles is fixed to
$ \rho _{\text{max}} = 155 \frac{\text{vesicles}}{\mathrm{\mu m}}.$
The typical density of anterograde and retrograde particles is fixed to $\tilde{f} \;:\!=\; \tilde{f}_+= \tilde{f}_- = 39\, \frac{\text{vesicles}}{\mu \text{m}}$
so that their sum corresponds to a half-filled neurite. Thus, for the scaled variables
$\tilde{f} \;:\!=\; \tilde{f}_+= \tilde{f}_- = 39\, \frac{\text{vesicles}}{\mu \text{m}}$
so that their sum corresponds to a half-filled neurite. Thus, for the scaled variables $\bar{f}_+, \,\bar{f}_-$
, their sum being
$\bar{f}_+, \,\bar{f}_-$
, their sum being $\bar{\rho }= \bar{f}_+ + \bar{f}_- = 2$
corresponds to a completely filled neuron. This implies that the term
$\bar{\rho }= \bar{f}_+ + \bar{f}_- = 2$
corresponds to a completely filled neuron. This implies that the term $1- \rho$
has to be replaced by
$1- \rho$
has to be replaced by $1-\frac{\bar{\rho }}{2}$
.
$1-\frac{\bar{\rho }}{2}$
.
Vesicles and growth
We again consider the neurite as a cylinder with a diameter of $1\,\mu \textrm{m}$
. Thus, the surface area of a segment of length
$1\,\mu \textrm{m}$
. Thus, the surface area of a segment of length $1\,\mu \textrm{m}$
is
$1\,\mu \textrm{m}$
is $ A_{\text{surf}} = 2\pi \frac{1\,\mu \textrm{m}}{2}1\,\mu \textrm{m} \approx 3.14\, (\mu \textrm{m})^2.$
We consider vesicles of
$ A_{\text{surf}} = 2\pi \frac{1\,\mu \textrm{m}}{2}1\,\mu \textrm{m} \approx 3.14\, (\mu \textrm{m})^2.$
We consider vesicles of $130$
nm diameter, which thus possess a surface area of
$130$
nm diameter, which thus possess a surface area of $0.053$ $(\mu \textrm{m})^2$
. Thus, the number of vesicles needed for an extension of
$(\mu \textrm{m})^2$
. Thus, the number of vesicles needed for an extension of $1\,\mu \textrm{m}$
is
$1\,\mu \textrm{m}$
is
 \begin{equation*} \frac {3.14\, \mu \textrm {m}^2}{0.053\,\mu \textrm {m}^2} \approx 59,\quad \text { i.e., we fix } c_1 = c_2 = c_h \;:\!=\; \frac {58.4 \text { vesicles}}{\mu \textrm {m}}. \end{equation*}
Maximal capacities and minimal values
Finally, we fix the maximal amount of vesicles in the pools and soma to $\Lambda _{\text{som,max}} = 6000\,\text{vesicles}$
and
$\Lambda _{\text{som,max}} = 6000\,\text{vesicles}$
and $\Lambda _{j,\text{max}}= 400\,\text{vesicles}$
and choose the typical values
$\Lambda _{j,\text{max}}= 400\,\text{vesicles}$
and choose the typical values $\tilde{\Lambda }_{\text{som}}$
and
$\tilde{\Lambda }_{\text{som}}$
and $\tilde{\Lambda }_{\text{cone}}$
as half of the maximum, respectively. It remains to fix the minimal length of each neurite as well as the number of vesicles in the growth cone which defines the switching point between growth and shrinkage. We choose a minimal length of
$\tilde{\Lambda }_{\text{cone}}$
as half of the maximum, respectively. It remains to fix the minimal length of each neurite as well as the number of vesicles in the growth cone which defines the switching point between growth and shrinkage. We choose a minimal length of $5\,\mu \textrm{m}$
, while the sign of
$5\,\mu \textrm{m}$
, while the sign of $h_j$
changes when the number of vesicles in the growth cone reaches a value of
$h_j$
changes when the number of vesicles in the growth cone reaches a value of $100\,\text{vesicles}$
. This yields the dimensionless quantities
$100\,\text{vesicles}$
. This yields the dimensionless quantities $ \bar{\Lambda }_{\text{growth}} = 1, \; \bar{L}_{\text{min}} = 0.1.$
Applying the scaling, model (2.1)–(2.5) transforms to
$ \bar{\Lambda }_{\text{growth}} = 1, \; \bar{L}_{\text{min}} = 0.1.$
Applying the scaling, model (2.1)–(2.5) transforms to
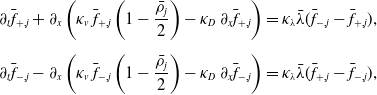 \begin{align*} \begin{aligned} \partial _t \bar{f}_{+,j}& +\partial _x \left (\kappa _v\,\bar{f}_{+,j}\left (1- \frac{\bar{\rho }_j}{2}\right )- \kappa _D\,\partial _x \bar{f}_{+,j}\right ) = \kappa _\lambda \bar{\lambda } (\bar{f}_{-,j} - \bar{f}_{+,j}), \\[5pt] \partial _t \bar{f}_{-,j}& - \partial _x\left (\kappa _v\,\bar{f}_{-,j}\left (1- \frac{\bar{\rho }_j}{2}\right )- \kappa _D\,\partial _x \bar{f}_{-,j}\right ) = \kappa _\lambda \bar{\lambda }(\bar{f}_{+,j} - \bar{f}_{-,j}), \end{aligned} \end{align*} $\text{in } (0, T) \times (0, \bar{L}_j(t))$
, with dimensionless parameters
$\text{in } (0, T) \times (0, \bar{L}_j(t))$
, with dimensionless parameters $ \kappa _v = \frac{v_0 \tilde{t} }{\tilde{L}}, \; \kappa _D = D_T\frac{\tilde{t} }{\tilde{L}^2}, \; \kappa _\lambda = \tilde{t} \tilde{\lambda },$
and with boundary conditions (keeping the choices (4.5), (4.8), (4.9)):
$ \kappa _v = \frac{v_0 \tilde{t} }{\tilde{L}}, \; \kappa _D = D_T\frac{\tilde{t} }{\tilde{L}^2}, \; \kappa _\lambda = \tilde{t} \tilde{\lambda },$
and with boundary conditions (keeping the choices (4.5), (4.8), (4.9)):
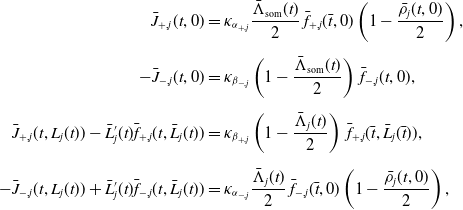 \begin{equation*} \begin {aligned} \bar {J}_{+,j}(t,0) &= \kappa _{\alpha _{+,j}}\frac {\bar {\Lambda }_{\text {som}}(t)}{2}\,\bar {f}_{+,j}(\bar {t},0)\left (1-\frac {\bar {\rho }_j(t,0)}{2}\right ), \\[5pt] -\bar {J}_{-,j}(t,0) &= \kappa _{\beta _{-,j}}\left (1-\frac {\bar {\Lambda }_{\text {som}}(t)}{2}\right )\,\bar {f}_{-,j}(t,0),\\[5pt] \bar {J}_{+,j}(t, L_j(t)) - \bar {L}'_j(t) \bar {f}_{+,j}(t, \bar {L}_j(t)) &= \kappa _{\beta _{+,j}}\left (1-\frac {\bar {\Lambda }_{j}(t)}{2}\right )\,\bar {f}_{+,j}(\bar {t}, \bar {L}_j(\bar {t})), \\[5pt] -\bar {J}_{-,j}(t, L_j(t)) + \bar {L}'_j(t) \bar {f}_{-,j}(t, \bar {L}_j(t))&= \kappa _{\alpha _{-,j}}\frac {\bar {\Lambda }_j(t)}{2}\,\bar {f}_{-,j}(\bar {t},0)\left (1-\frac {\bar {\rho }_j(t,0)}{2}\right ), \end {aligned} \end{equation*}
with $\kappa _{\alpha _{+,j}} = \frac{\tilde{t}}{\tilde{L}} c_{\alpha _{+,j}}, \kappa _{\alpha _{-,j}} = \frac{\tilde{t}}{\tilde{L}} c_{\alpha _{-,j}}, \kappa _{\beta _{+,j}} = \frac{\tilde{t}}{\tilde{L}} c_{\beta _{+,j}}, \kappa _{\beta _{-,j}} = \frac{\tilde{t}}{\tilde{L}} c_{\beta _{-,j}}$
. It remains to fix the values of the constants appearing in the functions
$\kappa _{\alpha _{+,j}} = \frac{\tilde{t}}{\tilde{L}} c_{\alpha _{+,j}}, \kappa _{\alpha _{-,j}} = \frac{\tilde{t}}{\tilde{L}} c_{\alpha _{-,j}}, \kappa _{\beta _{+,j}} = \frac{\tilde{t}}{\tilde{L}} c_{\beta _{+,j}}, \kappa _{\beta _{-,j}} = \frac{\tilde{t}}{\tilde{L}} c_{\beta _{-,j}}$
. It remains to fix the values of the constants appearing in the functions $\alpha _{\pm, j},\,\beta _{\pm, j}$
. As they correspond to velocities, we fix them to the typical in-/outflux velocity:
$\alpha _{\pm, j},\,\beta _{\pm, j}$
. As they correspond to velocities, we fix them to the typical in-/outflux velocity:
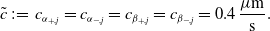 \begin{equation*} \tilde {c} \;:\!=\; c_{\alpha _{+,j}} = c_{\alpha _{-,j}} = c_{\beta _{+,j}}= c_{\beta _{-,j}} = 0.4 \,\frac {\mu \text {m}}{\text {s}}. \end{equation*}
For the soma and the growth cones, we choose half of the maximal amount of vesicles as typical values, that is, $\tilde{\Lambda }_{\text{som}} = 3000\,\text{vesicles}$
,
$\tilde{\Lambda }_{\text{som}} = 3000\,\text{vesicles}$
, $\tilde{\Lambda }_{j} = 200\,\text{vesicles}$
,
$\tilde{\Lambda }_{j} = 200\,\text{vesicles}$
, $j=1,2$
. We obtain
$j=1,2$
. We obtain
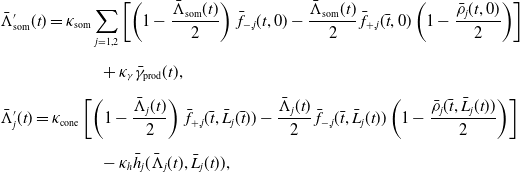 \begin{equation*} \begin {aligned} & \bar {\Lambda }'_{\text {som}}(t)= \kappa _{\text {som}}\sum _{j=1,2} \left [\left (1-\frac {\bar {\Lambda }_{\text {som}}(t)}{2}\right )\,\bar {f}_{-,j}(t,0) - \frac {\bar {\Lambda }_{\text {som}}(t)}{2}\,\bar {f}_{+,j}(\bar {t},0)\left (1-\frac {\bar {\rho }_j(t,0)}{2}\right ) \right ] \\[5pt] & \qquad \qquad \qquad + \kappa _\gamma \bar {\gamma }_{\text {prod}}(t), \\[5pt] &\bar {\Lambda }'_{j}(t) = \kappa _{\text {cone}}\left [\left (1-\frac {\bar {\Lambda }_{j}(t)}{2}\right )\,\bar {f}_{+,j}(\bar {t}, \bar {L}_j(\bar {t}))- \frac {\bar {\Lambda }_j(t)}{2}\,\bar {f}_{-,j}(\bar {t}, \bar {L}_j(t))\left (1-\frac {\bar {\rho }_j(\bar {t}, \bar {L}_j(t))}{2}\right )\right ] \\[5pt] & \qquad \qquad \qquad -\kappa _{h} \bar {h}_j(\bar {\Lambda }_j(t), \bar {L}_j(t)), \end {aligned} \end{equation*}
with $ \kappa _{\text{som}} = \frac{\tilde{t}}{\tilde{\Lambda }_{\text{som}}}\tilde{c} \tilde{f}, \kappa _\gamma = \tilde{\gamma } \frac{\tilde{t}}{\tilde{\Lambda }_{\text{som}}}, \kappa _{\text{cone}} = \frac{\tilde{t}}{\tilde{\Lambda }_{\text{cone}}}\tilde{c} \tilde{f}, \kappa _{h} = \frac{\tilde{t}}{\tilde{\Lambda }_{\text{cone}}} \tilde{h} \chi .$
Finally, for the scaled production function
$ \kappa _{\text{som}} = \frac{\tilde{t}}{\tilde{\Lambda }_{\text{som}}}\tilde{c} \tilde{f}, \kappa _\gamma = \tilde{\gamma } \frac{\tilde{t}}{\tilde{\Lambda }_{\text{som}}}, \kappa _{\text{cone}} = \frac{\tilde{t}}{\tilde{\Lambda }_{\text{cone}}}\tilde{c} \tilde{f}, \kappa _{h} = \frac{\tilde{t}}{\tilde{\Lambda }_{\text{cone}}} \tilde{h} \chi .$
Finally, for the scaled production function $\bar{h}$
in (2.4), we make the choice
$\bar{h}$
in (2.4), we make the choice $\bar{h}_j(\bar{\Lambda }, \bar{L}) = \operatorname{atan}(\bar{\Lambda } - \bar{\Lambda }_{\text{growth}})H(\bar{L} - \bar{L}_{\text{min}})$
,
$\bar{h}_j(\bar{\Lambda }, \bar{L}) = \operatorname{atan}(\bar{\Lambda } - \bar{\Lambda }_{\text{growth}})H(\bar{L} - \bar{L}_{\text{min}})$
, $j=1,2$
, where
$j=1,2$
, where $H$
is a smoothed Heaviside function. We have
$H$
is a smoothed Heaviside function. We have
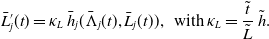 \begin{align*} \bar{L}_j'(t) = \kappa _{L}\, \bar{h}_j(\bar{\Lambda }_j(t), \bar{L}_j(t)), \; \text{ with } \kappa _L = \frac{\tilde{t}}{\tilde{L}}\,\tilde{h}. \end{align*}
The vesicle densities $f_{\pm, j}$
,
$f_{\pm, j}$
, $j=1,2$
, and pool capacities
$j=1,2$
, and pool capacities $\Lambda _k$
,
$\Lambda _k$
, $k\in \{\text{som},1,2\}$
, for the example from Section 6.1 plotted at different time points.
$k\in \{\text{som},1,2\}$
, for the example from Section 6.1 plotted at different time points.
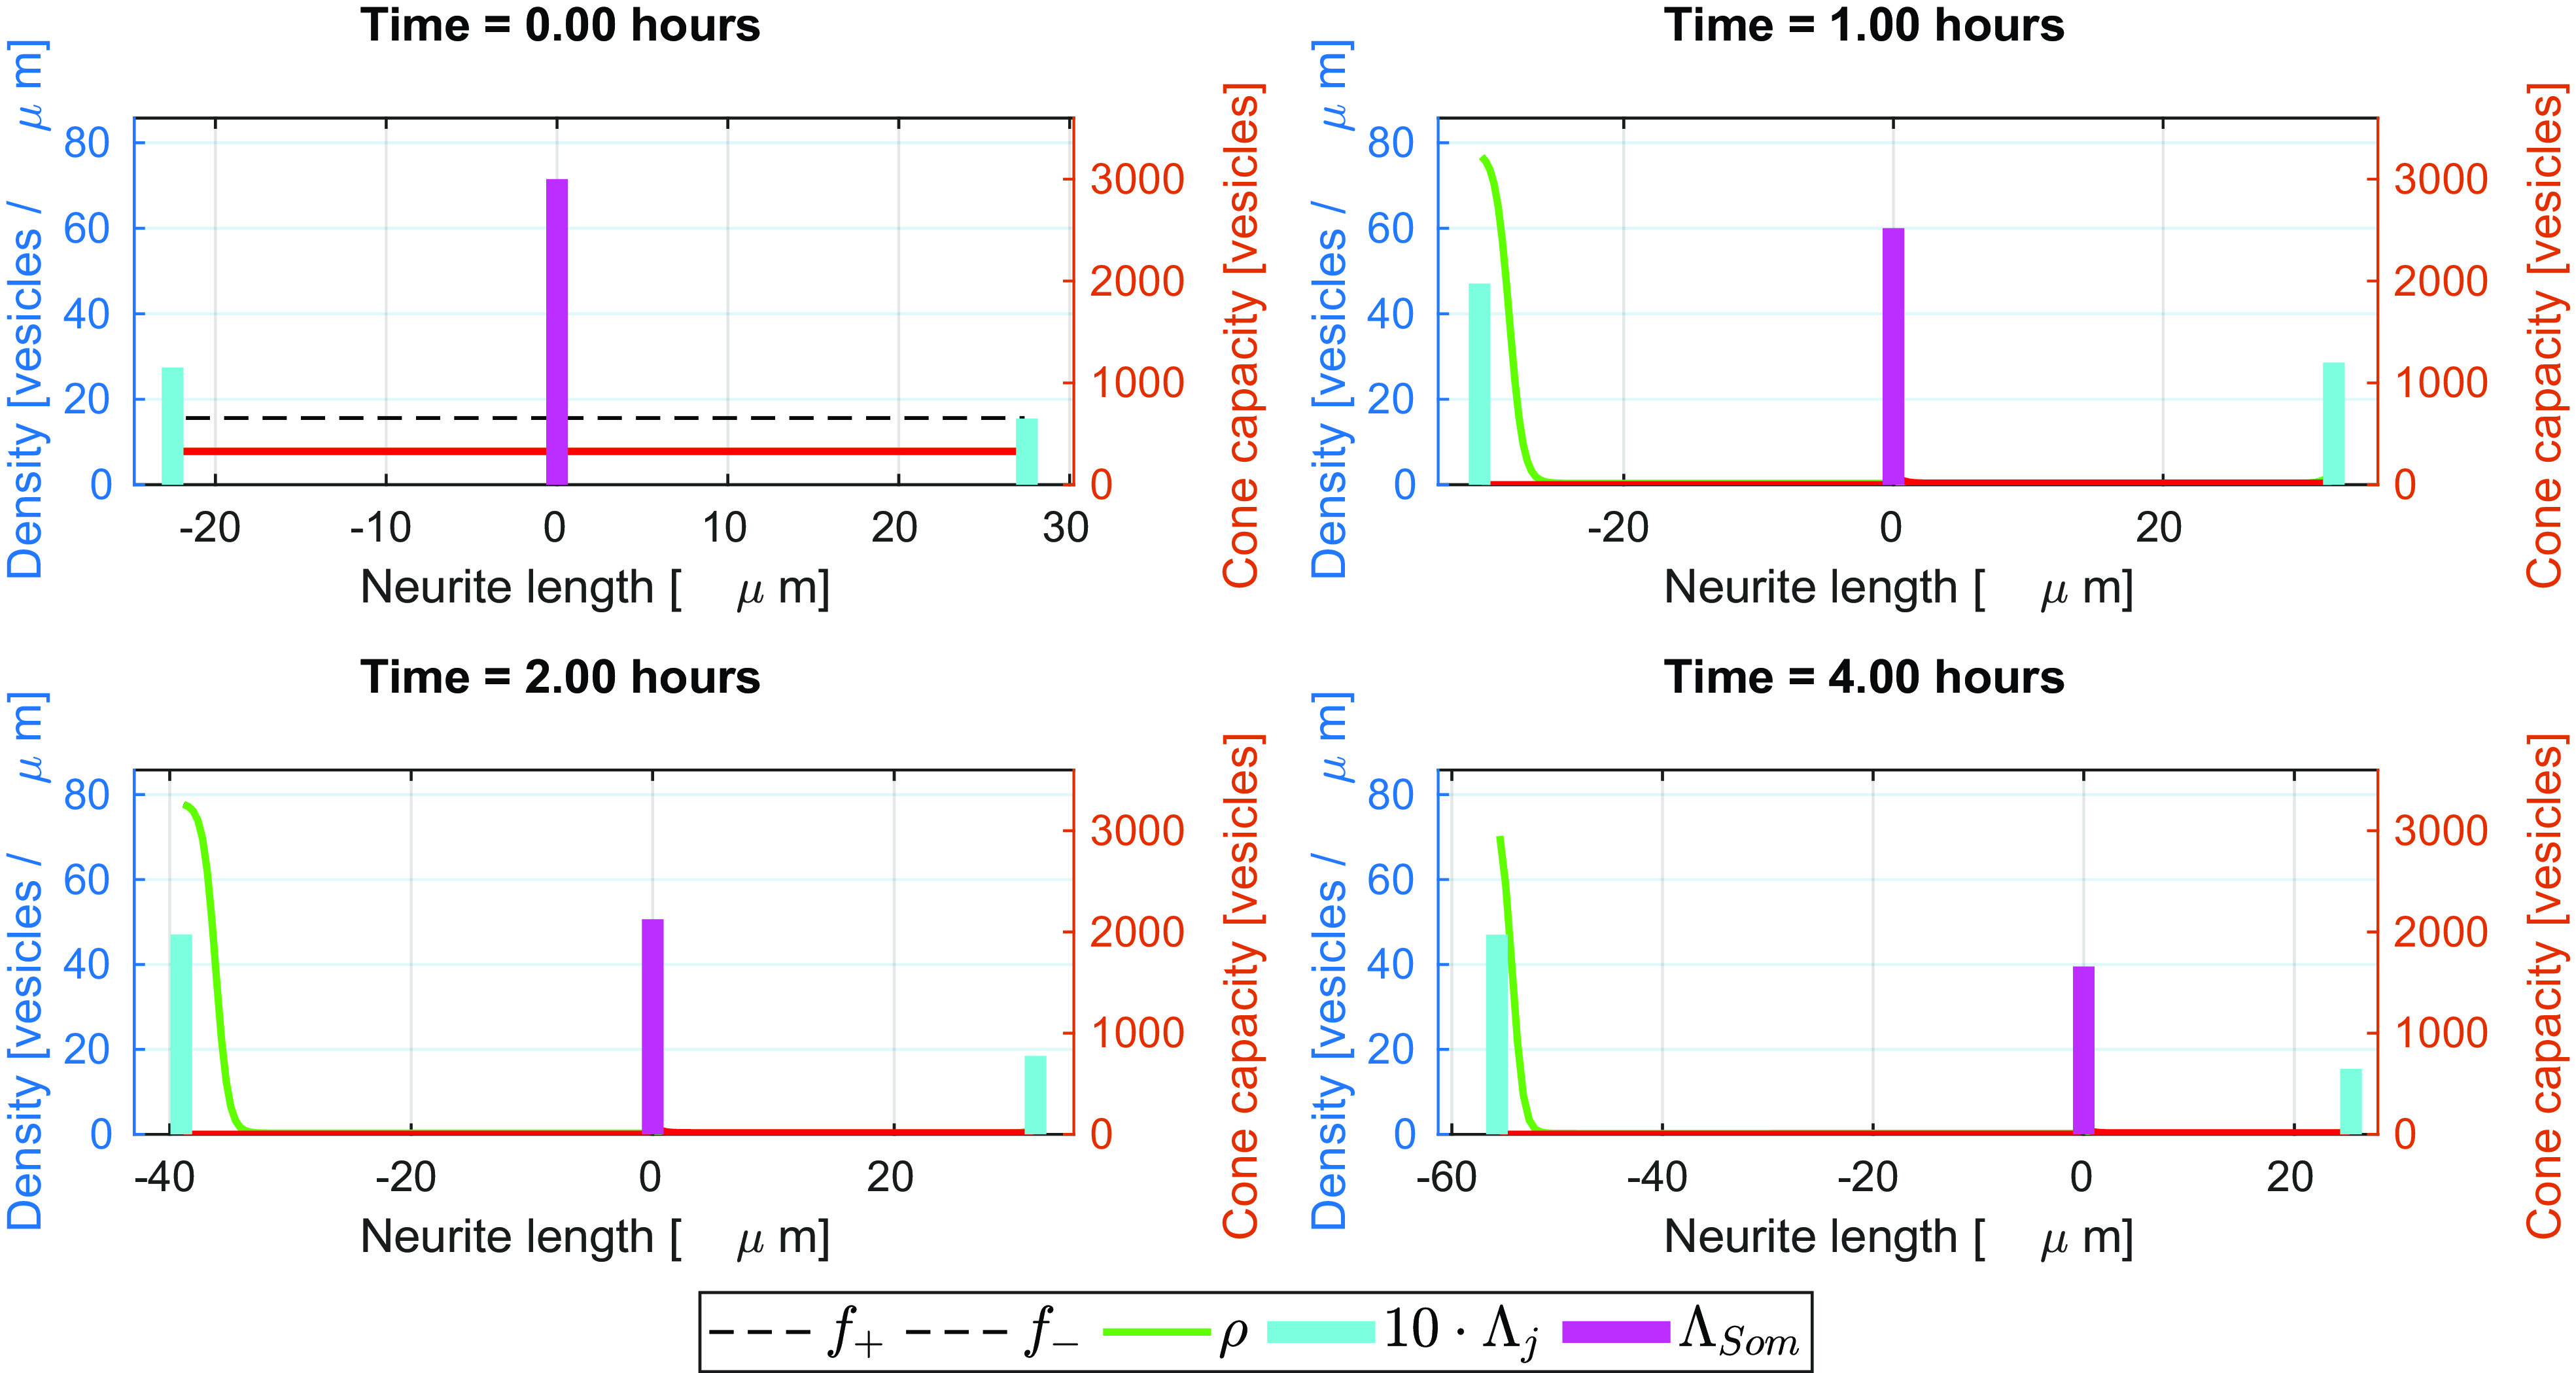
The neurite lengths $L_j$
,
$L_j$
, $j=1,2$
, and pool capacities
$j=1,2$
, and pool capacities $\Lambda _k$
,
$\Lambda _k$
, $k\in \{\text{som},1,2\}$
, for the example from Section 6.1 plotted over time.
$k\in \{\text{som},1,2\}$
, for the example from Section 6.1 plotted over time.
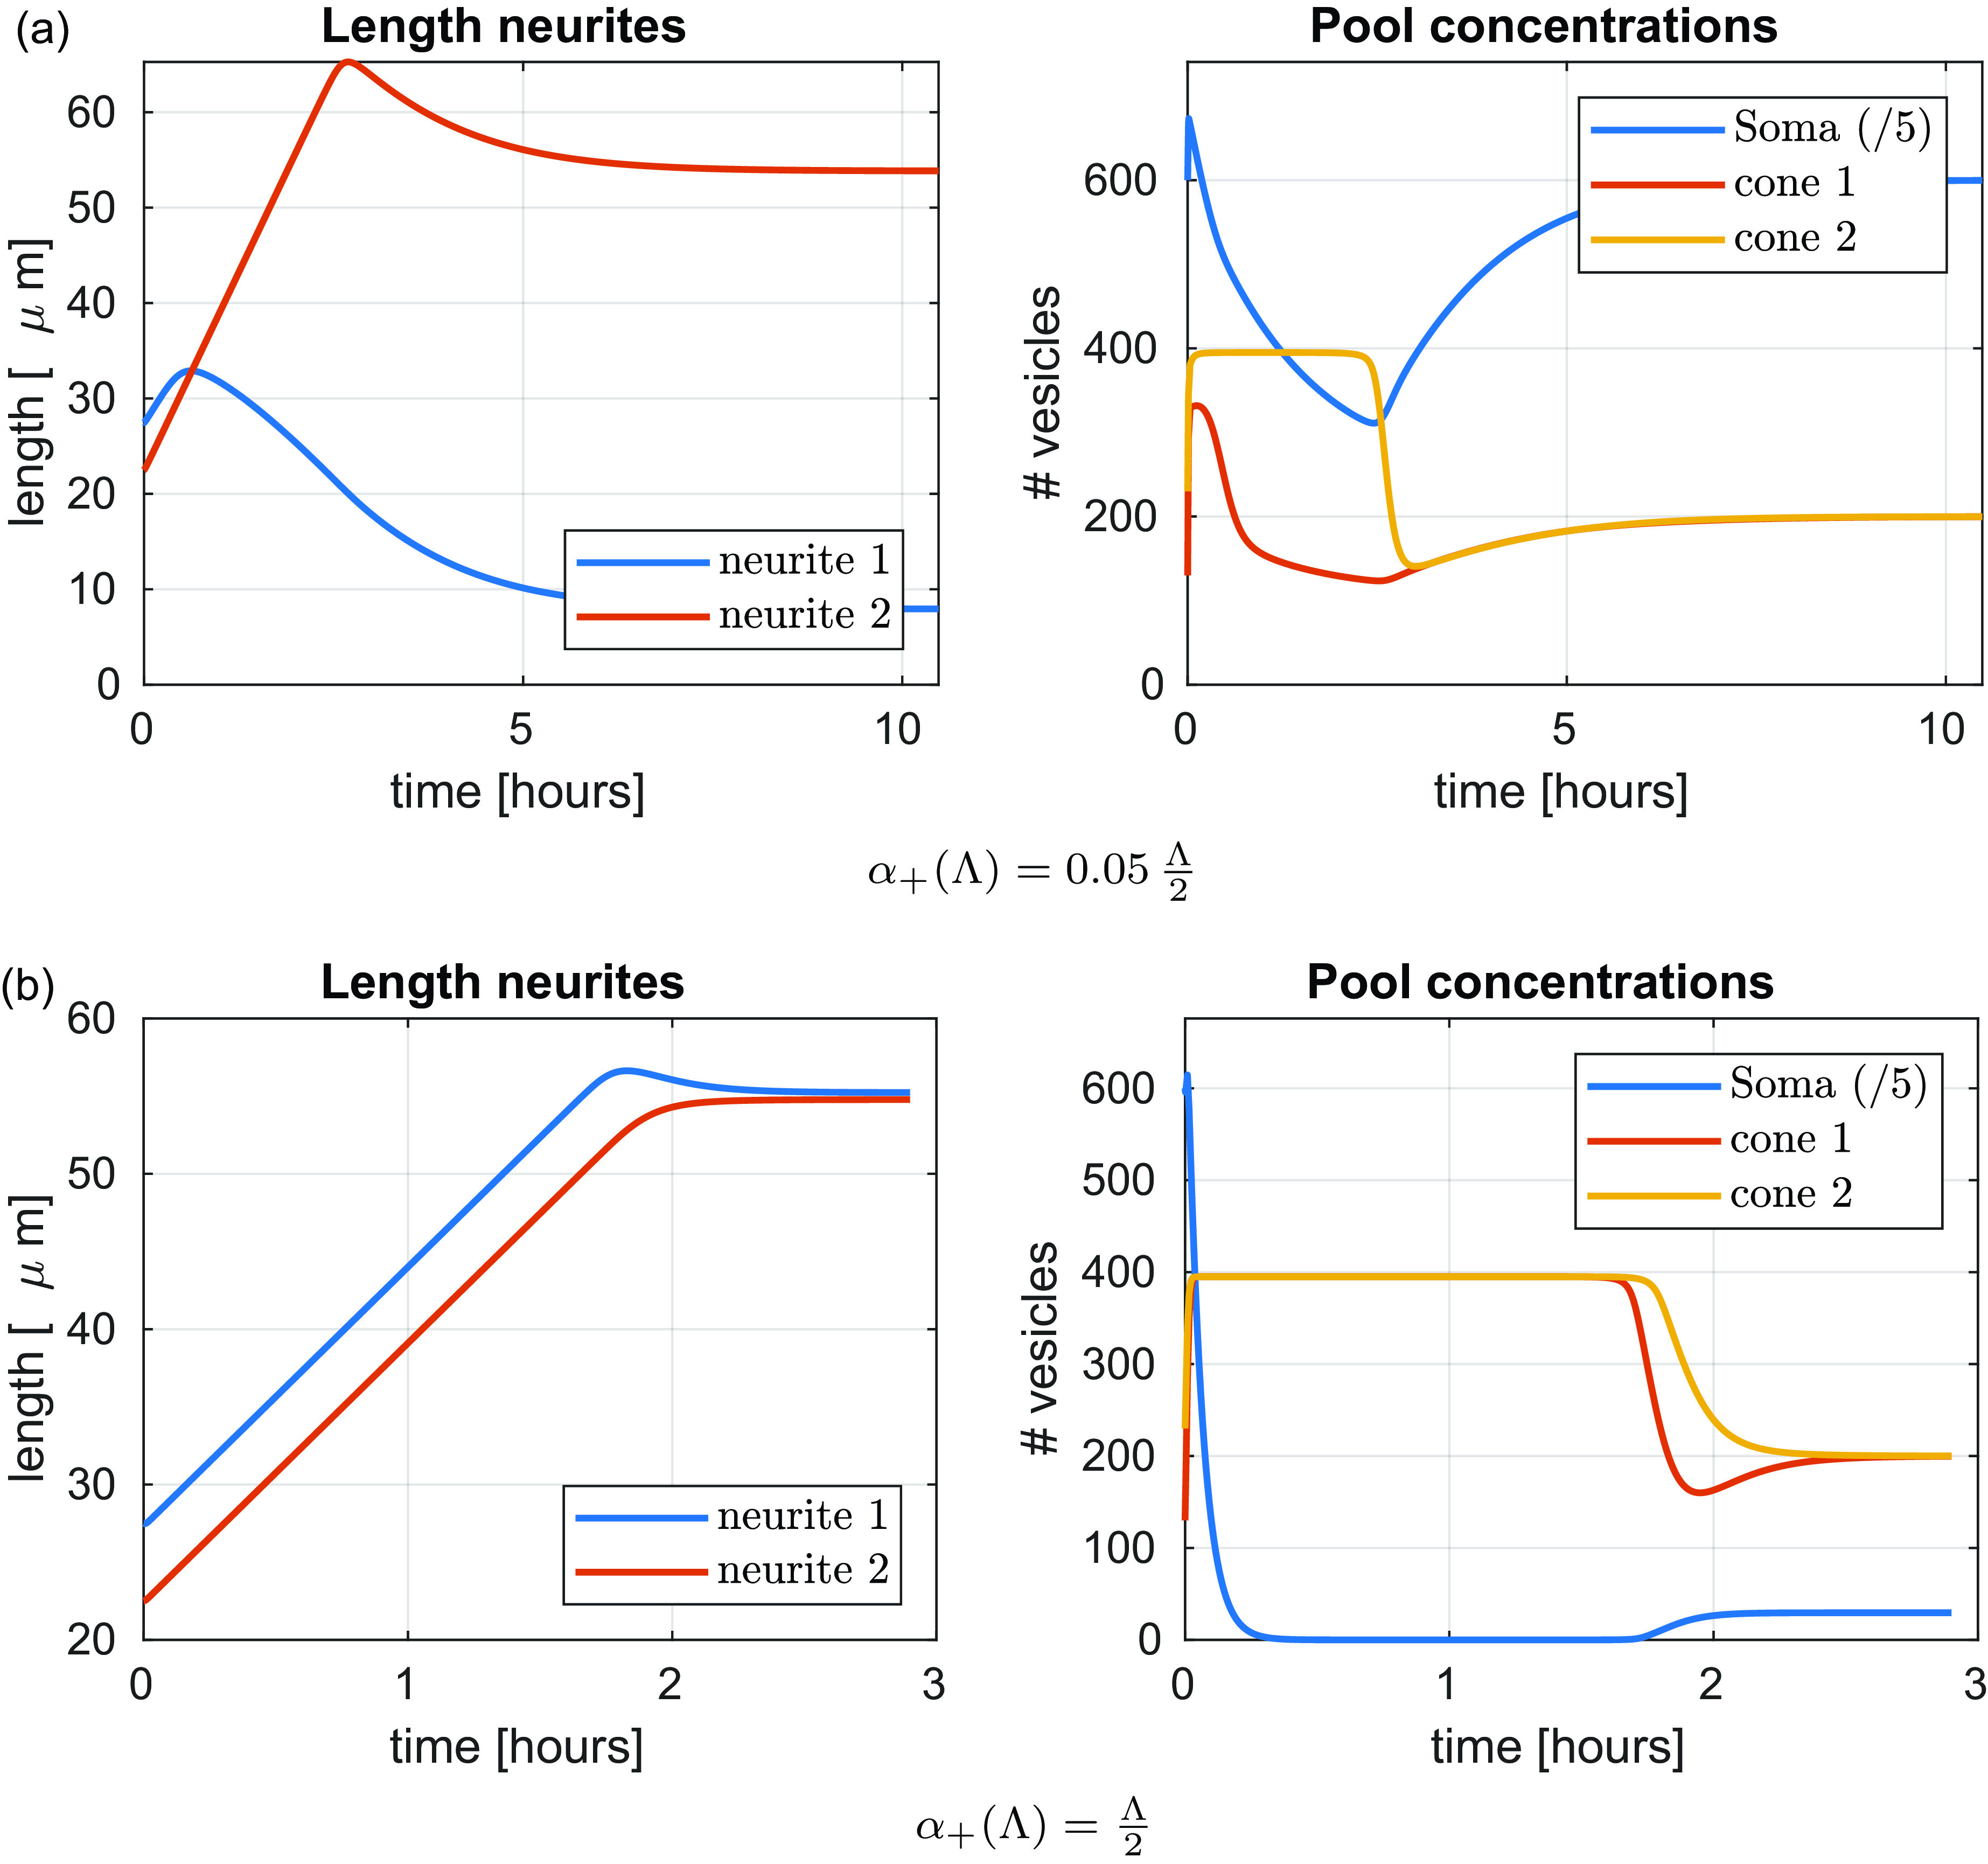
The vesicle densities $f_{\pm, j}$
,
$f_{\pm, j}$
, $j=1,2$
, and pool capacities
$j=1,2$
, and pool capacities $\Lambda _k$
,
$\Lambda _k$
, $k\in \{\text{som},1,2\}$
, for the example from Section 6.2 plotted at different time points.
$k\in \{\text{som},1,2\}$
, for the example from Section 6.2 plotted at different time points.
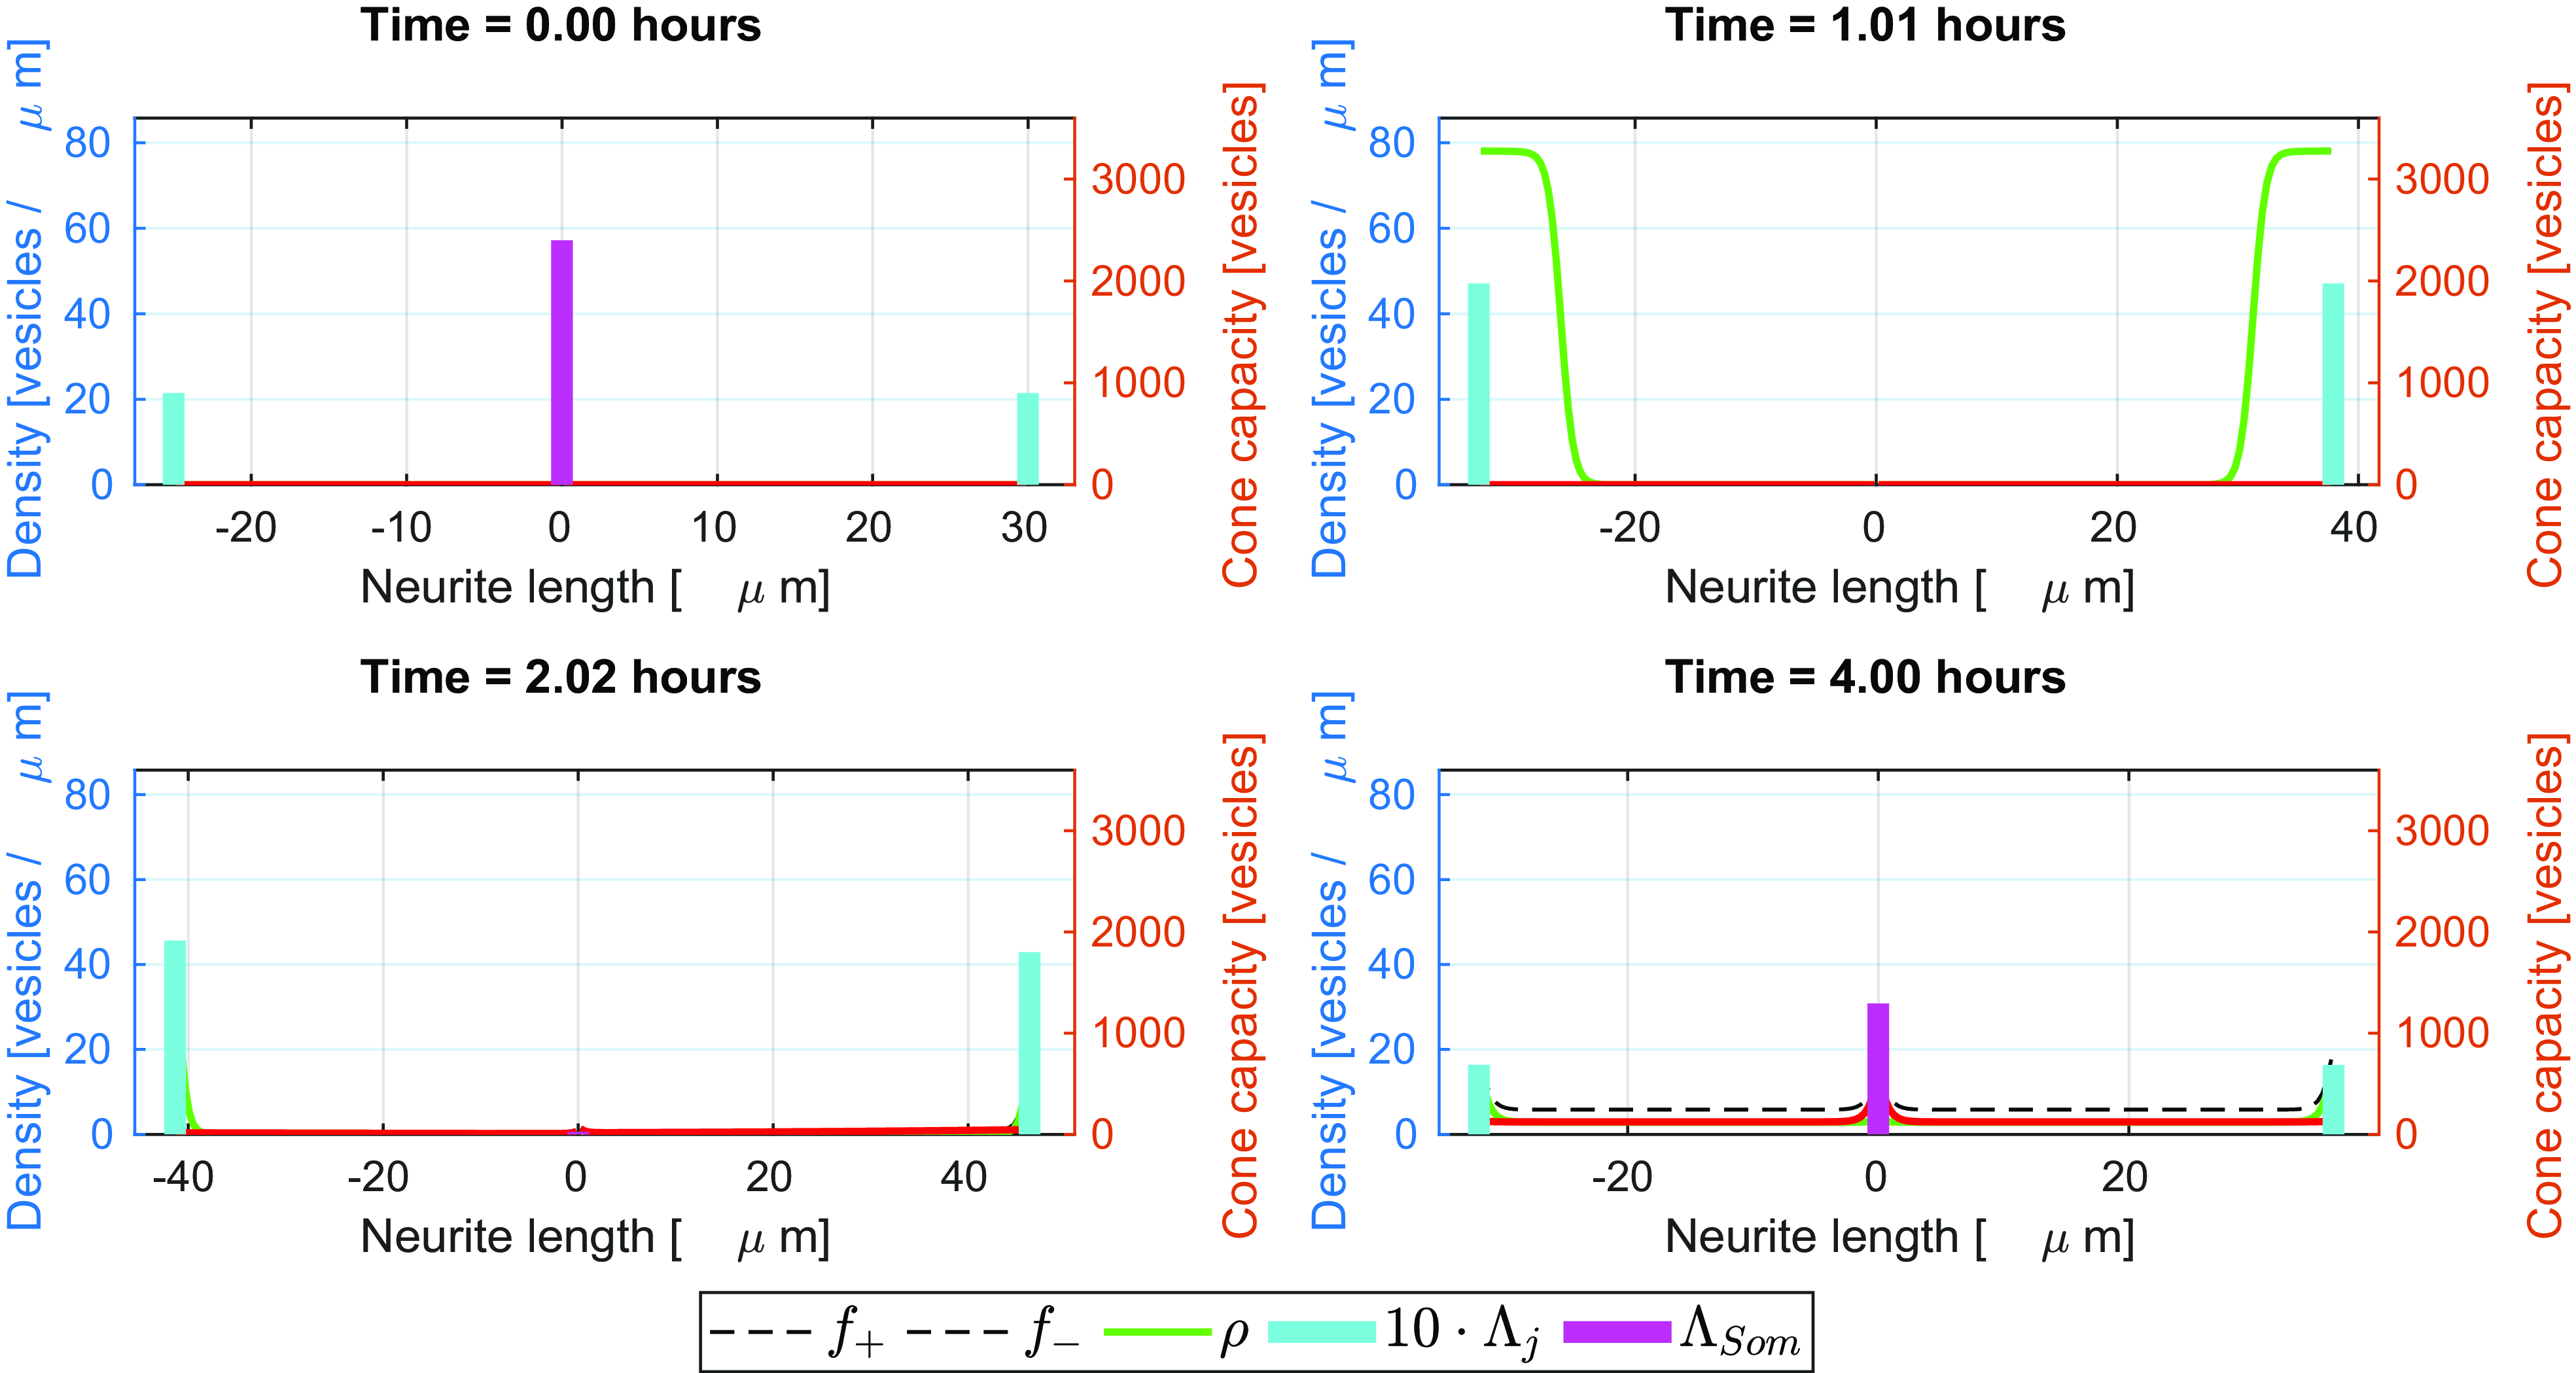
The neurite lengths $L_j$
,
$L_j$
, $j=1,2$
, and pool capacities
$j=1,2$
, and pool capacities $\Lambda _k$
,
$\Lambda _k$
, $k\in \{\text{soma},1,2\}$
, for the example from Section 6.2 plotted over time.
$k\in \{\text{soma},1,2\}$
, for the example from Section 6.2 plotted over time.
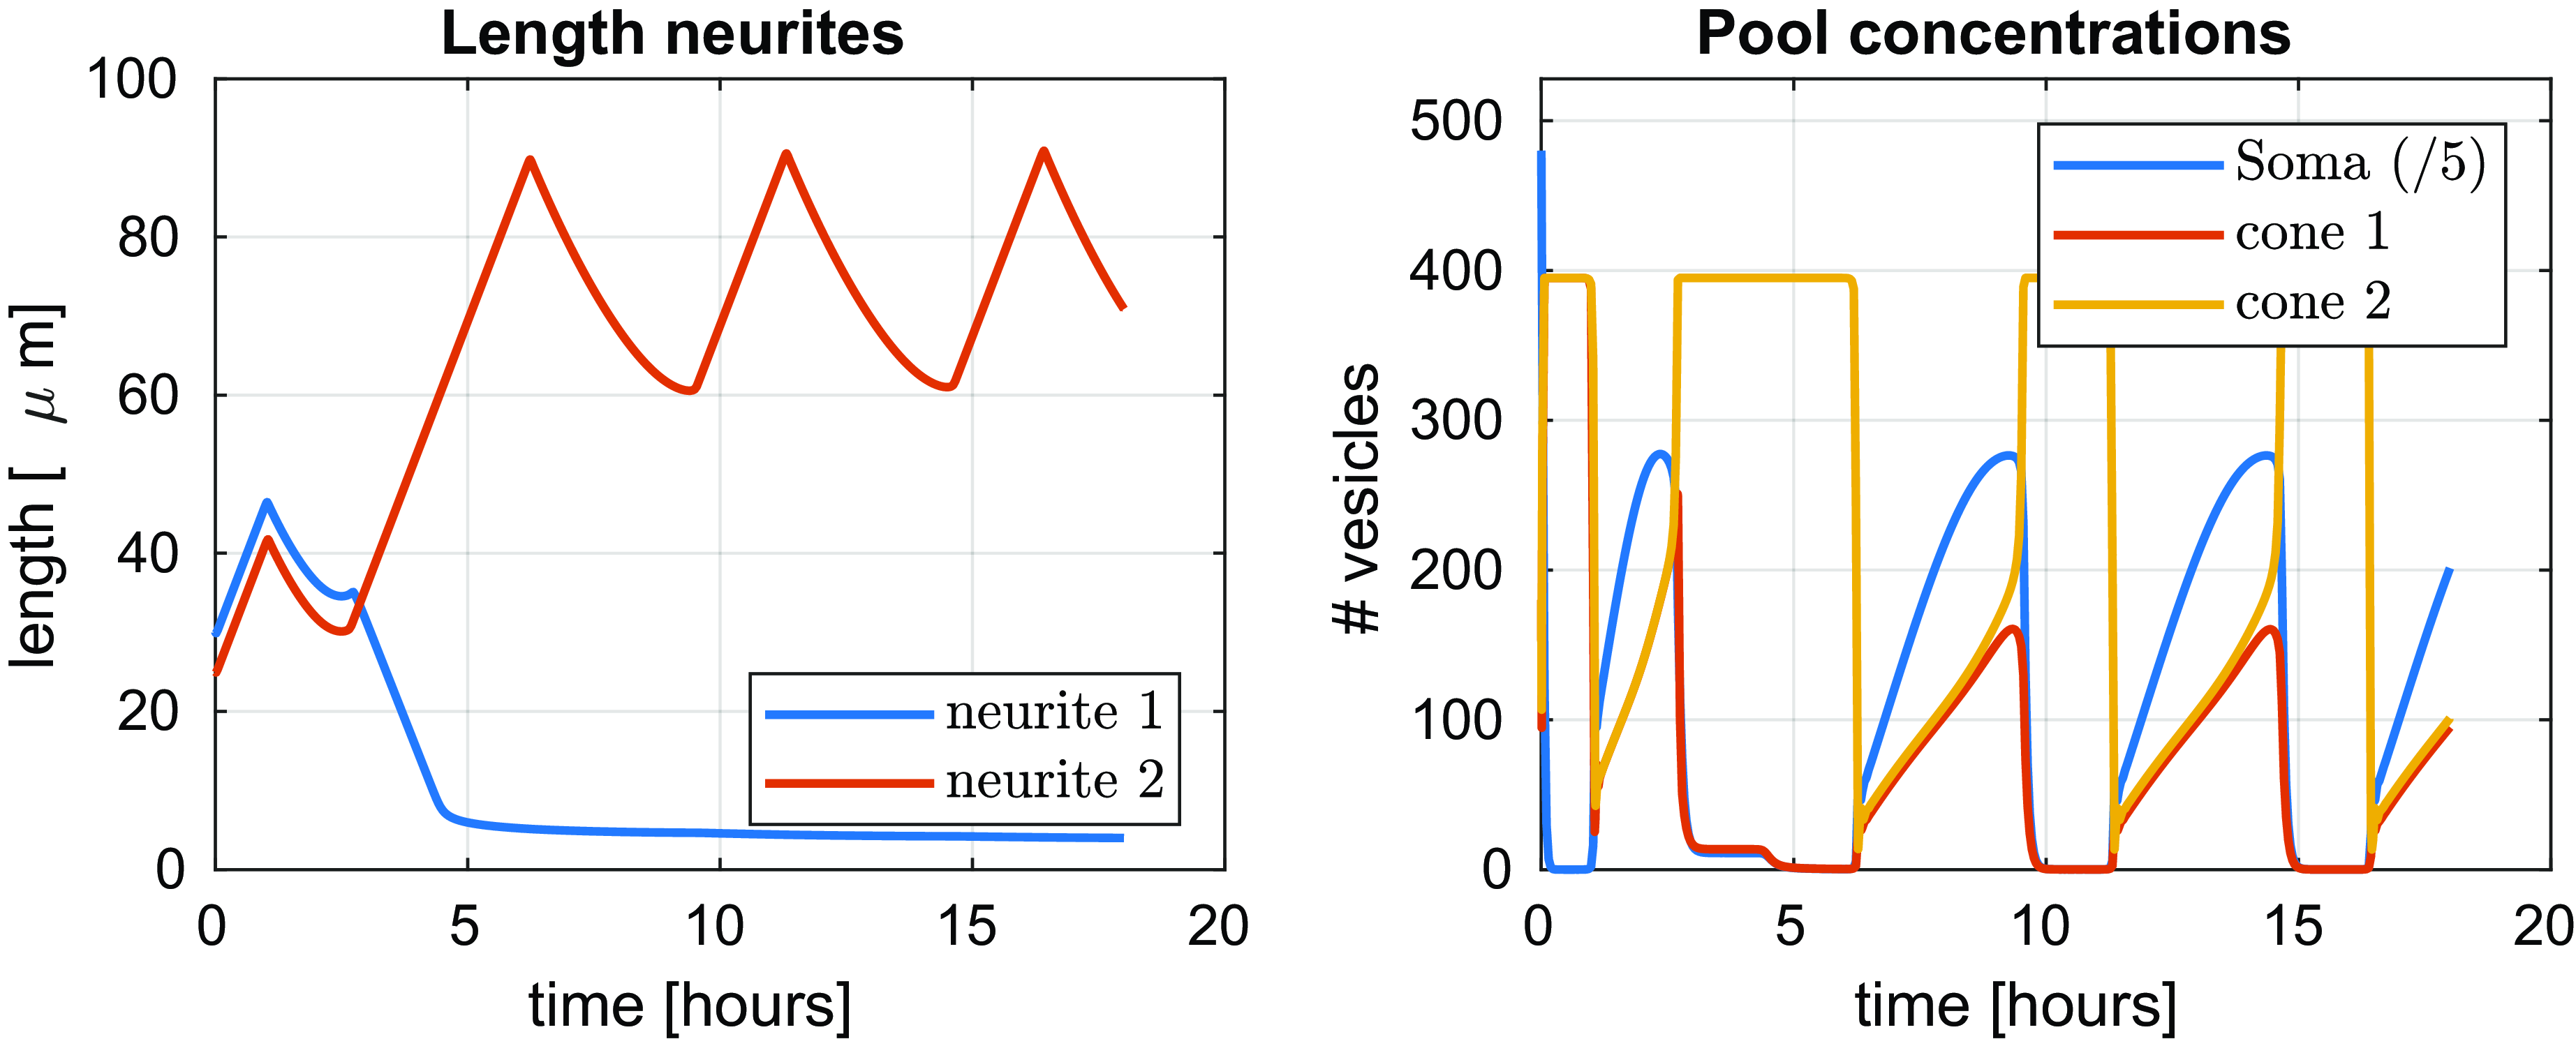
6. Numerical studies
We present two examples that demonstrate the capability of our model to reproduce observations in biological systems. Both start with an initial length difference of the two neurites. The first example shows that the shorter neurite can become the longer one due to a local advantage of the number of vesicles present in the growth cone, while the second showcases oscillatory behaviour in neurite lengths that is observed experimentally. Both simulations are performed in Matlab, using the finite volume scheme introduced in Section 5.1, using the parameters $\eta = 10$
,
$\eta = 10$
, $n_e = 100$
and
$n_e = 100$
and $\tau = 1\mathrm{e}{-4}$
. We chose
$\tau = 1\mathrm{e}{-4}$
. We chose $T = 9$
(corresponding to
$T = 9$
(corresponding to $18$
hours) as a maximal time of the simulation, yet when a stationary state is reached before (measured by the criterium
$18$
hours) as a maximal time of the simulation, yet when a stationary state is reached before (measured by the criterium $\|f_{\pm, j}^{(n+1)} - f_{\pm, j}^{(n)}\|_2 \le 1\mathrm{e}{-9}$
), the simulation is terminated. We also set
$\|f_{\pm, j}^{(n+1)} - f_{\pm, j}^{(n)}\|_2 \le 1\mathrm{e}{-9}$
), the simulation is terminated. We also set $\lambda = 0$
in all simulations.
$\lambda = 0$
in all simulations.
6.1. Fast growth by local effects
The first example shows that an initial length deficiency of a neurite can be overcome by a local advantage of vesicles on the growth cone. In this set-up, we fixed (all scaled quantities) the following initial data: $L_1^0 = 1.1$
,
$L_1^0 = 1.1$
, $L_2^0 = 0.9$
,
$L_2^0 = 0.9$
, $\Lambda _{\text{soma}}^0 = 1$
,
$\Lambda _{\text{soma}}^0 = 1$
, $\Lambda _1^0= 0.65$
,
$\Lambda _1^0= 0.65$
, $\Lambda _2^0= 1.15$
,
$\Lambda _2^0= 1.15$
, $\boldsymbol{f}_1^0 = \boldsymbol{f}_2^0 = (0.2,0.2)$
. Furthermore, the functions
$\boldsymbol{f}_1^0 = \boldsymbol{f}_2^0 = (0.2,0.2)$
. Furthermore, the functions
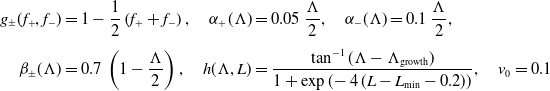 \begin{align*} g_\pm (f_{+},f_{-}) &= 1-\frac 12\left (f_{+}+f_{-}\right ),\quad \alpha _+(\Lambda ) = 0.05 \,\frac{\Lambda }2,\quad \alpha _-(\Lambda ) = 0.1\, \frac{\Lambda }2,\\[5pt] \beta _{\pm }(\Lambda ) &= 0.7 \, \left (1-\frac{\Lambda }2\right ),\quad h(\Lambda, L) = \frac{\tan ^{-1}(\Lambda - \Lambda _{\textrm{growth}})}{1+\exp (\!-4\,(L - L_{\textrm{min}}-0.2))},\quad v_0=0.1 \end{align*}
were chosen in this example. The choices of $\alpha _+$
and
$\alpha _+$
and $\alpha _-$
are motivated as follows: both are proportional to
$\alpha _-$
are motivated as follows: both are proportional to $\Lambda / 2$
as the typical values within the soma and growth cones, respectively, are chosen to be half the maximum which means that
$\Lambda / 2$
as the typical values within the soma and growth cones, respectively, are chosen to be half the maximum which means that $\Lambda / 2 = 1$
if this value is reached. Thus, relative to their capacity, the outflow rates from soma and growth cone behave similarly. Now, since we are interested in the effect of vesicle concentration in the respective growth cones, we chose a small constant in
$\Lambda / 2 = 1$
if this value is reached. Thus, relative to their capacity, the outflow rates from soma and growth cone behave similarly. Now, since we are interested in the effect of vesicle concentration in the respective growth cones, we chose a small constant in $\alpha _+$
in order to limit the influence of new vesicles entering from the soma, relative to
$\alpha _+$
in order to limit the influence of new vesicles entering from the soma, relative to $\alpha _-$
. This is a purely heuristic choice to examine if such a local effect can be observed in our model at all. Figure 3 shows snapshots of the simulation at different times, while Figure 4a shows the evolution of neurite lengths and vesicle concentrations over time. The results demonstrate that the local advantage of a higher vesicle concentration in the growth cone of the shorter neurite is sufficient to outgrow the competing neurite. Yet, this requires a weak coupling in the sense that the outflow rate at the soma is small, see the constant
$\alpha _-$
. This is a purely heuristic choice to examine if such a local effect can be observed in our model at all. Figure 3 shows snapshots of the simulation at different times, while Figure 4a shows the evolution of neurite lengths and vesicle concentrations over time. The results demonstrate that the local advantage of a higher vesicle concentration in the growth cone of the shorter neurite is sufficient to outgrow the competing neurite. Yet, this requires a weak coupling in the sense that the outflow rate at the soma is small, see the constant $0.05$
in
$0.05$
in $\alpha _+$
. Increasing this value, the local effect does not prevail and indeed, the longer neurite will always stay longer while both neurites grow at a similar rate as shown in Figure 4b. Thus, we consider this result as biologically not very realistic, in particular as it cannot reproduce cycles of extension and retraction that are observed in experiments.
$\alpha _+$
. Increasing this value, the local effect does not prevail and indeed, the longer neurite will always stay longer while both neurites grow at a similar rate as shown in Figure 4b. Thus, we consider this result as biologically not very realistic, in particular as it cannot reproduce cycles of extension and retraction that are observed in experiments.
6.2. Oscillatory behaviour due to coupling of soma outflow rates to density of retrograde vesicles
In order to overcome the purely local nature of the effect in the previous example, it seems reasonable to include effects that couple the behaviour at the growth cones to that of the soma via the concentrations of vesicles in the neurites. We propose the following two mechanisms: first, we assume that a strongly growing neurite is less likely to emit a large number of retrograde vesicles as it wants to use all vesicles for the growth process. In addition, we assume that the soma aims to reinforce strong growth and is doing so by measuring the density of arriving retrograde vesicles. The lower it becomes, the more anterograde vesicles are released. Such behaviour can easily be incorporated in our model by choosing
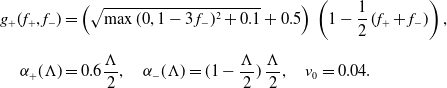 \begin{align*} g_+(f_+, f_-) &= \left (\sqrt{\max (0,1-3\,f_-)^2 + 0.1}+0.5\right )\,\left (1-\frac 12\,(f_++f_-)\right ),\\[5pt] \alpha _+(\Lambda ) &= 0.6\frac{\Lambda }2,\quad \alpha _-(\Lambda )=(1-\frac \Lambda 2)\,\frac \Lambda 2,\quad v_0=0.04. \end{align*}
The remaining functions are defined as in Section 6.1. The initial data in this example are $L_1^0 = 1.1$
,
$L_1^0 = 1.1$
, $L_2^0 = 1$
,
$L_2^0 = 1$
, $\Lambda _{\textrm{som}}^0 = 1$
,
$\Lambda _{\textrm{som}}^0 = 1$
, $\Lambda _{1}^0=\Lambda _2^0 = 0.9$
and
$\Lambda _{1}^0=\Lambda _2^0 = 0.9$
and $f_{\pm, 1}^0 = f_{\pm, 2}^0 = 0$
.
$f_{\pm, 1}^0 = f_{\pm, 2}^0 = 0$
.
The results are presented in Figures 5 (snapshots) and 6 and are rather interesting: first, it is again demonstrated that the shorter neurite may outgrow the larger one. Furthermore, as a consequence of the non-local coupling mechanism, the model is able to reproduce the oscillatory cycles of retraction and growth that are sometimes observed, see for example, [Reference Cooper9, Reference Winans, Collins and Meyer35]. Also the typical oscillation period of 2–4 hours observed in [Reference Winans, Collins and Meyer35, Figure 1] can be confirmed in our computation. Finally, the model predicts one neurite being substantially longer than the other which one might interpret as axon and dendrite.
7. Conclusion & outlook
We have introduced a free boundary model for the dynamics of developing neurons based on a coupled system of partial and ordinary differential equations. We provided an existence and uniqueness result for weak solutions and also presented a finite volume scheme in order to simulate the model. Our results show that the model is able to reproduce behaviour such as retraction–elongation cycles on scales comparable to those observed in experimental measurements as shown in Section 6.2. On the other hand, the numerical results show that the density of vesicles within the neurites is, for most of the time, rather small. Thus, the effect of the non-linear transport term that we added may be questioned and indeed, rerunning the simulations with linear transport yields rather similar results. It remains to be analysed if such low vesicle densities are biologically reasonable and thus offer the opportunity to simplify the model.
A further natural question that arises at this point is what can be learned form these results. We think that while the transport mechanisms within the neurites as well as the growth and shrinkage are reasonable and fixed (up to the discussion about linear vs. non-linear transport above), most of the behaviour of the model is encoded in the coupling via the boundary conditions. These, on the other hand, allow for a large variety of choice out of which it will be difficult to decide which is the one actually implemented in a real cell. Thus, as a next step for future work, we propose to consider these couplings as unknown parameters that need to be learned using experimental data that come from experiments. We are confident that this will allow to identify possible interactions between soma and growth cones and will give new insight into the actual mechanisms at work.
Finally, we remark that as our model only focuses on the role of vesicle transport, many other effects are neglected and clearly our approach is nowhere near a complete description of the process of neurite outgrowth. To this end, we plan to extend our model further in the future, adding effects such as the role of microtubule assembly as well as chemical signals, which are neglected so far.
Acknowledgements
GM acknowledges the support of DFG via grant MA 10100/1-1 project number 496629752, JFP via grant HE 6077/16-1 (eBer-22-57443). JFP thanks the DFG for support via the Research Unit FOR 5387 POPULAR, Project No. 461909888. We thank Andreas Püschel (WWU Münster) for valuable discussions on the biological background. In addition, we are very grateful to the comments of the anonymous referees.
Competing interests
The author(s) declare none.
Appendix A
For convenience of the reader, we state [Reference Deimling10, Theorem 5.3] about invariant regions of solutions of ODEs.
Theorem A.1. Let $X$
be a real normed linear space,
$X$
be a real normed linear space, $\Omega \subset X$
an open set and
$\Omega \subset X$
an open set and $D \subset X$
a distance set with
$D \subset X$
a distance set with $D \cap \Omega \neq \emptyset$
. Let
$D \cap \Omega \neq \emptyset$
. Let $f\;:\;(0, a) \times \Omega \rightarrow X$
be such that
$f\;:\;(0, a) \times \Omega \rightarrow X$
be such that
-
(A1)
\begin{equation*} \begin {aligned} & (f(t, x)-f(t, y), x-y)_{+} \leq \omega (t,|x-y|)|x-y| \\[5pt] & \quad \text { for } x \in \Omega \backslash D, y \in \Omega \cap \partial D, t \in (0, a), \end {aligned} \end{equation*}
where
$\omega :(0, a) \times \mathbb{R}^{+} \rightarrow \mathbb{R}$
is such that
$p(t) \leq 0$
in
$(0, \tau ) \subset (0, a)$
whenever
$\rho :[0, \tau ) \rightarrow \mathbb{R}^{+}$
is continuous,
$\rho (0)=0$
and
$D^{+} \rho (t) \leq \omega (t, \rho (t))$
for every
$t \in (0, \tau )$
with
$\rho (t)\gt 0$
(where
$D^+$
denotes the one-sided derivative with respect to
$t$
). -
(A2) If
$x \in \Omega \cap \partial D$
is such that the set of outward normal vectors
$N(x)$
is non-empty andfor all
\begin{equation*}(f(t, x), \nu )_{+} \leq 0 \end{equation*}
$\nu \in N(x)$
and
$t \in (0, a)$
.


Then $D \cap \Omega$
is forward invariant with respect to
$D \cap \Omega$
is forward invariant with respect to $f$
, that is, any continuous
$f$
, that is, any continuous $x:[0, b) \rightarrow{0,L}ega$
, such that
$x:[0, b) \rightarrow{0,L}ega$
, such that $x(0) \in D$
and
$x(0) \in D$
and $x^{\prime }=f(t, x)$
in
$x^{\prime }=f(t, x)$
in $(0, b)$
, satisfies
$(0, b)$
, satisfies $x(t) \in D$
in
$x(t) \in D$
in $[0, b)$
.
$[0, b)$
.


 Open access