
INTRODUCTION
The representation of female judges within post-socialist judiciaries of Central and Eastern Europe (CEE) is strikingly high compared to common law countries as well as other civil law countries in Europe. Due to their state-socialist past, when being a judge was neither well paid nor prestigious, post-socialist judiciaries started with a much higher ratio of women on the bench than established democracies, and they have often kept a parity or even majority of female judges (in the Czech Republic, for example, women currently make up 61 percent of judges). It could therefore be assumed that the problem of women’s underrepresentation in the judiciary does not exist in post-socialist Europe. This article shows that it does, using Czechia (a short form for the Czech Republic) as a case study. Despite the fact that women on the bench outnumber their male colleagues, the Czech judiciary is characterized by vertical gender segregation,Footnote 1 a slow “defeminization” in positions of power and influence, and a gendered division of labor.Footnote 2
In terms of vertical gender segregation, the higher we look,Footnote 3 the less we see women, be it among judges at regional (krajské), high (vrchní), and supreme (nejvyšší) courtsFootnote 4 or as court presidents. As for “defeminization,” while the decrease in numbers of women in the judiciary as a whole is minimal (only 2 percent in two decades), it is considerably more significant higher up: at higher courts and among court presidents. We also find a four-fold gendered division of labor. First, female law graduates more often end up outside the core legal professions than men. Second, within these professions, women are the majority in the judiciary but are a much more pronounced minority in the largest legal profession—the “advocacy.”Footnote 5 Third, the judiciary is horizontally segregatedFootnote 6 by field, with women clustered on the civil law agenda. A gendered division of labor also occurs between (male) court presidents, who wield a significant formal, as well as informal, power, and (more often female) vice-presidents, who are tasked with more mundane “housekeeping” duties. Finally, and crucially, a gendered division of labor continues to exist in Czech households. The reality of women as primary caregivers in the home, and the (self-)perceptions surrounding this “role,” help explain why women’s significant presence on the bench combines with their relative absence at the top. The same reason why many women enter the judiciary—because it enables the reconciliation of private and professional lives—ends up being the reason why women do not progress--their “second shift” at home is (seen as) incompatible with progressing up the career ladder.
This article presents and substantiates these findings using unique longitudinal data on the representation of women among law graduates and in the legal profession, especially the judiciary. As this quantitative data is often not public, we requested them from various sources (for example, the Ministry of Justice of the Czech Republic, the Czech Statistical Office, the Czech Bar Association, the Notarial Chamber of the Czech Republic, the Chamber of Licensed Executors of the Czech Republic, and the four faculties of law) or gathered them manually from various yearbooks and documents. We also requested data about the recent selection procedures from the regional courts (four out of eight courts complied).Footnote 7 Aside from presenting the data that corroborate our observations on vertical and horizontal segregation and defeminization, this article also offers tentative interpretations as to why the findings appear as they do. These were informed by insights from fourteen female judges acquired via in-depth interviews,Footnote 8 supported by existing literature on the position of women in the Czech labor market as well as literature on legal professions in post-socialist countries.
The main contribution of the article is twofold. First, it shows the complexity of institutional diversity. It reveals that one has to look at more than just the percentage of women within the broader institution. The superficial statistic suggesting a “feminization” of the bench hides the fact that women are both underrepresented in positions of power and that this situation is gradually worsening. This observation disproves the possible perception that high proportions of women on the courts (necessarily) indicate women’s advancement or a nation’s progressive position on women’s rights status. It also dispels the myth of a “feminized judiciary,” which is present in Czechia as well as in other continental European jurisdictions. Not only do men reach overall a “critical mass” of representation, making even a plain numerical claim of “feminization” invalid, but, more importantly, any more profound implications of “feminization”—that women have power, that there exists a dominant woman’s culture, or that there is a cultural valuing of femininity—are completely missing. While existing research has shown the mechanism of a “glass escalator” for men in feminized professions (Williams Reference Williams1992, Reference Williams2013), such as education (Cognard-Black Reference Cognard-Black2012) and even legal education (Allen, Jackson, and Harris Reference Allen, Alicia and DeShun2019), this article confirms and nuances it for the purposes of the power-rich, decision-making profession of a judge, which is uniquely feminized in the continental European context.
Second, it identifies and evaluates possible explanations for why the high numbers of women entering the judiciary might not correspond with career progression and greater representation of women at its higher echelons. Age, pool of applicants, and male gatekeeping do not appear to drive these disparities. Instead, the interaction of gender stereotypes with institutional policies cause them. The “maternal wall”—a further distinction between “mother” and “other” (Crosby, Williams, and Biernat Reference Crosby, Williams and Monica2004)—is notable. Thus, the gendered division of labor needs to be viewed as a central reason for the “leaky pipeline” (see, for example, Gertner Reference Gertner2012) in the Czech judiciary, with women experiencing a considerable motherhood penalty due to both the long absences during maternity and parental leave as well as the additional responsibilities if they become the primary child caregiver thereafter.
The article proceeds as follows: the first section provides a longitudinal analysis of the representation of women in the Czech judiciary. The relatively large numbers of women are examined in the context of other legal careers and the process of recruitment into the judiciary. The second section focuses on the representation of women at different tiers of the Czech judiciary and among court presidents and vice-presidents. It supports the claim of vertical segregation and a slow defeminization at the top and suggests reasons for this gender hierarchy. The third section offers concluding remarks.
WHY IS THERE A MAJORITY OF WOMEN IN THE CZECH JUDICIARY?
This section starts by placing the number of women in the judiciary into the context of law graduates and other legal professions. It shows that women have made up the majority of law graduates for over a decade. As for women’s choices after graduation, while many commentators focus on their high representation on the bench, what is more striking is their relatively low number among attorneys in law firms as well as their absence from the five core legal professions altogether. The section then discusses other explanations for the high number of women on the bench. Certain characteristics of post-socialist CEE countries are worth noting: the initial sizeable entry of women into the judiciary under state socialism, when the job had low remuneration and prestige, as well as the early post-socialist recruitment of women when the profession needed greater numbers, with men preferring the suddenly more financially attractive profession of an attorney. We also observe that certain characteristics of the judicial appointment process today—particularly, the length of time a trainee must endure a low salary and the uncertainty of eventual appointment—might discourage male law graduates, who tend to be the primary breadwinners. This factor does not appear to discourage women, who are attracted by the “security and stability” of the eventual judgeship. The possibility of reconciliation between work and private life seems to be the bench’s main draw for women.
Law Graduates and Legal Professions
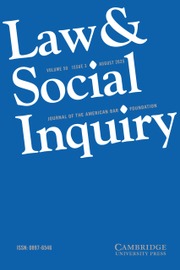
Since the Second World War, there has been only one pathwayFootnote 9 to becoming a lawyer in one of the five core legal professions—to finish a five-year master’s degree in law and then a three-year paid traineeship.Footnote 10 Since 1975, women have consistently made up over 40 percent of law graduates,Footnote 11 roughly half since 1985, and an uninterrupted majority since 2005 (see Figure 1; see also Wolchik Reference Wolchik1979, 584). Thus, for almost half a century now, about as many women as men have gained a legal education.
The proportion of women among law graduates, 1957–2018. Credit: Data from 2001 onwards are from the Composite Information of Student Registers; the data includes full-time graduates of the master’s degree program. Older data were provided directly by all the four Law Faculties in Czechia: Charles University in Prague, Masaryk University in Brno, Palacký University in Olomouc and the University of Western Bohemia in Pilsen. These were supplemented from statistical yearbooks (for example, Statistical Yearbooks of the Czechoslovak Socialist Republic, produced by the Federal or Czech and Slovak Statistical Offices, later the Statistical Yearbook of the Czech Republic). With regard to the Charles University Faculty of Law, only the numbers of students in a given year were available between 1957 and 1989, not the numbers of graduates. 2019 data for university graduates are not available to us at the time of writing.
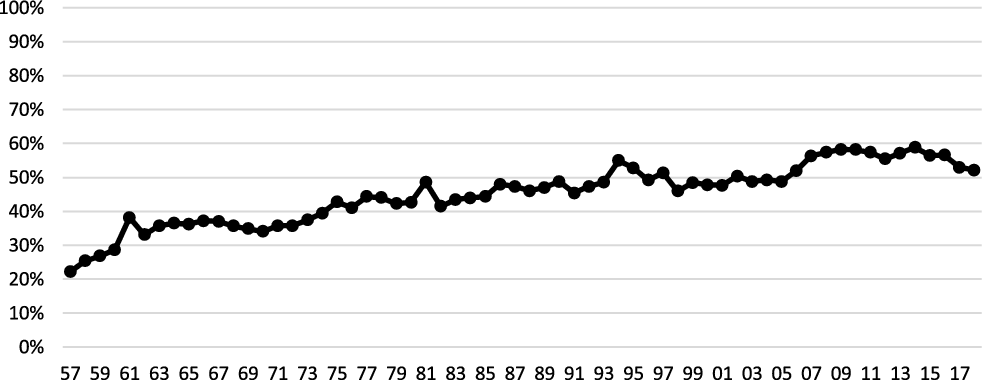
After graduation, women have been heading in greater numbers into public sector jobs: the judiciary (61 percent), public prosecution (54 percent), and the notary public (69 percent).Footnote 12 Men, on the other hand, are the majority among attorneys (40 percent are women) and executors (26 percent are women) (Figure 2). This figure shows a horizontal gender segregation among the legal professions, which has been very consistent over time.
A comparison of female representation among law graduates, judges, public prosecutors, attorneys, notaries, and executors, 1935–2019. The table does not include newest, 2019, data for law graduates. Credit: Public prosecutors and judges: computation by authors based on the data of the Ministry of Justice of the Czech Republic. Executors: computation by authors based on the data provided by the Chamber of Executors of the Czech Republic. Attorneys: computation by authors based on the data provided by the Czech Bar Association (since 2012); older data come from yearbooks (for example, List of lawyers of the Czech Bar Association; Lawyers in the Czechoslovak Socialist Republic; Lexicon of Czech lawyers) and were calculated based on the name lists and subsequent manual identification of names as female or male. Law graduates: see Figure 1.
To truly understand women’s job choices after graduation, it is perhaps as revealing to look at where they go as to look at where they do not go. Women, in greater numbers than men, end up entirely outside the five core legal professions (Figure 3).Footnote 13 In the legal professions altogether, there are currently 9,190 men and 7,540 women. Women thus make up about 45 percent, whereas, among law graduates, counting since 1990 (which roughly captures the first cohort of lawyers currently still in employment),Footnote 14 women constitute a higher proportion at 53 percent.Footnote 15 This finding suggests that women, more than men, pursue careers in civil serviceFootnote 16 or local self-government (whether in legal or non-specialist positions) and as in-house lawyers, choose other careers entirely, or may even stay out of the job market altogether (it is not possible for us to gather data on these careers).
Numbers of men and women among judges, public prosecutors, attorneys, notaries, and executors, 2019. Credit: For attorneys, judges, public prosecutors, and executors, see Figure 2. Notaries: computation by authors based on the name list of the members of the Notarial Chamber of the Czech Republic published online (https://www.nkcr.cz/en/list-of-notaries) and subsequent manual identification of names as female or male.

This finding raises two questions: why do women more than men work outside the five core legal professions, and why is there a horizontal gender segregation among these professions? The answers to these questions are likely connected. One often hears that Czechia has the problem of “feminization” of the judiciary—namely, that there are too many women on the bench (see, for example, Vučka Reference Vučka2017). It is submitted, by looking at absolute numbers, that one has to take the opposite perspective: women are clearly underrepresented in law firms, the greatest employers of law graduates, and it is therefore logical to find them slightly outnumbering men elsewhere. This point is underscored by the fact that access to law firms for women is made difficult in law as well as in practice. The traineeship period leading up to becoming an attorney (koncipientská praxe) requires, by law,Footnote 17 full-time employment. If a trainee works less than forty hours a week, their work is not only not counted fully or counted pro rata – it is not counted at all. This situation, of course, has had a pronounced, albeit indirect,Footnote 18 effect on women, who make up the majority of primary caregiversFootnote 19 and who often have children during this period.Footnote 20 However, rather than addressing this problem, there has been a recent discussion of extending the traineeship period to five years, which would considerably aggravate the situation.
The fact that the legal conditions for entry into the largest core legal profession indirectly disadvantages women as primary caregiversFootnote 21 is likely the most significant explanation for the horizontal segregation within the core legal professions as well as for women working outside of them. As for other professions, the notary public, because of its set and low number of posts (numerus clausus), keeps out newcomers of both sexes (for East Germany, see Shaw Reference Shaw2007). The number of executors is so lowFootnote 22 as to be a negligible profession in terms of job opportunities. Thus, rather than women pushing men out of the judiciary, they might be finding refuge on the bench (as well as among public prosecutors) because it is hard to enter other professions, either for anyone (notaries, executors) or for women specifically (law firms).
The Judiciary
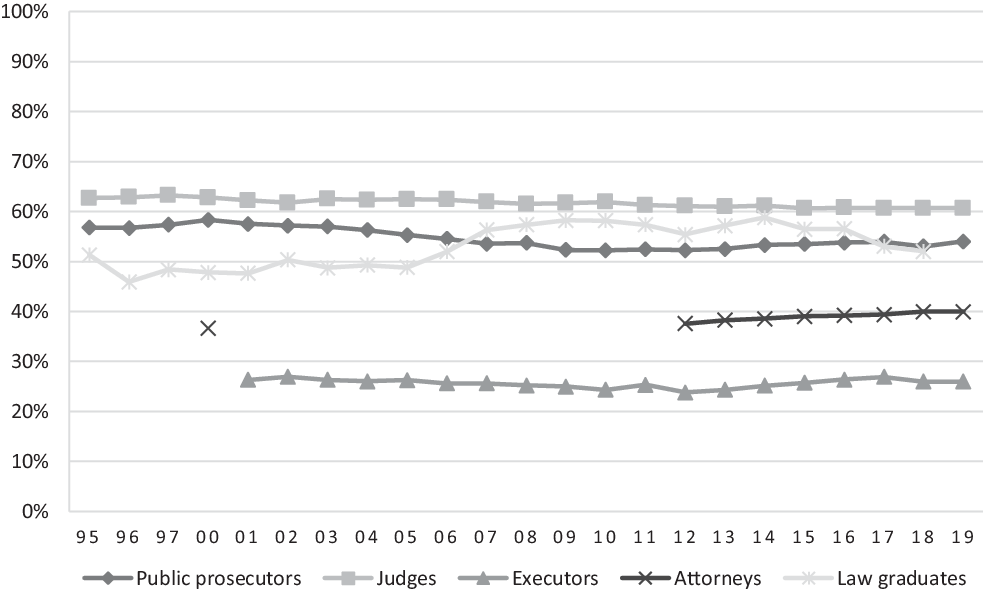
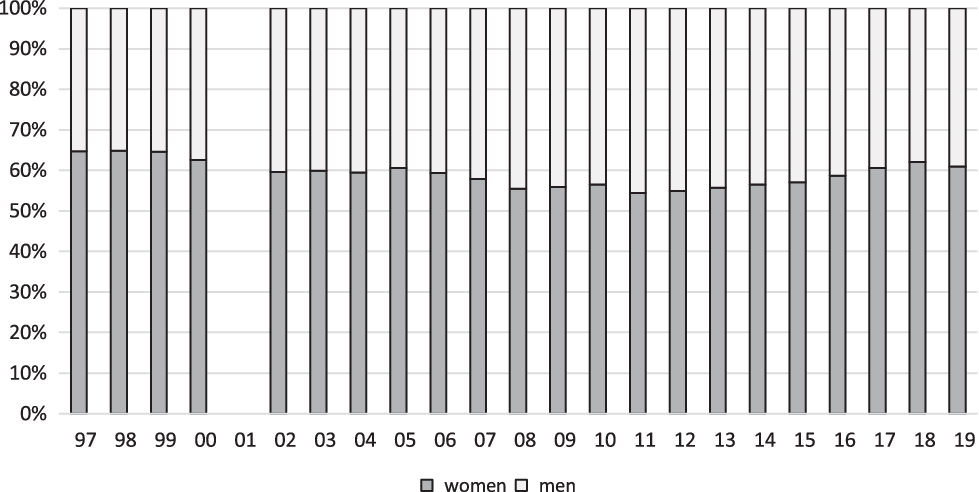
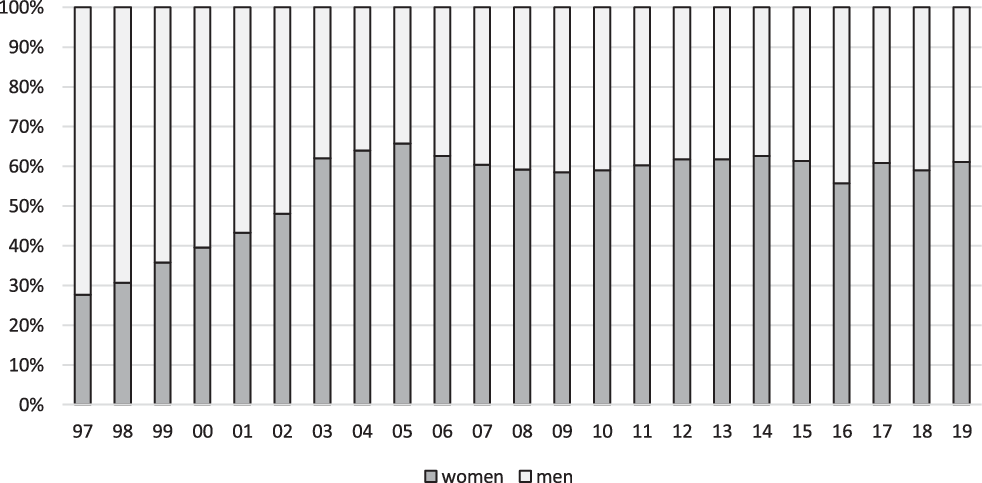
Women form approximately three-fifths of the Czech judiciary (61 percent). This statistic has changed minimally over the past two decades, although a small decrease of two percentage points can be noted (Figure 4). Figure 5 reveals the same proportion of women among the under-forty age group,Footnote 23 which suggests that the total number of women will remain reasonably constant in the near future as well.
Female and male judges, 1997–2019 (the Ministry of Justice only has data available from 1997). Credit: Computation by authors based on the data of the Ministry of Justice of the Czech Republic.
The proportion of female and male judges among the age group under forty years, 1997–2019 (data was not available for 2001). Credit: Computation by authors based on the data of the Ministry of Justice of the Czech Republic.
Geography and History
When trying to understand the high proportion of women in the Czech judiciary, relative to other decision-making positions of prestige and power, it is informative to look at wider geographical and historical contexts. While a high proportion of women is unusual in common law countries, where they rarely make up more than a third of the judiciary,Footnote 24 Czechia is not unique among civil law countries where women make up more than half: the European Union’s (EU) civil law continental member states’ average is the same as the Czech proportion: 61 percent.Footnote 25 Among other explanations,Footnote 26 it has been suggested that this is due to the different career models in the two systems. In common law countries, judges are appointed later in life based on previous careers, not always based on completely transparent criteria, which can benefit men. The civil law systems of career judiciary, which requires specialized training and comparatively early entry, with predictable criteria based on academic excellence, can benefit women (Schultz Reference Schultz2003a, xxv–lxii; Malleson Reference Malleson2006, Reference Malleson2010; Bessiére and Mille Reference Bessière and Muriel2014, 43–60). This finding likely applies to Czechia too, although, based on our research, we cannot offer directly supporting evidence and even less so speak to the comparison with common law countries. But certain aspect of the appointment procedure appears to impact the choices of men and women, a topic to which we return below.
Even higher percentages of women are typically found in post-socialist countries than in civil law jurisdictions overall. The three highest percentages of female judges in the EU are in CEE jurisdictions: Slovenia (79 percent), Lithuania (78 percent), and Romania (74 percent). In an overall comparison, post-socialist countries have considerably higher rates of female judges (69 percent) than does the continent (61 percent) and the EU overall (53 percent).Footnote 27 This trend can be traced back to, first, state socialism—in many state socialist countries, women made up the majority of the judiciary in the 1980s—and it has been connected to the low prestige of the judiciary during that period.Footnote 28 Second, and perhaps equally impactful, was the development immediately after the fall of the regime in 1989. Due to the growing importance of law and the creation of entirely new branches of law, such as commercial law, there was a great need not only for new judges but also for new attorneys in the early 1990s. Many male judges, according to various accounts,Footnote 29 moved into the private sector, where income skyrocketed. As pointed out by Kateřina Šimáčková, a Constitutional Court judge: “Whereas judges’ monthly earnings were 2500 Czech crowns, a top Prague-based advocate could earn as much as 250 000 Czech crowns.”Footnote 30 In this situation, new judges were appointed, many of them female. According to one of our interviewees, “[a] judge had the wage of a cleaner or a kindergarten teacher then, so a lot of women went in.”Footnote 31 Similarly, as Šimáčková has noted, “[w]omen had mainly been in-house lawyers in huge communist corporations, which came to cease in the 90s. A judgeship was a feasible alternative; likewise poorly paid but also with a secure income.”Footnote 32
The Appointment Process and the Job Itself
Earlier in this article, we have mentioned that, in an international comparison, the system of a career judiciary, where judges are hired effectively out of law school, might benefit female candidates. For such a finding, we cannot offer supporting evidence. From what we can observe, for the Czech appointment process, it is perhaps more accurate to say that certain of its features might discourage male candidates. To become a judge in the Czech Republic, there are two separate tracks. The first (and standard) way to get into the judiciary is known as the “career track,” which means that one has to be a trainee,Footnote 33 and, after three years at the earliest, one can attempt the judicial exam (justiční zkoušky).Footnote 34 Passing this exam successfully, however, in and of itself does not guarantee a judgeship. First, there is a minimum age requirement of thirty years for the judicial office.Footnote 35 Second, those candidates who pass the judicial exam or the equivalent professional exam must enter the competition for a vacant judicial post. This competition, in practice, is administered by the presidents of regional courts, and the procedures vary considerably from one region to another, though it seems to be in the process of changing. In some regions, recommendations from “one’s judge”Footnote 36 (to whom one acted as a trainee) and oral interviews have been the rule.Footnote 37 More recently, some regional presidents have introduced a two-phase competition, consisting of a written test followed by an interview for the shortlisted candidates. There appears to be a shift to written tests,Footnote 38 but some regional fragmentation and an element of a lack of transparency and predictability persists.Footnote 39
What we can say, based on data on the selection of new judges that were supplied by four out of eight Czech regional courts in the period from the beginning of 2018 to August 2019, is that neither female nor male applicants seem to be favored in the selection procedure. Female applicants made up 56 percent of the total number (593 applicants), and they accounted for 55 percent of those who took the written test, 53 percent of those who were invited for personal interviews, and 56 percent of those who were selected for a position. Thus, at least based on this temporal and regional data, it seems that the selection rate of male and female applicants closely copies their application rate. Importantly, even once a candidate has been selected, the actual appointment can take several years, depending on the availability of finances and the urgency to fill the vacant posts.
Both the legal minimum age requirement and the length of the process can be somewhat discouraging to male candidates. As for the age minimum, few candidates, in reality, are delayed by this rule because of the overall length of the process leading up to the appointment. When there is a gap (that is, a candidate is ready for an appointment but not yet thirty years of age), women have been known to fill it by having a child and taking maternity/parental leave.Footnote 40 This appears to be a path rarely taken by male candidates.Footnote 41
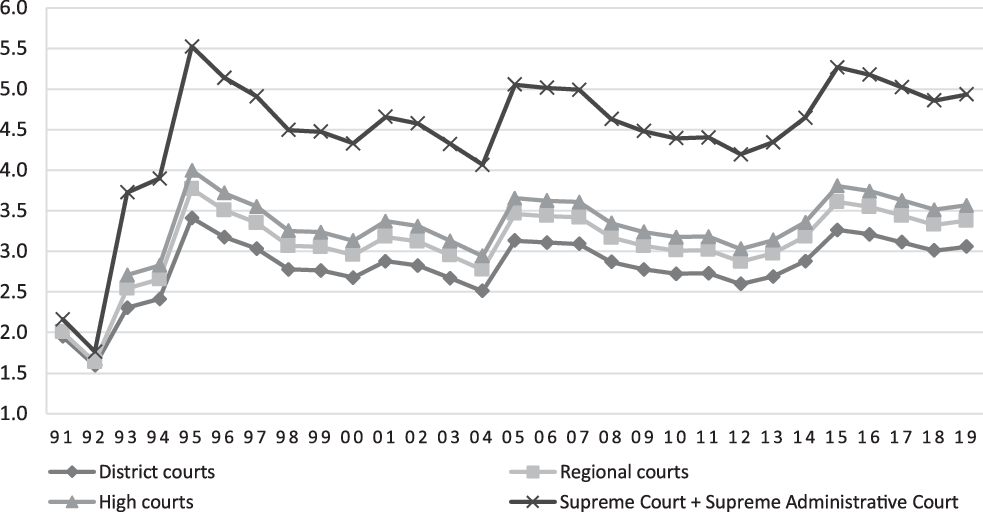
More importantly, both of these phenomena mean that one has to stay for a relatively long period in a poorly remunerated trainee position. The average income of judges has, since the mid-1990s, been relatively high: a district court judge earns roughly three times the average income in Czechia, and a supreme court-level judge earns five times the average (Figure 6). While this does not compare with the average income in “big” law firms, it is on the whole attractive remuneration. The average income of judicial trainees, however, is very low, lower than average national income.Footnote 42 The salaries cannot compete with those in law firms, be it “big” or regular, and are discouraging especially in bigger cities, where living expenses are higher.
Wages of judges with 10-year experience expressed as the multiple of average gross wage in the Czech economy, 1991–2019). Before 1995, wages were determined by Act no. 391/1991 Coll; after 1995, by Act no. 236/1995 Coll. The Czech Statistical Office’s data were used for the average gross wage in Czechia. The exact development of the wages in the judiciary is too complex to present in this article since it evolved through numerous legislative amendments as well as by sixteen interventions by the Constitutional Court. Credit: Computation by authors based on the Czech Statistical Office’s data.
This period of extended low income appears to be more acceptable to women than men. The Czech family earning model, rather than being one of breadwinner-homemaker, has been, since the state-socialist period, a “dual earner” one, of primary (men) and secondary (women) breadwinners.Footnote 43 This means two things. First, because the time when one waits for appointment typically coincides with the time when many would consider starting a family,Footnote 44 staying on the low wage of a trainee can be more easily accepted by the second earners, that is women (who would, likely, be receiving maternity and parental benefits during this time anyway). Second, men can be discouraged by the uncertainty of not only when, but also whether they would be appointed to a judgeship, due to the relative lack of transparency and predictability of the process, as well as a recent slow-down in turnover of judges.Footnote 45 Interestingly, even the much higher eventual wage of a judge has been mentioned by several of our interviewees as “secure, secondary”Footnote 46 income in the family. Our interviewees pointed out that there are many two-career, two-lawyer relationships, where the man brings the higher income from a law firm job, and the woman’s judicial pay is seen a complementary, supporting income.Footnote 47
Women appear to deal better with uncertainty in the early pre-appointment period for the prospective reward of the “security and stability” of a judgeship.Footnote 48 Both positions—of trainee and judge—are seen as relatively family friendly.Footnote 49 There is job security when one is on maternity or parental leave, which is particularly salient in the Czech Republic, where the default and average length of parental leave is three years, which leads to a considerable “motherhood penalty” in the labor market.Footnote 50 After returning from parental leave, flexible working arrangements are a possibility.Footnote 51 Some of our interviewees were able to work part-time for a period. Most of our respondents worked full-time, but several stated that they only physically came to their court a few days a week, for oral hearings, and were working from home for the rest.Footnote 52 The leeway to self-direct time, especially the possibility to schedule hearings into just one or two days a week, was often mentioned as a huge attraction of the judiciary,Footnote 53 especially compared to an attorney’s necessity of being responsive to a clients’ needs. It has to be noted, however, that, again due to the power of the presidents of regional courts, the management of human resources can vary drastically between regions. And the availability of conditions favorable to the reconciliation of family and work life is entirely dependent on the good will of the court leadership. While part-time work might be available in some places, it is clearly not available everywhere, and while the possibility of working from home is formally declared and acknowledged in some regions, it is merely informally tolerated in others. Indeed, so far, the only sex discrimination claim brought by a female judge in Czechia concerned the refusal of her superior to allow her to work part-time in order to care for her two children. The claimant lost the case.Footnote 54
The second “lateral track” allows lawyers from other legal professions to enter the judiciary. This path is much less common path in the Czech judiciary, but some important appointments of non-career judges have been made this way, especially at the Supreme Administrative Court (SAC). The lateral track’s gender impact depends on the specifics. When moves are facilitated from the civil service, it can lead to a higher proportion of women joining. When new judges come from academia and the advocacy, they are more likely to be male (see discussion later in this article).
Is the Czech Judiciary “Feminized’?
Because we mention defeminization, one could perhaps ask whether the Czech judiciary is “feminized.” This worry, as a matter of fact, is often expressed in Czechia: the preponderance of women is viewed as harmful “feminization” and criticized for skewing judicial decision making.Footnote 55 For example, an attorney recently argued on an influential law blog in a post entitled “We Have a Gender Problem: Let Us Introduce Quota for Male Judges,” that having a majority of female judges, especially those deciding child custody decisions, is inevitably gendered and unjust (Vučka Reference Vučka2017). It is clear that many assume that sex/gender has an impact on the quality of women’s judging; a prominent Czech sexologist, Radim Uzel, repeats and insists, not uncommonly in the context of the Czech public discourse, that “if I were the accused in front of a female judge of reproductive age, I would be very interested in what stage of her menstrual cycle she is in, because that would determine the severity of my punishment” (Růžička, Reference Růžičkan.d.).
It is not the aim of this article to discuss how sex or gender impacts judicial decision-making, and we will leave it to our readers to assess the fairness of these statements as well as their premises. What these statements illustrate, however, is how disturbing it is to some commentators that women constitute the majority in a decision-making profession endowed with power and prestige. It would not occur to these commentators, of course, to perceive a problem in politics—be it in the legislature or the executive—where male predominance is considerably more pronounced (women make up only 27 percent of cabinet ministers and 21 percent of parliamentarians).Footnote 56 It also bears noting that, while women in these positions of power do not reach the critical mass of 30 percent, men in the judiciary, with almost 40 percent, exceed it safely. Moreover, considering the higher numbers of female law graduates, the number of women judges is even less striking when compared to potential recruits. Finally, not only is the description of the Czech judiciary as “feminized” exaggerated and clearly rooted in a gender-biased view of what proportion of men and women is normal in positions of power, it also does not pan out when one looks at the actual distribution of power within the judiciary. It is to women’s underrepresentation at higher courts and among court functionaries to which we now turn.
WHY ARE WOMEN MISSING AT THE TOP?
In the following discussion, we show that the Czech judiciary is characterized by vertical gender segregation and a slow defeminization at the top, both in terms of the presence of women in the judicial hierarchy as well as among court functionaries, especially among the powerful presidents of regional courts. Horizontal segregation also exists as male and female judges focus on different areas of law. There are likely many reasons for this situation, but we identify several obstacles having to do with women being overwhelmingly the primary caregivers as the crucial one.
Judicial Hierarchy
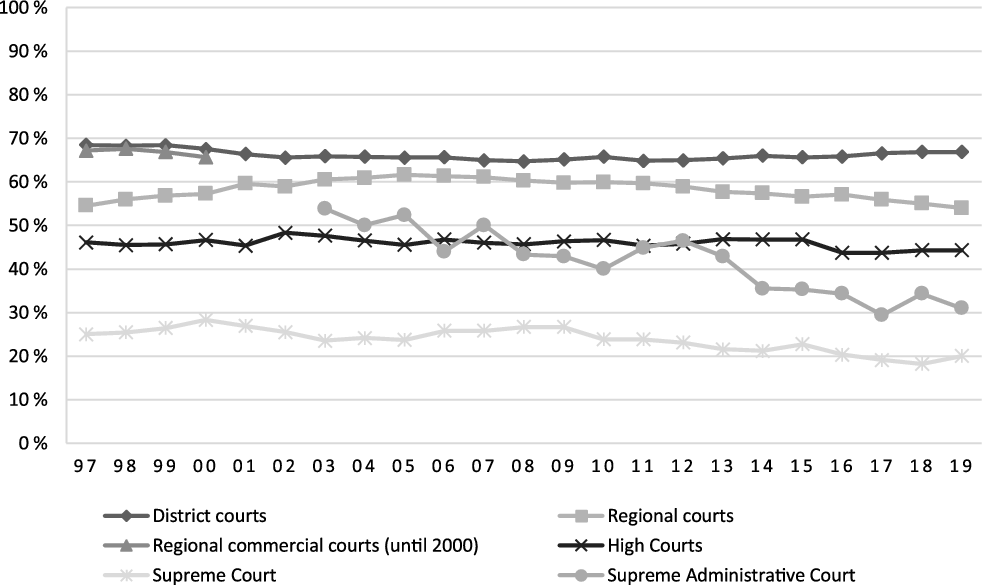
Women make up more than a two-thirds majority of all judges at the lowest level of district courts (67 percent in 2019); at the regional courts, they are only in a slight majority (54 percent); and their numbers have been steadily decreasing over the last decade. From the high courts upwards, men outnumber women (44 percent of judges at the high and Supreme Court (SC) level are women) (Figure 7). The lowest numbers of women are at the SC and the SAC. Their proportion between 1997 and 2018 rarely exceeded one-quarter, and, similarly to regional courts, the trend has been a steady decrease. At the end of 2019, there were only 20 percent of women at the SC. The SAC started strong in its inaugural year of 2003, with 54 percent of women. Three years later, their proportion dipped below half and, despite some ups and downs, has seen a marked decline overall to 31 percent in 2019. The SAC is an interesting case not only for its late and gender-balanced start but also for its subsequent fluctuation and decline (Figure 7). Although its idiosyncrasies make the SAC somewhat of an outlier and thus perhaps an unsuitable basis for any generalizations, a brief elaboration is nonetheless warranted.
The proportion of female judges at different levels of the judicial hierarchy, 1997–2019. Credit: Computation by authors based on the Ministry of Justice of the Czech Republic’s data.
The SAC: A Missed Opportunity?
Women were in the majority when the SAC was established in 2003. It was a new court without antecedents and thus did not inherit a particular gender structure. The timing of its establishment likely played a role too: a transitional provision of the Code of Administrative ProcedureFootnote 57 temporarily allowed for judicial examinations to be attempted by lawyers with a range of practical experience, including in public administration. This enabled various employees of central state agencies, such as the Department of Revenue or the Social Security Administration,Footnote 58 many of them female, to be appointed to the SAC. As far as the more recent downward movements are concerned, two things are worth noting. First, several female judges died or resigned for health reasons in short succession,Footnote 59 and one judge requested a transfer to a lower court.Footnote 60 Having said that, while this explains the loss of several female judges, it does not explain why their replacements were not also female.Footnote 61 Second, the SAC has often hired new judges “laterally”—that is, from other legal professions and legal academia rather than from among ordinary judges, especially toward the end of the tenure of the first SAC president, Josef Baxa. This action was in itself laudable as it increased professional diversity within the career judiciary. However, eight men and only one woman were appointed this way, suggesting that this process has advantaged men.Footnote 62 The practice of selecting from the pool of legal academics or attorneys, in particular, in which men are overrepresented both in general and even more prominently in prestigious higher positions, might have indirectly disadvantaged women (Kober, Reference Kober and Schultz2021).Footnote 63
Court Presidents and Vice-Presidents
Court Presidents
Court presidents and vice-presidents play a crucial role in any judiciary (compare Schultz Reference Schultz2013a, 2013b). They wield jurisprudential, media, financial, administrative, representative, and personal powers (Blisa and Kosař Reference Blisa and David2018, 2041–56). Court presidents have in general a stronger position in civil law systems than their common law counterparts since their “career model” places the socialization and education of young judges into the hands of court presidents. For historical reasons, the court presidents’ role is even stronger in CEE countries. The countries inherited a system from state socialism, where the most proven and trustworthy cadres were appointed by the Communist Party leadership to act as “transmission belts” between the regime and the judiciary (Bröstl Reference Bröstl, Přibáň, Roberts and Young2003, 141; Kühn Reference Kühn2011; Kosař Reference Kosař2016). The Czech model of administration of the judiciary is more tilted toward the court presidents than in the neighboring CEE countries because of the absence of a national council of the judiciary or similar body, which would have competence in the area of appointment and promotion of judges (Kosař Reference Kosař2016, 236–333; Blisa, Papoušková, and Urbániková Reference Blisa and David2018, 1958). The Ministry of Justice is the only counterweight to the force of court presidents. The Ministry of Justice, however, has grown weaker and weaker in recent years due to the fluctuation of ministers and the relative lack of strong civil service personnel (Kosař Reference Kosař2016, 236–333; Blisa, Papoušková, and Urbániková Reference Blisa and David2018, 1958). The informational asymmetry between the Ministry of Justice and court presidents has been growing. The Ministry has therefore outsourced some of its decisions, such as the selection of new judges and the temporary as well as permanent promotion of judges, to the court presidents (Kosař Reference Kosař2016, 236–333; Blisa, Papoušková, and Urbániková Reference Blisa and David2018, 1958). The Judicial Union, a voluntary association of judges, may have some informal influence over court presidents but lacks any formal competence in court administration. Moreover, the Union’s presidents have often been recruited from the ranks of acting or former court presidents, and, hence, their interests are often aligned.
Court presidents, especially of regional courts, have thus become the gatekeepers to the judiciary since they are the ones who in reality select the new judges (Kosař Reference Kosař2016, 236–333; Blisa, Papoušková, and Urbániková Reference Blisa and David2018, 1958) and have control over career development because they have the final say in promotions.Footnote 64 They are also the most active and successful initiators of disciplinary proceedings (Friedel Reference Friedel2015, 15–23; Kosař and Papoušková Reference Kosař and Tereza2017a, 14–35; 2017b, 238–39). In addition, they possess basically unlimited power in the day-to-day administration of courts and influence the internal dynamics by creating work schedules (Kosař Reference Kosař2014, 1049–76). Regional court presidents, in particular, can be seen as the most powerful judicial functionaries. In some ways, they are more powerful than judges at courts that are above them (high courts, the SC, and the SAC). This is illustrated by the fact that some judges might take the position of a regional court’s president over the promotion to a higher court.Footnote 65 Aside from these extensive powers, court presidents also enjoy a wide range of benefits, including higher wages than regular judges, a lighter workload, increased media attention (compare Boigeol Reference Boigeol2013), and, at both supreme courts, greater influence over the development of the law through the creation of grand chambers.
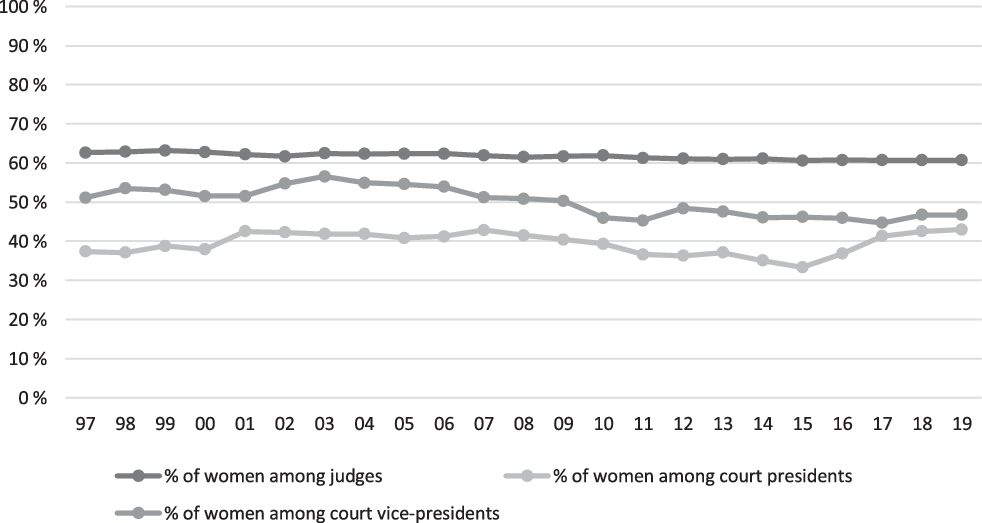
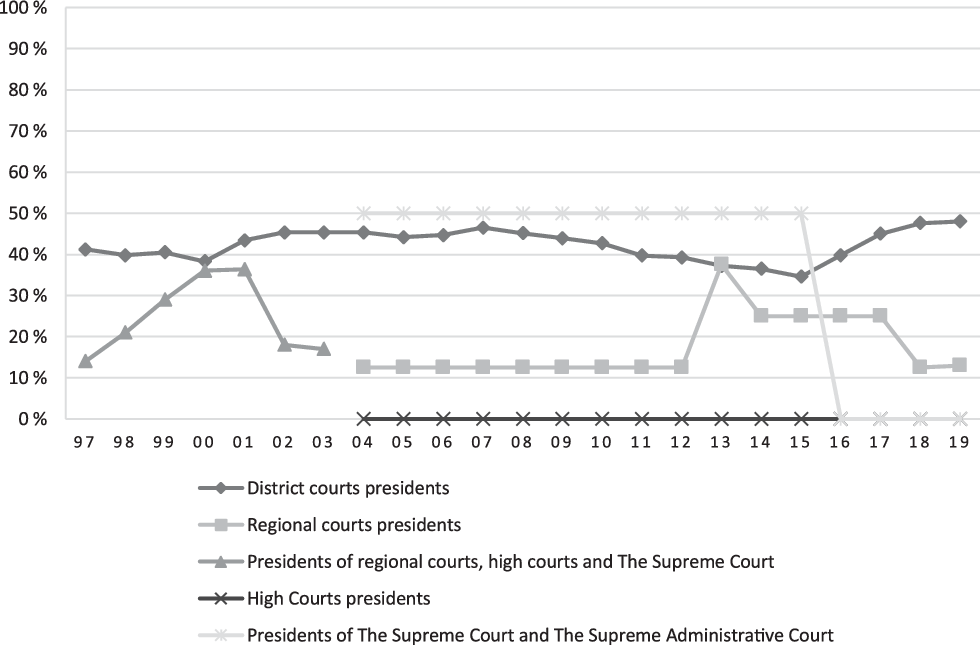
By contrast, the position of district court presidents is far less attractive. This position does not have the prestige or influence and involves fewer powers while carrying a greater quotidian administrative burden. In terms of powers, the selection of new judges and their appointment to district courts is carried out by the regional court president, to whom the district court is subordinate. The district court presidents can only give an advisory opinion. Equally, it is the regional court presidents who have a major say regarding temporary secondments and permanent promotions of judges to higher courts. The district court presidents, in contrast to their higher court colleagues, have less influence on the development of law, partly due to their agendas (fact finding) and partly due to their case overload. They also attract less media attention. Their voice outside the judiciary is not given significant weight since the Ministry of Justice considers the SC and SAC presidents and the collegium of the regional court presidents to be the voice of the judiciary. It is therefore clear that it matters greatly who is in these positions, especially in regional courts and higher. How do women fare here? As Figure 8 shows, women are persistently in a minority among court presidents (although the last few years have seen a slight increase).
The proportion of women among judges, court presidents, and court vice-presidents in the Czech Republic, 1997–2019. Credit: Computation by authors based on the Ministry of Justice of the Czech Republic’s data.
Even more revealing is the breakdown according to the levels of the hierarchy, which shows that women tend to hold these positions predominantly at district courts (Figure 9). Here, they have often made up almost half of the number of court presidents. Their representation in the regional courts is considerably lower. With the exception of 2013 to 2017, their proportion was 12.5 percent. In practice, that means that, for the most part, only one out of eight regional court presidents has been female in the past two decades. Only for one year (2013) were there three women in this position, and only for three of these years (2014–17) were there two.Footnote 66 It is even rarer for a woman to hold the post at a high or supreme court level. There has never been a court president at either high court (Prague and Olomouc)Footnote 67 or in the SAC.Footnote 68 Women led the SC for close to twenty years, but they have now also been replaced by males.Footnote 69 This effectively means that, at any given time, the number of women who have been presidents of regional courts and higher has been in single digits. We can thus conclude that women primarily hold the least interesting and the least visible posts of district court presidents, whereas men hold the key, powerful posts at the regional and apex courts.
The proportion of women among court presidents according to the level of judicial hierarchy, 1997–2019. Credit: Computation by authors based on the Ministry of Justice of the Czech Republic’s data.
Court Vice-Presidents
For the sake of completeness, we also looked at the proportion of women among court vice-presidents (Figure 10). The position of vice-president at a district or regional court is less attractive and prestigious than the position of court president for it entails less of a wage increase and less significant alleviation of one’s caseload compared to presidents. The principal responsibility of a vice-president is the day-to-day functioning of the court as well as other tasks assigned by the court president. Vice-presidents, furthermore, do not attract as much media attention and have less influence on the development of law than court presidents. The position of a court vice-president is typically less interesting and leaves less room for conceptual work. It will thus come as no surprise that there are considerably more women in these positions than for court presidents.
The proportion of women among court vice-presidents according to the level of judicial hierarchy, 1997–2019. Credit: Computation by authors based on the Ministry of Justice of the Czech Republic’s data.
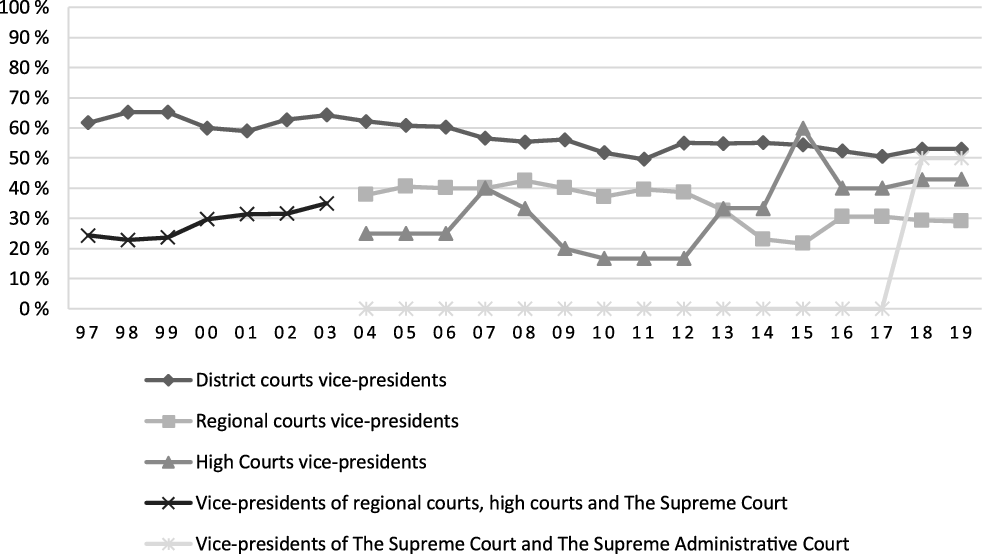
Again, we find women in the greatest proportion at the lowest level of the hierarchy—at district courts. Their number has declined from two-thirds in late 1990s and early 2000s to just above half, a number that comes close to their proportion among district court presidents. The difference between the positions of president and vice-president is more notable in the regional courts, where women constitute 15 percent of presidents (Figure 9) and 30 percent of vice-presidents (Figure 10). As for high courts, where there have been no women presidents, women have on average made up roughly one-third of vice-presidents, but this proportion has fluctuated considerably (ranging from between less than 20 percent to a 50 percent) (Figure 9).
As for the supreme court level, the role of the vice-presidents of the SC and SAC is different. In contrast with district, regional, and high courts,Footnote 70 there is only one vice-president post at both supreme courts.Footnote 71 This number implies that the vice-presidents of the supreme courts are the clear number two in their respective branch of the judiciary (administrative branch for the SAC and general branch for SC), only behind the court president. What is more, a vice-president has a very good chance of ascending to the position of president, once vacated.Footnote 72 In short, what was said about the general lack of attractiveness of these posts does not apply here, and, predictably, this has been reflected in the gender structure of vice-presidents at the supreme court level. For most of the existence of these two courts, there were no women vice-presidents at all. The first one was nominated only in 2017.Footnote 73 There are two factors to take into account here. First, the SC was led by female court presidents between 1998 and 2015, potentially decreasing the perceived need for another woman. Second, there have only been, in total, four vice-presidents since 2004, which has left little room for change.Footnote 74
Nonetheless, the contrast between the gender distribution at the supreme court level, where the position is both powerful and prestigious, and the rest of the judiciary is striking. At district, regional, and high courts, it seems to be a textbook example of a gendered division of labor. While the (female) vice-president does all the tedious organizational work, picks up delegated tasks that the president does not want to deal with himself, and handles a greater caseload, leaving little time for any conceptual work, the (male) court president reaps the fruit in the form of recognition, reputation, and increased media attention. As a result, (female) vice-presidents are not perceived as strong representatives of courts but, rather, as the helpers for the court presidents. In other words, they are seen as taking care of the household of the courts, whereas court presidents are “opinion leaders” representing the court externally and deciding important issues. Thus, this is an example of both vertical segregation (hierarchy) as well as, in a sense, horizontal segregation (the gendered division of labor according to tasks).
Horizontal Segregation
Horizontal gender segregation occurs both at the level of legal professions and in the division of tasks between court functionaries, but male and female judges also appear to cluster in different areas of law.Footnote 75 Women predominate in the area of civil law (70 percent of all female judges specialize in this area, in comparison with 53 percent of all male judges). Male judges predominate in the area of penal law (34 percent of all male judges specialize in this area, compared to only 18 percent of all female judges). In the remaining two areas—commercial law and administrative law—the proportion of female and male judges does not significantly differ (9 percent of both female and male judges specialize in commercial law, and 3 percent and 5 percent of female and male judges, respectively, specialize in administrative law).
The data available to us are not fine-grained enough for deeper analysis. The clustering of women in the civil agenda, which is possibly even more pronounced in “care cases” (opatrovnictví) regarding parental disputes and child custody, is likely one of the reasons why women’s presence on the bench seems to be noticed, termed “feminization,” and sometimes seen as a problem (as discussed above).Footnote 76 This situation, as well as the perceptions surrounding it, merit a closer analysis, but it is beyond the scope of this article.
The Reasons for the Gendered Hierarchy of the Czech Judiciary
In the following section, we examine the possible reasons for the vertical gender segregation and the slow, but unmistakable, defeminization in positions of power and influence. The reasons for the lack and decrease of women in positions of power in the Czech judiciary are discussed together for all levels of the judiciary and all positions of the functionaries, but their specifics are highlighted.
One of the reasons for vertical gender segregation across the levels of hierarchy as well as the lack of women among court presidents may be the age of judges.Footnote 77 For example, if male judges predominated in the oldest age group, it could then explain their predominance at the supreme court level since one could expect recruitment to be based to a great extent on seniority. As Figure 11 shows, however, this is not the case in Czechia. Male judges over the age of sixty predominated only between 1997 and 2002; since then, the ratio between male and female judges has reflected their overall proportion. The age structure of the judiciary can therefore be ruled out as a potential explanation.
The proportion of male and female judges in the age group over sixty years, 1997–2019. Credit: Computation by authors based on the Ministry of Justice of the Czech Republic’s data.
As for defeminization in positions of power and influence, one could ask whether it merely tracks the general decrease in the number of women in the judiciary, which has been about two percentage points over the past two decades (see Figure 4). A closer look reveals that the proportion of women is not falling uniformly. The decrease in women judges has been considerably more pronounced higher in the hierarchy (the SC has seen a decline of seven percentage points in the past ten years). Conversely, the overall proportion of women has been rising slightly at the lowest level of district courts (two percentage points in the past ten years).
One could also wonder whether male leadership is the cause. In other words, do men, who make up the majority of court presidents in Czechia, predominantly favor other men? Our research suggests that the gender of appointees roughly tracks that of applicants (see section on the appointment process above). Nor does there seem to be any correlation between the gender of leadership and appointments at the SC and the SAC.Footnote 78 The SC, which has been led by women from 1998 until 2015, has consistently had the lowest percentage of women of any court. The SAC, on the other hand, which has often had almost double the proportion of female judges as the SC, has been so far only led by men.
The sex of the decision-maker is one issue; the implicit, unconscious bias against female candidates, based on wider cultural understandings of the characteristics, abilities, roles, and preferences of women, however, can be held by anyone, man or woman. Gender bias has indeed been an explanatory staple for inequalities in the labor market more generally as well as for the legal professions (on attorneys in Poland, see Choroszewic Reference Choroszewicz2014b, 120–28; on all EU countries, see European Parliament Policy Department for Citizens’ Rights and Constitutional Affairs 2017, 30–32; for the United States, see Rhode Reference Rhode2018) and the judiciary more specifically (International Development Law Organization 2018, 21–25). Previous research (B. Havelková Reference Havelková2017, 282ff), as well as our interviews, suggests that the awareness of gender bias and inequality and the perception of it as injustice is not very high among the legal community, including female judges. And, yet, although not formulated in those terms, several of our interviewees noted, for example, that ambition in women—the “asking for” things or “putting oneself forward”—is not well regarded and is often met with hostility.Footnote 79 The wish not to appear as a “careerist” (kariéristka),Footnote 80 which is an unambiguously negative term in the Czech Republic, led one of our interviewees who was in a high position to emphasize that she “never had ambitions.”Footnote 81
Men do not seem to face similar constraints in pursuing the attractive markers of these positions of power: high wages, better conditions, and elements of power and prestige. Especially at the SC and SAC, the wages are a lot higher than for colleagues who are lower in the hierarchy, both in nominal terms and as a multiple of the average gross wages in the Czech economy (compare with Figure 6). They are thus comparable to those in private-sector legal professions. Moreover, working at the supreme courts can, from a certain perspective, entail better working conditions: smaller caseload, better support from law clerks,Footnote 82 and greater flexibility in working hours (because oral hearings are rarely scheduled). One also has greater influence on the development of law and a higher prestige both within the legal community and within society in general. This influence leads to greater media attention and higher demand for lectures and other public appearances.Footnote 83 The supreme court positions may thus attract men who try to maximize their income, leisure time, popularity, and prestige (compare Posner Reference Posner1993, 1–41) and who would not otherwise be interested in the lower court positions. A similar point can be made about court presidents.
Crucially, women are both perceived to be better suited for, and many of them also in reality perform, another role, outside of paid work, which has a profound impact on their jobs and careers: that of a mother and primary caregiver. A number of obstacles having to do with women being overwhelmingly the primary caregivers in CzechiaFootnote 84 is likely the central cause for women’s underrepresentation in higher positions in the Czech judiciary. The fact that while there continues to exist a considerable gender gap at work (between men and women), there is also a further difference between “mother” and “other,” which has been described as a “maternal wall.” It is neither unique to the judiciary—women face it in the labor market more generally (Crosby, Williams, and Biernat Reference Crosby, Williams and Monica2004) as well as in other legal professions (for the United States, see Gertner Reference Gertner2012; for the United Kingdom, see Guyard-Nedelec Reference Guyard-Nedelec2018)—nor completely unique to Czechia (for a discussion of Germany, see Schultz Reference Schultz2013b, 158–59). But there are some specifics: the regional one having to do with the past, the professional having to do with certain mechanisms in the judiciary. These are discussed in turn.
The strong emphasis on motherhood, or even a “cult of motherhood” (Kay Reference Kay2007, 13; see also Heitlinger Reference Heitlinger1996, 77) rather than gender-neutral parenthood, has historical roots. Despite common perceptions of state socialist policies as being gender equalizing, they were pro-family rather than pro-equality, especially in late socialism. In Czechoslovakia in the 1970s and 1980s, women were the primary, if not the sole, caregivers for children in the home.Footnote 85 They were no longer the workers and active citizens they were in the 1950s; they were the wives who cared for their marriages and the mothers who cared for their families (B. Havelková Reference Havelková2017, 28, 49–62). They shouldered the triple burden of (mostly full-time) work, household duties, and childcare (46–84). Understandably, such efforts had an impact on their career aspirations: “Women chose to keep their jobs but gave up any thought of careers, opting instead to raise their dominant position in the socially dominant family” (H. Havelková Reference Havelková1993, 93).
This division of labor, and its underpinning cultural understanding of gender and gender roles, has not substantially changed or been challenged since that time. The transformation of policy toward greater gender equality has been minimal and largely due to EU influence (B. Havelková Reference Havelková2017, 169–237). While fathers have been included nominally in protective and supportive legislation, their move to become primary caregivers has been negligible.Footnote 86 And very little has been done to truly enable reconciliation of work and family life. The motherhood penalty in the labor market in Czechia is one of the highest in the EU.Footnote 87 Czechia fares poorly in international comparison across a range of gender equality indicators.Footnote 88 The cultural understanding of gender roles remains “traditional”—it is still very much rooted in the belief of biological differences between the sexes (B. Havelková Reference Havelková2017). These three dimensions—policy, practice, and cultural underpinning—have been mutually reinforcing.
The state socialist legacy that was carried into the post-1989 period was doubly problematic: the actual policy, material reality, and culture that were inherited supported motherhood but not gender equality. But the perception was that equality was already addressed by the previous period’s “state feminism” and forcible emancipation. Therefore, if anything, gender relations were seen as needing to be returned to a more “natural” state (B. Havelková Reference Havelková2017, 158–79). This attitude has made any shifts—notably, to a more social constructivist understanding of gender and gender rolesFootnote 89 as well as to a realization that the problem might be structural rather than individualFootnote 90 —particularly challenging. Considering these obstacles, an important question is what can be done to alleviate them and to support the reconciliation of private and family life for women to not merely work but also to progress in their careers in the judiciary.
At the moment, the answer is: very little. While part-time work should be available to parents of children under fifteen years of age,Footnote 91 this has not always been observed.Footnote 92 It should be acknowledged, however, that when part-time is granted, it is counted in full (and not pro rata) toward the necessary years of legal experience required for a position at the SC and SAC.Footnote 93 Parental leave is particularly long in Czechia, which means that encouraging and enabling contact with the law and its developments during this period is crucial. According to one interviewee,Footnote 94 primary caregivers are, however, completely cut off from continued participation. They lose access to work emails and, thus, periodic updates about important case law and other developments, and they are not allowed on professional training courses. This loss of expertise, as well as reputation, can be difficult to make up. Men of the same age, during this time, can leave women behind. The period of care can also have a negative psychological impact. Several of our interviewees mentioned that women lose confidence in themselves.Footnote 95 An earlier and fuller return to work could be facilitated by the offer of workplace childcare, but, to our knowledge, such facilities have yet to be established.Footnote 96
Women remain the primary caregiving parents of children even after they return from leave. This means that career aspirations often appear low on their list of priorities at a crucial time for career building and progression. Several of our interviewees spoke positively about their positions at lower courts, with one, for example, mentioning the enjoyment of “working with people” in oral hearings,Footnote 97 but very often the positive comments were directly connected to their responsibility for children, such as the ability to schedule oral hearings into two days a week only in order to be able to work from home the rest of the week.Footnote 98 The prevalent traditional gender division of labor within the family in Czechia not only means that women will restrict their options, as just mentioned, but also that their partners are less likely to restrict theirs. Several of our interviewees mentioned that partners of female judges are less willing to adapt their careers compared to partners of male judges.Footnote 99 Assignment to a higher court often demands relocation or commuting to their new workplace. Commuting can be impossible unless the division of caregiving responsibilities is reassessed within the family.
To a student of gender (inequality), this will be a familiar story. The gender order informs the role of women in the family and the workplace. It shapes where women’s careers rank within the family and also what they can expect from their partners in terms of support for their career progress (as opposed to just support for working). It also determines what women can expect of professional setup in terms of the prevention of obstacles to progress in their careers, let alone active encouragement. Importantly, women often internalize these precepts and end up wanting or expecting less of themselves and their opportunities.
CONCLUSIONS
This article shows that, despite the fact that women have been in the majority on the Czech bench for decades, it is men who run the Czech judiciary. Female judges predominate at trial courts where a judge spends most time in the courtroom, is under pressure to deal with a high number of files, and shares his or her law clerk with other judges. Men, on the other hand, predominate at the top of the judicial hierarchy. It is mostly men who, especially at the supreme court level, actively create law, earn more, enjoy greater prestige, and have two personal law clerks. Men also prevail among court presidents, who, especially at the regional courts, wield significant formal, as well as informal, power, including over hiring and promotions. In terms of functionary positions, women, in contrast, can be found in greater numbers as presidents of district courts or as vice-presidents, which are both positions with less prestige and power and much heavier administrative burdens.
We argue that a gendered division of labor in the home, which forms an important part of the obstacles to career progression for women, is replicated in their professional lives as well: women often act as hard-working lower court judges, doing the less respected judicial duties, as well as weak, but busy, district court presidents or vice-presidents who do the housekeeping for the more powerful and prominent male court presidents. This suggests that women can have a job in the judiciary but, for the most part, not a career at the top. Thus, while women who perceive that a job in the judiciary is friendly to reconciling work and family life are likely correct about the position of a lower-level court judge, the same does not apply to further career progression. In other words, while the stability and security of a judgeship enables female judges to have families (or typically attracts women who want a family),Footnote 100 as women actually spend time to have and care for children, they are left behind in terms of ascending to higher positions. Women have access to the judiciary, but they do not achieve progress in their careers.
Several concrete recommendations can be drawn from our research, relating to more conscious countering of the disadvantages connected to motherhood and women’s role as primary caregivers. First, contact with the workplace during maternity and parental leave should be encouraged and enabled, and an earlier return, if desired, should be facilitated, especially by offering workplace childcare. Part-time work should be available, without any negative impact on seniority (ideally, as is already the case,Footnote 101 not just pro rata but counted as if full-time).Footnote 102 Recent experience suggestsFootnote 103 that transparent and formalized selection proceedings can encourage female candidates to apply for positions of regional court presidents. This should become the norm for functionaries as well as for the appointment of judges more generally. Finally, “stints” at higher courts for female judges, which often lead to invitations to join higher courts, should be encouraged and actively facilitated.
Our findings and suggestions should be viewed as the beginning rather than the final word on the question of the mechanisms of vertical and horizontal gender segregation in the Czech judiciary and the factors that prevent female judges from reaching the top. One avenue for further research would be a qualitative study of the motivations, aspirations, career paths, perceived barriers, and experiences of female judges.Footnote 104 A comparison with male judges’ perspectives could be also enriching. A second possible area of exploration are the informal institutions that determine women judges’ access to, and progress in, the judiciary. We know that gendered informal institutions such as social exchange (guanxi) in China (Zheng, Ai, and Liu Reference Zheng, Jiahui and Sida2017) and gentlemen’s pacts in Mexico (Pozas-Loyo and Rios-Figueroa Reference Pozas-Loyo and Julio2018) erect glass ceilings and sticky ladders. We know very little about the gendered informal judicial institutions in the civil law jurisdictions of continental Europe, CEE in particular, however.Footnote 105 Third, this article has suggested the need to go beyond mere numbers as the presence of women on courts does not necessarily equate with gender progress or equality. It has looked at the apex as well as higher courts and court presidents, but other loci of power should be looked at, such as high councils for the judiciary (often referred to as judicial councils) and judicial associations.


 Open access