

INTRODUCTION
The diversity of life on Earth and the services that ecosystems provide support the wealth of human societies. However, this support is threatened by the unprecedented growth of the global human population and human resource consumption. These threats have risen to the top of the international policy agenda. As a result, the Convention on Biological Diversity (CDB) aims to improve the state of biodiversity by 2020 through the achievement of 20 Aichi Targets (Convention on Biological Diversity 2011). Aichi Target 11 specifically mandates the conservation of at least 17% of terrestrial land areas of particular importance for biodiversity and ecosystem services, while Target 19 requires the development of an advanced shared knowledge base for biodiversity (Meyer et al. Reference Meyer, Kreft, Guralnick and Jetz2015). Species distribution data are critical for informing actions towards these targets, and international efforts to aggregate species distributions such as the Global Biodiversity Information Facility (GBIF) data have facilitated access to large quantities of data (Meyer et al. Reference Meyer, Kreft, Guralnick and Jetz2015).
Despite the vital importance of species occurrence data in achieving the Aichi Targets, distributional data with broad taxonomic coverage remain insufficient. Furthermore, the quality of spatial data is often compromised by uneven sampling efforts and sources of bias in biodiversity databases (Chapman Reference Chapman2005; Engemann et al. Reference Engemann, Enquist, Sandel, Boyle, Jørgensen, Morueta-Holme, Peet, Violle and Svenning2015), which can greatly influence the outcomes of analyses aimed at studying species diversity and distribution patterns (Sánchez-Fernández et al. Reference Sánchez-Fernández, Lobo, Abellán and Millán2011; Yang et al. Reference Yang, Ma and Kreft2013; Ficetola et al. Reference Ficetola, Cagnetta, Padoa-Schioppa, Quas, Razzetti, Sindaco and Bonardi2014). Quantifying spatial and temporal bias in sampling efforts is fundamental to directing future biodiversity surveys. Given the general lack of financial resources and the small number of taxonomists able to recognize a wide range of species, new sampling campaigns should be directed towards undersampled areas in order to maximize survey effort (Sánchez-Fernández et al. Reference Sánchez-Fernández, Lobo, Abellán and Millán2011). In this study, we evaluated the completeness of faunistic inventories for nine taxa in Italy, which hosts about 30% of European animal and 50% of European plant species, in a land area that represents only 1/30 of the whole continent (Italian Ministry for the Environment 2013). The specific aims of this study were to: (i) map inventory incompleteness for nine animal taxa; (ii) quantify temporal trends in data accumulation for the past 200 years; (iii) quantify recent temporal trends in data accumulation for species of conservation concern at the international level; and (iv) quantify the relationship between the completeness of each inventory and road, population and protected area density. We predict positive relationships between inventory completeness and the three predictors.
METHODS
Species data
Species occurrence data were derived from the checklist and distribution dataset of the Italian fauna database (CKmap). The database was created by the Italian Ministry of Environment and the Natural History Museum of Verona and contains over 450 000 occurrence records for 10 000 species (Ruffo & Stoch Reference Ruffo and Stoch2006). For our evaluation of inventory completeness, we considered six taxonomic groups of invertebrates: Lepidoptera (73 780 records), Odonata (14 554 records), Orthoptera (22 170 records), Trichoptera (13 192 records) and two Coleoptera families, the Cerambycidae (17 474 records) and the Carabidae (16 287 records). We also included three classes of Chordata: Amphibia (12 608 records), Reptilia (19 312 records) and Mammalia (16 389 records).
With the exception of Amphibia and Trichoptera, which are aquatic, all the taxa included are terrestrial. We decided to include the abovementioned taxa in order to cover a wide range of dispersal abilities and life history strategies. These will have different appeals to amateur naturalists and will have different degrees of detectability.
While many procedures are generally needed to filter biodiversity databases before assessing inventory completeness (Meyer et al. Reference Meyer, Weigelt and Kreft2016; Stropp et al. Reference Stropp, Ladle, Malhado, Hortal, Gaffuri, Temperley, Olav Skøien and Mayaux2016), the CKmap database was subjected to in-depth scrutiny before being released into the public domain (Ruffo & Stoch Reference Ruffo and Stoch2006); the data consist of literature and museum records and unpublished observations gathered by a large network of professionals. The taxonomic backbone of the database was that created within the Checklist of the Italian Fauna project (www.faunaitalia.it/checklist). Every record was georeferenced through the aid of the national-level gazetteer and all records were mapped on a 10 × 10 km Universal Transverse Mercator (UTM) grid. Dubious data or those that could be not be georeferenced with accuracy were excluded or flagged by specialists in the database with a blank entry in the field containing the alphanumeric code of the 10 × 10 km UTM grid squares (Ruffo & Stoch Reference Ruffo and Stoch2006). Here, we cleaned the dataset according to three criteria: we excluded records which had no 10 × 10 km UTM grid square data; we eliminated duplicate records by screening for unique combinations of species name, date of collection and the alphanumeric code of the 10 × 10 km UTM square; and we assessed the validity of the 2290 species names by submitting the species and subspecies names to the Global Names Index (http://gni.globalnames.org). We selected only records for which names of species and subspecies matched those provided with a match score of 0.988 or more (1 indicates a complete match between the string to be checked and a valid taxon name in the core database; a score of 0 indicates no match).
Assessing inventory incompleteness and trends in data collection
Incompleteness of inventory assessment was assessed using smoothed species accumulation curves (SACs), which give the expected species richness for a certain number of records for a certain level of species richness, with poorly sampled areas tending towards a straight line, while those of better sampled areas have a higher degree of curvature (Yang et al. Reference Yang, Ma and Kreft2013). The mean slope of the last 10% of SACs reflects the degree of curvilinearity and was used as a proxy for inventory completeness (Yang et al. Reference Yang, Ma and Kreft2013). Shallow slopes (values close to 0) indicate saturation in the sampling and thus low levels of incompleteness, whereas steep slopes reflect high levels of incompleteness. Following Yang et al. (Reference Yang, Ma and Kreft2013), we considered grid cells with slope values of ≤0.05 as well sampled and those with slope values ≥0.05 as undersampled. SACs were calculated by defining sampling units of 50 × 50 km across Italy. For each individual sampling unit, we considered the cumulative number of records and species collected from the end of 1800 until 2006. Estimates of inventory completeness for sampling units with less than 30 records were not calculated. This decision was made after a preliminary analysis in which SACs were estimated for subsets of data by excluding sampling units with fewer than 15, 20 and 30 records. We found that the mean slope of the last 10% of SACs could not be reliably estimated when using fewer than 30 records. Temporal trends in data collection were examined by means of generalized additive models (Wood Reference Wood2006), where the error structure associated was assumed to be Poisson with a log link function. SACs were calculated with the vegan package in R (Oksanen et al. Reference Oksanen, Blanchet, Friendly, Kindt, Legendre, McGlinn, Minchin, O'Hara, Simpson, Solymos, Stevens, Szoecs and Wagner2016).
Correlates of inventory incompleteness
We used three layers to represent the degree of accessibility and bias. We used road density to represent the accessibility of collecting sites, with the data obtained from the digital chart of the world (Danko Reference Danko1992), and we calculated as the total length of roads (km) divided by the area of the 50-km grid cell. Gridded human population density data were obtained from the European Environment Agency (Gallego Reference Gallego2010). Data on the proportions of protected areas were calculated by overlaying a layer of protected areas obtained from the Italian Ministry of Environment (www.pcn.minambiente.it/viewer) with the grids used to map inventory incompleteness.
Ordinary least squares models were used to investigate relationships between explanatory variables and inventory incompleteness. Spatial correlograms and global Moran's I tests showed that spatial autocorrelation was relatively weak but significant for some groups. We therefore re-ran our linear models using simultaneous autoregressive models (Kissling & Carl Reference Kissling and Carl2008) whenever spatial autocorrelation was significant.
RESULTS
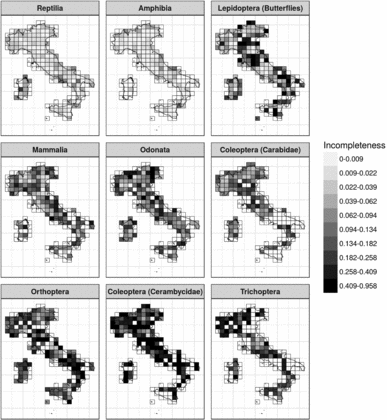
Cross-taxon incompleteness varied from 0.37 to 0.01, showing high levels of incompleteness for most taxa. The only two taxa that showed a mean level of incompleteness smaller than 0.05 were the Amphibia and Reptilia. On the other hand, the taxa that displayed the most incomplete inventories were longhorn beetles (Cerambycidae) and caddisflies (Trichoptera). All the other taxa showed varying levels of incompleteness, ranging from 0.11 for carabid beetles (Carabidae) to 0.20 for grasshoppers and crickets (Orthoptera). When considering within-taxon variation in incompleteness, a significant amount of spatial variation was detected (Fig. 1). However, a consistent latitudinal effect was detected for the six taxa (Supplementary Information Fig. S1 and Fig. S3, available online), with an increase of incompleteness occurring with a decrease in latitude, indicating that areas in Southern Italy had more incomplete inventories.
Inventory incompleteness (the slope of the last 10% of species accumulation curves for grid cells with at least 30 samples at the 50-km grid scale) for the nine groups. A value >0.05 for the slope indicates insufficient sampling. Blank areas indicate squares that had an insufficient number of records for calculating species accumulation curves (<30 records).

Human population, road and protected area densities were negatively related to inventory incompleteness (Table 1), indicating that areas with a high density of collecting occurred mostly in densely populated areas, with a higher density of roads and protected areas. Although statistically significant effects were detected for all the variables, there was no apparent consistency in the effects across taxa. Only butterflies and reptiles displayed significant effects for more than one variable, with human population and protected area densities being important for butterflies, and road and protected area densities important for reptiles.
Results from ordinary least squares and spatial autoregressive models explaining inventory incompleteness for the nine species groups. Significance: ***p < 0.001, **p < 0.01, *p < 0.05. Standard errors shown in parentheses.

With the exception of butterflies and longhorn beetles, there was a general increase over time in sampling for nearly all taxa (Fig. 2); however, from 1950 onwards, there were marked differences in peaks of collection among taxa (Supplementary Material Fig. S2). These were highly non-linear, showing different collection peaks occurring across the period considered. With the exception of butterflies and longhorn beetles, all taxa showed a decrease in sampling in the most recent years. For species included in the Habitats Directive (Trouwborst Reference Trouwborst2011), there was an increase in records 12 years before (1980–1991) and a decrease after (1992–2004) the introduction of the Directive (Fig. 3). The collection trends for these groups mirrored those of all the species pooled together (Fig. 3).
Cross-taxon trends in record accumulation calculated using all the data. Trends were calculated using generalized additive models fitted to the number of occurrence records aggregated by year. A Poisson distribution with log link was specified for the error of the models. Confidence intervals around trends are shown in grey.

Cross-taxon trends in record accumulation for all species and species included in the EU Habitats Directive. For the purpose of comparison, trends were calculated for 12 years before and 12 years after the introduction of the Habitats Directive (in 1992). Trends were calculated using generalized additive models fitted to the number of occurrence records aggregated by year. A Poisson distribution with log link was specified for the error of the models. Confidence intervals around trends are shown in grey. Cerambycidae, Carabidae and Trichoptera were not included in this analysis because it was either not possible to estimate trends for species included in the Habitats Directive (only one species for Carabidae) or there were no data for species included in the Habitats Directive.

DISCUSSION
We found severe deficiencies in the completeness of the faunistic inventories examined, including spatial, temporal and taxon-specific biases. With the exception of butterflies, invertebrate inventories display the highest levels of incompleteness. A significant proportion of spatial biases are related to the accessibility of areas for collection and human population and protected area densities. These findings are in line with recent continental and global-scale studies that have shown that areas with easy access and good transportation infrastructure have more completed biodiversity inventories (Engemann et al. Reference Engemann, Enquist, Sandel, Boyle, Jørgensen, Morueta-Holme, Peet, Violle and Svenning2015; Meyer et al. Reference Meyer, Kreft, Guralnick and Jetz2015, Reference Meyer, Weigelt and Kreft2016) and that a higher proportion of protected area has a positive effect on the completeness of biodiversity inventories (Ballesteros-Mejia et al. Reference Ballesteros-Mejia, Kitching, Jetz, Nagel and Beck2013). An interesting result is represented by the correlation between human population density and inventory incompleteness. While this result would seem to suggest the existence of a sampling effect, it has been shown that the relationship between high biodiversity and humans may also be caused by other mechanisms. These may be related to humans having historically tended to settle in higher numbers of regions of medium to high productivity or having made habitats more diverse, either consciously or inadvertently (Ficetola et al. Reference Ficetola and Padoa-Schioppa2009; Fattorini et al. Reference Fattorini, Galassi and Strona2016).
More generally, our results highlight the difficulty in achieving completeness in biodiversity inventories, even for a relatively small area, and that trends in record accumulation for species included in the EU Habitats Directive did not show an increase after the introduction of the Directive in 1992. This result indicates that reaching important conservation targets for these species of international conservation concern may be hampered by the lack of data. While species included in the Habitats Directive are often the subject of specific conservation actions, accurate information about their distribution is a prerequisite for identifying areas in need of further conservation action.
Globally, the numbers of records have increased over time for most taxa. However, large gaps still exist, indicating that Southern Italy remains in need of further data collection. While record accumulation after 1950 is undoubtedly related to a period of expansion of zoological research in Italy (Canova et al. Reference Canova, Bertolino, Cagnin, Cagnolaro, Martinoli, Merli, Nieder, Prigioni, De Marinis, Meriggi and Apollonio2004; Ruffo & Stoch Reference Ruffo and Stoch2006), trends from 1950 to the early 2000s revealed important differences among taxa. Notably, amphibians and reptiles showed peaks in data collection during the 1980s and 1990s, coinciding with a citizen science initiative aimed at producing regional and national atlases for these two taxa (Sindaco Reference Sindaco2006); it substantially increased the completeness of the inventories for these two taxa, demonstrating that the collection of data by volunteers can fill gaps in biodiversity inventories within a relatively short timeframe. Unlike amphibians and reptiles, mammals showed no substantial peaks in sampling. This may appear rather surprising given the popularity of this taxon among professional zoologists and amateurs alike. We believe that this gap likely reflects the difficulties in data collection and species identification for some groups, like bats and many small mammals, and the absence of any specific national project involving volunteers until very recently (see www.therio.it and the mammalian section in www.ornitho.it). Most of the invertebrates showed heterogeneous trends in sampling, including a constant increase and nonlinear trends with several sampling peaks. While it may not be possible to identify a common set of causes responsible for generating these apparently idiosyncratic trends, it must be noted that until recently invertebrate sampling in Italy had been mostly carried out by a few professional zoologists.
The high level of incompleteness for most insect inventories is likely to mirror a more global situation, reflecting the sparseness of insect occurrence datasets (Ballesteros-Mejia et al. Reference Ballesteros-Mejia, Kitching, Jetz, Nagel and Beck2013). While continental or global-scale distributional information exists for vertebrates and vascular plants, equivalent databases for insects are in their infancy (e.g. Ballesteros-Mejia et al. Reference Ballesteros-Mejia, Kitching, Jetz and Beck2017). Obvious difficulties in the identification of many insect species exist, but given their fundamental contribution to biodiversity and ecosystem functioning (Cardoso et al. Reference Cardoso, Erwin, Borges and New2011), it is imperative to fill knowledge gaps for this important component of animal diversity. If accumulation of insect knowledge in Italy were to follow the trends of the past two centuries of sampling, filling gaps would not be feasible within the timeframe of important political targets, such as those of the CBD. Given the current global biodiversity crisis, such knowledge is required within shorter timeframes and therefore alternative solutions must to be sought. There is no doubt that collection efforts by professional biologists will continue to improve knowledge of the distribution of insects. However, new means of rapidly collecting considerable amounts of data have the potential to improve the completeness of insect inventories within short timeframes. For instance, citizen science programmes could significantly improve knowledge of the distribution of many species. A number of successful citizen science programmes have recently started in Italy (CSMON-LIFE, LifeMIPP, ornitho.it) and have gathered significant amounts of data within short timeframes. For instance, an ongoing national atlas project on dragonflies involving experts and volunteers collected nearly 50 000 new records in a few years (Riservato et al. Reference Riservato, Fabbri, Festi, Grieco, Handersen, Landi, Utzeri, Rondinini, Battistoni and Teofili2014). Although certain limitations exist in citizen science datasets, appropriate analytical methods for extracting distributional trends exist (Isaac et al. Reference Isaac, van Strien, August, de Zeeuw and Roy2014) and new methods for estimating species richness are being developed (Guillera-Arroita Reference Guillera-Arroita2017). The role of citizen scientists in taxonomic research and biodiversity monitoring is now widely acknowledged (Fattorini Reference Fattorini2013). With recent reductions in research funding and the increasing scale of environmental issues, the potential application of citizen science to biodiversity research is greater than ever (Gardiner et al. Reference Gardiner, Allee, Brown, Losey, Roy and Smyth2012). Active collaborative efforts that include scientists, land managers and citizen scientists will not only contribute to the achievement of Aichi Target 19, but also to the conservation of biodiversity under environmental change. In particular, the combination of citizen science initiatives with periodic updates on the completeness of biodiversity inventories and the use of appropriate modelling techniques is likely to represent a promising avenue in the identification of those areas and taxa that will be most affected by environmental change.
Implications for conservation
Species occurrence data are required for nearly all research undertaken in ecology and conservation. This includes conservation planning and predicting the effects of climate on species distributions. For instance, occurrence data are required to assess the status of species within the International Union for Conservation of Nature (IUCN) red list framework (International Union for Conservation of Nature 2001) and to map species richness for protected area expansion. As the window of opportunity for achieving Aichi Targets 11 and 19 begins to close, the production of robust biodiversity trends and the expansion of the current global network of protected areas are becoming more pressing than ever. In this respect, a number of global- and regional-scale assessments have been carried out. However, these have exclusively focused on a few taxonomic groups. Enlarging the taxonomic breadth of these analyses seems to be an essential requirement given that the surrogacy effects of popular taxa such as vertebrates have been questioned (e.g. Rodrigues & Brooks Reference Rodrigues and Brooks2007). It is important to fill knowledge gaps for invertebrates, especially in order to expand the taxonomic breadth of conservation planning or biodiversity trend analyses. Many invertebrate species are necessary for the production of a number of ecosystem services and are therefore indirectly necessary for peoples’ lives. Supporting services provided by invertebrates include nutrient recycling, soil formation and acting as a food source to other species. Without reasonable information regarding the distributions of insect species, it is impossible to know which species are endangered and where to concentrate efforts to preserve insect diversity and the ecosystem services this delivers.
CONCLUSION
Severe biases, gaps and uncertainties are prevalent in faunistic databases, hampering use of this information in biodiversity research and towards hitting international conservation targets. Filling gaps would require prioritization of efforts to collect additional data and to enhance the quality of the data already available. A combination of citizen science and professional biological approaches holds promise; however, achieving these goals for all taxa within a short timeframe may not be easy. More effort is needed to understand how to make the most use of limited information. This would include the development of appropriate analytical methods for analysing sparse data and the use of flexible modelling tools for overcoming data limitations.
ACKNOWLEDGEMENTS
We thank Simone Fattorini and an anonymous reviewer whose feedback was very valuable in revising our manuscript.
FINANCIAL SUPPORT
This study was partly funded by the LIFE+ project CSMON-LIFE. Marco Girardello was also supported by grant from the Fundação Gaspar Frutuoso while writing this manuscript.
CONFLICT OF INTEREST
None.
ETHICAL STANDARDS
None.
Supplementary material
To view supplementary material for this article, please visit https://doi.org/10.1017/S0376892918000115