


Introduction
The expansion of democracy is over. In 2008, there were as many democracies in the world as there are today (Boix et al., Reference Boix, Miller and Rosato2012). Footnote 1 Recent autocratic reversals in Venezuela and Turkey, coupled with the election of leaders like Donald Trump in the United States of America, Boris Johnson in the United Kingdom, and Andrzej Duda in Poland have forced political scientists and the public, in general, to reevaluate the health, state, and meaning of democracy in the 21st century. Why are some liberal democracies with high levels of economic development backsliding?
Among the many factors adduced in the literature as explanations for the recent trend toward democratic backsliding is the rise of populism, leadership agency, voter and political polarization, and economic downturns (Rupnik, Reference Rupnik2007; Kapstein and Converse, Reference Kapstein and Converse2008; Norris, Reference Norris2017; Hanley and Vachudova, Reference Hanley and Vachudova2018). Without denying the importance of these accounts, I want to develop a structural theory of democratic erosion based on a factor that has gone largely unexplored: differences in productivity among economic groups, that is economic polarization.
To be sure, studies have shown that economic factors such as inequality and economic downturns are associated with democratic erosion and breakdowns (Epstein et al., Reference Epstein, Bates, Goldstone, Kristensen and O’Halloran2006; Kapstein and Converse, Reference Kapstein and Converse2008; Houle, Reference Houle2009). Footnote 2 Economic malaise has been linked to a rise in populist movements that exploit social discontent to obtain political power. However, the channels through which greater inequality harms democracy are still unclear. Arguing more generally, I suggest that democratic erosion is driven by both inter-class inequality as well as inequalities in productivity across different economic industries. More specifically, I argue that while inter-class inequality is always a necessary condition for democratic erosion, the type of erosion and its severity will be determined by the size of the productivity gap across industries. Intuitively, the argument is based on the idea that both intra-elite inequality, as well as inter-class inequality, determine the nature of the political coalitions that ultimately gain political influence either in government or in opposition.
I identify two types of democratic erosion driven by inter-class inequality and the productivity gap across industries. These types are (1) outsider takeover and (2) traditional authoritarianism. First, when the productivity gap among different industries is large, elites from losing industries will seek to obtain favorable policies and transfers from the state. At the same time, when inter-class inequality is high, a larger segment of the population is aggrieved and can be lured with populist rhetoric. A political outsider takes advantage of these divisions to create a cross-class coalition, promising targeted protectionism and rents to specific elites that support him as well as favorable labor policies to workers affected by higher inequality. In this type of erosion, the political outsider can knit a cross-class, cross-industry coalition with few veto players. As the political outsider is the key player and cornerstone of the coalition, she can concentrate personal political power and remake institutions to her image. This logic echoes Svolik (Reference Svolik2020), who finds that voters are likely to tolerate anti-democratic policies by incumbents in contexts of high political polarization. Footnote 3
Second, when inter-class inequality is high but the productivity gap across industries is low, established elites and political parties create a united front to maintain hegemony with renewed authoritarianism as a response to the emergence of progressive or leftist parties and increasing unrest. This leads to a traditional form of cross-class redistributive conflict. Freedoms that aid collective action, such as speech or assembly, and certain political parties come under attack. Thus, the first type of democratic erosion is more damaging, as it entails an attack on institutions and the accumulation of power in the hands of a single individual who controls the executive branch. The second entails the strengthening of executive authority at the hands of a ruling or traditional party, which is damaging to freedoms in the short term through policy but leaves other institutions relatively intact, improving prospects for reversal.
Consider the cases of the United States of America and Spain, two countries that have experienced some level of democratic erosion in the past few years. In the United States of America, higher levels of income inequality between 2004 and 2012 provided increasing support for outsider candidates, while the financial crisis of 2008 created a large gap between high and low-productivity industries. These low-productivity industries increasingly turned to the state for protection and rents. A political outsider – Donald Trump – managed to build a cross-class coalition by credibly committing to targeted protectionism to losing industries and better economic prospects to disaffected voters. In Spain, rapid increases in inequality following a housing crisis in 2007 and the global financial crash of 2008 led to the rise of far-left political party Podemos. However, the crises had not produced major differences in productivity across industries, leaving Podemos without any support from the elite. Rather, a unified elite increasingly focused on preventing successful dissent by restricting the right to protest through the ley mordaza, limiting free speech by censoring musicians and opposition figures, and cracking down on the Catalan independence movement (Gomez-Reino and Llamazares, Reference Gomez-Reino and Llamazares2015; Orriols and Cordero, Reference Orriols and Cordero2016; Sola and Rendueles, Reference Sola and Rendueles2018).
This article makes multiple contributions to the literature on democratic backsliding. First, it approaches backsliding from a structural political economy point of view. This is novel in a field where models built around voter attitudes and short-term economic factors abound. Second, it provides a new typology of democratic erosion from a political economy point of view, distinguishing between outsider takeovers and traditional authoritarianism (see Coppedge, Reference Coppedge2017). Third, my model is dynamic in that it considers both the current as well as the future situation of economic industries and elites. Fourth, it adds to evidence that democracy can be selectively bent and tweaked in ways that serve the interests of some groups over others in a manner that goes well beyond what is acceptable from changes in electoral cycles (this need not be elites vs. poor). Since our threshold for a democratic breakdown is high, there is much room for democracy to erode while retaining its classification. Leaders can push the limits of what is tolerable in democracy while incurring lower costs.
Democratic erosion in developed economies
Democratic breakdowns generated a great deal of scholarship in the late 20th century, primarily as a response to the rise of military juntas in Latin America and a revisiting of European democracies before World War II (Linz and Stepan, Reference Linz and Stepan1978; Valenzuela, Reference Valenzuela1978; Bermeo, Reference Bermeo2003). Works on democratization have also included tests of factors that affect democratic breakdowns (Boix, Reference Boix2003; Epstein et al., Reference Epstein, Bates, Goldstone, Kristensen and O’Halloran2006; Houle, Reference Houle2009). However, in recent years, democratic breakdowns have become rare. As Figure 1 shows, the number of democracies and autocracies remained stable between 2005 and 2015. More recently, the number of autocracies has been on the rise again (Lührmann et al., Reference Lührmann, Maerz, Grahn, Alizada, Gastaldi, Hellmeier, Hindle and Lindberg2020). Indeed, most recent data indicate that democratic quality is decreasing around the world, a trend from which advanced economies are not immune (Lust and Waldner, Reference Lust and Waldner2015; Bermeo, Reference Bermeo2016). Footnote 4
Evolution in the number of democracies between 1970 and 2018 (vertical line=2005).

In democracies such as Poland or Hungary, incumbent executives are engaging in a concerted effort to reduce the independence of institutions such as the judiciary or the media. In Poland, Duda and Law and Justice Party (PiS) Chairman Jarosław Kaczyński have systematically attacked the country’s Supreme Court in an effort to wean its powers and act with greater impunity. In July 2017, Parliament passed a law that effectively dismissed all justices on the constitutional court not appointed by Duda. Met with fierce public protests, Duda vetoed the bill, but a new one was introduced in December 2017 lowering the justice’s retirement age to 65 from 70, forcing 21 members, including its Chief Justice, to leave. It also created a disciplinary committee to oversee the actions of the Constitutional Court and allow the PiS to intimidate judges. Orban’s government in Hungary has focused on attacking media independence: 500 media titles now belong to Orban and his cronies, when only 23 did in 2015. Footnote 5
Other countries in Western Europe and the United States of America are also showing worrying signs of erosion. In France, the fight against terrorism by French nationals who joined ISIS prompted ‘repressive and pre-emptive approaches’ within criminal and administrative law. France placed up to 1600 individuals under criminal investigation in the 2 years after the 2015 Paris terror attacks, sometimes with weak or no evidence of wrongdoing and thus lacking due process (Weill, Reference Weill2018). Free speech is becoming less free. In Spain, in a rather comical twist, two puppeteers were jailed for invoking the name of defunct Basque terrorist group ETA in a 2015 show. A rapper was recently given a 3-year prison term for inflammatory lyrics against the Crown – he subsequently fled to Belgium, where he now resides after a judge declined Spain’s extradition request. Footnote 6 Also in Spain, the conservative Popular Party (PP) enacted in 2015 a public security law that curbed freedom of speech and association.
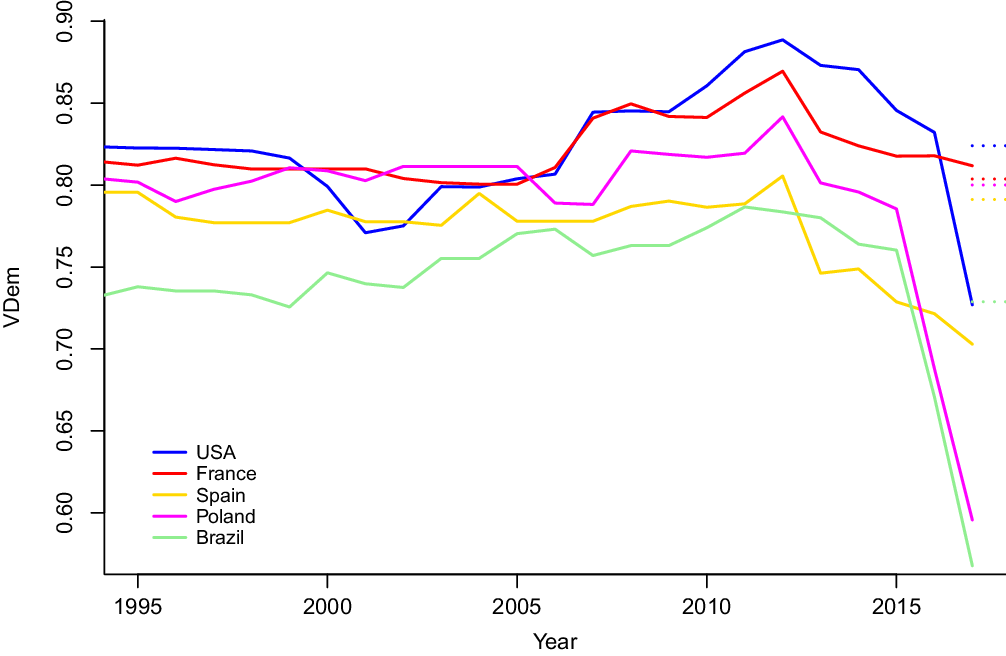
Figure 2 confirms this pattern. Footnote 7 It shows the evolution of V-Dem’s continuous measure of liberal democracy for five developed countries. Democracy kept on its slow but steady progress until around 2012, when a decline begins. Most countries’ scores have since decreased to unprecedented levels, and some to historical lows, as in Spain and Poland. The US score is the lowest since Nixon’s presidency.
Evolution of V-Dem scores by country since 1995.
Lust and Waldner define democratic erosion as ‘a change in a combination of competitive electoral procedures, civil and political liberties, and accountability’ (Lust and Waldner, Reference Lust and Waldner2015). From the examples above, we see that erosion includes, but is not limited to, attacks on judicial independence, media freedom, freedom of speech and association, as well as civil society organizations. To understand why these changes are occurring, and why certain political and economic groups are pushing for weaker democracy in advanced democracies, we need a basic model of domestic politics and the economy.
Models of domestic politics, the economy, and the rise of political entrepreneurs
I make three assumptions about domestic politics. (1) Those who benefit from changes in productivity seek to accelerate them, while the victims work to halt or reverse them. (2) Winners and losers of productivity shocks are forward-thinking and endeavor to expand their political influence. (3) Political elites are agents of both voters and economic interests (Becker, Reference Becker1983; Rogowski, Reference Rogowski1987). I define a productivity shock in this article as a large and sudden increase in productivity for certain industries accompanied by a proportional decrease for others. Footnote 8 . It may occur as a result of technological innovations, as is the case with the online services industry in the United States of America, or better access to global markets and economies of scale. Note that there is a dynamic component to these assumptions, namely, that individuals are as concerned about their current position as they are about their future positions.
In this theory, there are three actors with specific preferences. First, elites from different industries seek to protect and grow their enterprises, both through private investment and innovation as well as through direct lobbying on the government aimed at obtaining favorable regulations. Moreover, industries and firms often have different interests depending on the nature of their business, and as the economy becomes more complex, so do each industry’s demands for government protection and intervention. Moreover, industries do not always enjoy similar rates of growth and productivity, which may exacerbate intra-industry conflict over government regulation. Another key actor is government, which is composed of different political agents who enact policy and often depend on elite support for legitimacy as well as financial resources to be elected and reelected. The third actor is the voters, who are assumed to support the political candidate who most closely represents their interests. Here, I focus on one main political actor: the candidate for the highest political office or its incumbent. To become viable, candidates must obtain broad support from voters as well as sufficient support from the elite. Footnote 9 As I will argue, the nature of the political coalition that a political outsider can weave together lends itself well to democratic erosion, as they can tap into an especially diverse set of voters and elites who require the outsider to fulfill their preferences. These preferences and other assumptions are further developed below.
With these preferences in mind, regarding assumption (1), high-productivity industries invest their resources in becoming more productive and attempt to influence the government to enact policies that facilitate intra-industry growth. Low-productivity industries, to the contrary, will reinvest their capital toward more productive activities only if they reasonably expect the productivity gap to revert to parity in the future – that is, if their investments will pay off in the long run. If they anticipate that investments alone will not suffice, they will accelerate rent-seeking from the state in a way that is proportionate to their expected future losses. An example of this is Silicon Valley vs. industrial and manufacturing companies (both large and small) elsewhere in the country. Over the past 10 years, the productivity gap between these industries has become so large that the only path to sustained growth for the US manufacturers requires strong government intervention involving a certain degree of protectionism. As for assumption (2), economic agents influence the political process in two ways. First, they can lobby Congress and the executive branch through interest groups and other intermediaries in an effort to obtain favorable policies. Second, they can use their financial muscle to back candidates who, once elected, help them achieve policy goals.
In terms of the economy, I simplify the traditional three-factor model of capital, labor and land to only capital and labor, on the justification that the economies of advanced democracies are dominated by these two factors. Footnote 10 As for sectors, I consider the three main sectors – primary, secondary, and tertiary – as well as industries within each of these. For instance, mining, agriculture, and natural resources extraction (not refined) is in the primary sector; manufacturing and industry in the secondary sector; and banking, finance, e-commerce, retail, social media, and software companies, among others, in the tertiary. Footnote 11
Within a Ricardo–Viner (RV) framework, capital is immobile and tied to specific sectors while labor is mobile. After an economic shock, unemployment surges among low-skilled workers and overall worker productivity decreases. In the short term, capital is locked within sectors and those with low productivity have little room for improvement through new investment. In the long term, capital is more mobile – and more so in advanced economies where the costs of moving capital are low. However, in the presence of large productivity shocks as defined here, where some industries see large increases in productivity while others suffer large downfalls, the short-term negative effects on losing groups affect their long-term thinking. In the short term, these industries focus on maintaining their shrinking income at all costs, and not all can reinvest it into new productive activities without going under. In addition, making the move to an entirely new and highly productive activity is more difficult across industries than it is within the same industry. Footnote 12 Across industries, however, companies cannot adopt rapid changes in activity, focus, and investment while expecting large returns. The same applies to labor: low-skilled manufacturing workers cannot switch to highly productive industries in the short and medium terms. The larger the gap across industries, and the more different these industries are, the more difficult it will be for low-productivity companies and workers to move into high-productivity industries. Footnote 13 The only alternative for losing groups are regulatory changes, and hence state action, to restore parity. Footnote 14
Politically, the key tension is that government cannot always produce policy that is compatible across industries or classes. Too much redistribution to the lower (higher) classes, and government antagonizes economic elites (the poor). Similarly, too great a focus on a given set of policies, and government risks antagonizing one set of economic elites against another set – for instance, strong pro-environment policies may raise eyebrows among traditional nonrenewable energy industries. Democracy survives in balancing out these interests, at least to the extent that no group has sufficient collective action capacity to take power unilaterally and impose its will on the rest (Przeworski, Reference Przeworski2005).
Furthermore, in democracy, economic elites do not rule. Neither does the super elite (or ‘oligarchs’, using terminology from Winters (Reference Winters2011)). Rather, these groups influence politics through the power of their wealth. Their resources allow them to hire armies of professionals in law, economics, and policy that help them obtain the outcomes they crave: (1) preservation of wealth and (2) preservation of income. Winters argues that democracy preserves wealth through the rule of law, and that our two actors, the elite and the super elite (or ‘oligarchs’), focus solely on reducing their income tax burden through favorable government policy (Winters, Reference Winters2011). However, this is true only if long-term property preservation is unquestioned. If economic elites perceive a threat to their wealth, their instinctive reaction will be to pursue policies that further secure their wealth – not only their income. I contend that democracy is most at risk when economic groups are concerned with wealth preservation and not solely income preservation.
There are two manifestations of this switch to wealth preservation that strain democratic norms and procedures: regulatory conflict resulting from a large productivity gap across industries and redistributive conflict between classes. One of the main contributions of this article is to consider whether the political effects of splits within the economic elite affect democratic erosion, a political outcome. I now develop each of these claims separately.
Inter-class inequality and conflict
Inter-class inequality is known to accelerate democratic backsliding, but the reasons remain inconclusive (Houle, Reference Houle2009). I take the long-standing view that high inequality generates popular discontent (Gurr, Reference Gurr1970; Inglehart and Norris, Reference Inglehart and Norris2016), but I argue that popular discontent causes two different outcomes at the elite level. These two outcomes depend on the level of cohesion among elites, and in particular how polarized different industries are in terms of their productivity. If industries are more or less equally productive, economic elites work together to placate a rebellious working class. This unity is produced precisely by the fact that industries have a relatively equal stake in maintaining the status quo. Labor suffers from a collective action problem, and elites need to make sure they do not overcome it. Since industries put pressure on political elites (as per my assumption 1) to enact policies favorable to their cause, they push for greater restrictions to freedom of speech, assembly as well as the rights and reputations of key political figures tasked with channeling discontent into policy change. The agent for these united elites is traditional political parties, which grow increasingly authoritarian. These parties are, in fact, a natural ally: they also do not want new parties to challenge their position of political power.
High inter-class inequality in advanced democracies is usually the result of lower wages in the wake of negative economic shocks. Advanced economies tend to offer workers higher wages and implement laws that protect labor rights. Capital accepts higher labor costs and protections provided productivity stays high. If productivity decreases, labor’s compensation is ultimately adjusted downward, as are other benefits, to match low-productivity levels. The model predicts that those factors that experience the negative consequences of low productivity will seek to reverse them. Thus, political conflict commensurate with the scale of the adjustment ensues, as labor tries to regain their losses through political reform. An economic crisis or shock usually precipitates, or exacerbates, the conflict. It is important to note that, while cross-class inequalities are usually persistent across time, this is not true after economic shocks, when inequalities can surge in a short time span of a few years (see Piketty, Reference Piketty2014). Footnote 15 Similarly, the effects of inequality can also accumulate over time as labor’s share of income slowly decreases, which has been the experience of many advanced economies since the 1970s. This gradual build-up of discontent made unrest more likely after, in this case, the 2008 economic crisis.
These developments were particularly notorious in Southern Europe after the 2008 economic crisis. In Spain, labor reform was central to the EU’s efforts toward full recovery, and was often a nonnegotiable condition imposed by the European Central Bank (ECB) in exchange for bank bailouts and zero-interest loans. Reforms were deep. They focused mostly on facilitating and reducing the costs of layoffs for companies, while providing greater flexibility to offer short-term contracts. Salaries decreased substantially as a result. The adjustment led to popular protests and the 15 May Movement, which in turn sowed the seeds for the growth of a radical left-populist party, Podemos, which would find itself leading the polls in late 2014.
Other countries in Southern Europe enacted similar ECB-imposed reforms. One such notorious case was Greece, where a large gap in accounting of the nation’s debt under Papandreou’s socialist PASOK government (2009–11) in the midst of the global financial crisis unleashed a period of major domestic adjustment. The austerity measures taken under the conservative government of Antonis Samaras (2012–15) consisted of raising taxes and introducing labor market reforms aimed at increasing competitiveness, but which in the short run produced lower wages and higher unemployment. Syriza, a coalition of the radical left similar in nature to Spain’s Podemos, rose from 4.6% of the vote in 2009 to 27% in late 2012. When it won the elections in 2015, it obtained 36.3% of support. In the United States of America, a similar situation occurred: inter-class inequality widened as a consequence of the Great Recession of 2008, resulting in greater unemployment, lower salaries, and worse benefits in areas precisely where worker productivity was the lowest. Footnote 16
Hence, high inter-class inequality contributed to the emergence of movements and political parties that aimed, at least initially, Footnote 17 to advance the interests of the working class at the expense of capital. In the case of Spain, the absence of an explicit bailout and the conversion of ballooning private debt into state debt kept the elite sufficiently powerful to stifle the rise of Podemos. In Greece, a tough and highly publicized bailout discredited ruling parties and weakened the private sector to the extent that they were overrun by Syriza. But Syriza eventually took power in Greece, preventing (or delaying) the more repressive measures against dissent that Spain adopted during Mariano Rajoy’s tenure (2011–18).
Institutions such as chambers of commerce, business associations, lobbying groups in Parliament, as well as personal relationships among top-level economic and political leaders, all serve the purpose of converting economic power into political power. In Spain, the CEOE is a prime example of such an institution. Footnote 18 Moreover, traditional political parties and their incumbents are receptive to these lobbying efforts, forming a natural alliance with the economic elite. Both groups, political and economic elites, see their wealth and power threatened by the same actor.
To do so, ruling parties use gradually more authoritarian tactics, targeting primarily those rights and freedoms that directly affect the popular movement’s collective action capacity. This is what I refer to as ‘traditional authoritarianism’, or democratic erosion through increasingly authoritarian incumbents from well-established political parties. In Coppedge (Reference Coppedge2017), this corresponds to a particular erosion path, namely, the one where there is ‘growing repression of speech, media, assembly, and civil liberties’. This deterioration can happen under both liberal and conservative governments, even though the latter is more common in the recent erosion wave. In the case of Spain, a move to limit speech and assembly gathers pace after 2014, when cases against satirical magazines, rappers, and puppeteers are brought before the courts. The ley mordaza, which limits gatherings, is the PPs main political measure of 2015 and can be traced to the May 15th movement and the emergence of Podemos as a major political threat.
Aside from laws and executive measures against speech and assembly, economic and ruling elites also seek to limit the financial resources of their challenger as well as their access to the media. Economic elites build a wall around the popular movement, starving it of funding to compete with established political parties. In Spain, political parties only obtain funding after contesting elections. The money they receive is proportional to their support in the ballot box. In 2014, without public money and with little support from the economic elite, Podemos had difficulty countering some of the most damning smear campaigns against them. Similarly, a majority of media conglomerates, owned or run by traditional economic elites and supportive of traditional political parties, shunned Podemos. Its leader, Pablo Iglesias, who had gained notoriety as a pundit, now appeared less often on television and only one channel, La Sexta, offered a more positive outlook on him and his nascent party. Other channels and newspapers launched invectives against Podemos and even smeared them with allegations of collusion with the Venezuelan government.
The effect of industry divides on democratic erosion
Inter-industry conflict originates from large disparities in productivity. Productive industries accumulate new wealth rapidly, which translates into better investment opportunities and higher returns in the future. For simplicity, I will reduce the intra-industry productivity gap to exist between any two important economic industries – even though, in complex economies, these differences are multidimensional. Footnote 19 As per my previous assumptions, a low-productivity industry pushes to reverse their adverse position, pursuing new investments if they own sufficient capital and also seeking help from the state in terms of protectionist policy and other transfers. A high productivity industry, on the other hand, seeks to maintain, and slowly improve upon, the status quo. Footnote 20 In this setup, labor is also treated as one actor.
Since these economic groups are forward-thinking, and thus they are equally concerned about their current and future wealth, they know that a large productivity gap in the present is likely to translate into much larger differences in the future. They also know that the two best options for growth are new investments in high productivity activities or automation and government intervention in their favor. In a context of low productivity and rapidly declining revenue, not all companies have the assets and financial muscle to reinvest successfully into productive activities. Some do, focusing on automation and innovation to gain productivity. Yet, other industries which cannot produce investments in a rapidly changing environment require state intervention. As Winters points out, the influence of economic elites on policy in normal times is geared toward income preservation through reducing the net tax paid to the government (Winters, Reference Winters2011). Now they also require favorable governmental policy toward their economic activity, in the form of targeted protectionism, lax regulation, direct subsidies, or even policies that lower the growth of their rivals. However, precisely these groups, as per our assumptions, own a smaller stock of capital and therefore have increasingly less influence on policy.
What these losing economic elites require, therefore, is a political agent to carry out a beneficial policy agenda. In a non-democracy, this situation could be resolved by installing a representative of the ‘losing’ elite in power using some degree of force. In democracy, the political leader requires popular support, which is not often readily available directly to a member of the aggrieved industries. This creates an opportunity for a political entrepreneur, usually an outsider, to emerge and act as an agent for losing elites. The outsider must obtain (1) electoral support and (2) promise low-productivity industries the policy outcomes they desire in exchange for political support. As Kim (Reference Kim2017) argues, trade policy and protectionism have become increasingly targeted, with variable tariffs at the firm or even product level. Greater possibilities for targeted protectionism have given the flexibility to political leaders to make credible promises to specific elite groups. A logical consequence of this is that political outsiders can knit together widely diverse political coalitions. Thus, when productivity differences across industries in the economy are high, the political outsider can make credible promises to a wider array of elite groups who require some form of state support to survive and grow. Footnote 21 In essence, the entrepreneur creates a cross-class coalition with a marked populist vent, crafted by tapping into the discontent that inequality generates and by gaining elite support through targeted protectionism.
A consequence of this diverse and cross-class political coalition is that there is no one single group that can challenge the authority of the political agent or outsider. As long as electoral support remains strong, the political outsider can continue to provide targeted benefits to a diverse array of elite groups and maintain the coalition together. As a result, the leader faces few checks on his authority and has the opportunity to personalize political power in his own hands. Footnote 22 Recent literature has begun to describe how this outsider takes over and erodes democracy. Coppedge (Reference Coppedge2017) argues that democratic erosion follows two paths. One is ‘a classic path of growing repression of speech, media, assembly, and civil liberties, combined with deteriorating political discourse.’ The second ‘involves the concentration of power in the executive at the expense of the courts and the legislature.’ This formulation matches my argument well, as the takeover of political power by an outsider leads to the second form of erosion.
Lastly, note that inter-class inequality and inter-industry productivity gaps are not closely correlated. It is true that, for instance, unemployment may increase in certain industries after a negative productivity shock. However, as in the case of Spain, inequality can increase substantially in the absence of large productivity differences across industries. If a majority of industries lose productivity and reduce their output, the productivity gap across industries will remain stable even if productivity is lower overall, while unemployment will increase. Similarly, inequality can increase after a productivity shock to certain industries, as it did in the United States of America between 2008 and 2012. However, inequality had already been on the rise for a few years before the 2008 financial crisis, which only exacerbated the situation somewhat. This suggests that inter-class inequality and inter-industry productivity differences are not highly correlated. Footnote 23
From this discussion, I conclude that a large inter-industry productivity gap leads to democratic erosion of the most harmful type: through political outsiders who obtain both popular and elite support and who, once in office, aggrandize executive power and undermine democratic institutions. The primary example of this pattern within Organisation for Economic Co-operation and Development (OECD) member states is the United States of America with Donald Trump and the Czech Republic under Babiš (Hanley and Vachudova, Reference Hanley and Vachudova2018).
Data and methods
To capture the level of democracy, I use V-Dem’s continuous liberal democracy index (Lindberg et al., Reference Lindberg, Coppedge, Gerring and Teorell2014). Footnote 24 For inter-industry productivity, I construct a measure of the overall inter-industry productivity gap using data from the OECD. The unit of observation is the country year. Data range from 1961 until 2015 and are available for 124 countries (Schreyer and Pilat, Reference Schreyer and Pilat2001). I perform tests both on the full sample and on a subset of advanced democracies.
To measure inter-class inequality, I use the share of capital that accrues to labor from the Penn World Tables (Feenstra et al., Reference Feenstra, Inklaar and Timmer2016). Footnote 25 The variable captures cross-class differences between capital-holders and labor. The higher the share of output that accrues to wages, the more equal the society. In the tests, I have inverted the laborshare measure to capture increasing inequality at higher values (Houle, Reference Houle2009, Reference Houle2016).
I use productivity data from the OECD to estimate the productivity gap among industries. Footnote 26 Data are available for the following industries: finance, information and communication, professional services, and retail are classified as high productivity industries that fall under the broader ‘business excluding agriculture’ umbrella; and industry, manufacturing, and mining which are group under industrial sectors. I compute an aggregate score for the inter-industry productivity gap by (1) computing all the distances in productivity across industries and (2) adding and normalizing them. The resulting value provides an inter-industry gap ‘score’ for each country year.
To test hypothesis 1, I use a linear OLS model with clustered standard errors at the country level. The theory predicts that inequality is negatively associated with democracy in advanced economies, so I present a model with the entire sample and one with a subset of OECD countries to show the differences. To test hypothesis 2, I use two approaches: (1) an OLS model with country and year fixed effects, in which inequality and the productivity gap have interacted, and (2) finite mixture multilevel modeling, which allows us to distinguish between different trends in democratic erosion for different groups of countries. Footnote 27 We thus model the data in such a way that differences among countries become apparent on their own without imposing assumptions about country trajectories ex ante.
Analysis
I first show descriptive trends in the productivity gap and inter-class inequality for three countries in the sample: the United States of America, Spain, and France. The first two serve as our main examples for outsider takeover (the United States of America) and traditional authoritarianism (Spain), and I include France for reference. Figure 3 shows these trends. In the US, we observe a large productivity gap in 2009, which does not occur in Spain or France, whose productivity gap measure stays relatively constant throughout the period. In terms of inequality, Spain experiences the largest increase from 0.352 to 0.446, a 27% jump between 2000 and 2019. Inequality in the US also increases substantially from a low point of 0.359 in 2002 to a high of .412 in 2011. In France, on the other hand, inequality remains stable for the entire period between 1999 and 2019, peaking at .392 in 2008 and decreasing to a low of 0.376 in 2017. We observe substantial decreases in inequality in both the US and Spain, but democracy remains relatively stable in France.
Descriptive trends for the US, Spain, and France.

Inequality and democratic erosion
I first test whether inter-class inequality is systematically associated with democratic erosion in advanced democracies. Table 1 shows the effect of inequality on V-Dem scores for all democracies in model (1) and OECD countries in model (2). I control for GDP per capita, economic growth, social fractionalization, and previous transitions. A time trend is added to capture the general increase in democracy through time with generally decreasing inequalities. Decade dummies are also included to account for unobservable heterogeneity within certain decades. Footnote 28 While there is no substantively or statistically significant effect for all democracies, the effect for advanced democracies is negative and statistically significant. A one-unit increase in inequality, ranging from 1.97 to 6.15 in the test sample, leads to a 0.368 point decrease in the V-Dem score.
Effects of high inter-class inequality on all and advanced democracies

* p < 0.05, ** p < 0.01, *** p < 0.001. Clustered standard errors are in parentheses.
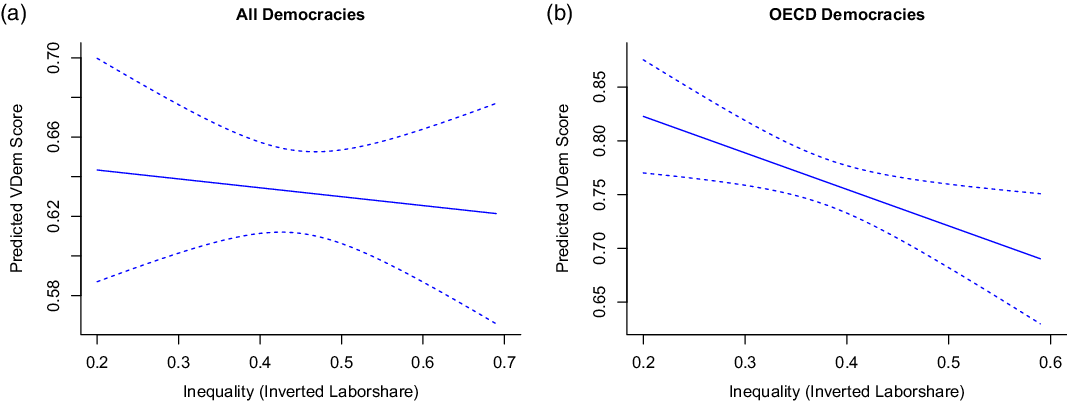
Substantively, the effect is also significant: a one standard deviation change in inequality, which is equivalent to going from middle to high levels of inequality, will decrease the V-Dem score by 0.25 points, a substantive change considering that V-Dem scores range between 6 and 9 for most countries. Similarly, going from low to high inequality (here I use the 20th and 80th percentiles of inequality) will decrease V-Dem scores by almost 0.5 points. Figure 4 shows the predicted value of V-Dem at different levels of inter-class inequality for (a) all democracies and (b) advanced democracies. The effect is negative and statistically significant for advanced democracies. For all democracies, it is only weakly negative and statistically indistinguishable from zero.
Effects of inter-class inequality on V-Dem score.
Effects of inter-class inequality on V-Dem score, by decade.
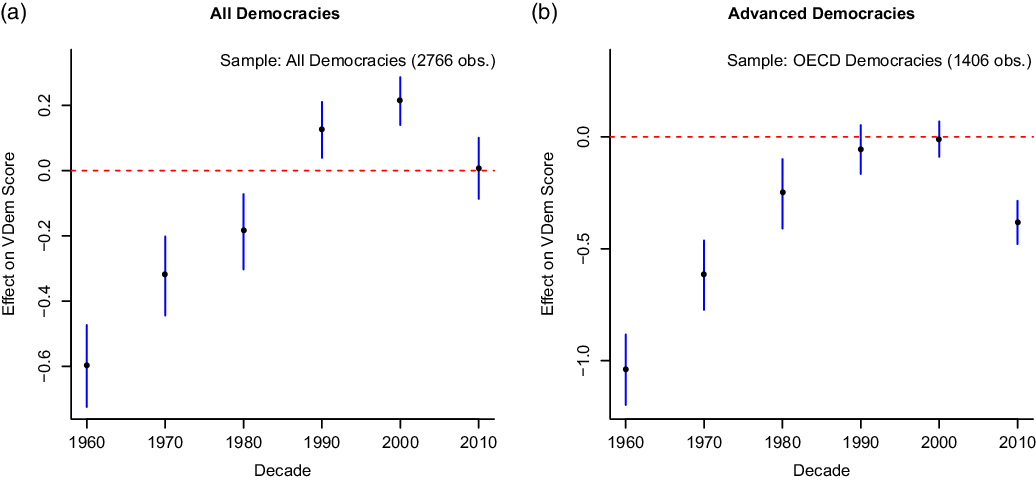
The effects, however, are not consistent across time. Figure 5 shows the effect of inter-class inequality on the V-Dem score of (a) all democracies and (b) advanced democracies have broken down by decade. The results are obtained from a multilevel model with random slopes for inter-class inequality and random intercepts by decade. For all democracies, the effect was strong and negative during the Cold War decades, but reversed afterward. This is due to an influx of post-soviet democracies in the 1990s, whose inequality increased during the transition to capitalism and whose democracy scores surged at the same time. For advanced OECD democracies, higher class inequalities in the 1960s and 70s led to large decreases in predicted V-Dem scores, but the effect disappeared during the 1980s, 1990s, and 2000s. The negative trend reappeared strongly after the Great Recession during the 2010s.
Marginal effects of inequality at high and low levels of the productivity gap.

Inequality, the productivity gap, and democratic erosion
One of the takeaways from Figure 6 is that inequality is unlikely to be the sole driver of democratic backsliding. The evidence for hypothesis 1 is mixed, varying over time and by group, which indicates that another mediating variable is likely involved in eroding democracy besides income inequality. In my theory, I introduce one such variable, the intra-industry productivity gap, which enables either a cross-class coalition or a unified response by the elite to stop redistributionist demands. With this in mind, I test the hypothesis that inter-class inequality and the inter-industry productivity gap interact to produce different forms of democratic erosion. I use both linear fixed effects models as well as multilevel modeling to test this hypothesis.
I first introduce the results from our main OLS models in Table 2. Models (a) through (c) include year fixed effects and country random effects, while models (d) through (f) also include country fixed effects in addition to year fixed effects. Including country fixed effects provides a stronger empirical and theoretical test as it removes unobservable heterogeneity across groups while testing domestic trajectories more directly. For ease of interpretation, the two main variables are a dichotomous measure for high inequality in the sample and one for a high productivity gap. For inequality, I set the cutoff at the mean. For the productivity gap, I set country-year observations to 1 after a major productivity shift, as was the case, for example, in the United States of America in 2009. I control for GDP per capita (logged and lagged one period) and economic growth (lagged one period). Our theory predicts that two coefficients should be negative and significant: those for high inequality when the productivity gap is low, and those for high inequality when the productivity gap is high after a shock. This is precisely what we observe in all the models. The interaction coefficient – when both independent variables are equal to 1 – is negative and statistically significant at the 0.01 level, providing support for the outsider takeover hypothesis. Similarly, when the productivity gap is low (0), the inequality coefficient is negative and significant at least at the 0.05 level in all models, which supports our hypothesis for the traditional authoritarian path to democratic erosion. As expected, the coefficient for the high productivity gap with low levels of inequality is not statistically significant and is lower substantively than the rest of the coefficients. Footnote 29
Effects of high inter-class inequality on all and advanced democracies
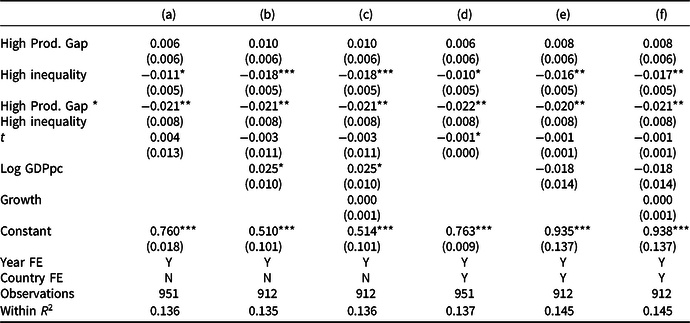
* p < 0.05, ** p < 0.01, *** p < 0.001. Clustered standard errors are in parentheses.
Figure 6 shows the marginal effects derived from the most demanding model (f) in Table 2, which includes both country and year fixed effects. The results are strong and intuitive. The predicted value for V-Dem is always lower when inter-class inequality is high. With a low-productivity gap, the predicted democracy score is 0.013 points lower when inequality is high. The starker difference, as predicted by our theory, is between countries with high and low levels of inequality when a large inter-industry productivity gap exists. The democracy score is predicted to be 0.046 lower in countries with high inequality and a high productivity gap. While these differences may not appear substantively large, the difference between quartiles 1 and 3 in our sample of advanced democracies is only 0.0715 (from 0.7585 to 0.83). Note that while the predicted democracy score is higher when the productivity gap is high in low inequality, the difference is not statistically significant.
A finite mixture model
To provide stronger evidence for this article’s main hypothesis (2), I use a finite mixture model. These types of multilevel models are applied to data that contain observations from various groups but whose affiliations are not known ex ante. That is to say, multiple distributions exist in the data, one for each of the groupings, and finite mixture models help approximate these by not imposing a single distributional assumption (Everitt and Hand, Reference Everitt and Hand1981; Titterington et al., Reference Titterington, Smith and Makov1985; Peel and McLachlan, Reference Peel and McLachlan2000). The model thus groups countries on its own without any manual classification involved – in the previous model, while no classification occurred ex ante, countries were placed into groups ex post. A classic example of data for which finite mixture models are useful is population height, where men and women are distributed differently. Then, if it is true that democratic erosion follows different paths in advanced economies as a consequence of major productivity shifts, we should observe multiple groupings in the data. Footnote 30
In our case, the finite mixture model will produce a posterior prediction for different democratic erosion groupings in the data. The predictions are per observation (country year), not per country group, and therefore we can model how productivity gaps affected the exact democratic trajectories of the US and Spain, our case studies, for the entire period in our sample. We should expect both countries to follow a similar path before their respective shifts toward democratic backsliding (same grouping) and then move in different directions after that (different groupings). The finite mixture model also helps us ascertain statistical significance by calculating confidence intervals for the mean of each set of countries. In contrast, each of the groupings in the finite mixture model has confidence intervals that are easy to compute and interpret.
The variables in the finite mixture model are the same: democracy score (V-Dem) is the dependent variable, and the independent variables are: an interaction between the inter-industry productivity gap measure and inter-class inequality, GDP per capita, economic growth, and country and year fixed effects. We select a set of three groupings (k = 3). The theory posits that there are two types of democratic backsliding, but at least a third grouping is necessary to account for country-year groupings in which democratic backsliding did not occur. Footnote 31
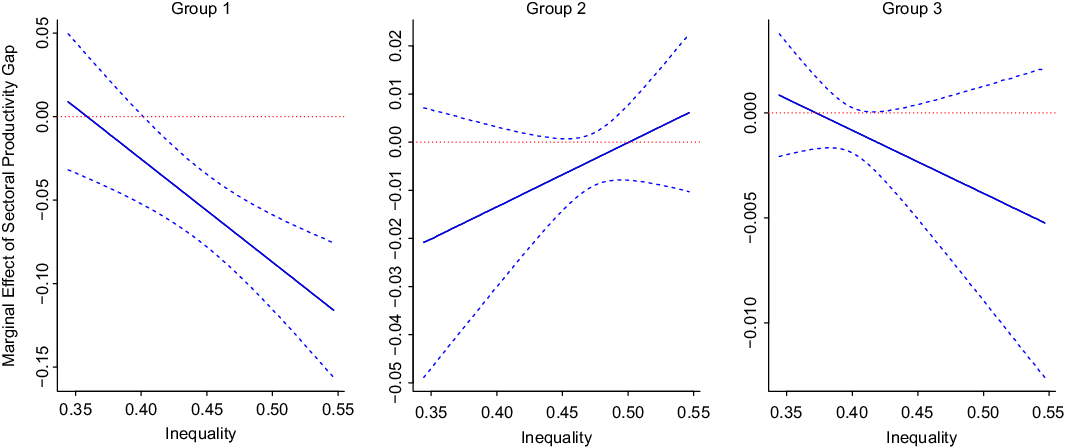
Figure 7 plots the results of the model for each of the three groups. The y-axis represents the marginal effect of the sectoral productivity gap on democracy at different levels of inequality (x-axis). We do not know which group is which ex ante, as this is determined through theory. However, we can extract information from the results and from the examples of Spain and the US, respectively. For Group 1, the slope is negative and the marginal effect of the productivity gap on democracy is strongly significant at medium and high levels of inequality. The model places the United States of America in this group between 2014 and 2019, which is consistent with our theory. Group 2 should be the democratic stability group: the slope is slightly positive but none of the values at either end of the distribution are statistically significant. The slope is weakly negative for Group 3. More importantly, for this group, none of the predicted marginal effects of a one-unit increase in the productivity gap on democracy are statistically significant at any level of inequality. This is consistent with our theoretical expectation of a null result for countries that experience authoritarianism from within. Spain falls within this group in the results in the years where its democracy score declines (see Figure 1). These results and the trajectories of the United States of America and Spain derived from the model serve as persuasive evidence that countries experience different democratic erosion trajectories, even though only because of certain structural shifts in the economy. I now move on to the case studies, which will show in more detail how and why the United States of America and Spain have followed such different trajectories of democratic erosion.
Joint effects of inter-class inequality and the industry-wide productivity gap on V-Dem score, per cluster (from finite mixture model).
Wealth inequality and democratic erosion in Spain
The case of Spain illustrates the traditional authoritarianism typology, where high inter-class inequality but a low inter-industry productivity gap leads to increased pressure on traditional ruling parties to become more authoritarian. Erosion in Spain has come primarily at the expense of basic freedoms, such as speech and association, and not of institutions and veto players. The PP, Spain’s conservatives, led the way with the tacit acquiescence of the main opposition Socialist party. Below, I describe how higher inequality combined with a unified economic elite led to the traditional authoritarianism form of democratic backsliding.
We can trace erosion in Spain back to the crisis of 2007/8. First, the housing bubble burst in 2007 after years of rapid growth. The ECB had maintained low-interest rates at 2% from 2003 to 2006 to help Germany recover from its recession (Reisenbichler and Morgan, Reference Reisenbichler and Morgan2012). With growth at over 4% throughout the period, Spain’s economy overheated through the housing market, as banks borrowed cheap money from the ECB and packaged it into easy loans to consumers. Banks became over-leveraged and consumers were unable to pay their mortgages. The ECB prescribed deep cuts in public spending, labor market reform, and the nationalization of private bank debt as remedies (see Sinn, Reference Sinn2014).
These reforms hurt the middle class and eroded some of the welfare gains made since democratization in 1978. Discontent erupted into large-scale protests on 15 May 15 2011, when millions of citizens marched onto the streets in the country’s main cities and occupied their main squares for months. In 2014, a new political party, Podemos, channeled the movement’s goals and support into the political system under the charismatic leadership of Pablo Iglesias. At inception, the party espoused radical left-wing views, some of which left established economic and political elites in shock. Among these were the widespread nationalization of large corporations in key industries, a large increase in the minimum wage, and a guaranteed minimum income. Its discourse was overtly anti-establishment, popularizing the concept of la casta Footnote 32 to describe established elites who, in their view, had ruined the country’s prospects (Gomez-Reino and Llamazares, Reference Gomez-Reino and Llamazares2015; Orriols and Cordero, Reference Orriols and Cordero2016; Sola and Rendueles, Reference Sola and Rendueles2018). The party won 5 seats and 8% of the vote in the May 2014 elections to the EU parliament, finishing a surprising fourth. General elections in Spain were scheduled for late 2015, and polls showed them leading comfortably (Sola and Rendueles, Reference Sola and Rendueles2018).
As Podemos represented a major redistributive threat, the productivity gap across industries was low. Most industries were similarly affected by crises that beset the Spanish economy in the late 2000s. Banks were particularly weak due to toxic mortgages handed out during the 2003–07 period of rapid growth, and consolidation was inevitable. Footnote 33 Large Spanish construction corporations were heavily affected by the housing crisis and the temporary slowdown in public projects in the years that followed. National utility and telecom corporations, such as Telefónica or Gas Natural, continued to enjoy dominant market positions that would continue no matter the party in power. Clothing giants like Inditex (known for their Zara brand) and Mango had their sights in the global market and looked at Spanish politics with relative disinterest.
Thus, perhaps in part because the housing crisis had ripple effects on almost every part of the economy, there was no obvious elite cleavage that Podemos could exploit to gain elite support. Podemos’ project itself attracted few elites, with promises to nationalize large corporations and large-scale wage redistribution. Instead, elites coalesced to prevent Podemos from taking power in the 2015 elections, where they were favorites to win at the beginning of the year. These efforts produced multiple instances of erosion of democratic norms. There were concerted attacks on the party by a co-opted media environment, greater restrictions on freedom of association, and limitations on freedom of speech. Spurred by economic elites, who funded the emergence of Ciudadanos as a Podemos counterweight, established political elites led the charge in the political arena. Socialists were particularly weary of Podemos, who were agitating their core base of supporters and threatening their long-term dominance. Conservative elites, who were in power at the time, saw Podemos as an outside movement that threatened to break up the constitutional order, which had long been upheld by the traditional parties, PP and PSOE. It certainly did not help matters that Podemos was unapologetically republican, and on multiple occasions intimated that the royal family should be removed from office.
Simultaneously, spurred by chambers of commerce and by intense lobbying from economic elites, the Spanish legislature was preparing legislation that would limit freedom of association. Footnote 34 The public security law of 2015 introduced fines of up to 600,000 euros for demonstrating in front of government buildings and other sensitive locations. Police became more protected, with fines of 600 euros for insulting a police officer and 30,000 for spreading photographs of the police while on duty, making it harder to document abuses. Amnesty International calculates that Spain hands out 80 daily fines on average based on the 2015 gag law. Footnote 35 Police abuses were subject to intense debate after the Catalan independence referendum of 2017. Both Amnesty International and Human Rights Watch criticized the law, calling it a ‘direct threat to the rights to meet peacefully and freedom of speech in Spain’ and the New York Times reported claimed the law ‘disturbingly harkens back to the dark days of the Franco regime.’ Footnote 36 Catalonia’s self-determination bid also led to higher political polarization in Spain. Most notably, it helped fuel the rise of far-right party Vox, which went from relative obscurity in 2017 to garnering 15% of the vote and 52 seats in the November 2019 general elections, finishing third behind the PP and the PSOE.
Freedom of speech was similarly attacked. Legal cases against citizens and satirical publications who criticized the crown became more common. A cover in the popular magazine El Jueves featuring King Juan Carlos I was changed last minute in June 2014 for one featuring Iglesias after alleged pressures from the crown on the magazine’s publisher. Many of its journalists resigned. Footnote 37 In a rather comical turn of events, two puppeteers were jailed for a satirical show featuring jokes about Al Qaeda and ETA, the disbanded Basque terrorist organization. They spent a year in jail for ‘glorifying’ terrorism before a court let them go. Footnote 38 Police also charged two rappers, Valtònyc and Pablo Hassel, with ‘exaltation of terrorism’ as well as offensive lyrics against the Crown. ValtÃ2nyc was given a 3-year jail sentence before fleeing to Belgium, who refused to extradite him to Spain, while Pablo Hassel recently began his 3-year sentence. Footnote 39 Thus, the case of Spain shows that high inequalities with a low-productivity gap lead to increasingly authoritarian tendencies by established political parties, who enact legislation to prevent successful collective action from political groups seeking greater redistribution.
Wealth inequality and democratic erosion in the United States of America
According to V-Dem, democratic erosion in the United States of America began during Barack Obama’s second term – see Figure 2. Democratic quality declined steadily between 2012 and 2016 before a sharper downturn in 2017. Increased polarization within the legislative played a key role in the early phase of democratic erosion in the US. The fast rise of the Tea Party in the early 2010s increased political polarization in Congress, forcing President Obama’s hand into signing many executive orders that would previously have been resolved within the legislative branch. This is reminiscent of arguments by Linz and Stepan (Reference Linz and Stepan1978) and Bermeo (Reference Bermeo2003). However, greater use of executive action, while constitutive of democratic erosion and thus reflected in the data, is not a systematic attack on democratic institutions and values. There is more evidence that this was occurring under Donald Trump (Levitsky and Ziblatt, Reference Levitsky and Ziblatt2018), whose rise to power was intimately tied to polarization within the economic elite rather than the political elite.
My argument is that Trump managed to capture a substantial amount of elite support despite his status as a political outsider, primarily because many low-productivity industries needed favorable policy after the 2008 crisis and only he could provide credible commitments to these industries. Support from these elites was crucial to his successful candidacy in multiple relevant ways. It validated Trump’s candidacy and thus helped him avoid the majoritarian rally against his candidacy that plagued other populists such as Marine Le Pen in France (2017) or Podemos in Spain (2015). Moreover, elite support from different industries made Trump’s coalition diverse in nature, and no single group of elites held outsize power over him. This diversity led to a lack of important players to check his actions which, coupled with the fervent support from his voters, allowed him concentrate personal power. He, not the Republican Party, held the winning coalition from the 2016 election together.
Indeed, during his presidency, Trump attempted to reshape institutions in a way that nullifies referees, such as courts, push out actors that could threaten him, and slowly unbalance the playing field. The tactics and discourse employed by Trump closely resemble the classic authoritarian script (Levitsky and Ziblatt, Reference Levitsky and Ziblatt2018). More importantly for our theory, these traits already were in full display during the 2015-16 Republican primary and presidential campaigns. A populist, nationalist message resonated with a portion of the electorate that identified their economic travails with perceptions of increased immigration, cheap imports, and 8 years of rule by Democrats (Inglehart and Norris, Reference Inglehart and Norris2016). Thus Trump’s rise owes much to the sharp increases in inter-class inequality between 2004 and 2012, which remained high in the years that followed. Trump was able to credibly promise what other traditional politicians had been unable to deliver: better and higher-paying jobs, increased opportunities, lower competition from immigrant labor, and protectionism for key industries. Besides economic promises, Trump also tapped into a growing anti-immigration sentiment, demonizing specific immigrant communities as criminals and blaming them for job losses. This rhetoric allowed for systemic racism and white supremacy in the United States of America to flourish into the open, gaining new sympathizers and attracting them to Trump’s outsider candidacy.
As Trump built his voting coalition, elite cleavages within the Republican bloc began to consolidate. The push by Charles and David Koch to make the Republican Party embrace libertarian ideology took a practical turn in the mid-2000s, when the brothers set their minds to capturing Republican majorities in state legislatures, which would lead to fewer government regulations and lower interference. The focus on the states, however, left the national party leadership hollow, and it became too late to pivot toward greater national presence late in Barack Obama’s second term. Footnote 40 Then the 2008 economic crisis pushed some low-productivity industries to the brink of collapse, and many were unable to redirect their investments toward more productive activities. Hollow national leadership among conservative elites and a financial crisis that had lasting effects on many different industries produced a greater need for government intervention. These cleavages among the elite were at the core of Trump’s emergence and eventual victory in the United States of America.
While many elites within the Republican party initially opposed the rise of Donald Trump, two subsets of the Republican elite came around to support him. The first was primarily natural resource extracting elites in states such as West Virginia and Texas, as well as others who wanted to see projects such as the Keystone Pipeline not sidelined by environmental regulations. The second subset of elites amenable to Trump were the US manufacturers who had lost out with globalization and who saw potential tariff increases and trade disruptions as a positive for their future standing. Footnote 41 Some retail giants serving most of America’s less urban communities also were persuaded by specific promises of protectionism, despite the fact that retail is often against protectionist policies. However, in a highly competitive environment, targeted benefits helped these companies to continue in business and modernize their operations. These elites stood in stark contrast with a high productivity technology sector that is largely behind Democratic candidates. Support from this diverse set of elites provided Trump with the opportunity to build a cross-class coalition spawning many different low-productivity industries. By situating himself at the center of this coalition, and thus not depending on any specific group of elites for economic support, he was able to increase his personal power with fewer checks by traditional veto players.
In sum, the case of the United States of America illustrates how large productivity differences among the economic elite provide an opening for an outsider candidate to persuade disaffected elites with targeted protectionism. Elite support validates the candidacy and helps the outsider avoid a broad national rally against the candidacy. Moreover, by putting together a diverse coalition with lots of separate interests, the outsider places themselves at the center of the coalition and makes it difficult for any given group to challenge their rule. For Trump, as well as for Podemos in Spain, high levels of inequality fueled voter discontent and a push for redistributive conflict, which in turn gave new candidates like Pablo Iglesias and Donald Trump a political base (Inglehart and Norris, Reference Inglehart and Norris2016). However, differences in elite support for these candidates determined their different political fates. A large productivity gap created an opening for Trump, whose nationalist rhetoric translated into early support from elites in many different economic sections with low productivity. Other Republican elites later joined his cause rather than shutting him out of the process. In the case of Pablo Iglesias, a compact economic elite suffering from a small productivity gap made a concerted effort to prevent Podemos from reaching power and succeeded, even if at some point Iglesias had a larger share of voter support in Spain than Trump did in the United States of America for most of his campaign.
Conclusion
In this article, I have argued that economic polarization is at the heart of democratic backsliding. First, high inter-class inequality motivates an aggrieved working class to push for greater redistribution, which has two elite-level effects conditional on the level of unity among the economic elite. If the productivity gap among industries is large, losing industries will equally push for policy change that can help them revert their situation, which they cannot do on their own through investment. With a deep cleavage among elites and popular discontent from high inequality, a political outsider emerges to capture both popular and elite support. This is democratic backsliding through the outsider takeover path, which places democracy most at risk by altering its institutional balance. If productivity across economic industries is more or less equal, these industries use their ascendancy among political actors to quell dissent, preventing it from reaching positions of political power – as it happened with Podemos in Spain. The effort centers on stifling basic freedoms, such as speech and association, to prevent the working class from collectively organizing. Because traditional parties usually aid in this process, I refer to this path as ‘traditional authoritarianism.’
Acknowledgments
The author would like to thank Ernesto Calvo, Mark Lichbach, Sebastián Vallejo, Erik Wibbels, Pablo Beramendi, Jeremy Springman, Serkant Agudizel, Ana Montoya, Diego Romero, participants at APSA’s panel on democracy and democratic backsliding (2019), and three anonymous reviewers for their helpful comments and suggestions.


 Open access

