


INTRODUCTION
Over the last couple of decades, considerable effort has been devoted to developing substantially improved 14C calibration curves that better reflect past atmospheric radiocarbon (14C) concentrations, and this has led to the latest suite of calibration curves, including IntCal20, which is used for the calibration of Northern Hemisphere terrestrial samples (Reimer et al. Reference Reimer, Austin, Bard, Bayliss, Blackwell, Bronk Ramsey, Butzin, Cheng, Edwards and Friedrich2020). Similarly, SHCal20 has been individually developed for the calibration of Southern Hemisphere terrestrial samples (Hogg et al. Reference Hogg, Heaton, Hua, Palmer, Turney, Southon, Bayliss, Blackwell, Boswijk, Bronk Ramsey, Pearson, Petchey, Reimer, Reimer and Wacker2020). This is because 14C data obtained from tree rings from the Southern Hemisphere are depleted relative to those from the Northern Hemisphere, and the degree of north–south hemispheric 14C offset is not stable but varies temporally (e.g., McCormac et al. Reference McCormac, Hogg, Higham, Lynch-Stieglitz, Broecker, Baillie, Palmer, Xiong, Pilcher, Brown and Hoper1998; Hogg et al. Reference Hogg, McCormac, Higham, Reimer, Baillie and Palmer2002). Another important factor that contributes to the accuracy of 14C dating is inter-hemispheric air mass mixing, which appears to be significant in tropical and a few subtropical regions influenced by monsoon circulations (Hua and Barbetti Reference Hua and Barbetti2007). Moreover, the seasonal position of the tropical low-pressure belt (TLPB; Figure 1) associated with monsoon circulations is temporally and spatially variable (Ancapichún et al. Reference Ancapichún, De Pol-Holz, Christie, Santos, Collado-Fabbri, Garreaud, Lambert, Orfanoz-Cheuquelaf, Rojas, Southon, Turnbull and Creasman2021; Hua et al. Reference Hua, Turnbull, Santos, Rakowski, Ancapichún, De Pol-Holz, Hammer, Lehman, Levin, Miller, Palmer and Turney2022), indicating that the degree of north–south air mass mixing is also unstable. The entire period of the IntCal20 and SHCal20 calibration curves cannot be used to accurately date samples from regions influenced by the TLPB. Therefore, producing new calibration curves for these regions (e.g., the NH zone 3 or SH zone 3 defined by Hua et al. Reference Hua, Turnbull, Santos, Rakowski, Ancapichún, De Pol-Holz, Hammer, Lehman, Levin, Miller, Palmer and Turney2022) will be necessary if we wish to move toward more accurate 14C dating.
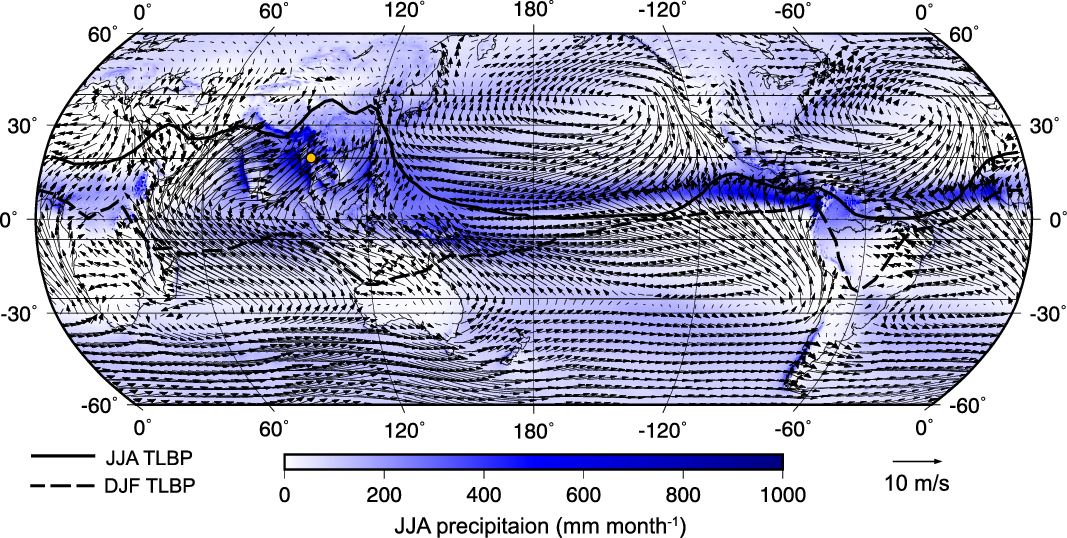
Global map showing the location of our sampling site (orange circle) and climatological components. The long-term (1950–2019 CE) mean surface wind vectors and precipitation (mm month−1) for the June–August period are represented by arrows and blue shading, respectively, and were derived from the ERA5 dataset (Hersbach et al. Reference Hersbach, Bell, Berrisford, Hirahara, Horányi, Muñoz-Sabater, Nicolas, Peubey, Radu and Schepers2020). The mean positions of the TLPB during June–August (JJA: solid line) and December–February (DJF: dashed line) were derived from Hua et al. (Reference Hua, Turnbull, Santos, Rakowski, Ancapichún, De Pol-Holz, Hammer, Lehman, Levin, Miller, Palmer and Turney2022) and are based on the NCEP/NCAR sea level pressure data. (Please see online version for color figures.)
Most tropical trees do not form annual growth rings owing to a general lack of climatic seasonality, making it difficult to obtain reliable dendrochronological dates. However, there are some regions with distinct wet and dry seasons induced by the seasonal driver of the monsoon. Northern Thailand is one such region, and tree-ring chronologies have been successfully established using two species of mountain pine (Buckley et al. Reference Buckley, Barbetti, Watanasak, D’Arrigo, Boonchirdchoo and Sarutanon1995) and also teak (Pumijumnong et al. Reference Pumijumnong, Eckstein and Sass1995; Buckley et al. Reference Buckley, Palakit, Duangsathaporn, Sanguantham and Prasomsin2007). A 448-yr chronology (1558–2005 CE) based on ring widths from teak is the longest tree-ring record yet produced from Thailand (Buckley et al. Reference Buckley, Palakit, Duangsathaporn, Sanguantham and Prasomsin2007). Extending this chronology further back is challenging, as the older teak trees have been almost entirely removed by logging. Fortunately, archaeological remains of wooden materials made of teak have been preserved in dry caves, and these are important at least for the development of a floating chronology (Pumijumnong and Wannasri Reference Pumijumnong and Wannasri2015).
Pumijumnong et al. (Reference Pumijumnong, Bräuning, Sano, Nakatsuka, Muangsong and Buajan2020) constructed a teak tree-ring δ18O chronology for northwestern Thailand covering the period 1678–2015 CE. Compared with conventional dendrochronology based on ring widths, oxygen isotope ratios in tree rings are well correlated between different trees (e.g., Sano et al. Reference Sano, Ramesh, Sheshshayee and Sukumar2012a, Reference Sano, Xu and Nakatsuka2012b). Therefore, tree-ring δ18O data can be used to robustly date a dataset with a limited number of tree-ring samples even if the ring width series cannot be cross-dated by conventional dendrochronological analysis (Loader et al. Reference Loader, Mccarroll, Miles, Young, Davies and Ramsey2019; Sano et al. Reference Sano, Li, Murakami, Jinno, Ura, Kaneda and Nakatsuka2022). In addition, being controlled simply by two climatic parameters (i.e., the δ18O of precipitation and relative humidity), tree-ring δ18O can be used to precisely reconstruct past hydroclimatic variations, such as during the summer monsoon season in Southeast Asia (Sano et al. Reference Sano, Xu and Nakatsuka2012b; Xu et al. Reference Xu, Sano and Nakatsuka2013; Pumijumnong et al. Reference Pumijumnong, Bräuning, Sano, Nakatsuka, Muangsong and Buajan2020). Therefore, we used the climatic strength of tree-ring δ18O to test whether tree-ring δ18O can act as a proxy for inter-hemispheric air mass mixing. Based on radiocarbon preserved in tree rings from Thailand, Hua et al. (Reference Hua, Barbetti and Zoppi2004a, Reference Hua, Barbetti, Zoppi, Fink, Watanasak and Jacobsen2004b) proposed that northward movement (∼30°N) of the intertropical convergence zone (ITCZ) during boreal summer stimulates the incursion of air parcels originating in the Indian Ocean or the Southern Hemisphere. The supply of moisture from areas far from the tree-ring site is assumed to reflect an intensified summer monsoon that leads to wetter conditions, and these conditions are precisely recorded as a decrease in teak tree-ring δ18O preserved in Thailand (Pumijumnong et al. Reference Pumijumnong, Bräuning, Sano, Nakatsuka, Muangsong and Buajan2020). Collectively, an increase in the air mass flow from the tropical Indian Ocean, which is an area of intense upwelling with a lower 14C concentration than the atmospheric 14C level, could possibly be detectable using measurements of both tree-ring 14C and δ18O.
In the present study, we developed a 297-yr floating chronology using seven tree-ring δ18O series obtained from teak log-coffin samples from the Ban Rai rock shelter site, northwestern Thailand. The floating chronology was then anchored by wiggle-matching calibration. Based on earlier findings (Hua and Barbetti Reference Hua and Barbetti2007), our wiggle matching was conducted using a mixed calibration curve evenly weighted from the IntCal20 and SHCal20 curves. Subsequently, the link between modern tree-ring δ18O (Pumijumnong et al. Reference Pumijumnong, Bräuning, Sano, Nakatsuka, Muangsong and Buajan2020) and air mass transport from the Indian Ocean was scrutinized using backward trajectory analysis. Finally, we explored the possible linkage between summer monsoon intensity and 14C offset from the SHCal20 curve using the tree-ring δ18O and 14C records.
MATERIALS AND METHODS
Study Site and Sampling
The tree-ring samples used for this study were collected from coffins, pillars, and beams at the Ban Rai rock shelter site (19°33′N, 98°11′E), which is located at an elevation of 793 m above sea level (asl) on a hillside in Mae Hong Son Province, northwestern Thailand (Figure 1). The rock shelter has a horseshoe-shaped south-facing opening, and is approximately 105 m wide by 142 m long (Pumijumnong and Wannasri Reference Pumijumnong and Wannasri2015). The shelter is situated under an overhanging cliff, which is 30 m high and limits the direct influence of precipitation. Log coffins, resting on two or three pairs of pillars, were interred at the site, and a detailed description of the excavation can be found in Treerayapiwat (Reference Treerayapiwat2005). All samples obtained from the shelter were made of teak (Tectona grandis L.), which produces annual growth rings, and increment cores or thin blocks were collected from the teak for tree-ring analysis.
Tree-Ring Oxygen Isotope Data
Isotope analysis was carried out on a total of seven samples from seven different trees, each of which contained more than 100 rings. Cellulose was isolated directly from 1-mm-thick tree-ring laths (Xu et al. Reference Xu, Sano and Nakatsuka2011; Kagawa et al. Reference Kagawa, Sano, Nakatsuka, Ikeda and Kubo2015). This method allows us to preserve the anatomical structure of the wood during the chemical treatment, facilitating the processing of hundreds of rings simultaneously. A modified protocol, which is based on the standard methodology (Green Reference Green and Whistler1963; Loader et al. Reference Loader, Robertson, Barker, Switsur and Waterhouse1997), was used to isolate the cellulose from the whole wood. Each annual ring sample (120–250 μg) was then separated from adjacent rings in a cellulose lath using a razor blade and a microscope. The oxygen isotope ratios (18O/16O) in the cellulose samples were measured in an isotope ratio mass spectrometer (Delta V Advantage, Thermo Fisher Scientific) connected to a pyrolysis-type elemental analyzer (High Temperature Conversion Elemental Analyzer, Thermo Fisher Scientific) interfaced with a Conflo III (Thermo Fisher Scientific). The oxygen isotope ratios are reported as δ18O (‰), deviations relative to the international Vienna Standard Mean Ocean Water (VSMOW). The reproducibility of the repeatedly measured in-house standard material (Merck cellulose) was less than 0.2‰ (1σ).
To cross-check the reliability of pattern-matching among different samples, we also measured all of the annual growth rings to an accuracy of 0.01 mm using a TA Unislide measurement system (Velmex Inc.). As we found that the ring width variations were only weakly correlated among the seven samples, the ring width data previously recovered from the other seven samples at the same site (Pumijumnong and Wannasri Reference Pumijumnong and Wannasri2015) were merged into the dataset and used for cross-dating. The previous ring width series have been statistically cross-dated using the COFECHA program (Holmes Reference Holmes1983). The cross-dated ring width series were then averaged to produce a local chronology (Pumijumnong and Wannasri Reference Pumijumnong and Wannasri2015), against which our ring width chronology consisting of the seven samples was cross-dated by matching the ring width patterns.
Chronology Development
Pattern matching of inter-annual δ18O variations was conducted to assign relative years for every ring among the seven tree-ring δ18O series produced in this study. Following the principle of cross-dating, correlation analysis using paired series from the seven series was carried out to identify the relative years showing the highest correlation coefficient. The strength of common variations among the seven series was evaluated by calculating the mean inter-series correlation (Rbar) and the expressed population signal (EPS), the latter being calculated using the number of samples and Rbar (Wigley et al. Reference Wigley, Briffa and Jones1984). Some of our tree-ring δ18O series showed long-term increasing trends with increasing tree age (Figure 2a). This was particularly significant with samples C58 and C59. However, others showed only a weak upward trend (P05 and C62) or no trend at all (C60, C12A, and C10). Based on statistical tests of isotope datasets with relatively high sample sizes, Duffy et al. (Reference Duffy, McCarroll, Loader, Young, Davies, Miles and Bronk Ramsey2019) and Büntgen et al. (Reference Büntgen, Kolář, Rybníček, Koňasová, Trnka, Ač, Krusic, Esper, Treydte, Reinig, Kirdyanov, Herzig and Urban2020) concluded that there are no age-related trends in tree-ring δ18O series obtained from oak. More specifically, of 17 modern oak trees, 11 (6) showed increasing (decreasing) trends, 6 (1) of which were (was) statistically significant (Duffy et al. Reference Duffy, McCarroll, Loader, Young, Davies, Miles and Bronk Ramsey2019). Similar to their study (Duffy et al. Reference Duffy, McCarroll, Loader, Young, Davies, Miles and Bronk Ramsey2019), the proportion of series showing positive and negative trends in our tree-ring data turned out to be non-significant based on the binomial test. Although our data were not inconsistent with those findings (Duffy et al. Reference Duffy, McCarroll, Loader, Young, Davies, Miles and Bronk Ramsey2019), the δ18O values of C58 and C59 from the earlier period were shown to be markedly lower than those of the other samples. Some ecological and/or physiological factors that were unique to these two trees (C58 and C59) during their younger phase could be reflected in their δ18O values. It is also plausible that the positive trend was partially induced by long-term climate variability, as four of the seven teak samples showed positive trends. However, a larger sample size will be needed to rigorously test whether teak tree-ring δ18O in this region is modulated by aging. Following the usual procedure for tree-ring standardization (Fritts Reference Fritts1976), we detrended the series to remove this age-dependent long-term tendency, while at the same time attempting to retain decadal-scale variations related to hydroclimate. Specifically, each of the tree-ring series was individually detrended by fitting a straight line, and subsequently subtracted to produce anomalies from the fitted values. All of the detrended tree-ring δ18O series were then averaged to build the final chronology.
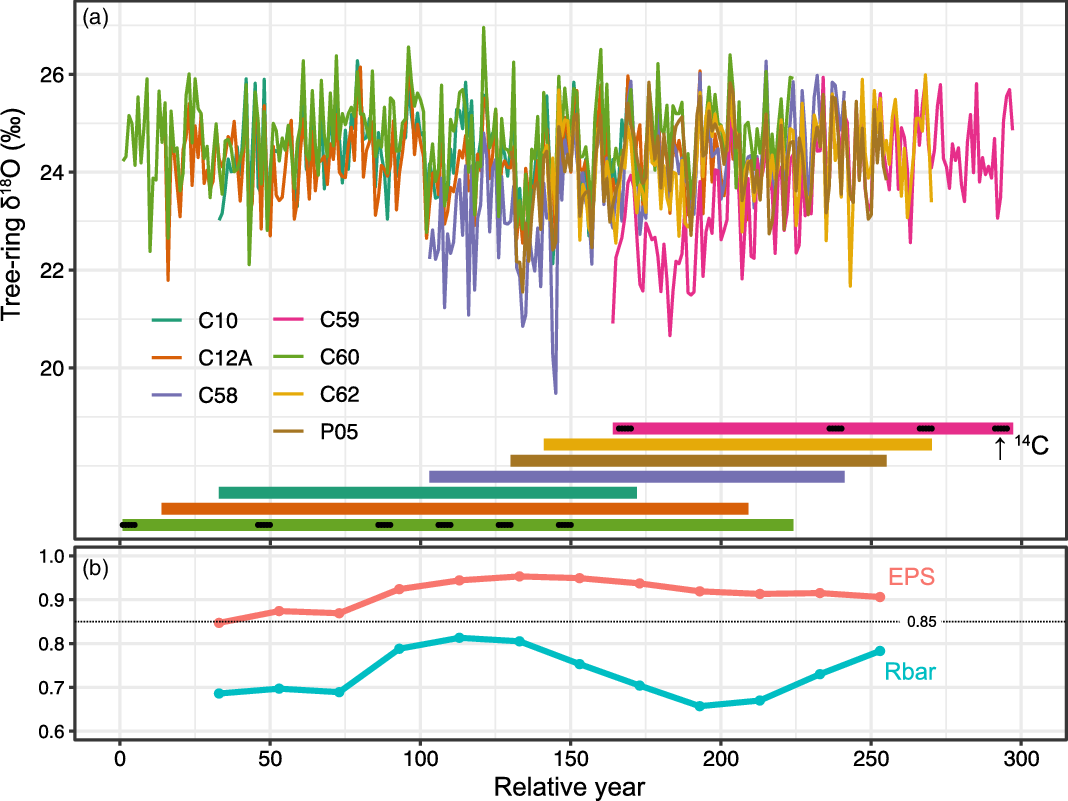
(a) Synchronized tree-ring δ18O series from the seven teak samples and their time spans showing the 5-yr sequences used for the AMS 14C measurements. The horizontal axis represents relative years, with the oldest ring corresponding to year 1. (b) The running Rbar (mean inter-series correlation) and EPS (expressed population signal) statistics calculated over 40 yr and lagged by 20 yr.
Based on the relative dates determined from pattern matching of the tree-ring δ18O data, we calculated the inter-series correlations between the ring width series to evaluate the robustness of the cross-dating. As the teak from the study region grows in closed forests, tree growth is significantly modulated by ecological interactions among neighboring trees. Additional data-adaptive detrending is therefore required to remove these ecological pulses, which are unique to individual trees. To extract the high-frequency variability component from the raw data, we detrended the individual ring width series by fitting a cubic smoothing spline (Cook and Peters Reference Cook and Peters1981) with a 50% variance reduction at 10 yr. Correlation tests were then performed using the detrended series for all possible pairs. In addition, each of the 60-yr segments extracted from the individual ring width series was correlated against a site chronology that was developed using all of the remaining samples (i.e., the leave-one-out principal). Our analysis was performed using the dendrochronology program library in R (dplR; Bunn Reference Bunn2008).
Radiocarbon Measurements and Wiggle Matching
Ten samples were selected for the 14C measurements. Each 14C sample consisted of five consecutive rings, and these relative years are listed in Table 1. The gaps between the 14C measurements ranged from 20 to 70 yr. To avoid potential contamination in reusing the cellulose laths used for δ18O analysis, cellulose was independently extracted from each of the whole wood samples consisting of only five rings for 14C measurement. 14C was measured in a compact accelerator mass spectrometer (National Electrostatics Corporation) at Paleo Lab Co., Ltd, Japan, and the analytical precision of the 14C ages was 19–25 yr (1σ). Our sampling site is strongly influenced by the Asian monsoon, which is at least partially responsible for the air mass flow that originates in the Southern Hemisphere (Hua and Barbetti Reference Hua and Barbetti2007). Following a simple approach (Marsh et al. Reference Marsh, Kidd, Ogburn and Durán2017, Reference Marsh, Bruno, Fritz, Baker, Capriles and Hastorf2018; Hogg et al. Reference Hogg, Heaton, Hua, Palmer, Turney, Southon, Bayliss, Blackwell, Boswijk, Bronk Ramsey, Pearson, Petchey, Reimer, Reimer and Wacker2020), we created an evenly weighted mixed curve that combined the IntCal20 and SHCal20 curves for the age calibration procedure, which was generated using the “Mix_curve” command in the OxCal online v4.4 program (Bronk Ramsey Reference Bronk Ramsey2009). Based on the 14C gap year data derived from dendrochronology, all of the 14C data were wiggle-matched against the mixed calibration curve.
Sample description and 14C results based on a mixed calibration curve evenly weighted from the IntCal20 and SHCal20 curves.
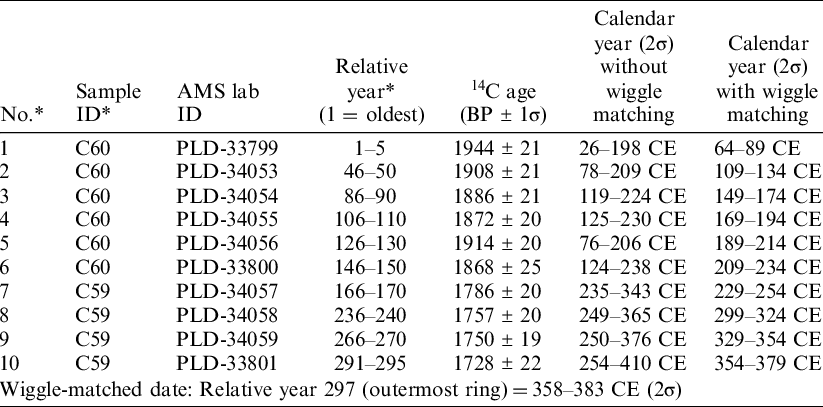
* Correspond to those used in Figure 7.
Backward Trajectory Analysis
We investigated the possible impact of air mass transport pathways on tree-ring δ18O and 14C concentration using the HYSPLIT model (Hybrid Single-Particle Lagrangian Integrated Trajectory) distributed by NOAA (National Oceanographic and Atmospheric Administration; Stein et al. Reference Stein, Draxler, Rolph, Stunder, Cohen and Ngan2015). We used the NCEP/NCAR reanalysis data, which have a 2.5° horizontal resolution and 6-hour frequency (Kalnay et al. Reference Kalnay, Kanamitsu, Kistler, Collins, Deaven, Gandin, Iredell, Saha, White and Woollen1996) and are already formatted for the HYSPLIT model. Six heights ranging from 0 to 2500 m above ground level (500-m steps) were set as starting points for this analysis. Twenty-day backward trajectories were calculated between 1950 and 2019 CE for the May–October period, which is the teak growing season in northwestern Thailand, as identified from the climatic response of modern tree-ring δ18O (Pumijumnong et al. Reference Pumijumnong, Bräuning, Sano, Nakatsuka, Muangsong and Buajan2020). A total of 4416 trajectories [4 times (0000, 0600, 1200, and 1800 UTC) × 184 days × 6 heights] were eventually obtained for each year. The outputs of the trajectory calculations were recorded hourly at each of the six heights. All air parcels below 2500 m above ground level were counted at a resolution of 1° × 1° (latitude × longitude) and backwards in time until the 20th day was reached. The counts from every grid were then expressed as the probability distribution (p, %):
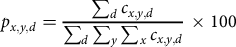 $${p_{x,y,d}} = {{\mathop \sum \nolimits_d {c_{x,y,d}}} \over {\mathop \sum \nolimits_d \mathop \sum \nolimits_y \mathop \sum \nolimits_x {c_{x,y,d}}}} \times 100$$
where, p x,y,d and c x,y,d are the probability and count of the air parcels, respectively, in a grid cell at a given longitude (x, degrees) and latitude (y, degrees) for a given trajectory period (d, days). Similarly, the relative contributions of the air masses transported from the ocean were calculated by counting the air parcels that originated in the ocean over the 20 days. Based on a teak tree-ring δ18O record (1678–2015 CE) from northwestern Thailand (Pumijumnong et al. Reference Pumijumnong, Bräuning, Sano, Nakatsuka, Muangsong and Buajan2020), the wettest and driest 5 yr were selected between 1950 and 2015 CE (see Supplementary Material). The mean state of the air mass pathways, and the difference between the wettest and driest 5 yr were then calculated to explore the land–ocean air mass flow contributions. In addition, we used the ERA5 reanalysis dataset (Hersbach et al. Reference Hersbach, Bell, Berrisford, Hirahara, Horányi, Muñoz-Sabater, Nicolas, Peubey, Radu and Schepers2020) to calculate the composite anomalies of the wettest and driest 5 yr for precipitation and surface wind during the May–October period.
RESULTS AND DISCUSSION
During the process of pattern matching based on our tree-ring δ18O series, no missing rings were identified in the tree-ring samples. Our tree-ring δ18O series derived from the seven samples showed significant inter-series correlations over the common period, as indicated by the running Rbar statistics that ranged from 0.66 to 0.81 (Figure 2). In addition, the running EPS statistics ranged from 0.85 to 0.95, which exceeds the generally accepted threshold value of 0.85. Similarly, all pairs of tree-ring δ18O series with at least a 30-yr overlap showed significant correlations at p < 0.001 (Figure 3a). In contrast, the ring width series exhibited relatively weak correlations among the seven samples (Figure 3b). The mean inter-series correlation of ring width was 0.17, which is notably lower than the 0.42 derived from the teak samples from northwestern Thailand (Buckley et al. Reference Buckley, Palakit, Duangsathaporn, Sanguantham and Prasomsin2007). This is at least partially related to within-tree noise generated by uneven radial growth. Buckley et al. (Reference Buckley, Palakit, Duangsathaporn, Sanguantham and Prasomsin2007) countered this problem by measuring multiple radii per stem to obtain the mean growth of the individual tree. Unfortunately, we could not follow their method because of the lack of cross-sectioned samples. Instead, we used the ring width series reported by Pumijumnong and Wannasri (Reference Pumijumnong and Wannasri2015). The ring width patterns were successfully cross-matched with those in our dataset. As shown in Figure 4, most of the 60-yr segments from individual ring width series showed significant correlations with a site chronology, which was developed using all of the remaining series (leave-one-out principle). We believe that the reliability of our dating results, based on tree-ring δ18O, is further supported by the ring width data. Overall, our tree-ring records (both δ18O and ring width) can be consistently replicated. It should be noted, however, that the latest period covered by our tree-ring records is based on only one sample (C59). Thus, neither the δ18O nor ring width series were replicated during that period, which corresponds to relative years of 271–297 for δ18O (Figure 2) and 309–335 for ring width (Figure 4). Although this uncertainty remains, almost the entire period of our tree-ring δ18O chronology can be used to provide robust estimates of mean tree-ring δ18O in our study region.
Correlation matrix for the (a) tree-ring δ18O series and (b) ring width series derived from the seven samples analyzed in this study. The raw series were individually standardized using a 10-yr smoothing spline function to extract high-frequency variations. The lower left of the matrix shows the correlation coefficient (r) together with the number of overlapping years (n), and the upper right shows the statistical significance with its correlation (corresponding to the size of the circle and color shading).

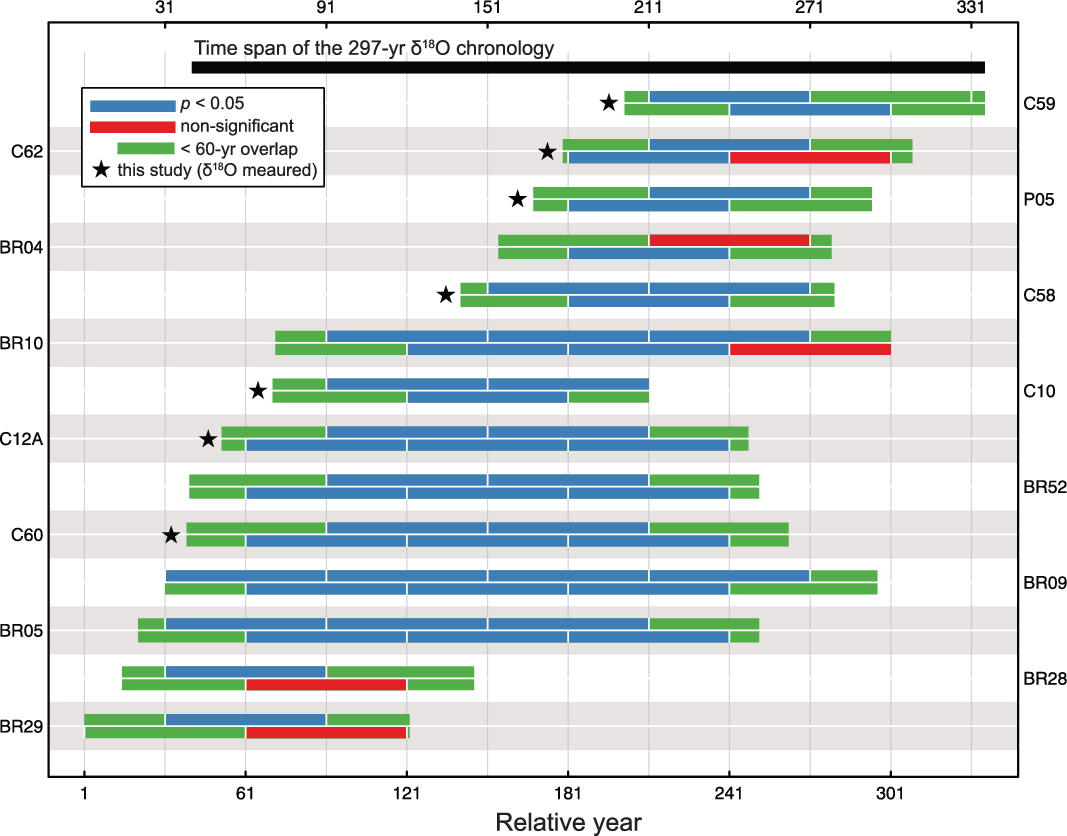
Correlation tests of each ring width series against a site chronology, which was developed using all of the remaining series. Correlations were calculated for each 60-yr segment of the individual series, with segments lagged by 30 yr. Segments filled with blue, red, and green indicate significance at 5%, non-significance, and the end of samples with less than 60-yr overlaps, respectively. Stars represent samples with δ18O data. The black bar represents the time span of the 297-yr tree-ring δ18O chronology.
As shown in Table 1, the 95.4% (2σ) probability range is 106–173 yr for the calendar years without wiggle matching. Our wiggle-matching calibration (Supplementary Figure 1) successfully narrows down this probability range to 26 yr, with the relative year 297 (outermost ring) corresponding to 358–383 CE (95.4% probability range). The mixed curve used for calibration works well when compared with the probability ranges of 30 yr from IntCal20 or 31 yr from SHCal20. This result is consistent with the shape of TLBP (Hua et al. Reference Hua, Turnbull, Santos, Rakowski, Ancapichún, De Pol-Holz, Hammer, Lehman, Levin, Miller, Palmer and Turney2022), and with Hua and Barbetti (Reference Hua and Barbetti2007), who estimated a 52% ± 13% contribution of Southern Hemisphere air masses to northern tropical and subtropical regions using atmospheric and tree-ring 14C data during the bomb-influenced period.
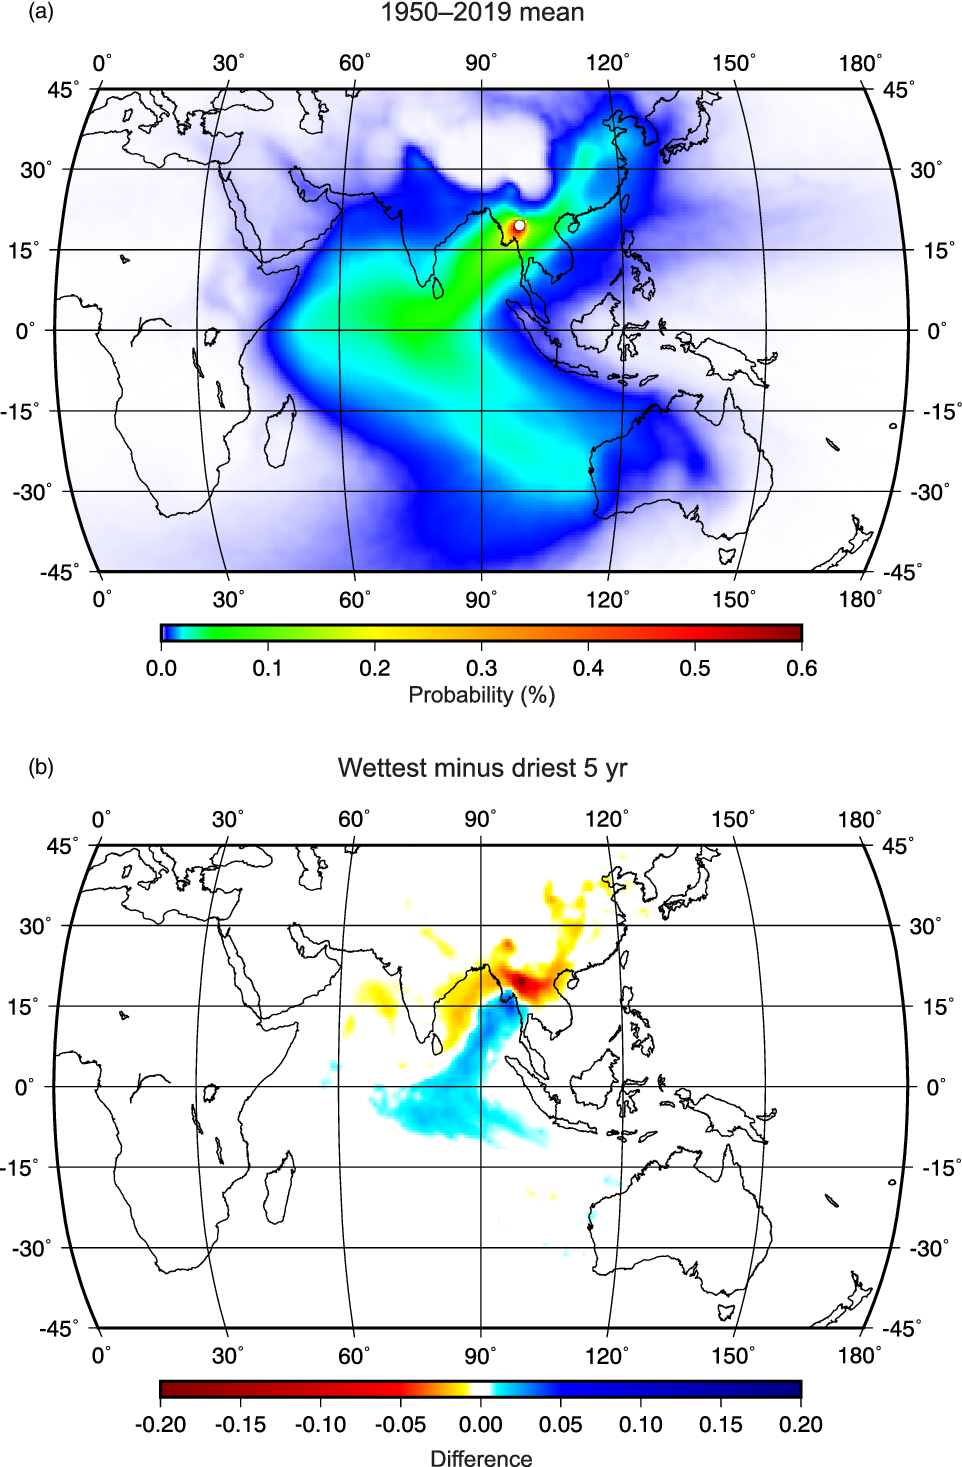
We then tested the possible link between modern tree-ring δ18O (Pumijumnong et al. Reference Pumijumnong, Bräuning, Sano, Nakatsuka, Muangsong and Buajan2020) and air mass transport from the Indian Ocean using backward trajectory analysis. The mean state of air mass pathways derived from our backward trajectory analysis is presented as the probability distribution of air masses arriving at the sampling site in summer (Figure 5a). Although some northeasterly winds from East Asia do blow across the site, a large proportion of the air masses that influence this site are transported from the Indian Ocean, including the Southern Hemisphere sector. As shown in Figure 5b, the difference in the probability distributions between the wettest and driest 5-yr composites clearly demonstrate strengthened (weakened) air mass transport from the Indian Ocean (continental East Asia) in the wet years. Furthermore, a statistically significant difference in the relative contributions of air masses transported from the ocean was observed between the wettest and driest 5 yr (t = 3.19, degrees of freedom = 8, p = 0.013), indicating that intensification of the summer monsoon increases (decreases) air mass transport from the ocean (land). The normalized composite anomalies for precipitation and surface wind (10-m wind) from the ERA5 reanalysis data for the wettest and driest 5 yr (Figure 6) are also consistent with our findings. Specifically, the amount of precipitation, not only in our study region but also across wider areas of South and Southeast Asia, was accurately reflected in a tree-ring δ18O record constructed from living teaks by Pumijumnong et al. (Reference Pumijumnong, Bräuning, Sano, Nakatsuka, Muangsong and Buajan2020). The surface wind vectors indicate a strengthened (weakened) water supply from the ocean during the wettest (driest) 5 yr. Our findings based on the modern records indicate that an intensified (weakened) summer monsoon recorded as lower (higher) tree-ring δ18O was most likely to be induced by increased (decreased) air mass transport from the tropical Indian Ocean, which is an area of intense upwelling where the 14C concentration is lower than the atmospheric 14C level.
(a) Probability distribution of air mass arriving at the sampling site (open circle) for the May–October period derived from backward trajectory analysis between 1950 and 2019 CE. (b) Difference in probability distributions between the wettest and driest 5-yr composites.
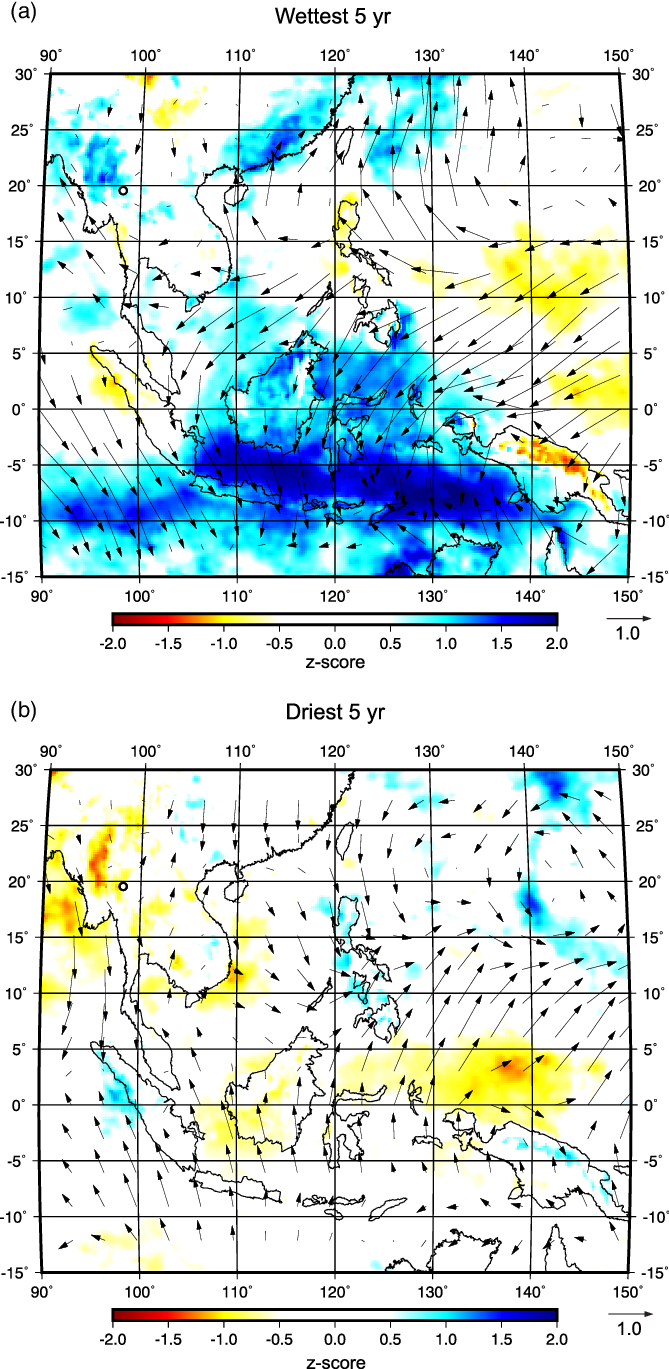
Normalized May–October composite anomalies of precipitation (color shading) and surface wind (arrows) for the (a) wettest and (b) driest 5 yr between 1950 and 2019. Open circle indicates our sampling site. Global-scale composite anomalies are presented in Supplementary Figure 2.
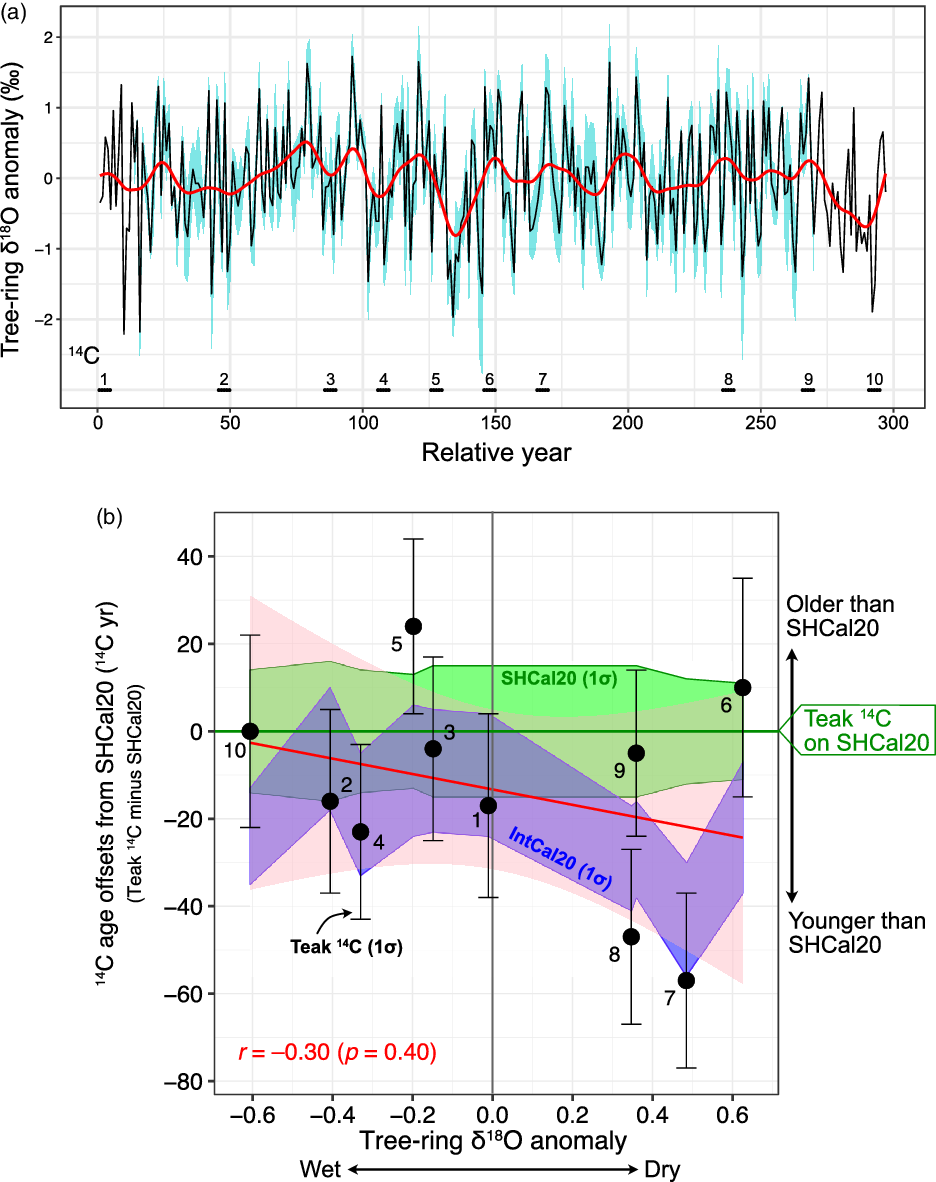
Finally, we tested the possible linkage between summer monsoon intensity and 14C offset from the calibration curves using the δ18O and 14C data from our teak log-coffin samples. The 5-yr δ18O segments used for this analysis are shown in Figure 7a. The teak 14C age offsets from SHCal20 (14C ages minus SHCal20) were compared with the corresponding 5-yr mean of the teak δ18O (Figure 7b). There was an inverse, but weak, association between the 14C age offsets and δ18O values. Although this is not inconsistent with our findings obtained from the modern data, the relationship was not statistically significant (r = −0.30, n = 10, p = 0.40), indicating that our hypothesis outlined above was not verified. The sample size of 10 seems to be too small to detect such a linkage, as there appears to be a slight difference between the IntCal20 and SHCal20 curves observed in Figure 7b. In addition, the output of this analysis is sensitive to the wiggle-matching uncertainty. The former can be improved by increasing the sample size, and the latter can be entirely overcome by using dendrochronologically dated samples. The sampling design of the 14C measurements is also important in this analysis. Specifically, calendar periods showing a significant 14C difference between the IntCal20 and SHCal20 curves (e.g., the period of sample No. 7 in Figure 7b) can be used to discriminate between the influence of air mass incursion from the northern and southern hemispheres. Therefore, the findings presented here are not sufficient to reject our hypothesis, but it is yet to be fully verified, and this will require the use of additional tree-ring 14C and δ18O data from regions significantly influenced by inter-hemispheric air mass mixing.
(a) The 297-yr tree-ring δ18O chronology developed by averaging the seven detrended series. Blue shading and the red line represent ±1 standard deviation and 20-yr splined values, respectively. The 5-yr sequences used for 14C measurements are marked with black bars. (b) Comparison between 5-yr mean tree-ring δ18O anomaly and 14C age offsets from the SHCal20 calibration curve (teak 14C minus SHCal20). Error bars represent teak 14C analytical precision (1σ). Green and blue shading indicate uncertainty (1σ) for SHCal20 (i.e., SHCal20 minus SHCal20) and IntCal20 (i.e., IntCal20 minus SHCal20), respectively. Pink shading represents the 95% confidence interval of the linear regression, in which the negative trend is not statistically significant. The individual 14C and δ18O data used for (a) and (b) are linked by the numbers (1–10) shown in both plots.
Our analysis presented here was based mainly on reanalysis datasets, and indeed the possible link between our tree-ring δ18O and 14C data was not statistically verified. Notwithstanding this limitation, the tree-ring δ18O data from the last several decades are consistent with our interpretation of air mass sources. This is because moisture source signals are related partly to regional 14C offsets and are well preserved in tree-ring δ18O data (Sano et al. Reference Sano, Xu, Dimri, Ramesh, Dimri, Bookhagen, Stoffel and Yasunari2020). Continued efforts toward developing a tree-ring dataset consisting of δ18O and 14C records will shed more light on the possible link between tree-ring δ18O and 14C.
CONCLUSIONS
In this study, we developed a 297-yr tree-ring δ18O record from northwestern Thailand. Using 10 accelerator mass spectrometry (AMS) 14C measurements, we were able to date the last ring of our chronology to 358–383 CE (95.4% probability range) using a wiggle-matching calibration. Backward trajectory analysis indicates that an intensified (weakened) air mass flow from the tropical Indian Ocean is clearly recorded as lower (higher) tree-ring δ18O values. However, a direct linkage between tree-ring δ18O and 14C records from teak log-coffin samples could not be demonstrated.
ACKNOWLEDGMENTS
This research was funded by the Research Institute for Humanity and Nature (project no. 14200077), Grants-in-Aid for Scientific Research from the Japan Society for the Promotion of Science (grant nos. 26244049, 22H00738, 16H06005, and 20H05643), the Thailand Science Research and Innovation, Research Grant for Mid-Career Researchers of Mahidol University (grant no. RSA62-80017), and the Nagoya University Research Fund. We thank the anonymous reviewers and Associate Editor Quan Hua for their valuable comments that improved the manuscript.
DECLARATION OF COMPETING INTERESTS
The authors declare no conflicts of interest.
SUPPLEMENTARY MATERIAL
To view supplementary material for this article, please visit https://doi.org/10.1017/RDC.2023.14


 Open access