


Introduction
Understanding the Antarctic wind field is essential not only to ensure the safety of researchers stationed at Antarctic research stations, but also to understand the impacts of changing weather patterns in Antarctica for the global climate. One of the main weather features in the Antarctic continent are the strong wind events (SWEs) over the coastal or near-coastal region. Many of the SWEs in the coastal region of Antarctica are related to katabatic winds, which originate from the high-elevation interior of the continent and head towards the coastal areas due to gravity drainage (Murphy & Simmonds Reference Murphy and Simmonds1993, Parish & Cassano Reference Parish and Cassano2003, Nylen et al. Reference Nylen, Fountain and Doran2004, Turner et al. Reference Turner, Chenoli, Samah, Marshall, Phillips and Orr2009, Chenoli et al. Reference Chenoli, Turner and Samah2013, Reference Chenoli, Turner and Samah2015). Besides the effects of this pressure gradient, synoptic-scale cyclones, which frequently occur in the coastal regions, cause SWEs across these coastal regions (Powers Reference Powers2007, Turner et al. Reference Turner, Chenoli, Samah, Marshall, Phillips and Orr2009).
Sonic Detection and Ranging (SODAR) uses soundwaves and their physical attributes, such as reflection, deflection and refraction, to measure wind speed and direction, as well as vertical turbulence in the lower atmosphere based on the thermodynamic structure of the atmosphere (Lang & McKeogh Reference Lang and McKeogh2011, Wizelius Reference Wizelius and Sayigh2012). A wind profiler is often used to examine the scattering of soundwaves by atmospheric turbulence. The instrument projects a soundwave vertically from the ground and detects the soundwave as it is reflected by the different levels of the atmosphere (Lang & McKeogh Reference Lang and McKeogh2011, Wizelius Reference Wizelius and Sayigh2012). An advantage of such an instrument is its ability to measure the wind profile of an area with a higher temporal resolution than contemporary techniques such as a radiosonde, whose data are gathered every 12 h at Jang Bogo Station.
Since the 1970s, SODAR has been very useful in studying wind structure, turbulence on landmasses and ice sheets, the atmospheric boundary layer (ABL) and instabilities, air pollution and air-sea interactions. SODAR is highly beneficial in obtaining atmospheric wind profiles in remote unmanned areas such as polar regions, where the many technical difficulties exist due to their extremely colder temperatures and high wind speeds (Kallistratova & Coulter Reference Kallistratova and Coulter2004). In the Antarctic, SODAR has been helpful for studying katabatic wind characteristics and their evolution (Kallistratova & Coulter Reference Kallistratova and Coulter2004, Renfrew & Anderson Reference Renfrew and Anderson2006). Renfrew & Anderson (Reference Renfrew and Anderson2006) applied SODAR to continuously measure winds in winter and summer over Coats Land, Antarctica, and studied katabatic wind events and types of katabatic flow depending on the season with high temporal resolution.
a. Locations of the Sonic Detection and Ranging (SODAR) system, the automatic weather station (AWS), the look-up tower and Jang Bogo Station (JBS; satellite image from Google Earth). b. Location of Jang Bogo Station in the Antarctica continent. c. Location of Jang Bogo Station in Terra Nova Bay (Terra Nova Bay image from NASA, n.d.).

There have been several studies on the boundary layer using SODAR in Antarctic regions (e.g. Culf Reference Culf1989, Mastrantonio et al. Reference Mastrantonio, Ocone, Pellegrini and Fiocco1990, Reference Mastrantonio, Malvestuto, Argentini, Georgiadis and Viola1999, Liu & Bromwich Reference Liu and Bromwich1993, Argentini et al. Reference Argentini, Del Buono, Della Vedova and Mastrantonio1995, Bonner et al. Reference Bonner, Ashley, Cui, Feng, Gong and Lawrence2010). The longest-duration set of SODAR measurements was carried out from February 2009 until August 2009 at Dome A, Antarctica, by Bonner et al. (Reference Bonner, Ashley, Cui, Feng, Gong and Lawrence2010). They studied ABL to assist with the measurements of astronomical instrumentation, and they obtained an ABL at Dome A of 13.9 m (median height). However, ABL is highly variable; thus, measurements within minutes (not hours) are crucial to accurately determine its height. Pietroni et al. (Reference Pietroni, Argentini, Petenko and Sozzi2012) measured the ABL for a year in 2005 at Dome C, Antarctica, twice a week during unstable atmospheric conditions at between 30 and 350 m, as well as stable atmospheric conditions from 10 to 150 m.
The wind profile observed using SODAR by Argentini & Mastrantonio (Reference Argentini and Mastrantonio1994) at a coastal station (Dumont d’Urville, Adélie Land) showed that the vertical velocity during the katabatic wind event decreased with height. At Dumont d’Urville Station, they found three main directions of winds: 90°, 150° and 180°. The former two directions were associated with katabatic wind, whereas the latter was associated with the land breeze. For the same station, the 0° wind was associated with a strong wind from the ocean (Argentini & Mastrantonio Reference Argentini and Mastrantonio1994). On Ross Island (330 km south-east of Jang Bogo Station), strong winds from the south were mostly influenced by the mesoscale and synoptic-scale pressure gradients based on measurements using monostatic SODAR by Liu & Bromwich (Reference Liu and Bromwich1993) in their 1990 campaign. There was also significant diurnal variation: the afternoon winds were stronger than in the morning due to the interaction between the island’s orography and glaciers. The katabatic flow near Ross Island tends to rotate clockwise with height due to the blocking effect of Hut Point peninsula. The shallow convective mixing layer in the daytime also has a limited impact on the ABL behaviour in the Ross Island area during the early summer period (Liu & Bromwich Reference Liu and Bromwich1993).
In the summer of 2017, the National Antarctic Research Center (NARC), Universiti Malaya, installed a SODAR system at Jang Bogo Station (74.62°S, 164.23°E) at Terra Nova Bay, East Antarctica (Fig. 1b,c). Data started recording started from May 2017 onwards. This paper aims to evaluate the wind measurements obtained from the SODAR system compared to those obtained at a walk-up tower (hereafter ‘the Tower’) of Jang Bogo Station and Automatic Weather Station (AWS) data from May to October 2017. We also examine a case of a SWE to evaluate the wind profile by comparing the features between calm and strong wind periods.
Data and methods
Location
The SODAR system, the Tower and the AWS in Jang Bogo Station are located ~900 m from the main Jang Bogo Station area, as shown in Fig. 1. Key factors that affected the optimal SODAR system placement are:
-
1) The buildings around the SODAR system: SODAR works by generating and receiving soundwaves that are reflected from the atmosphere. Ideally, the instrument should be placed at least 10 m away from the nearest building to avoid soundwave reflection from buildings (Fig. 1a).
-
2) Wildlife around the SODAR: biologists and skua researchers argued that the constant beeping of the SODAR system (which emits high-decibel sound) could have adverse effects on the skuas. Thus, it would be crucial to install the SODAR system far from their nests.
SODAR instrument and data
The SODAR setup is shown in Fig. 2. The SODAR with a midrange frequency acoustic SODAR (MFAS) antenna (Fig. 2a) were sourced from Scintec (scintec.com) and covered with a dedicated enclosure (Fig. 2b). The SODAR is a ground-based instrument that sends short sound pulses to the atmosphere and listens to the returning echoed sound pulses in real time. The instrument started to record data from 9 May 2017, but due to many missing data in the SODAR measurements from 9 May and in the month of November 2017, the analysis will be focusing on the data from 10 May until 31 October 2017, and these data will also be used for the comparison with other instruments.
a. Midrange frequency acoustic SODAR (MFAS) antenna (Sonic Detection and Ranging; SODAR). b. Support stand covering the antenna inside. c. SODAR system, indicated by the red arrow, is placed near the air chemistry observation building (blue building).

Thus, in this study, we analysed the SODAR measurement of wind speed and direction from 10 May until 31 October 2017. There were some missing data at a certain height of measurement, and, in some cases, there were no measurements available for the whole day (Fig. 3). The maximum height of SODAR measurement was 500 m, and the minimum was 30 m (from the instrument surface). The measurement interval was set to be every 15 min. Figure 3 also shows the wind speeds and SWEs that occurred in the 2017 winter season. A SWE is defined as wind measurement equal to or stronger than 10.8 m s−1 (Beaufort scale (BF) 6) and will be discussed further in the ‘Methods’ section.
The wind speed and direction data collected by the Sonic Detection and Ranging (SODAR) system from 9 May until 17 November 2017. The plot represents 10 min data from 9 May until 17 November 2017, collected during the 2 week fieldwork period. The maximum height for the measurement is set to 500 m from the surface and the lowest measurement is set to 30 m. Colours represent wind speed. The x-axis is the date (month-day hour:minute) and the y-axis is the height (altitude). Only data from 10 May until 31 October 2017 are analysed in this study.

Other data
We compare the wind measurement with data observed from the Tower, sounding and AWS at Jang Bogo Station. These data were provided by the Korea Polar Institute. Wind data from the Tower are available at 3, 6, 12, 21 and 30 m and the sampling interval is 1 s. The wind was measured from anemometers (05108-45, RM Young), and other parameters measured at the Tower are temperature and humidity, which were measured using temperature and humidity probes (HMP155, Vaisala). The AWS data were measured at 3.3 m height from the surface with 10 min temporal resolution. The AWS data used in this study were wind speed, wind direction, air temperature and mean sea-level pressure. The temperature (Tower and AWS) and mean sea-level pressure (AWS) were only to be used in case study example. The sounding data were measured once a day at 00h00 UTC (12h00 local time) at various heights, and they were only used to determine the boundary-layer height in some of the SWE example cases analysed in this paper. The locations of the Tower and AWS are shown in Fig. 1a.
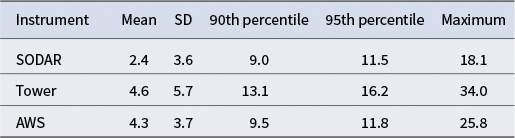
The mean, standard deviation (SD), 90th percentile, 95th percentile and maximum values of wind speed from the lowest-altitude measurement of the Sonic Detection and Ranging (SODAR) system (30 m above the surface), the walk-up tower (30 m above the surface) and the automatic weather station (AWS; 3.3 m above surface).

Notes: All available data are from 10 May to 31 October 2017; unit are metres per second (m s−1); statistics are from hourly averaged data.
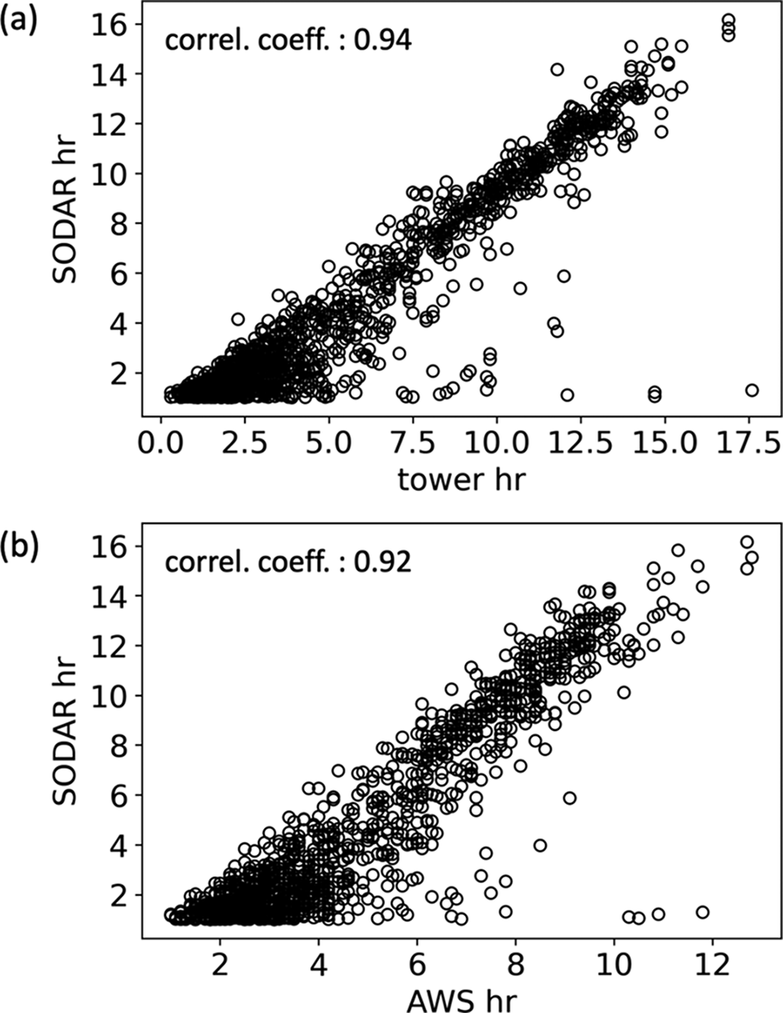
a. The correlation between the Sonic Detection and Ranging (SODAR) and walk-up tower data (wind speed) at 30 m height and b. the correlation between the SODAR and automatic weather station (AWS; wind speed) at 30 and 3.3 m heights, respectively. All data are in hourly means, and data from the walk-up tower and AWS were removed if the data from the same hour were missing from the SODAR dataset.

Methods
To evaluate SODAR data, we compare SODAR data with the other observations (Tower and AWS dataset) from 10 May to 31 October 2017. The basic statistics of wind speed from all available data are listed in Table I in their original temporal resolutions. The Pearson correlation between the SODAR, Tower and AWS was analysed only for the available data, which means that if data from one of the three datasets were missing, the dates corresponding to those data were excluded. The comparison was at the lowest altitude measurement: SODAR at ~30 m from the surface, the AWS measures winds at 3.3 m above the surface and the Tower measures data at 30 m above the surface to match the SODAR height. SODAR data were obtained every 15 min, Tower data were obtained every 10 min and AWS data were obtained in every 10-min. To ensure consistency in the analysis, we averaged the data hourly, and we compare the measurements across the three instruments. The number of data points used in this analysis was 3513 (from the hourly mean dataset), after removing all of the missing values. The missing values represent 16% of total hourly data points from 10 May to 31 October.
Hourly mean comparison between the Sonic Detection and Ranging (SODAR) system, the walk-up tower and the automatic weather station (AWS) from May to July 2017.

Hourly mean comparison between the Sonic Detection and Ranging (SODAR) system, the walk-up tower and the automatic weather station (AWS) from August to October 2017.

Diurnal variation in wind speed for the Sonic Detection and Ranging (SODAR) system, the walk-up tower and the automatic weather station (AWS) during each month of the campaign. The SODAR and the walk-up tower measurements were at 30 m height and the AWS measurements were at 3.3 m height.

Diurnal variation in wind direction for the Sonic Detection and Ranging (SODAR) system, the walk-up tower and the automatic weather station (AWS) during each month of the campaign. The SODAR and the walk-up tower measurements were at 30 m height and the AWS measurements were at 3.3 m height.

Wind rose plots from the Sonic Detection and Ranging (SODAR) system, the walk-up tower (Tower) and the automatic weather station (AWS). Measurements for the SODAR system and the Tower were at 30 m height and measurements for the AWS were at 3.3 m height. All data are grouped monthly.

This paper investigated the SWEs, determined using the standard BF, over the region using SODAR data. From the statistics in Table I, the mean, 90th percentile, 95th percentile and maximum wind speeds from all instruments recorded were relatively slower than those observed in the nearby katabatic confluence region: Inexpressible Island and Reeves Glacier (~30 km south of the station; see Fig. 1c), which ranged between 10 and 30 m s−1 (Bromwich Reference Bromwich1989). The 90th percentile of wind speed was 9.0 m s−1, and the 95th percentile was 11.5 m s−1. In this paper, we chose the SWE threshold as 10.8–3.8 m s−1, which corresponds to World Meteorological Organization (WMO) BF6 (Hickson Reference Hickson and Bobrowsky2013). This analysis only considered days with no missing data from the SODAR system.
To analyse the wind profile (SODAR) during SWEs, the ABL height (ABLH) was calculated using the bulk Richardson number. The ABL was only computed using the sounding data as it provides the vertical temperature profile with higher vertical resolution. In order to analyse the wind profile conditions during calm and windy days, example cases from the period of 10–12 June 2017 were used, which included calm and windy days.
The bulk Richardson number is defined by Equation 1:
 $$\begin{align}{R}_{ib}(z)=\kern0.36em \frac{\left(g/{T}_v\right)\;\Delta {\theta}_v\;\Delta z}{{\left(\Delta U\right)}^2+{\left(\Delta V\right)}^2}\end{align}$$
where $g$
is gravity,
$g$
is gravity, ${T}_v$
is absolute virtual temperature,
${T}_v$
is absolute virtual temperature, $\Delta {\theta}_v$
is the virtual potential temperature difference in height (z) and
$\Delta {\theta}_v$
is the virtual potential temperature difference in height (z) and $\Delta U\; and\;\Delta V$
are the change in wind components over height. The ABL is defined as where the Richardson number equals or exceeds a critical limit of 0.25 (when observed from the surface and upwards). Atmosphere above this limit is considered as not to mix well. Thus, the height at which Rib
exceeds 0.25 is considered to be the ABL limit.
$\Delta U\; and\;\Delta V$
are the change in wind components over height. The ABL is defined as where the Richardson number equals or exceeds a critical limit of 0.25 (when observed from the surface and upwards). Atmosphere above this limit is considered as not to mix well. Thus, the height at which Rib
exceeds 0.25 is considered to be the ABL limit.
Results
Winter 2017
Throughout the winter of 2017, westerly wind dominated the Jang Bogo Station area, as a result of both the katabatic pressure gradient force and synoptic-scale pressure gradient force. The hourly averaged wind speed from 10 May to 31 October 2017 according to the SODAR system was 2.4 m s−1, which is weaker than the wind speeds measured by the Tower and AWS, at 4.6 and 4.3 m s−1, respectively (Table I). The maximum wind speed recorded by the SODAR system was 18.1 m s−1, whereas the Tower and AWS recorded 34.0 and 25.8 m s−1 as the maximum wind speeds, respectively. There were also a few occasions when the SODAR system failed to record any wind data during SWEs, but such data were recorded by the Tower and AWS. Even though the station is close to the region of maximum wind flow in Terra Nova Bay, on average the recorded maximum wind speed during winter 2017 was below 30.0 m s−1, because the station is just outside the confluence region of a high-speed wind stream. The wind speed in Terra Nova Bay is usually high near Inexpressible Island and Reeves Glacier, ~30 km south of Jang Bogo Station.
The correlation coefficient of wind speed between the SODAR system and the Tower was 0.94 and between the SODAR system and the AWS was 0.92 (Fig. 4). There were more variations in the SODAR wind direction than the data measured by the other two instruments. The hourly means of all three instruments are shown in Figs 5 & 6. The SODAR system had some missing data during SWEs, which can be explained by the distortion from the wind flow, which disturbed the returning acoustic signal, thus rendering the system unable to obtain wind data. In some other cases, the SODAR system may have underestimated the wind speed for this same reason (e.g. during 20–22 May; see Fig. 5). However, this did not always happen, as the SODAR system also detected SWEs in some cases (e.g. during 11–12 June; see Fig. 5). In September, the SODAR system exhibited poor performance, with all hourly data indicating wind speeds below 5 m s−1, whereas the Tower and AWS recorded several SWEs, and even higher wind speeds during relatively calm periods.
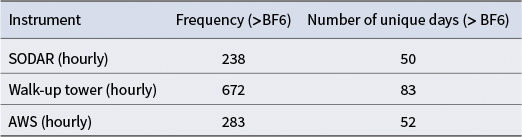
Strong wind event (SWE) frequency from 10 May to 31 October 2017. Twenty-eight of the SWEs were recorded on the same days by all three instruments.

AWS = automatic weather station; BF6 = Beaufort scale 6; SODAR = Sonic Detection and Ranging.
a.–c. Atmospheric boundary layer height (ABLH) calculated according to bulk Richardson number using the sounding data (00h00 UTC). d. An example plot of data measured by the Sonic Detection and Ranging (SODAR) system at an hourly temporal resolution. The colours represent wind speed and the arrows represent meteorological wind direction. Red stars represent the ABLH, each at 00h00 UTC. e. An example of wind (solid black line = SODAR; dashed black line = walk-up tower; blue dashed line = automatic weather station (AWS)) and air temperature of the walk-up tower (red line) and the AWS (dashed red line). The SODAR (wind) and tower (wind and temperature) measurements are at 30 m height, and the AWS wind, mean sea level pressure (mslp) and temperature measurements are at 3.3 m height. The plots in d. and e. share the same x-axis in this figure.

The diurnal variation observed from the SODAR system and the Tower and AWS revealed a similar pattern; however, the SODAR system consistently underestimated the wind speed, as is shown in Fig. 7. All three instruments did detect increases and decreases in wind speed similarly, given their close proximity to each other. Again, the SODAR system did not perform well in September, when the instrument recorded a much lower wind speed compared to the Tower and AWS. The wind direction according to the SODAR system differed by ~27° from the Tower and by ~77° from the AWS (Fig. 8). The large difference between the measurements from the SODAR system and the AWS may be due to the difference in their measurement height (30 m for the SODAR system and 3.3 m for the AWS). The difference between the SODAR system and the Tower was relatively small in all months, except in September. Here, we can conclude that the differences in speed and direction as measured by the SODAR system compared to the Tower and AWS could be the result of their different methods of measurement and the interference in detecting the return acoustic signals.
The wind rose analysis in Fig. 9 reveals that westerly winds were predominant in all three datasets during strong wind periods. The direction of weaker winds varies, particularly for the SODAR measurements. The weaker winds were predominantly coming from the south-west, south, south-east and east according to SODAR. In September and October, north-easterly winds were prevalent. As for the Tower data, the Tower reported a smaller percentage of weaker winds from directions other than the west, with the exception of October. In October, south-easterly and north-eastly winds were more frequent. Regarding the AWS data, westerly and north-westerly winds were prevalent. Weaker winds from other directions were less frequent. Overall, SODAR wind direction generally agreed with the Tower and AWS during strong wind periods. This also suggests that the majority of the strong winds were primarily coming from the west, possibly due to the interaction with the nearby low-pressure system in the Ross Sea and the Dumont d’Urville Sea, or as a result of the pressure difference between inland Antarctica and the nearby ocean.
As discussed in the ‘Methods’ section and referred to in Table I, the 90th percentiles of all measurements were above 9.0 m s−1 and the 95th percentiles were above 11.5 m s−1. Thus, BF6 was used as the threshold for a SWE, where BF6 is a strong breeze of 10.8–13.8 m s−1 (Hickson Reference Hickson and Bobrowsky2013). From Table II, the lower frequency of SWEs detected by the SODAR system (238 occurrences) occurred mainly because of the missing data, especially from September 2017. The Tower and AWS detected more SWEs, with the Tower recording the most (667 occurrences). A total of 28 unique SWE days were common across the three instruments, which is ~56% of all observed events. There were 50 days of SWEs out of 175 days recorded from the SODAR measurements, which is close to the SWEs recorded by the AWS (52 days) but much lower than the SWEs recorded by the Tower (83 days). The missing data and wind speed underestimation are the main reasons the SODAR system having recorded a lower mean wind speed and lower SWE occurrence compared to the other two instruments.
Case study example
One of the advantages of SODAR is its ability to measure vertical wind profiles in high temporal resolution. In this experiment, a 15 min temporal resolution was set on the SODAR system, and the evolution of wind, up to 500 m in height, was analysed in greater detail. Figure 10 provides an example of wind evolution over 72 h in June (10–12 June 2017), which consisted of calm and windy periods. From Fig. 10b, the winds were mostly westerly or south-westerly at all vertical levels during SWEs. This is similar to previous studies and observations by Bromwich (Reference Bromwich1989) and Argentini et al. (Reference Argentini, Del Buono, Della Vedova and Mastrantonio1995), where most strong and katabatic winds were westerly, north-westerly or south-westerly over Terra Nova Bay. Figure 10c shows a comparison between the SODAR system (30 m height), the Tower (30 m height) and the AWS (3.3 m height) during the same time period for wind speed, air temperature and mean sea-level pressure. The slight increase in temperature after SWEs in this case study could be due to one of two phenomena: katabatic wind events or a synoptic influence from the nearby low-pressure system. The mean sea-level pressure also showed an increased during the two SWE periods. However, an observation from reanalysis data (European Centre for Medium-Range Weather Forecasts Reanalysis version 5 (ERA5); not shown) revealed a low-pressure system near the Ross Sea, which was the possible cause of the SWEs. This case study provided an example of the ability of SODAR to measure the vertical wind structure of two SWEs in high temporal resolution. However, more analysis is needed to determine how typical this vertical structure is for SWEs related to nearby low-pressure systems as well as during other types of SWEs. Additionally, there was more weak turbulence at various levels during calm periods compared to during the SWE periods. This also indicated that the wind direction was consistent, from the surface to at least 500 m, during SWEs.
The ABLH was investigated using sounding data to determine the effect of SWEs on ABLH (Fig. 10a–c). The ABLH estimate was calculated using the bulk Richardson number. A comparison was only able to be performed at 00h00 UTC due to the sounding data’s temporal limitation (only being available at 00h00 UTC). The ABLH values shown here were calculated using the bulk Richardson number for 10–12 June 2017 at 00h00 UTC (midday in winter in local time). The ABLH was shallow, at below 100 m, except on 11 June, when the ABL was 351 m, as the SWE was developing. It was different during the calm period (00h00 UTC, 10 June 2017, ABLH: 24 m) and during the windy period (00h00 UTC, 12 June 2017, ABLH: 72 m). The elevated ABLH may also be associated with the increase in mean sea-level pressure as seen in Fig. 10c. This probably represents the impact of the nearby low-pressure system that caused the SWE to occur. These results were only based on a 3 day analysis, and more analyses are needed to draw conclusions regarding the behaviour of the ABLH during various weather conditions in this region.
Conclusion
This paper evaluated the wind dataset measured by SODAR and compared it to the wind dataset measured by the Tower and AWS for the period between 9 May until 31 October 2017. The SODAR system recorded a slower mean wind speed (2.4 m s−1) than the Tower and AWS (4.6 and 4.3 m s−1, respectively). This difference could be due to the many missing data in the SODAR measurements, especially during SWEs. However, removing the dates of these missing SODAR data from the Tower and AWS measurements still indicates a slower mean wind speed for SODAR compared to the other two instruments. The maximum wind speeds recorded from the SODAR system, the Tower and the AWS were 18.1, 34.0 and 25.8 m s−1, respectively. Even though the station is close to the maximum wind flow at Terra Nova Bay (Inexpressible Island and Reeves Glacier), it is still away from the main route of the maximum wind flow path. Using BF6 as the SWE threshold for a windy event, there were 50 days recording SWEs out of 175 days from the SODAR measurements, which is close to the SWE days recorded by the AWS (52 days) but much lower than the SWE days recorded by the Tower (83 days). The SODAR measurements, however, show a good correlation with the Tower and AWS measurements, with 0.94 and 0.92 correlation coefficients, respectively.
The hourly mean wind speed as recorded by the SODAR system showed a similar pattern, recording lower wind speeds than the Tower and AWS. The wind directions according to the SODAR system were more similar to the Tower than the AWS measurement, possibly due to the different heights of measurement. Westerly winds dominate the SWEs at this station, as recorded by all three instruments. The wind direction during calmer period varied. In terms of wind direction, all three instruments showed similar results during strong wind periods and varying results during calm periods. The varied wind direction during calm periods could be due to the small level of turbulence detected by the SODAR system, which was less prominently detected by the AWS and the Tower. The different measurements recorded by the SODAR system may have been due to the difference in measurement method, as strong interference may cause the acoustic signal lost by the SODAR system and so not be detected by the receiver.
The high temporal resolution of the SODAR system has proven useful when evaluating the evolution of wind vertically. For example, when studying conditions from 10 to 12 June 2017, the wind direction was uniform at all vertical levels during SWE periods. The wind direction varied during calm periods at various vertical levels. The characteristic of the ABL was also analysed using the bulk Richardson number method during the same period (10–12 June 2017). It showed a lower boundary layer overall (below 100 m), but a higher one on 11 June (351 m) when the SWE was developing. The mean sea-level pressure according to the AWS also indicated higher pressure developing during 11 June, indicating a nearby or passing by low-pressure front. Therefore, this low pressure may be the reason why the SWE occurred. This is, of course, only based on a 3 day analysis, and to draw firmer conclusions, more analyses need to be conducted.
This preliminary analysis showed the capability of the SODAR system to measure wind profiles with high temporal resolution - hourly in this project. The capacity of the SODAR system to measure wind profiles at even higher temporal resolution (every 15 min) could help meteorologists to understand vertical wind profiles better than when using other instruments (i.e. sounding measurements, which are normally taken every 12 or 24 h).
Acknowledgements
All authors would like to thank Yayasan Penyelidikan Antartika Sultan Mizan (YPASM), Ministry of Science and Technology Malaysia, Ministry of Higher Education Malaysia, Korean Polar Institute (KOPRI) and all KOPRI personnel involved in installing and maintaining the SODAR at Jang Bogo Station, Antarctica, from 2015 until now.
Author contributions
AAS led the experiment and campaign. MSYT and SNC worked on the experimental setup at Jang Bogo Station. MFFMN wrote the draft and analysis. TC, H-JB, WS and S-JK worked on the Tower data analysis and the comparison with the SODAR system and the AWS. MFFMN, MSYT, SNC and AAS worked on subsequent overall analysis of the SODAR system and the AWS and Tower dataset and final write-up.
Financial support
This work was supported by the Fundamental Research Grant Scheme (FRGS: FP059-2019A), the Ministry of Sciences Technology and Innovation Flagship Grant (FP1213E03). The fieldwork and research was funded by Yayasan Penyelidikan Antartika Sultan Mizan (YPASM; project (PV033-2018), the Ministry of Science and Technology Malaysia (GA007-2014FL) and the Korea Polar Research Institute (KOPRI; grant no. PE21070). MFFMN and AAS were supported by the Ministry of Higher Education, project no. HICoE IOES-2023A during the study and write-up period. S-JK was supported by a KOPRI grant funded by the Ministry of Oceans and Fisheries (KOPRI PE25030).
Competing interests
The authors declare none.


 Open access