


INTRODUCTION
The 1918–1920 influenza pandemic was the most devastating epidemic in recorded human history, responsible for 20–100 million deaths worldwide [Reference Johnson and Mueller1–Reference Patterson and Pyle3], most of which occurred during a single winter (1918–1919). Apart from the sheer magnitude of the mortality impact, the 1918–1920 influenza pandemic had unusual epidemiological characteristics, with highest mortality impact concentrated in young adults [Reference Olson4, Reference Simonsen5].
Most of the severe burden due to seasonal influenza epidemics is borne by infants, the elderly, and those with certain chronic health conditions and the majority of influenza-related deaths is estimated to occur in people aged >65 years in USA [Reference Simonsen6, Reference Thompson7]. In contrast, all three pandemics of the 20th century demonstrated an age shift of mortality towards younger age groups, including younger adults and children [Reference Simonsen5, Reference Simonsen8]. The 1918–1920 influenza pandemic is the most striking example of this age shift. In New York City, excess mortality rates in people aged <45 years exceeded those in people aged >45 years and young adults between the ages of 25 and 44 years suffered a ~50-fold higher mortality risk during the 1918–1920 pandemic than in typical epidemic seasons [Reference Olson4]. Further, historical studies in USA, UK and Denmark suggest that those aged >65 years suffered lower mortality rates during the 1918–1920 pandemic than would otherwise have been expected during a typical influenza epidemic season [Reference Olson4, Reference Simonsen5, Reference Collins9–Reference Langford12].
It is important to describe, quantify, and understand the mortality patterns of past pandemics in order to better prepare for future pandemics. Most research dedicated to the 1918–1920 pandemic has focused on countries in North America and in Europe, with few publications describing the experience in Asia [Reference Kawana13–Reference Rice and Palmer17]. In 1918, Japan was an emerging economic force, reaping the benefits of governmental reforms and integration of industrial technology. Only three studies discuss the 1918–1920 pandemic in Japan, focusing on a primarily qualitative [Reference Palmer and Rice16, Reference Rice and Palmer17] and clinical [Reference Kawana13] description, and limited to a single winter season, 1918–1919. Here we compile historical vital statistics from Japan and describe the age and geographical mortality patterns associated with the successive waves of the influenza pandemic during 1918–1920. We also compare the age pattern of pandemic-related mortality in Japan with that of USA and UK to explore differences in pandemic mortality impact in various populations.
MATERIAL AND METHODS
Data
Deaths from influenza, pneumonia and influenza (P&I), and all-cause were compiled for Japan overall and in the 47 prefectures by month during 1915–1923 from the Vital Statistics of Japan [18]. Annual age-specific P&I and all-cause mortality data were also available for Japan [18]. Demographic data for each Japanese prefecture were obtained from the Japanese Statistics Bureau (population size, density, median age, mean age, percent of population aged between 15 and 64 years) [19]. For comparison purposes, we also compiled mortality rates by calendar year and age group (the percentage of those in a given age group who died within a year) from the National Center for Health Statistics for USA [20], and the Office for National Statistics for UK [21].
Excess mortality estimates based on monthly data, all ages
Estimates of seasonal excess mortality for all ages were calculated in each prefecture and in all of Japan for the two pandemic influenza seasons 1918–1919 and 1919–1920. We used a Serfling-type seasonal regression approach applied to monthly time-series of P&I and all-cause mortality rates during 1915–1923 to extrapolate baseline mortality in the absence of influenza virus circulation (described in detail in [Reference Simonsen22, Reference Serfling, Sherman and Houseworth23]; see also Fig. 1). The seasonal regression model included time trends and harmonics terms and was applied to mortality time-series after excluding data during extended winter seasons (November–April in all years 1915–1923, as well as October 1918 and 1919, and May 1919 and 1920). In addition in September 1923, a major earthquake caused unusually high all-cause mortality in Tokyo and two surrounding prefectures, Kanagawa, and Chiba. We removed these outliers to create the model baseline for all-cause mortality, and replaced observed rates for September 1923 with the average rates for August and October 1923 in those three prefectures.
Seasonal P&I and all-cause excess mortality rates were calculated as observed rates minus predicted baseline rates during influenza epidemic months, and summed for each geographical unit and pandemic season. Influenza epidemic months were identified by applying a seasonal regression to influenza-specific mortality time-series, which are considered a good indicator of the timing of influenza virus activity [Reference Simonsen22, Reference Serfling, Sherman and Houseworth23]. Influenza-specific deaths exceeded the upper limit of the 95% confidence interval of the model during October 1918–May 1919 and December 1919–May 1920 – the two pandemic seasons of interest.
Unless otherwise indicated, Spearman's correlation was used to compare seasonal excess mortality rates between the two pandemic seasons and test the rank agreement between seasonal rates and demographic indicators at the prefecture level.
Excess age-specific mortality estimates based on annual data
Historic age-specific mortality data were only available annually; therefore a seasonal regression approach applied to monthly data could not be used. In order to estimate excess mortality by age groups using annual data, we followed the approach recently described by Murray et al. [Reference Murray2]. The average of annual all-cause and P&I mortality rates for pre- and post-pandemic years 1915–1917 and 1921–1923 (after earthquake adjustment for year 1923) were considered as baseline rates. Pandemic excess rates were calculated as the observed rates during pandemic years 1918–1920 minus the baseline rates. The same approach was applied to annual mortality data from Japan, UK and USA. In this paper, our main comparisons between countries are based on P&I mortality, since P&I outcomes are generally more specific indicators of influenza burden. In addition, the First World War could have inflated all-cause mortality in baseline years and obscured the impact of the pandemic. We also summarize the results of sensitivity analyses based on all-cause mortality.
Comparison of monthly and annual approaches to estimate excess mortality
Since both monthly and annual data were available for the 47 prefectures of Japan, and for P&I and all-cause mortality outcomes, we used correlation analysis to evaluate the accuracy of the annual approach (which calculates the mortality in excess of what would normally be expected within a year) against the more refined monthly approach (which calculates excess mortality due to influenza during the winter months). In addition, we calculated the mean difference between estimates derived from the two approaches.
Standardization of mortality across age groups and countries
Baseline mortality rates were different across age groups and countries; therefore, we standardized pandemic mortality rates for each age group and country by calculating the ratio of mortality in 1918–1920 to mortality in surrounding baseline years.
RESULTS
Overall pandemic mortality impact in Japan during 1918–1920
Japan experienced two successive influenza seasons of excess pandemic mortality (October 1918–May 1919 and December 1919–May 1920), peaking in November 1918 and January 1920, respectively (Fig. 1). By applying a seasonal regression model to monthly all-cause mortality in the total Japanese population, we estimated a cumulative excess mortality rate of 0·87% during 1918–1920, corresponding to over 481 000 excess deaths (Table 1). A similar model applied to monthly P&I mortality captured 86% of these excess deaths.
Monthly time-series of (a) influenza, (b) pneumonia and influenza, and (c) all-cause mortality rates (——) and predicted Serfling model baseline mortality rates (- - -), Japan, 1915–1923.

Comparison of influenza-related excess mortality in Japan, 1918–1920, for two excess mortality approaches

P&I, Pneumonia and influenza.
† Rate is calculated per two influenza seasons.
Estimates are based on the monthly approach (Serfling seasonal regression) or the annual approach using pre- and post-pandemic years as baseline. Both approaches are applied to two mortality outcomes: P&I and all-cause mortality.
Comparison of annual and monthly excess mortality approaches, 1918–1920
The monthly and annual approaches for calculating excess mortality produced similar estimates for P&I and all-cause outcomes, when applied to the entire Japanese population during 1918–1920 (within 2% for P&I and 11% for all-cause, Table 1). For both mortality outcomes, the seasonal regression approach gave slightly lower numbers than the annual approach. At the prefecture level, estimates produced by the two approaches were similar and highly correlated for P&I (Spearman's rho=0·87, P<0·001; mean difference=2%, range −13% to 27%; Fig. 2). Estimates were also consistent for all-cause mortality, although it is considered a less specific outcome (Spearman's rho=0·75, P<0·001; mean difference=−1%, range −47% to 36%).
Comparison of the monthly and annual approaches for estimating excess (a) pneumonia and influenza and (b) all-cause mortality rates/100 population in the 47 Japanese prefectures, during the pandemic period 1918–1920. The monthly approach uses a Serfling seasonal regression and the annual subtraction approach uses rates in surrounding years 1915–1917 and 1921–1923 as baseline. National estimates for Japan are indicated by a solid square (▪).

Geographical mortality patterns across Japan
Japanese prefectures did not experience pandemic mortality with the same timing or intensity throughout the country (see Fig. 3 and Supplementary Fig. 1, available online). During the 1918–1919 season, many Japanese prefectures experienced peak excess P&I mortality in November 1918 (35/47, 74·0%), while the remainder experienced peak excess P&I mortality in December (7/47, 14·9%), and February (5/47, 10·6%). There was a clear geographical pattern with northern prefectures experiencing later peaks (Fig. 3). The peak month of excess P&I mortality in the second pandemic season of 1919–1920 was more varied and also followed a geographical trend, travelling from the southwest in January to the northeast in March. The mean excess all-cause mortality rate in the prefectures during 1918–1919 was 0·57% (95% CI 0·52–0·61) and during 1919–1920 was 0·33% (95% CI 0·30–0·36).
Peak month of excess pneumonia and influenza (P&I) mortality, by prefecture and pandemic season. (a) October 1918–May 1919 and (b) December 1919–May 1920. Excess P&I mortality is calculated by the monthly seasonal Serfling approach.

A few prefectures (4/47, 9%) experienced greater mortality impact during the second season of pandemic virus circulation (defined as percent of total 1918–1920 excess mortality in the second season, 1919–1920: >50%). The most extreme example of this was Okinawa, Japan's southernmost prefecture consisting of a collection of hundreds of islands, in which 62% of pandemic excess deaths during 1918–1920 occurred during the second season. The other areas to experience more than half of their pandemic mortality burden in the second season were three prefectures around Tokyo, Chiba, Shizuoka, and Yamanashi (54–59% of the cumulative excess mortality occurred in the second season). The most densely populated prefecture, Tokyo, experienced an almost equal mortality impact in both seasons (0·34% and 0·33%). In order to determine if the experience of prefectures was the same from one season to the next, we compared the excess mortality during the 1918–1919 season with that in 1919–1920. There was no statistically significant correlation between excess mortality rates in the first and second pandemic seasons (Spearman's rho=−0·22, P=0·14) throughout the 47 prefectures.
Next, we explored whether geographical differences in population size, density, age structure and baseline mortality rates in Japanese prefectures could explain the observed threefold geographical variations in mortality impact (Fig. 2). Overall we only found weak or non-significant associations, sometimes conflicting between the two pandemic seasons. Population size and density were moderately negatively associated with excess all-cause mortality rates in 1918–1919 (Table 2; see also Supplementary Figs 2, 3, available online), while population density was moderately positively associated with excess all-cause mortality rates in 1919–1920. A similar strength of correlation was obtained with population density and P&I excess mortality rates during 1919–1920. This suggests that more rural and less populous prefectures experienced a greater impact during the first pandemic season, whereas prefectures with larger cities suffered greater mortality during the second season (a pattern that persisted even after excluding Tokyo and three surrounding prefectures from the analysis). Neither prefecture population age structure (as determined by average age, median age, and percent of population aged between 15 and 64 years) nor baseline infant mortality rates were associated with total pandemic excess mortality rates during 1918–1920 (P>0·1). Excess mortality during each individual pandemic season was not correlated with baseline all-cause mortality (P>0·1), but total pandemic excess mortality during the two pandemic seasons was moderately correlated with baseline all-cause mortality (Spearman's rho=0·34, P=0·02; Pearson's rho=0·23, P=0·12). We obtained similarly weak statistical associations when using excess P&I rates instead of excess all-cause rates (Spearman's rho=0·36, P=0·01; Pearson's rho=0·33, P=0·02).
Pearson and Spearman correlation coefficients between excess all-cause and pneumonia and influenza (P&I) mortality rates and population size and density

* P<0·05.
Age patterns of mortality in Japan using annual data
The annual age distribution of mortality associated with the 1918–1920 pandemic was unusual compared with baseline years when seasonal influenza virus circulated. During the pre- and post-pandemic years, P&I mortality occurred in a U-shaped pattern typical of inter-pandemic influenza seasons, with highest rates in children and seniors. In contrast, adults aged ⩾55 years were relatively spared during the three pandemic years in 1918–1920, with excess mortality rates that peaked in children aged <5 years and young adults aged 25–34 years (Figs 4, 5 a).
Age patterns of excess pneumonia and influenza (P&I) mortality rates in Japan, by year, 1918–1920. Excess mortality estimates are calculated with the annual approach (subtracting mortality in pandemic years 1918–1920 from average baseline mortality in surrounding years 1915–1917 and 1921–1923).

(a) Comparison of age-specific excess pneumonia and influenza (P&I) mortality rates during pandemic years 1918–1920 in Japan, UK, and USA. Estimates are calculated using the annual approach. (b) Ratio of P&I mortality during 1918–1920 pandemic years to baseline P&I mortality in 1915–1917 and 1921–1923, for Japan, UK, and USA. Extreme age groups (children aged <5 years and adults aged >55 years) were less affected than young adults, relative to non-pandemic influenza seasons.

Standardization by background mortality in surrounding non-pandemic years showed that young adults aged 25–34 years had the largest increase in mortality, with P&I mortality rates almost ninefold higher during the pandemic period relative to the baseline period (Fig. 5 b). The two extreme age groups, adults aged ⩾55 years and young children, who experienced excess P&I mortality during the pandemic but also had high background rates of death, had a much smaller rise over baseline (relative risk 1·4 in children aged <5 years and 1·8 in adults aged ⩾55 years). Sensitivity analyses based on all-cause mortality confirmed that young adults experienced the largest increase over baseline mortality during the pandemic (relative risk 1·44, compared to a relative risk during the pandemic of 1·05 for both extreme age groups, children aged <5 years and adults aged ⩾55 years).
Comparison with mortality in USA and UK
We compared the cumulative age-specific excess mortality for 1918–1920 in Japan with that of two well-studied countries, USA and UK, based on the annual approach (Table 3). At baseline (1915–1917, 1921–1923), Japan had higher all-cause mortality rates than USA and UK in the youngest age groups (<25 years). During the pandemic period, the excess P&I mortality rates in all three countries were high for those aged 25–44 years, but those in UK were considerably lower than those in USA or Japan (Fig. 5 a). Japan experienced substantially higher rates of excess P&I mortality in children aged <5 years and in adults aged >44 years than did USA or UK. After standardization by baseline mortality, pandemic excess mortality patterns became remarkably similar in the three countries, with an elevated relative risk in people aged 15–44 years (five- to tenfold higher than baseline, Fig. 5 b), and a consistent peak of relative risk for those aged 25–34 years. Sensitivity analyses based on all-cause mortality confirmed that standardization by baseline mortality reduced between-country differences in age patterns.
Comparison of excess all-cause and pneumonia and influenza (P&I) mortality rates per 100 population, 1918–1920
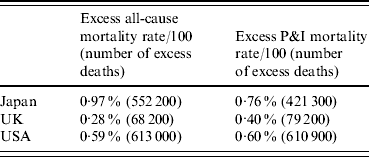
Estimates are calculated by the annual approach, as mortality rates during 1918–1920 minus average mortality rates in the surrounding years of 1915–1917 and 1921–1923.
Another interesting difference between Japan and the other two countries relates to the timing of pandemic mortality impact. Most excess P&I deaths occurred during 1918 in USA and UK, whereas in Japan, a larger proportion of excess P&I mortality occurred during the second and third years of the pandemic period (1919 and 1920) (Fig. 6). Considering only the mortality impact during 1918, USA experienced the highest excess P&I mortality rate (0·44% of the population) while Japan and UK were more similar (Japan 0·30%, UK 0·32%). However, when considering the cumulative excess P&I burden of the pandemic during the entire 1918–1920 period, Japan was hardest hit (0·76%), followed by USA (0·60%) and UK (0·40%). Analysis of all-cause mortality gave similar results regarding the timing of mortality impact.
Percent of excess pneumonia and influenza deaths during 1918–1920 occurring in each year, 1918 (▪), 1919 ( ), and 1920 (□) for Japan, UK, and USA. Excess mortality estimates are based on the annual approach.

DISCUSSION
In this study, we explored variation in the mortality impact of the 1918–1920 pandemic across Japanese prefectures and compared the age mortality patterns in Japan with those in USA and UK. Perhaps the most striking difference across countries was the more balanced mortality impact of three successive pandemic years in Japan (1918–1920), while mortality was more concentrated in the first year in USA and UK. Age patterns in excess mortality rates during 1918–1920 were quite different across countries, but these differences disappeared after standardization by baseline non-pandemic mortality. Adults aged 25–44 years consistently experienced the highest risk of pandemic death in all three countries, corresponding to a five- to tenfold rise over baseline P&I mortality rates in non-pandemic years. This consistent age mortality pattern associated with the 1918–1920 influenza pandemic virus, observed in vastly different settings, suggests that the catastrophic experience in young adults was something specific to the virus and/or prior exposure of older cohorts to a similar virus, rather than local environmental or behavioural factors.
We estimated that nearly 500 000 deaths were attributable to the emerging pandemic virus circulating during 1918–1920 in Japan, i.e. 0·87% of the population. Analysed by year, almost 300 000 excess deaths were attributable to the October 1918-May 1919 influenza season (rate 0·54%), and 182 000 deaths to the December 1919–May 1920 season (rate 0·33%). Previous studies gave lower burden estimates for this pandemic in Japan, ranging from 257 000 to 390 000 deaths [Reference Johnson and Mueller1, Reference Patterson and Pyle3, Reference Kawana13, Reference Rice and Palmer17]; however, two major limitations make these early estimates unreliable. First, these estimates were limited to the first pandemic season, thereby excluding all pandemic-related deaths occurring in the second pandemic season, December 1919–May 1920. Second, these estimates were based on a sum of all P&I deaths during 1918–1919 – a crude indicator of pandemic burden because of the unknown proportion of P&I deaths attributable to other respiratory pathogens that would have occurred in the absence of a pandemic. In this study, we have applied a more rigorous excess mortality approach taking into account baseline non-pandemic mortality and believe that our estimate of 500 000 excess deaths during 1918–1920 is the most accurate so far.
We took advantage of the refined spatial and temporal resolution of Japanese historical mortality records, available by disease code, month and prefecture (n=47), to compare the accuracy of monthly and annual approaches for estimating excess mortality during a pandemic. Despite both approaches being widely used in the past for estimating influenza-related burden [Reference Murray2, Reference Olson4, Reference Thompson7, Reference Andreasen, Viboud and Simonsen10, Reference Luk, Gross and Thompson24], there has not been a formal comparison of their results. Here we showed that both approaches gave similar estimates for P&I mortality (within 2% of each other), a quite specific outcome of influenza burden. For a less specific outcome like all-cause mortality, the cruder annual approach provided reasonable excess mortality numbers, although somewhat larger than those derived using the monthly approach. We note that the cruder annual approach applied to all-cause mortality worked for the devastating 1918–1920 influenza pandemic, but is likely to be unreliable for milder pandemics or typical epidemic seasons.
While Japanese mortality data were relatively detailed, this was not the case for USA and UK data, as monthly mortality rates were not available. Hence, our cross-country comparisons rely on the annual method for calculating excess mortality. We believe that, in this case, annual comparisons are valid, in particular to measure the relative contribution of each pandemic season. For instance, a sensitivity analysis for Japan shows that, of all excess deaths occurring during 1918–1920, 57·3% can be attributed to the first pandemic season (October 1918–May 1919) and 42·7% to the season (December 1919–May 1920), based on the monthly approach. The cruder annual approach gives very similar results, with 59·3% of excess mortality occurring in years 1918–1919 and 40·7% in 1920. The annual approach does well for this comparison, both because the 1918–1920 pandemic was a major event and the second pandemic season was very late and occurred mostly in 1920 – so that the impact of each pandemic season can be distinguished on an annual time scale.
The timing of the main wave of the 1918–1919 pandemic in Japan was broadly similar to that in Scandinavian and USA cities with local peak mortality occurring between October 1918 and February 1919 [Reference Andreasen, Viboud and Simonsen10, Reference Collins and Jehmann25]. Influenza-related excess mortality continued during 1919 and 1920 in New York City [Reference Olson4] and in other cities in USA [Reference Collins and Jehmann25]. Here, we estimate that influenza-related excess mortality in 1919 and 1920 accounted for 20–25% of cumulative excess deaths during the entire period 1918–1920 in USA and UK. In contrast in Japan, 60% of pandemic deaths occurred during 1919 and 1920, and the second season was more lethal than the first season in some prefectures. The years 1919 and 1920 exhibited excess mortality patterns in young adults typical of the 1918 pandemic in all three countries studied; therefore, we consider the 1919–1920 season to be part of the pandemic, even though minor changes in the genetic composition of the pandemic virus may have occurred since it first emerged in the human population.
Past research has produced conflicting findings regarding the association between socioeconomic conditions, population density, and influenza mortality burden, in particular during pandemics. Across the 47 Japanese prefectures, we found only weak correlations between pandemic excess mortality rates and baseline all-cause mortality, a proxy measure for access to health care or socioeconomic status (Spearman's rho=0·34, Pearson's rho=0·23). This strength of correlation is in line with a study of the 1918 pandemic in USA cities (Pearson's rho=0·44 between mortality rates during the 1918 pandemic and baseline years) [Reference Bootsma and Ferguson26] and in the cities and towns of England and Wales (Spearman's rho ⩽0·4 between mortality rates during the 1918 pandemic and household crowding and infant mortality rates) [Reference Chowell27]. By contrast, Murray et al. determined that income explained almost half of the variance in excess mortality rates in 26 countries [Reference Murray2]. Variations in socioeconomic status were substantially larger across countries than across prefectures or cities, perhaps explaining conflicting results across studies focused on different geographical scales. Further, we only explored a limited number of socioeconomic and demographic factors in this study.
Overall, the excess mortality rate in Japan (0·97% calculated using the annual method) was in between the rates observed in Western countries like USA (0·28%) and UK (0·59%), and those observed in other Asian countries which were more severely hit (India 4·4%, Sri Lanka 1·7%, Taiwan 1·4% [Reference Murray2], and Singapore 1·8% [Reference Lee15]). Of note, these comparisons do not control for the effect of herald waves [Reference Olson4, Reference Andreasen, Viboud and Simonsen10] that may have occurred before October 1918 in some locations and which are impossible to identify in the absence of monthly age-specific mortality data. For instance, herald waves documented in Scandinavian cities, UK, and US Army camps in the spring and summer of 1918 have been associated with high rates of morbidity and low mortality, and may have protected a fraction of the population during later outbreaks [Reference Olson4, Reference Andreasen, Viboud and Simonsen10, Reference Barry, Viboud and Simonsen28], resulting in low pandemic mortality burden overall. Further analysis of the association between pandemic mortality burden, population and geographic factors, and the impact of herald waves, is warranted.
Japan experienced high mortality rates during the 1918–1920 pandemic, particularly when the second season is included in the overall pandemic impact. This second pandemic season has not been adequately explored and the possibility of a pandemic that spans multiple seasons provides an extended window of opportunities for pandemic planning and mitigation of impact. The Japanese 1918–1920 experience, taken together with reports of mild herald waves in the spring and summer 1918 in USA and Europe [Reference Olson4, Reference Andreasen, Viboud and Simonsen10, Reference Barry, Viboud and Simonsen28], and smouldering waves in Europe and Asia during the 1968–1970 pandemic [Reference Viboud29], suggest that distribution of a pandemic vaccine even a few months after emergence of a novel virus could still save lives in some regions. However, as the scope and location of the next pandemic is unpredictable and travel patterns have changed considerably since 1918, public health authorities should plan to deliver pandemic influenza vaccines as early as possible to maximize benefits.
We found substantial variability in total pandemic excess mortality impact among 47 prefectures in Japan during 1918–1920, of which only 4–12% could be explained by differences in baseline all-cause mortality, population size or population density. Our study therefore reinforces the intriguing concept that each country, if not each city, has a different experience with influenza pandemics and epidemics. It remains unclear whether these geographical variations in mortality impact result from unexplored differences in baseline socioeconomic factors, contact patterns, pre-existing population immunity, or circulating strains. More quantitative studies of influenza impact in diverse populations will help shed light on this question – which ultimately bears on our ability to predict the likely impact of a 1918-like pandemic in today's global population.
ACKNOWLEDGEMENTS
This work was funded by the Intramural Research Program of the Fogarty International Center, National Institutes of Health. We thank Dr Wladimir Alonso and his staff for assistance in entering historical mortality data for Japan.
DECLARATION OF INTEREST
None.
NOTE
Supplementary material accompanies this paper on the Journal's website (http://journals.cambridge.org/hyg).



