


1. Introduction
The Poisson process is one of the most widely used counting processes with nice mathematical properties and applications in diverse disciplines of applied sciences, namely insurance, economics, biology, queuing theory, reliability, and statistical physics. In recent years, the construction and generalization of the counting processes via subordination techniques have received a considerable amount of interest from theoretical and application viewpoints [Reference Stanislavsky and Weron32, Reference Wang34]. [Reference Orsingher and Polito26] introduced a space-fractional version of the Poisson process by subordinating the homogeneous Poisson process (HPP) with an independent $\alpha$
-stable subordinator; [Reference Meerschaert, Nane and Vellaisamy25] studied the Poisson process by considering an inverse stable subordinator and established its connection with the fractional Poisson process; [Reference Orsingher and Toaldo27] proposed a unified approach by time-changing the HPP with an independent general Lévy subordinator. For more recent developments in this direction, see [Reference Gajda, Kumar and Wyłómańska11, Reference Kumar, Maheshwari and Wyłómańska19, Reference Kumar, Nane and Vellaisamy20, Reference Maheshwari and Vellaisamy24, Reference Soni and Pathak31] and references therein.
$\alpha$
-stable subordinator; [Reference Meerschaert, Nane and Vellaisamy25] studied the Poisson process by considering an inverse stable subordinator and established its connection with the fractional Poisson process; [Reference Orsingher and Toaldo27] proposed a unified approach by time-changing the HPP with an independent general Lévy subordinator. For more recent developments in this direction, see [Reference Gajda, Kumar and Wyłómańska11, Reference Kumar, Maheshwari and Wyłómańska19, Reference Kumar, Nane and Vellaisamy20, Reference Maheshwari and Vellaisamy24, Reference Soni and Pathak31] and references therein.
Apart from univariate counting processes, researchers have explored multivariate versions of the counting process in recent years for effectively analyzing complex real-world phenomena arising in daily life. However, we remark that the literature on multivariate fractional Poisson processes is quite limited, since this is a recent topic of interest. A multivariate fractional Poisson counting process was defined in [Reference Beghin and Macci3] by considering a common random time-change of a finite-dimensional independent Poisson process. Along the same lines, [Reference Beghin and Macci4] obtained asymptotic results for a different multivariate version of the fractional Poisson process. Moreover, among other topics, [Reference Beghin and Vellaisamy5] studied the time-change of a multidimensional space-fractional Poisson process by a common independent gamma subordinator. A multi-parameter fractional Poisson process was considered in [Reference Leonenko and Merzbach23] using inverse subordinators and Mittag–Leffler functions, and its main characteristics were studied.
In this paper, we introduce a bivariate tempered space-fractional Poisson process (BTSFPP) by time-changing the bivariate Poisson process with an independent tempered $\alpha$
-stable subordinator (TSS) and study its important characteristics. It should be stressed that the BTSFPP under investigation is a natural multivariate extension of the Poisson process with a relativistic stable subordinator studied in [Reference Orsingher and Toaldo27]. In particular, we derive its Lévy measure and the governing differential equations of the probability mass function (PMF) and probability-generating function (PGF). As an application in a research area of interest in survival analysis and reliability theory, we also propose a shock model for predicting the failure time of items subject to two external random shocks in a counting pattern governed by the BTSFPP. The system is supposed to break when two types of shock reach their random thresholds. The results related to reliability, such as reliability function, hazard rates, failure density, and the probability that the failure occurs due to a certain type of shock, are studied. Several typical examples based on different random threshold distributions are also presented. Later on, for a general Lévy subordinator, we show that the failure time of the system is exponentially distributed with mean depending on the Laplace exponent of the Lévy subordinator when the threshold is geometrically distributed. Graphs of survival function for different values of tempering parameters
$\alpha$
-stable subordinator (TSS) and study its important characteristics. It should be stressed that the BTSFPP under investigation is a natural multivariate extension of the Poisson process with a relativistic stable subordinator studied in [Reference Orsingher and Toaldo27]. In particular, we derive its Lévy measure and the governing differential equations of the probability mass function (PMF) and probability-generating function (PGF). As an application in a research area of interest in survival analysis and reliability theory, we also propose a shock model for predicting the failure time of items subject to two external random shocks in a counting pattern governed by the BTSFPP. The system is supposed to break when two types of shock reach their random thresholds. The results related to reliability, such as reliability function, hazard rates, failure density, and the probability that the failure occurs due to a certain type of shock, are studied. Several typical examples based on different random threshold distributions are also presented. Later on, for a general Lévy subordinator, we show that the failure time of the system is exponentially distributed with mean depending on the Laplace exponent of the Lévy subordinator when the threshold is geometrically distributed. Graphs of survival function for different values of tempering parameters $\theta$
and stability index
$\theta$
and stability index $\alpha$
are also shown.
$\alpha$
are also shown.
We recall that the classical competing risks model deals with failure times subject to multiple causes of failure. It is suitable, for instance, for describing the failures of organisms or devices in the presence of many types of risk. In the basic setting, this model deals with an observable pair of random variables $(T, \zeta)$
, where T is the time of failure and
$(T, \zeta)$
, where T is the time of failure and $\zeta$
describes the cause or type of failure. For a description of the main features of this model we refer, for instance, to [Reference Bedford and Cooke2, Reference Crowder8]. A recent research line in this field focuses on the analysis of competing risk models arising from shock models. Specifically, we study the bivariate counting process
$\zeta$
describes the cause or type of failure. For a description of the main features of this model we refer, for instance, to [Reference Bedford and Cooke2, Reference Crowder8]. A recent research line in this field focuses on the analysis of competing risk models arising from shock models. Specifically, we study the bivariate counting process $(\mathcal{N}_1^{\alpha, \theta}(t, \lambda_1),\mathcal{N}_2^{\alpha, \theta}(t, \lambda_2))$
, whose components describe respectively shocks of type 1 and type 2 occurring in (0, t] to a given observed system. Failure of the system occurs as soon as the total number of shocks reaches an integer-valued random threshold L for the first time, so that the cause of failure is
$(\mathcal{N}_1^{\alpha, \theta}(t, \lambda_1),\mathcal{N}_2^{\alpha, \theta}(t, \lambda_2))$
, whose components describe respectively shocks of type 1 and type 2 occurring in (0, t] to a given observed system. Failure of the system occurs as soon as the total number of shocks reaches an integer-valued random threshold L for the first time, so that the cause of failure is $\zeta=n$
if a shock of type
$\zeta=n$
if a shock of type $n=1,2$
effectively produces the system’s failure.
$n=1,2$
effectively produces the system’s failure.
The recent literature in this area includes the following contributions. Various counting processes in one-dimensional and multidimensional settings, as well as in time-changed versions, have been successfully applied to shock models, deterioration models, and further contexts of interest in reliability theory. For instance, [Reference Di Crescenzo and Longobardi9] discussed a bivariate Poisson process with applications in shock models, and [Reference Di Crescenzo and Meoli10] considered a bivariate space-fractional Poisson process, studying competing risks and shock models associated with it. In reliability theory and survival analysis, system failure is discussed primarily using conventional competing risks and shock models. A class of general shock models in which failure arises as a result of competing causes of trauma-related degradation was presented in [Reference Lehmann22]. A new class of bivariate counting processes that have marginal regularity property was developed in [Reference Cha and Giorgio7] and utilized in a shock model. For recent development in this area, see [Reference Cha and Finkelstein6, Reference Di Crescenzo and Meoli10, Reference Wang34].
The structure of the paper is as follows. In Section 2, we present some preliminary notation and definitions. In Section 3, we introduce the BTSFPP and discuss its connection to differential equations. A bivariate shock system governed by the BTSFPP and some reliability-related results of the failure time of the system are provided in Section 4. Also, we present a bivariate Poisson time-changed shock model when the underlying process is governed by an independent general Lévy subordinator. Finally, some concluding remarks are discussed in the last section.
2. Preliminaries
In this section, some notation and results are given that will be used in the subsequent sections. Let $\mathbb{N}$
denote the set of natural numbers, and
$\mathbb{N}$
denote the set of natural numbers, and $\mathbb{N}_0 = \mathbb{N} \cup \{0\}$
. Let
$\mathbb{N}_0 = \mathbb{N} \cup \{0\}$
. Let $\mathbb{R}$
and
$\mathbb{R}$
and $\mathbb{C}$
denote the sets of real and complex numbers, respectively.
$\mathbb{C}$
denote the sets of real and complex numbers, respectively.
2.1. Generalized Wright function
The generalized Wright function is defined by [Reference Kilbas, Saigo and Trujillo17]
 \begin{equation} _p\Psi_q \Bigg[z\; \Bigg| \; \begin{matrix} (\alpha_i, \beta_i)_{1,p} \\[5pt] (a_j,b_j)_{1,q} \end{matrix} \Bigg] = \sum_{k=0}^{\infty}\frac{z^k}{k!}\frac{\prod_{i=1}^{p}\Gamma(\alpha_i+\beta_ik)}{\prod_{j=1}^{q}\Gamma(a_j+b_jk)}, \qquad z, \alpha_i, a_i \in \mathbb{C},\ \beta_i, b_i \in \mathbb{R},\end{equation}
under the convergence condition $\sum_{j=1}^{q} b_j - \sum_{i=1}^{p} \beta_i >-1$
.
$\sum_{j=1}^{q} b_j - \sum_{i=1}^{p} \beta_i >-1$
.
2.2. Lévy subordinator
A Lévy subordinator, denoted by $\{S (t)\}_{t \geq 0}$
, is a nondecreasing Lévy process with Laplace transform [Reference Applebaum1, Section 1.3.2]
$\{S (t)\}_{t \geq 0}$
, is a nondecreasing Lévy process with Laplace transform [Reference Applebaum1, Section 1.3.2] $\mathbb{E}({\mathrm{e}}^{-uS(t)}) = {\mathrm{e}}^{-t\psi(u)}$
,
$\mathbb{E}({\mathrm{e}}^{-uS(t)}) = {\mathrm{e}}^{-t\psi(u)}$
, $u \geq 0$
, where
$u \geq 0$
, where $\psi(u)$
is the Laplace exponent given by [Reference Schilling, Song and Vondraček30, Theorem 3.2]
$\psi(u)$
is the Laplace exponent given by [Reference Schilling, Song and Vondraček30, Theorem 3.2]
 \begin{equation*} \psi(u) = \eta u +\int_{0}^{\infty} (1-{\mathrm{e}}^{-ux})\,\nu({\mathrm{d}} x), \qquad \eta \geq 0.\end{equation*}
Here, $\eta$
is the drift coefficient and
$\eta$
is the drift coefficient and $\nu$
is a nonnegative Lévy measure on the positive half-line satisfying
$\nu$
is a nonnegative Lévy measure on the positive half-line satisfying $\int_{0}^{\infty} \min \{x,1\}\,\nu({\mathrm{d}} x) < \infty$
and
$\int_{0}^{\infty} \min \{x,1\}\,\nu({\mathrm{d}} x) < \infty$
and $\nu ([0,\infty)) =\infty$
, so that
$\nu ([0,\infty)) =\infty$
, so that $\{S (t)\}_{t \geq 0}$
has strictly increasing sample paths almost surely (a.s.)—for more details, see [Reference Sato29, Theorem 21.3].
$\{S (t)\}_{t \geq 0}$
has strictly increasing sample paths almost surely (a.s.)—for more details, see [Reference Sato29, Theorem 21.3].
For $\alpha \in (0,1)$
and
$\alpha \in (0,1)$
and $\theta >0$
, the tempered
$\theta >0$
, the tempered $\alpha$
-stable subordinator
$\alpha$
-stable subordinator $\{S^{\alpha, \theta}(t)\}_{t\geq 0}$
is defined by the Laplace transform [Reference Kumar and Vellaisamy21]
$\{S^{\alpha, \theta}(t)\}_{t\geq 0}$
is defined by the Laplace transform [Reference Kumar and Vellaisamy21]
 \begin{equation} \mathbb{E}\big[{\mathrm{e}}^{-u S^{\alpha, \theta}(t) }\big] = {\mathrm{e}}^{-t((u+\theta)^\alpha - \theta^\alpha)},\end{equation}
with Laplace exponent $\psi(u) = (u+\theta)^\alpha - \theta^\alpha$
. Further, the Lévy density
$\psi(u) = (u+\theta)^\alpha - \theta^\alpha$
. Further, the Lévy density $\nu(s)$
associated with
$\nu(s)$
associated with $\psi$
is (see [Reference Gupta, Kumar and Leonenko15, (5)] and [Reference Rama and Tankov28])
$\psi$
is (see [Reference Gupta, Kumar and Leonenko15, (5)] and [Reference Rama and Tankov28])
 \begin{equation} \nu(s) = \frac{\alpha}{\Gamma(1-\alpha)}\frac{{\mathrm{e}}^{-\theta s}}{s^{\alpha+1}}, \qquad s >0.\end{equation}
Let $f_{S^{\alpha, \theta}(t)}(x,t)$
denote the probability density function (PDF) of the TSS. By independent and stationary increments of the Lévy subordinator, the joint density is defined as
$f_{S^{\alpha, \theta}(t)}(x,t)$
denote the probability density function (PDF) of the TSS. By independent and stationary increments of the Lévy subordinator, the joint density is defined as
 \begin{equation} f_{S^{\alpha, \theta}(t_1),S^{\alpha, \theta}(t_2) }(x_1, t_1;\; x_2,t_2)\,{\mathrm{d}} x_1\,{\mathrm{d}} x_2 = f_{S^{\alpha, \theta}(t_2-t_1) }(x_2-x_1, t_2-t_1) f_{S^{\alpha, \theta}(t_1) }(x_1, t_1)\,{\mathrm{d}} x_1\,{\mathrm{d}} x_2.\end{equation}
2.3. Tempered space-fractional Poisson process
Let $\{\mathcal{N}(t,\lambda)\}_{t \geq 0}$
be the homogeneous Poisson process with parameter
$\{\mathcal{N}(t,\lambda)\}_{t \geq 0}$
be the homogeneous Poisson process with parameter $\lambda >0$
. The tempered space-fractional Poisson process (TSFPP) denoted by
$\lambda >0$
. The tempered space-fractional Poisson process (TSFPP) denoted by $\{\mathcal{N}^{\alpha, \theta}(t,\lambda)\}_{t \geq 0}$
is defined by time-changing the homogeneous Poisson process with an independent TSS as [Reference Gupta, Kumar and Leonenko14]
$\{\mathcal{N}^{\alpha, \theta}(t,\lambda)\}_{t \geq 0}$
is defined by time-changing the homogeneous Poisson process with an independent TSS as [Reference Gupta, Kumar and Leonenko14] $\mathcal{N}^{\alpha, \theta}(t,\lambda) \;:\!=\; \mathcal{N}(S^{\alpha, \theta}(t), \lambda)$
. Its PMF
$\mathcal{N}^{\alpha, \theta}(t,\lambda) \;:\!=\; \mathcal{N}(S^{\alpha, \theta}(t), \lambda)$
. Its PMF $p^{\alpha, \theta}(k,t)$
is given by [Reference Gupta, Kumar and Leonenko13, (26)]
$p^{\alpha, \theta}(k,t)$
is given by [Reference Gupta, Kumar and Leonenko13, (26)]
 \begin{equation*} p^{\alpha, \theta}(k,t) = \frac{(\!-\!1)^k}{k!}{\mathrm{e}}^{t\theta^{\alpha}}\sum_{i=0}^{\infty}\frac{\theta^i}{\lambda^i i!}\; {_1\Psi_1}\Bigg[{-}\lambda^\alpha t\;\Bigg|\; \begin{matrix} (1,\alpha) \\[5pt] (1-k-i, \alpha) \end{matrix} \Bigg].\end{equation*}
2.4. Backward shift operators
Let B be the backward shift operator defined by $B[\xi(k)] = \xi(k-1)$
. For the fractional difference operator
$B[\xi(k)] = \xi(k-1)$
. For the fractional difference operator $(I-B)^\alpha$
, we have (see [Reference Orsingher and Polito26] and [Reference Tsay33, p. 91])
$(I-B)^\alpha$
, we have (see [Reference Orsingher and Polito26] and [Reference Tsay33, p. 91])
 \begin{equation*} (I-B)^\alpha = \sum_{i=0}^{\infty} \binom{\alpha}{j}(\!-\!1)^i B^i, \qquad \alpha \in (0,1),\end{equation*}
where I is an identity operator. Furthermore, let $\{B_i\}$
,
$\{B_i\}$
, $ i\in \{1,2,\dots, m\}$
, be the operators defined as
$ i\in \{1,2,\dots, m\}$
, be the operators defined as
 \begin{equation*} B_i[\xi(k_1, k_2, \dots, k_m)] = \xi(k_1, k_2, \dots, k_{i}-1,\dots, k_m).\end{equation*}
For the $m=1$
case, the
$m=1$
case, the $B_i$
act the same as the operator B.
$B_i$
act the same as the operator B.
3. Bivariate tempered space-fractional Poisson process
Let $\{\mathcal{N}_i(t, \lambda_i)\}_{t\geq 0}$
,
$\{\mathcal{N}_i(t, \lambda_i)\}_{t\geq 0}$
, $i=1,2$
, be two independent homogeneous Poisson processes with parameters
$i=1,2$
, be two independent homogeneous Poisson processes with parameters $\lambda_i$
,
$\lambda_i$
, $i=1,2$
, respectively. Then, for
$i=1,2$
, respectively. Then, for $\alpha \in (0,1)$
, we define the BTSFPP
$\alpha \in (0,1)$
, we define the BTSFPP $\{\mathcal{Q}^{\alpha, \theta}(t)\}_{t\geq 0}$
as
$\{\mathcal{Q}^{\alpha, \theta}(t)\}_{t\geq 0}$
as
 \begin{equation} \mathcal{Q}^{\alpha, \theta}(t) \;:\!=\; \big(\mathcal{N}_1(S^{\alpha, \theta}(t), \lambda_1), \mathcal{N}_2(S^{\alpha, \theta}(t), \lambda_2)\big) \;:\!=\; \big(\mathcal{N}_1^{\alpha, \theta}(t,\lambda_1), \mathcal{N}_2^{\alpha, \theta}(t,\lambda_2)\big),\end{equation}
where $S^{\alpha, \theta}$
is the TSS, independent of
$S^{\alpha, \theta}$
is the TSS, independent of $\mathcal{N}_1$
and
$\mathcal{N}_1$
and $\mathcal{N}_2$
.
$\mathcal{N}_2$
.
Throughout the paper, we work with the bivariate process. Here, we denote any arbitrary bivariate vector of constants by $\textbf{a}=(a_1, a_2)$
, where
$\textbf{a}=(a_1, a_2)$
, where $a_1$
and
$a_1$
and $a_2$
are nonnegative integers. Let
$a_2$
are nonnegative integers. Let $\textbf{b}=(b_1, b_2)$
, and
$\textbf{b}=(b_1, b_2)$
, and $\textbf{0} = (0,0)$
be the null vector. We write
$\textbf{0} = (0,0)$
be the null vector. We write $\textbf{a} \geq \textbf{b}$
(or
$\textbf{a} \geq \textbf{b}$
(or $\textbf{a} \leq \textbf{b}$
) to mean that
$\textbf{a} \leq \textbf{b}$
) to mean that $a_i\geq b_i$
(or
$a_i\geq b_i$
(or $a_i\leq b_i$
) for
$a_i\leq b_i$
) for $i=1,2$
. Further, we write
$i=1,2$
. Further, we write $\textbf{k}=(k_1, k_2)$
and
$\textbf{k}=(k_1, k_2)$
and $\textbf{r}=(r_1, r_2)$
.
$\textbf{r}=(r_1, r_2)$
.
Next, we derive the PMF, PGF, and associated differential equations for the BTSFPP.
Proposition 3.1. For $\alpha \in (0,1)$
and
$\alpha \in (0,1)$
and $\textbf{k} \geq \textbf{0}$
, the PMF
$\textbf{k} \geq \textbf{0}$
, the PMF $q^{\alpha,\theta}(\textbf{k},t) = \mathbb{P}\{\mathcal{Q}^{\alpha,\theta}(t) = \textbf{k}\}$
is given by
$q^{\alpha,\theta}(\textbf{k},t) = \mathbb{P}\{\mathcal{Q}^{\alpha,\theta}(t) = \textbf{k}\}$
is given by
 \begin{align} q^{\alpha,\theta}(\textbf{k},t) & = \bigg({-}\frac{1}{\lambda_1 +\lambda_2}\bigg)^{k_1+k_2} \frac{\lambda_1^{k_1}\lambda_2^{k_2}}{k_1!k_2!}{\mathrm{e}}^{t\theta^\alpha} \nonumber \\[5pt] & \quad \times \sum_{i=0}^{\infty}\frac{\theta^i}{i!(\lambda_1+\lambda_2)^i} {_1\Psi_1}\Bigg[{-}(\lambda_1+\lambda_2)^\alpha t\; \Bigg| \; \begin{matrix}(1,\alpha) \\[5pt] (1-(k_1+k_2)-i, \alpha) \end{matrix} \Bigg]. \end{align}
Proof. First, we have
 \begin{align} q^{\alpha, \theta}(\textbf{k},t) & = \mathbb{P}\big(\{\mathcal{Q}^{\alpha,\theta}(t) = \textbf{k}\} \cap \big\{\mathcal{N}_1^{\alpha,\theta}(t,\lambda_1) + \mathcal{N}_2^{\alpha,\theta}(t,\lambda_2) = k_1+k_2\big\}\big) \nonumber \\[5pt] & = \mathbb{P}\big(\mathcal{Q}^{\alpha,\theta}(t) = \textbf{k} \mid \big\{\mathcal{N}_1^{\alpha,\theta}(t,\lambda_1) + \mathcal{N}_2^{\alpha,\theta}(t,\lambda_2) = k_1+k_2\big\}\big) \nonumber \\[5pt] & \quad \times \mathbb{P}\big(\mathcal{N}_1^{\alpha,\theta}(t,\lambda_1) + \mathcal{N}_2^{\alpha,\theta}(t,\lambda_2) = k_1+k_2\big). \end{align}
Using a conditioning argument along similar lines to [Reference Beghin and Macci3, Proposition 4], we get
 \begin{align*} \mathbb{P}\big(\mathcal{Q}^{\alpha,\theta}(t) = \textbf{k} \mid \big\{\mathcal{N}_1^{\alpha,\theta}(t,\lambda_1) + \mathcal{N}_2^{\alpha,\theta}(t,\lambda_2) = k_1+k_2\big\}\big) = \frac{(k_1+k_2)!}{k_1!k_2!}\frac{\lambda_1^{k_1} \lambda_2^{k_2}}{(\lambda_1+\lambda_2)^{k_1+k_2}}. \end{align*}
Now, we calculate
 \begin{align*} \mathbb{P} & \big(\mathcal{N}_1^{\alpha,\theta}(t,\lambda_1) + \mathcal{N}_2^{\alpha,\theta}(t,\lambda_2) = k_1+k_2\big) \\[5pt] & = \mathbb{E}\Big[\mathbb{P}(N_1(r,\lambda_1) + N_2(r,\lambda_2)) = k_1 + k_2\big|_{r=S^{\alpha,\theta}(t)}\Big] \\[5pt] & = \mathbb{E}\bigg[\frac{((\lambda_1+\lambda_2)r)^{k_1+k_2}}{(k_1+k_2)!}{\mathrm{e}}^{-r(\lambda_1+\lambda_2)} \bigg|_{r=S^{\alpha,\theta}(t)}\bigg] \\[5pt] & = \frac{(\!-\!1)^{k_1+k_2}}{(k_1+k_2)!}{\mathrm{e}}^{t\theta^{\alpha}} \sum_{i=0}^{\infty}\frac{\theta^i}{(\lambda_1+\lambda_2)^ii!}\; {_1\Psi_1}\Bigg[{-}(\lambda_1+\lambda_2)^\alpha t\; \Bigg| \; \begin{matrix}(1,\alpha) \\[5pt] (1-(k_1+k_2)-i, \alpha) \end{matrix} \Bigg]. \end{align*}
With the help of (3.3), we get the PMF. The convergence of $_1\Psi_1$
follows from the condition in (2.1) as
$_1\Psi_1$
follows from the condition in (2.1) as $\alpha -\alpha =0 >-1$
.
$\alpha -\alpha =0 >-1$
.
Remark 3.1. When $\theta =0$
, (3.2) reduces to the PMF of the bivariate space-fractional Poisson process studied in [Reference Di Crescenzo and Meoli10].
$\theta =0$
, (3.2) reduces to the PMF of the bivariate space-fractional Poisson process studied in [Reference Di Crescenzo and Meoli10].
Theorem 3.1. For $\textbf{u} = (u_1,u_2) \in [0,1]^2$
, the PGF
$\textbf{u} = (u_1,u_2) \in [0,1]^2$
, the PGF $G^{\alpha,\theta}(\textbf{u};\;t)$
for the BTSFPP is given by
$G^{\alpha,\theta}(\textbf{u};\;t)$
for the BTSFPP is given by
 \begin{equation*} G^{\alpha,\theta}(\textbf{u};\;t) = \exp\{-t([\lambda_1(1-u_1)+\lambda_2(1-u_2)+\theta]^{\alpha}-\theta^\alpha)\}, \end{equation*}
and it satisfies the differential equation
 \begin{equation} \frac{{\mathrm{d}}}{{\mathrm{d}} t} G^{\alpha,\theta}(\textbf{u};\;t) = -([\lambda_1(1-u_1)+\lambda_2(1-u_2)+\theta]^{\alpha}-\theta^\alpha)G^{\alpha,\theta}(\textbf{u};\;t), \qquad G^{\alpha,\theta}(\textbf{u};\;0) = 1. \end{equation}
Proof. For $\lambda >0$
, the PGF for the TSFPP is given by [Reference Gupta, Kumar and Leonenko13]
$\lambda >0$
, the PGF for the TSFPP is given by [Reference Gupta, Kumar and Leonenko13]
 \begin{align*} \mathbb{E}\big[u^{\mathcal{N}^{\alpha,\theta}(t,\lambda)}\big] = \mathbb{E}\big[\mathbb{E}\big[u^{\mathcal{N}(S^{\alpha,\theta}(t),\lambda)}\mid S^{\alpha,\theta}(t)\big]\big] = \mathbb{E}\big[{\mathrm{e}}^{-\lambda(1-u)S^{\alpha,\theta}(t)}\big] = {\mathrm{e}}^{-t((\lambda(1-u)+\theta)^\alpha - \theta^\alpha)}. \end{align*}
We define the PGF as $G^{\alpha,\theta}(\textbf{u};\;t) = \mathbb{E}\big[\textbf{u}^{\mathcal{Q}^{\alpha,\theta}(t)}\big] = \sum_{\textbf{k}\geq\textbf{0}}u_1^{k_1}u_2^{k_2}q^{\alpha,\theta}(\textbf{k},t)$
. Hence, we get
$G^{\alpha,\theta}(\textbf{u};\;t) = \mathbb{E}\big[\textbf{u}^{\mathcal{Q}^{\alpha,\theta}(t)}\big] = \sum_{\textbf{k}\geq\textbf{0}}u_1^{k_1}u_2^{k_2}q^{\alpha,\theta}(\textbf{k},t)$
. Hence, we get
 \begin{align*} G^{\alpha,\theta}(u;\;t) & = \mathbb{E}\big[\mathbb{E}\big[u^{\mathcal{Q}^{\alpha,\theta}(t,\lambda)}\mid S^{\alpha,\theta}(t)\big]\big] \nonumber \\[5pt] & = \mathbb{E}\big[e^{(\lambda_1(u_1-1)+\lambda_2(u_2-1))S^{\alpha,\theta}(t)}\big] \nonumber \\[5pt] & = {\mathrm{e}}^{-t(\left[\lambda_1(1-u_1)+ \lambda_2(1-u_2) + \theta\right]^{\alpha} - \theta^\alpha)}. \end{align*}
By calculus we obtain (3.4), and the condition trivially holds for $t=0$
.
$t=0$
.
Theorem 3.2. The PMF in (3.2) satisfies the differential equation
 \begin{equation*} \frac{{\mathrm{d}}}{{\mathrm{d}} t}q^{\alpha,\theta}(\textbf{k},t) = -(\lambda_1+\lambda_2)^\alpha \bigg(\bigg(I-\frac{\lambda_1B_1+\lambda_2B_2-\theta}{\lambda_1+\lambda_2}\bigg)^\alpha - \bigg(\frac{\theta}{\lambda_1+\lambda_2}\bigg)^\alpha\bigg)q^{\alpha,\theta}(\textbf{k},t), \end{equation*}
with $q^{\alpha,\theta}(\textbf{0},t) = 1$
.
$q^{\alpha,\theta}(\textbf{0},t) = 1$
.
Proof. From (3.4), we have
 \begin{align} \frac{{\mathrm{d}}}{{\mathrm{d}} t}G^{\alpha,\theta}(\textbf{u};\;t) = -(\lambda_1+\lambda_2)^\alpha \bigg(\bigg(1-\frac{\lambda_1u_1+\lambda_2u_2-\theta}{\lambda_1+\lambda_2}\bigg)^\alpha - \bigg(\frac{\theta}{\lambda_1+\lambda_2}\bigg)^\alpha\bigg)G^{\alpha,\theta}(\textbf{u};\;t). \end{align}
Now, we concentrate our attention on simplifying the following:
 \begin{align*} \bigg(1-\frac{\lambda_1u_1+\lambda_2u_2-\theta}{\lambda_1+\lambda_2}\bigg)^\alpha & = \bigg(1+\frac{\theta}{\lambda_1+\lambda_2} - \frac{\lambda_1u_1+\lambda_2u_2}{\lambda_1+\lambda_2}\bigg)^\alpha \\[5pt] & = \sum_{j \geq 0}\binom{\alpha}{j}\bigg(1+\frac{\theta}{\lambda_1+\lambda_2}\bigg)^{\alpha-j}(\!-\!1)^j \bigg(\frac{\lambda_1u_1+\lambda_2u_2}{\lambda_1+\lambda_2}\bigg)^j \\[5pt] & = \sum_{j \geq 0}\binom{\alpha}{j}\bigg(1+\frac{\theta}{\lambda_1+\lambda_2}\bigg)^{\alpha-j} \frac{(\!-\!1)^j}{(\lambda_1+\lambda_2)^j} \! \sum_{\substack{\textbf{r}\geq\textbf{0},\\[5pt] r_1+r_2=j}}\!\frac{j!}{r_1! r_2!}\lambda_1^{r_1}\lambda_2^{r_2}u_1^{r_1}u_2^{r_2}. \end{align*}
Therefore, from (3.5),
 \begin{align*} & \frac{{\mathrm{d}}}{{\mathrm{d}} t}G^{\alpha,\theta}(\textbf{u};\;t) \\[3pt] & = -(\lambda_1+\lambda_2)^\alpha\Bigg( \bigg(1-\frac{\lambda_1u_1+\lambda_2u_2-\theta}{\lambda_1+\lambda_2}\bigg)^\alpha \sum_{\textbf{k}\geq\textbf{0}}u_1^{k_1}u_2^{k_2}q^{\alpha,\theta}(\textbf{k},t) - \bigg(\frac{\theta}{\lambda_1+\lambda_2}\bigg)^\alpha \sum_{\textbf{k}\geq\textbf{0}}u_1^{k_1}u_2^{k_2}q^{\alpha,\theta}(\textbf{k},t)\Bigg) \\[3pt] & = -(\lambda_1+\lambda_2)^\alpha\sum_{j\geq0}\binom{\alpha}{j} \bigg(1+\frac{\theta}{\lambda_1+\lambda_2}\bigg)^{\alpha-j}\frac{(\!-\!1)^j}{(\lambda_1+\lambda_2)^j} \sum_{\substack{\textbf{r}\geq\textbf{0},\\[3pt] r_1+r_2=j}}\frac{j!}{r_1!r_2!}\lambda_1^{r_1}\lambda_2^{r_2} \sum_{\textbf{k}\geq\textbf{0}}u_1^{k_1+r_1}u_2^{k_2+r_2}q^{\alpha,\theta}(\textbf{k},t) \\[3pt] & \quad + (\lambda_1+\lambda_2)^\alpha \left( \frac{\theta}{\lambda_1+\lambda_2}\right)^\alpha \sum_{\textbf{k} \geq \textbf{0}}^{} u_1^{k_1} u_2^{k_2} q^{\alpha, \theta}(\textbf{k},t) \\[3pt] & = -(\lambda_1+\lambda_2)^\alpha\sum_{j\geq0}\binom{\alpha}{j} \bigg(1+\frac{\theta}{\lambda_1+\lambda_2}\bigg)^{\alpha-j}\frac{(\!-\!1)^j}{(\lambda_1+\lambda_2)^j} \sum_{\substack{\textbf{r}\geq\textbf{0},\\[3pt] r_1+r_2=j}}\frac{j!}{r_1!r_2!}\lambda_1^{r_1}\lambda_2^{r_2} \sum_{\textbf{k}\geq\textbf{r}}u_1^{k_1}u_2^{k_2}q^{\alpha,\theta}(\textbf{k}-\textbf{r},t) \\[3pt] & \quad + (\lambda_1+\lambda_2)^\alpha\bigg(\frac{\theta}{\lambda_1+\lambda_2}\bigg)^\alpha \sum_{\textbf{k}\geq\textbf{0}}u_1^{k_1}u_2^{k_2}q^{\alpha,\theta}(\textbf{k},t) \\[3pt] & = -(\lambda_1+\lambda_2)^\alpha\sum_{\textbf{k}\geq\textbf{r}}u_1^{k_1}u_2^{k_2} \sum_{j\geq0}\binom{\alpha}{j}\bigg(1+\frac{\theta}{\lambda_1+\lambda_2}\bigg)^{\alpha-j} \frac{(\!-\!1)^j}{(\lambda_1+\lambda_2)^j} \sum_{\substack{\textbf{r}\geq\textbf{0},\\[3pt] r_1+r_2=j}}\frac{j!}{r_1!r_2!}\lambda_1^{r_1}\lambda_2^{r_2} q^{\alpha,\theta}(\textbf{k}-\textbf{r},t) \\[3pt] & \quad + (\lambda_1+\lambda_2)^\alpha\bigg(\frac{\theta}{\lambda_1+\lambda_2}\bigg)^\alpha \sum_{\textbf{k}\geq\textbf{0}}u_1^{k_1}u_2^{k_2}q^{\alpha,\theta}(\textbf{k},t). \end{align*}
Since
 \begin{equation*} \sum_{\substack{\textbf{r}\geq\textbf{0},\\[5pt] r_1+r_2=j}}\frac{j!}{r_1!r_2!}\lambda_1^{r_1}\lambda_2^{r_2} q^{\alpha,\theta}(\textbf{k}-\textbf{r},t) = (\lambda_1B_1+\lambda_2B_2)^jq^{\alpha,\theta}(\textbf{k},t), \end{equation*}
we obtain the desired differential equation.
Next, we derive the Lévy measure for the BTSFPP.
Theorem 3.3. The discrete Lévy measure $\mathcal{V}_{\alpha, \theta}$
for the BTSFPP is given by
$\mathcal{V}_{\alpha, \theta}$
for the BTSFPP is given by
 \begin{equation*} \mathcal{V}_{\alpha,\theta}(\cdot) = \sum_{k_1,k_2>0}\frac{\lambda_1^{k_1}\lambda_2^{k_2}}{k_1!k_2!} \frac{\alpha\Gamma(k_1+k_2-\alpha)}{\Gamma(1-\alpha)}\delta_{\{\textbf{k}\}}(\cdot) (\theta +\lambda_1+\lambda_2)^{\alpha -k_1-k_2}, \end{equation*}
where $\delta_{\{\textbf{k}\}}(\cdot)$
is the Dirac measure concentrated at
$\delta_{\{\textbf{k}\}}(\cdot)$
is the Dirac measure concentrated at $\textbf{k}$
.
$\textbf{k}$
.
Proof. The PMF for the bivariate Poisson process $\mathcal{N}(t) = (\mathcal{N}_1(t, \lambda_1), \mathcal{N}_2(t, \lambda_2))$
is [Reference Beghin and Macci3]
$\mathcal{N}(t) = (\mathcal{N}_1(t, \lambda_1), \mathcal{N}_2(t, \lambda_2))$
is [Reference Beghin and Macci3]
 \begin{equation*} \mathbb{P}\{\mathcal{N}_1(t,\lambda_1)=k_1,\mathcal{N}_2(t,\lambda_2)=k_2\} = \frac{\lambda_1^{k_1}\lambda_2^{k_2}}{k_1!k_2!}t^{k_1+k_2}{\mathrm{e}}^{-(\lambda_{1}+\lambda_{2})t}. \end{equation*}
Using (2.3) and applying the formula from [Reference Sato29, p. 197] to calculate the Lévy measure, we get
 \begin{align*} \mathcal{V}_{\alpha, \theta} (\cdot) & = \int_{0}^{\infty}\sum_{k_1,k_2>0}\mathbb{P}\{\mathcal{N}_1(s,\lambda_1)=k_1,\mathcal{N}_2(s,\lambda_2)=k_2\} \delta_{\{\textbf{k}\}}(\cdot)\nu(s)\,{\mathrm{d}} s \\[5pt] & = \sum_{k_1,k_2>0}\frac{\lambda_1^{k_1}\lambda_2^{k_2}}{k_1!k_2!}\delta_{\{\textbf{k}\}}(\cdot) \frac{\alpha}{\Gamma(1-\alpha)}\int_{0}^{\infty}{\mathrm{e}}^{s(\theta+\lambda_1+\lambda_2)}s^{k_1+k_2-\alpha-1}\,{\mathrm{d}} s. \end{align*}
Using the integral formula [Reference Gradshteyn and Ryzhik12, (3.351.3)], we can simplify this as
 \begin{equation*} \mathcal{V}_{\alpha,\theta}(\cdot) = \sum_{k_1,k_2>0}\frac{\lambda_1^{k_1}\lambda_2^{k_2}}{k_1!k_2!} \frac{\alpha(k_1+k_2-\alpha-1)!}{\Gamma(1-\alpha)} \delta_{\{\textbf{k}\}}(\cdot)(\theta+\lambda_1+\lambda_2)^{\alpha-k_1-k_2}. \end{equation*}
Hence, the theorem is proved.
With the aim of calculating hazard rates, we establish the following lemma.
Lemma 3.1. For $h \in \mathbb{N}_{0}$
,
$h \in \mathbb{N}_{0}$
,
 \begin{align*} \frac{{\mathrm{d}}^h}{{\mathrm{d}} u^h}\big[{\mathrm{e}}^{-t((u+\theta)^\alpha-\theta^\alpha)}\big] & = \sum_{k=0}^{h}\frac{1}{k!}{\mathrm{e}}^{-t((u+\theta)^\alpha-\theta^\alpha)} \sum_{j=0}^{k}\binom{k}{j}t^{k}(\!-\!1)^j(((u+\theta)^\alpha-\theta^\alpha))^{k-j} \\[5pt] & \quad \times \sum_{i=0}^{j}\binom{j}{i}(\alpha i)_h(u+\theta)^{\alpha i - h}(\!-\!\theta^\alpha)^{j-i}, \end{align*}
where $(x)_h = x(x-1)\cdots(x-h+1)$
denotes the falling factorial.
$(x)_h = x(x-1)\cdots(x-h+1)$
denotes the falling factorial.
Proof. Let $V(u) = -t((u+\theta)^\alpha-\theta^\alpha)$
and
$V(u) = -t((u+\theta)^\alpha-\theta^\alpha)$
and $W(V(u)) = {\mathrm{e}}^{-t((u+\theta)^\alpha-\theta^\alpha)}$
. Then, applying Hoppe’s formula [Reference Johnson16] to the function W(V(u)), we get
$W(V(u)) = {\mathrm{e}}^{-t((u+\theta)^\alpha-\theta^\alpha)}$
. Then, applying Hoppe’s formula [Reference Johnson16] to the function W(V(u)), we get
 \begin{equation} \frac{{\mathrm{d}}^h}{{\mathrm{d}} u^h}W(V(u)) = \sum_{k=0}^{h}\frac{1}{k!}{\mathrm{e}}^{-t((u+\theta)^\alpha-\theta^\alpha)}T_{h,k}(V(u)), \end{equation}
where $T_{h,k}(V(u))$
is computed as
$T_{h,k}(V(u))$
is computed as
 \begin{align*} T_{h,k}(V(u)) & = \sum_{j=0}^{k}\binom{k}{j}(\!-\!V(u))^{k-j}\frac{{\mathrm{d}}^h}{{\mathrm{d}} u^h}(V(u))^j \\[5pt] & = \sum_{j=0}^{k}\binom{k}{j}(t((u+\theta)^\alpha-\theta^\alpha))^{k-j} \frac{{\mathrm{d}}^h}{{\mathrm{d}} u^h}(-t((u+\theta)^\alpha-\theta^\alpha))^j \\[5pt] & = \sum_{j=0}^{k}\binom{k}{j}(t((u+\theta)^\alpha-\theta^\alpha))^{k-j}(-t)^j \sum_{i=0}^{j}\binom{j}{i}(\!-\!\theta^\alpha)^{j-i}\frac{{\mathrm{d}}^h}{{\mathrm{d}} u^h}(u+\theta)^{\alpha i} \\[5pt] & = \sum_{j=0}^{k}\binom{k}{j}t^{k}(\!-\!1)^j(((u+\theta)^\alpha-\theta^\alpha))^{k-j} \sum_{i=0}^{j}\binom{j}{i}(\alpha i)_h(u+\theta)^{\alpha i - h}(\!-\!\theta^\alpha)^{j-i}. \end{align*}
Hence, through (3.6), we have proved the lemma.
4. Bivariate shock models
We design a shock model that is subjected to two shocks of types 1 and 2. Let T be a nonnegative absolutely continuous random variable that represents the failure time of a system subject to two possible causes of failure. Set $\zeta=n$
, which represents the failure of the system occurring due to a shock of type n for
$\zeta=n$
, which represents the failure of the system occurring due to a shock of type n for $ n=1,2$
. We define the total number of shocks
$ n=1,2$
. We define the total number of shocks $\{\mathcal{Z}(t)\}_{t \geq 0}$
during the time interval [0, t] as
$\{\mathcal{Z}(t)\}_{t \geq 0}$
during the time interval [0, t] as
 \begin{equation*} \mathcal{Z}(t) = \mathcal{N}_1^{\alpha, \theta}(t, \lambda_1) + \mathcal{N}_2^{\alpha, \theta}(t, \lambda_2),\end{equation*}
where $\mathcal{N}_1^{\alpha, \theta}(t, \lambda_1)$
and
$\mathcal{N}_1^{\alpha, \theta}(t, \lambda_1)$
and $\mathcal{N}_2^{\alpha, \theta}(t, \lambda_2)$
are processes counting the number of shocks of type n for
$\mathcal{N}_2^{\alpha, \theta}(t, \lambda_2)$
are processes counting the number of shocks of type n for $n=1,2$
, respectively, during the time interval [0, t].
$n=1,2$
, respectively, during the time interval [0, t].
We introduce a random threshold L that takes values in the set of natural numbers. Hence, at the first time when $\mathcal{Q}(t) =L$
, the failure occurs. The probability distribution and the reliability function of L are respectively defined by
$\mathcal{Q}(t) =L$
, the failure occurs. The probability distribution and the reliability function of L are respectively defined by
 \begin{equation} \begin{aligned} q_k & = \mathbb{P}(L=k), \qquad k \in \mathbb{N}, \\[5pt] \overline{q}_k & = \mathbb{P}(L > k), \qquad k \in \mathbb{N}_0. \end{aligned}\end{equation}
Let $g_{T}(t)$
be the PDF of T, defined as
$g_{T}(t)$
be the PDF of T, defined as $T = \inf \{t \geq 0\colon \mathcal{Z}(t) = L\}$
. Then, we have
$T = \inf \{t \geq 0\colon \mathcal{Z}(t) = L\}$
. Then, we have $g_T(t) = g_1(t)+g_2(t)$
,
$g_T(t) = g_1(t)+g_2(t)$
, $t \geq 0$
, where the sub-densities
$t \geq 0$
, where the sub-densities $g_n(t)$
are defined by
$g_n(t)$
are defined by
 \begin{equation*} g_n(t) = \frac{{\mathrm{d}}}{{\mathrm{d}} t}\mathbb{P}\{T \leq t, \zeta =n\}, \qquad n=1,2.\end{equation*}
Also, the probability that the failure occurs due to a shock of type n is given by
 \begin{equation} \mathbb{P}(\zeta =n) = \int_{0}^{\infty} g_n(t)\,{\mathrm{d}} t, \qquad n=1,2.\end{equation}
Furthermore, in terms of the joint PMF, the hazard rates are given by
 \begin{equation} \begin{aligned} h_1(k_1,k_2;\;t) & = \lim_{\tau \rightarrow 0^+} \frac{\mathbb{P}\{\mathcal{Q}^{\alpha,\theta}(t+\tau) = (k_1+1,k_2) \mid \mathcal{Q}^{\alpha,\theta}(t) = (k_1,k_2)\}}{\tau}, \\[5pt] h_2(k_1,k_2;\;t) & = \lim_{\tau \rightarrow 0^+} \frac{\mathbb{P}\{\mathcal{Q}^{\alpha,\theta}(t+\tau) = (k_1,k_2+1) \mid \mathcal{Q}^{\alpha,\theta}(t) = (k_1,k_2)\}}{\tau}, \end{aligned}\end{equation}
with $(k_1, k_2) \in \mathbb{N}_0^2$
. Hence, conditioning on L and with the help of (4.1), the failure densities take the form
$(k_1, k_2) \in \mathbb{N}_0^2$
. Hence, conditioning on L and with the help of (4.1), the failure densities take the form
 \begin{equation} g_n(t) = \sum_{k=1}^{\infty}q_k\sum_{k_1+k_2=k-1}\mathbb{P}\{\mathcal{Q}^{\alpha,\theta}(t) = (k_1,k_2)\} h_n(k_1,k_2;\;t), \qquad n=1,2.\end{equation}
The reliability function of T, denoted by $\overline{R}_T(t) = \mathbb{P}\{T >t\}$
, is given by
$\overline{R}_T(t) = \mathbb{P}\{T >t\}$
, is given by
 \begin{equation} \overline{R}_T(t) = \sum_{k=0}^{\infty}\overline{q}_k \sum_{k_1+k_2=k}\mathbb{P}\{\mathcal{Q}^{\alpha,\theta}(t) = (k_1,k_2)\}, \qquad \overline{q}_0 =1.\end{equation}
Proposition 4.1. Under the assumptions of the model in (3.1) and for $n=1,2$
, the hazard rates
$n=1,2$
, the hazard rates $h_n(k_1,k_2;\;t)$
,
$h_n(k_1,k_2;\;t)$
, $t \geq 0$
, are given by
$t \geq 0$
, are given by
 \begin{align} h_n(k_1,k_2;\;t) & = \alpha\lambda_n(\Lambda+\theta)^{\alpha-1}{\mathrm{e}}^{-t(\Lambda+\theta)^\alpha} \Bigg(\sum_{l=0}^{\infty}\frac{\theta^l}{\Lambda^ll!}\;_1\Psi_1\Bigg[-\Lambda^\alpha t\;\Bigg|\; \begin{matrix}(1,\alpha) \\[5pt] (1-h-l, \alpha) \end{matrix} \Bigg]\Bigg)^{-1} \nonumber \\[5pt] & \quad \times \sum_{k=0}^{h}\frac{1}{k!}\sum_{j=0}^{k}\binom{k}{j}(\!-\!1)^jt^k (((\Lambda+\theta)^\alpha-\theta^\alpha))^{k-j} \sum_{i=0}^{j}\binom{j}{i}(\alpha i)_h(\Lambda+\theta)^{\alpha i}(\!-\!\theta^\alpha)^{j-i}, \end{align}
where $\Lambda=\lambda_1 +\lambda_2$
and
$\Lambda=\lambda_1 +\lambda_2$
and $h = k_1+k_2$
.
$h = k_1+k_2$
.
Proof. We fix $n=1$
. With the help of (2.4) and considering the BTSFPP as bivariate HPP with tempered
$n=1$
. With the help of (2.4) and considering the BTSFPP as bivariate HPP with tempered $\alpha$
-stable stopping time, we have
$\alpha$
-stable stopping time, we have
 \begin{align*} & \mathbb{P}\{\mathcal{Q}^{\alpha,\theta}(\tau) = (k_1+1,k_2),\mathcal{Q}^{\alpha,\theta}(t) = (k_1,k_2)\} \\[5pt] & = \int_{0}^{\infty}\int_{0}^{y}\mathbb{P}\{\mathcal{Q}^{\alpha,\theta}(y) = (k_1+1,k_2), \! \mathcal{Q}^{\alpha,\theta}(x) = (k_1,k_2)\}f_{S^{\alpha,\theta}(\tau-t)}(y-x,\tau-t)f_{S^{\alpha,\theta}(t)}(x,t) {\mathrm{d}} x\,{\mathrm{d}} y \\[5pt] & = \int_{0}^{\infty}\int_{0}^{y}\mathbb{P}\{\mathcal{N}_1(y-x,\lambda_1)=1,\mathcal{N}_2(y-x,\lambda_2)=0\} \\[5pt] & \qquad\qquad \times \mathbb{P}\{\mathcal{N}_1(x,\lambda_1)=k_1,\mathcal{N}_2(x,\lambda_2)=k_2\} f_{S^{\alpha,\theta}(\tau-t)}(y-x,\tau-t)f_{S^{\alpha,\theta}(t)}(x,t)\,{\mathrm{d}} x\,{\mathrm{d}} y \\[5pt] & = \int_{0}^{\infty}\int_{0}^{y}\frac{\lambda_1^{k_1+1 }\lambda_2^{k_2}}{k_1!k_2!}{\mathrm{e}}^{-(\lambda_1+\lambda_2)y} x^{k_1+k_2}(y-x)f_{S^{\alpha,\theta}(\tau-t)}(y-x,\tau-t)f_{S^{\alpha,\theta}(t)}(x,t)\,{\mathrm{d}} x\,{\mathrm{d}} y. \end{align*}
By using Tonelli’s theorem, we get
 \begin{align*} & \mathbb{P}\{\mathcal{Q}^{\alpha,\theta}(\tau) = (k_1+1,k_2),\mathcal{Q}^{\alpha,\theta}(t) = (k_1,k_2)\} \\[5pt] & = \frac{\lambda_1^{k_1+1}\lambda_2^{k_2}}{k_1!k_2!}\int_{0}^{\infty}\int_{x}^{\infty}x^{h} f_{S^{\alpha,\theta}(t)}(x,t)f_{S^{\alpha,\theta}(\tau-t)}(y-x,\tau-t){\mathrm{e}}^{-(\lambda_1+\lambda_2)y}(y-x)\,{\mathrm{d}} y\,{\mathrm{d}} x \\[5pt] & = \frac{\lambda_1^{k_1+1}\lambda_2^{k_2}}{k_1!k_2!}\int_{0}^{\infty}{\mathrm{e}}^{-(\lambda_1+\lambda_2)x}x^{h} f_{S^{\alpha,\theta}(t)}(x,t)\,{\mathrm{d}} x \int_{0}^{\infty}y{\mathrm{e}}^{-(\lambda_1+\lambda_2)y}f_{S^{\alpha,\theta}(\tau-t)}(y,\tau-t)\,{\mathrm{d}} y \\[5pt] & = \frac{\lambda_1^{k_1+1}\lambda_2^{k_2}}{k_1!k_2!}(\!-\!1)^{h} \frac{{\mathrm{d}}^h}{{\mathrm{d}} x^h}\mathbb{E}\big[{\mathrm{e}}^{-xS^{\alpha,\theta}(t)}\big]\Big|_{x=\Lambda} \frac{{\mathrm{d}}}{{\mathrm{d}} y} \mathbb{E}\big[{\mathrm{e}}^{-yS^{\alpha,\theta}(\tau-t)}\big]\Big|_{y=\Lambda}. \end{align*}
Hence, using the definition of conditional density in (4.3), the required form is obtained with the help of (3.2) and Lemma 3.1. For the $n=2$
case the proof follows along the same lines.
$n=2$
case the proof follows along the same lines.
In the next propositions, we derive the failure densities and the reliability function of the system and obtain the distribution (4.2) of failure due to the nth type of shock.
Proposition 4.2. Under the assumptions of the model in (3.1), for $n=1,2$
and
$n=1,2$
and $t \geq 0$
, the failure density is of the form
$t \geq 0$
, the failure density is of the form
 \begin{align*} & g_n(t) = \alpha\lambda_n(\Lambda+\theta)^{\alpha-1}{\mathrm{e}}^{-t((\Lambda+\theta)^\alpha-\theta^\alpha)} \times \\[5pt] & \sum_{k=1}^{\infty}q_k\frac{(\!-\!1)^{k-1}}{(k-1)!}\sum_{l=0}^{k-1}\frac{t^{l}}{l!} \sum_{j=0}^{l}\binom{l}{j}(\!-\!1)^j(((\Lambda+\theta)^\alpha-\theta^\alpha))^{l-j} \sum_{i=0}^{j}\binom{j}{i}(\alpha i)_{k-1}(\Lambda+\theta)^{\alpha i}(\!-\!\theta^\alpha)^{j-i}. \end{align*}
Proof. On substituting the PMF (3.2) and (4.6) into (4.4), we get
 \begin{align*} g_n(t) & = \sum_{k=1}^{\infty}q_k\sum_{k_1+k_2=k-1}q^{\alpha,\theta}(k,t)(\Lambda+\theta)^{\alpha-1}{\mathrm{e}}^{-t(\Lambda+\theta)^\alpha} \Bigg(\sum_{l=0}^{\infty}\frac{\theta^l}{\Lambda^ll!} {_1\Psi_1}\Bigg[-\Lambda^\alpha t\; \Bigg| \; \begin{matrix}(1,\alpha) \\[5pt] (1-h-l, \alpha)\end{matrix} \Bigg] \Bigg)^{\!-1} \nonumber \\[5pt] & \quad \times \alpha\lambda_n\sum_{l=0}^{k_1+k_2}\frac{1}{l!} \sum_{j=0}^{l}\binom{l}{j}(\!-\!1)^jt^l(((\Lambda+\theta)^\alpha-\theta^\alpha))^{l-j} \sum_{i=0}^{j}\binom{j}{i}(\alpha i)_{k_1+k_2}(\Lambda+\theta)^{\alpha i}(\!-\!\theta^\alpha)^{j-i} \\[5pt] & = \alpha\lambda_n(\Lambda+\theta)^{\alpha-1}{\mathrm{e}}^{-t((\Lambda+\theta)^\alpha-\theta^\alpha)} \sum_{k=1}^{\infty}q_k\frac{(\!-\!1)^{k-1}}{(k-1)!\Lambda^{k-1}} \sum_{k_1=0}^{k-1}\frac{(k-1)!\lambda_{1}^{k_1}\lambda_{2}^{k-1-k_1}}{k_1!(k-1-k_1)!} \\[5pt] & \quad \times \sum_{l=0}^{k-1}\frac{t^l}{l!} \sum_{j=0}^{l}\binom{l}{j}(\!-\!1)^j(((\Lambda+\theta)^\alpha-\theta^\alpha))^{l-j} \sum_{i=0}^{j}\binom{j}{i}(\alpha i)_{k-1}(\Lambda+\theta)^{\alpha i}(\!-\!\theta^\alpha)^{j-i}. \end{align*}
Using the binomial theorem, the failure density is obtained.
Proposition 4.3. Under the assumptions of the model in (3.1), the reliability function of T is given by
 \begin{equation*} \overline{R}_T(t) = \sum_{k=0}^{\infty}\overline{q}_k\frac{(\!-\!1)^k}{k!}{\mathrm{e}}^{t\theta^{\alpha}} \sum_{i=0}^{\infty}\frac{\theta^i}{\Lambda^ii!} {_1\Psi_1}\Bigg[{-}\Lambda^\alpha t\; \Bigg| \; \begin{matrix} (1,\alpha) \\[5pt] (1-k-i, \alpha) \end{matrix} \Bigg], \qquad t \geq 0. \end{equation*}
Proof. The reliability function can be obtained by substituting (3.2) into (4.5) and simplifying it using the binomial theorem as carried out in the previous proof.
Proposition 4.4. Under the assumptions of the model in (3.1), for $n=1,2$
we also have
$n=1,2$
we also have
 \begin{align*} & \mathbb{P}(\zeta=n) = \alpha\lambda_n\frac{(\Lambda+\theta)^{\alpha-1}}{(\Lambda+\theta)^\alpha-\theta^\alpha} \times \\[5pt] & \sum_{k=1}^{\infty}q_k\frac{(\!-\!1)^{k-1}}{(k-1)!}\sum_{l=0}^{k-1}\sum_{j=0}^{l}\binom{l}{j}(\!-\!1)^j ((\Lambda+\theta)^\alpha-\theta^\alpha)^{-j} \sum_{i=0}^{j}\binom{j}{i}(\alpha i)_{k-1}(\Lambda+\theta)^{\alpha i}(\!-\!\theta^\alpha)^{j-i}. \end{align*}
Proof. With the help of Proposition 4.2, the probability (4.2) gives
 \begin{align*} & \mathbb{P}(\zeta =n) = \alpha\lambda_n(\Lambda+\theta)^{\alpha-1} \times \\[5pt] & \sum_{k=1}^{\infty}q_k\frac{(\!-\!1)^{k-1}}{(k-1)!} \sum_{l=0}^{k-1}\frac{1}{l!}\sum_{j=0}^{l}\binom{l}{j}(\!-\!1)^j(((\Lambda+\theta)^\alpha-\theta^\alpha))^{l-j} \sum_{i=0}^{j}\binom{j}{i}(\alpha i)_{k-1}(\Lambda+\theta)^{\alpha i}(\!-\!\theta^\alpha)^{j-i} \\[5pt] & \times \int_{0}^{\infty}{\mathrm{e}}^{-t((\Lambda+\theta)^\alpha-\theta^\alpha)}t^{l}\,{\mathrm{d}} t. \end{align*}
Using the integral formula of [Reference Gradshteyn and Ryzhik12, (3.351.3)], we get the proposition.
4.1. Generalized shock models
Let $S\;:\!=\; \{S(t)\}_{t \geq 0}$
be a Lévy subordinator. In the next theorem, we evaluate the reliability function of T when the threshold L has geometric distribution with parameter
$S\;:\!=\; \{S(t)\}_{t \geq 0}$
be a Lévy subordinator. In the next theorem, we evaluate the reliability function of T when the threshold L has geometric distribution with parameter $p\in(0,1]$
, i.e.
$p\in(0,1]$
, i.e.
 \begin{equation} \overline{q}_k = (1-p)^k, \qquad k=0,1,2,\dots,\end{equation}
and when the shocks arrive according to a process $N\;:\!=\;\{N(t)\}_{t \geq 0}$
, where
$N\;:\!=\;\{N(t)\}_{t \geq 0}$
, where
 \begin{equation} N(t) \;:\!=\; (\mathcal{N}_1(S(t), \lambda_{1}),\mathcal{N}_2(S(t), \lambda_{2})),\end{equation}
and the components of N are two time-changed independent homogeneous Poisson processes with intensities $\lambda_1>0$
and
$\lambda_1>0$
and $\lambda_2>0$
, respectively. The time change is represented by an independent generic subordinator S.
$\lambda_2>0$
, respectively. The time change is represented by an independent generic subordinator S.
Recalling that $T = \inf\{t \geq 0\colon\mathcal{N}_1(S(t), \lambda_{1})+\mathcal{N}_2(S(t), \lambda_{2}) = L\}$
, the distribution (4.7) stems from the customary assumption that the failure happens at the occurrence of the first critical event of a sequence of Bernoulli trials having parameter p, where each trial is performed as soon as the sum of shocks reaches any integer level.
$T = \inf\{t \geq 0\colon\mathcal{N}_1(S(t), \lambda_{1})+\mathcal{N}_2(S(t), \lambda_{2}) = L\}$
, the distribution (4.7) stems from the customary assumption that the failure happens at the occurrence of the first critical event of a sequence of Bernoulli trials having parameter p, where each trial is performed as soon as the sum of shocks reaches any integer level.
Theorem 4.1. For $(x_1, x_2) \in \mathbb{N}_{0}^2$
and under the assumptions of the model in (4.7) and (4.8), the reliability function of T is
$(x_1, x_2) \in \mathbb{N}_{0}^2$
and under the assumptions of the model in (4.7) and (4.8), the reliability function of T is
 \begin{equation} \overline{F}_{T}(t) = {\mathrm{e}}^{-t\psi((\lambda_1+\lambda_2)p)}, \end{equation}
where $\psi(\cdot)$
is the Laplace exponent of the subordinator S.
$\psi(\cdot)$
is the Laplace exponent of the subordinator S.
Proof. Consider the reliability function of T as
 \begin{align*} \overline{F}_{T}(t) & = \sum_{k=0}^{+\infty}(1-p)^k\sum_{x_1=0}^{k} \mathbb{P}(\mathcal{N}_1(S(t),\lambda_{1})=x_1,\mathcal{N}_2(S(t),\lambda_{2})=k-x_1) \\[5pt] & = \sum_{k=0}^{+\infty}(1-p)^k\sum_{x_1=0}^{k}\frac{\lambda_{1}^{x_{1}}}{x_1!}\frac{\lambda_{2}^{k-x_{1}}}{(k-x_1)!} \int_{0}^{+\infty}{\mathrm{e}}^{-(\lambda_{1}+\lambda_{2})s}s^{k}\mathbb{P}(S(t)\in\mathrm{d}s). \end{align*}
We exchange the order of summation and rearrange all the terms to get
 \begin{align} \overline{F}_{T}(t) & = \sum_{x_1=0}^{+\infty}\frac{\lambda_{1}^{x_1}(1-p)^{x_1}}{x_{1}!} \sum_{h=0}^{+\infty}\frac{[\lambda_{2}(1-p)]^{h}}{h!} \int_{0}^{+\infty}s^{x_1+h}{\mathrm{e}}^{-(\lambda_{1}+\lambda_{2})s}\mathbb{P}(S(t)\in\mathrm{d}s) \nonumber \\[5pt] & = \sum_{x_1=0}^{+\infty}\frac{\lambda_{1}^{x_1}(1-p)^{x_1}}{x_{1}!} \int_{0}^{+\infty}s^{x_1}{\mathrm{e}}^{-(\lambda_{1}+\lambda_{2})s+\lambda_2(1-p)s}\mathbb{P}(S(t)\in\mathrm{d}s) \nonumber \\[5pt] & = \int_{0}^{+\infty}{\mathrm{e}}^{-(\lambda_{1}+\lambda_{2})s+\lambda_2(1-p)s+\lambda_1(1-p)s}\mathbb{P}(S(t)\in\mathrm{d}s)\nonumber\\[5pt] & = \int_{0}^{+\infty}{\mathrm{e}}^{-(\lambda_{1}+\lambda_{2})ps}\mathbb{P}(S(t)\in\mathrm{d}s) = {\mathrm{e}}^{-t\psi((\lambda_1+\lambda_2)p)}. \end{align}
Hence, the theorem is proved.
Remark 4.1. In (4.9), observe that the random failure time T is exponentially distributed with mean depending on the Laplace exponent of the subordinator.
Remark 4.2. As a corollary of Theorem 4.1, it is straightforward to show that if the distribution of L is a mixture of the geometric distribution (4.7), then the distribution of T is a mixture of the exponential distribution (4.10). That is,
 \begin{equation*} \overline{F}_{T}(t) = \int_{0}^{1}{\mathrm{e}}^{-t\psi((\lambda_1+\lambda_2)p)}\,\mathrm{d}G(p), \end{equation*}
where G is a distribution on (0, 1).
Next, we discuss examples of some special random thresholds under the assumptions of the model in (3.1).
4.2. Some examples
First, we reproduce the following identity from [Reference Gupta, Kumar and Leonenko14]:
 \begin{equation} \exp\![\!-t((\Lambda(1-u)+\theta)^\alpha - \theta^\alpha)] = {\mathrm{e}}^{t\theta^{\alpha}} \sum_{k=0}^{\infty}\frac{(\!-\!u)^k}{k!}\sum_{i=0}^{\infty}\frac{\theta^i}{\Lambda^ii!} {_1\Psi_1} \Bigg[{-}\Lambda^\alpha t\; \Bigg| \; \begin{matrix} (1,\alpha) \\[5pt] (1-k-i, \alpha) \end{matrix} \Bigg].\end{equation}
Now, we derive the reliability function of T for two particular cases of the random threshold L.
(i) Let L follow the discrete exponential distribution with reliability function $\overline{q}_k = \textrm{e}^{-k}$
,
$\overline{q}_k = \textrm{e}^{-k}$
, $k=0,1,2,\ldots$
From Proposition 4.3, and with help of (4.11), we get
$k=0,1,2,\ldots$
From Proposition 4.3, and with help of (4.11), we get
 \begin{equation*} \overline{R}_T(t) = \exp\![\!-t((\Lambda(1-{\mathrm{e}}^{-1})+\theta)^\alpha - \theta^\alpha)].\end{equation*}
Also, the density is given by
 \begin{equation*} g_T(t) = \frac{{\mathrm{d}}}{{\mathrm{d}} t}\overline{R}_T(t) = ((\Lambda(1-{\mathrm{e}}^{-1})+\theta)^\alpha - \theta^\alpha) \exp\![\!-t((\Lambda(1-'e^{-1})+\theta)^\alpha - \theta^\alpha)].\end{equation*}
Therefore, the hazard rate function denoted by $H_T(t)$
for the random variable T is given by
$H_T(t)$
for the random variable T is given by
 \begin{equation*} H_T(t) = \frac{g_T(t)}{\overline{R}_T(t)} = ((\Lambda(1-{\mathrm{e}}^{-1})+\theta)^\alpha - \theta^\alpha), \qquad t \geq 0.\end{equation*}
(ii) Let L follow the Yule–Simon distribution with parameter p and the reliability function $\overline{q}_k = kB(k,p+1)$
,
$\overline{q}_k = kB(k,p+1)$
, $k=1,2,\ldots$
, where
$k=1,2,\ldots$
, where $B(a,b) = \int_{0}^{1} t^{a-1}(1-t)^{b-1}\,{\mathrm{d}} t$
is the beta function. Then, the reliability function
$B(a,b) = \int_{0}^{1} t^{a-1}(1-t)^{b-1}\,{\mathrm{d}} t$
is the beta function. Then, the reliability function $\overline{R}_T(t)$
takes the form
$\overline{R}_T(t)$
takes the form
 \begin{align*} \overline{R}_T(t) & = \sum_{k=0}^{\infty}kB(k,p+1)\frac{(\!-\!1)^k}{k!}{\mathrm{e}}^{t\theta^{\alpha}}\sum_{i=0}^{\infty}\frac{\theta^i}{\Lambda^ii!} {_1\Psi_1}\Bigg[{-}\Lambda^\alpha t\; \Bigg| \; \begin{matrix} (1,\alpha) \\[5pt] (1-k-i, \alpha) \end{matrix} \Bigg] \\[5pt] & = \sum_{k=0}^{\infty}k\bigg(\int_{0}^{1}z^{k-1}(1-z)^{p}\,{\mathrm{d}} z\bigg)\frac{(\!-\!1)^k}{k!}{\mathrm{e}}^{t\theta^{\alpha}} \sum_{i=0}^{\infty}\frac{\theta^i}{\Lambda^ii!} {_1\psi_1}\Bigg[{-}\Lambda^\alpha t\; \Bigg| \; \begin{matrix} (1,\alpha) \\[5pt] (1-k-i, \alpha) \end{matrix} \Bigg] \\[5pt] & = {\mathrm{e}}^{t\theta^{\alpha}}\int_{0}^{1}(1-z)^{p}\sum_{k=1}^{\infty}kz^{k-1}\frac{(\!-\!1)^k}{k!} \sum_{i=0}^{\infty}\frac{\theta^i}{\Lambda^ii!} {_1\Psi_1}\Bigg[{-}\Lambda^\alpha t\; \Bigg| \; \begin{matrix} (1,\alpha) \\[5pt] (1-k-i, \alpha) \end{matrix} \Bigg]\,{\mathrm{d}} z \\[5pt] & = \int_{0}^{1}(1-z)^{p}\bigg(\frac{{\mathrm{d}}}{{\mathrm{d}} z}\exp\![\!-t((\Lambda(1-z)+\theta)^\alpha - \theta^\alpha)]\bigg)\,{\mathrm{d}} z.\end{align*}
Hence, the density function is given by
 \begin{equation*} g_T(t) = \int_{0}^{1}(1-z)^{p}\frac{{\mathrm{d}}}{{\mathrm{d}} t} \bigg(\frac{{\mathrm{d}}}{{\mathrm{d}} z}\exp[-t((\Lambda(1-z)+\theta)^\alpha - \theta^\alpha)]\bigg)\,{\mathrm{d}} z.\end{equation*}
Considering these $g_T(t)$
and
$g_T(t)$
and $\overline{R}_T(t)$
, we get the hazard rate function in the case of a Yule–Simon threshold.
$\overline{R}_T(t)$
, we get the hazard rate function in the case of a Yule–Simon threshold.
Now, we discuss some special cases of the mixing distribution from Remark 4.2 under the assumptions of the model in (4.8).
4.3. Special cases
We now analyze three special cases by specifying the mixing distribution, under the assumption that S is the tempered $\alpha$
-stable subordinator as in (2.2). Evaluation of the reliability functions can be performed using Mathematica.
$\alpha$
-stable subordinator as in (2.2). Evaluation of the reliability functions can be performed using Mathematica.
(i) $\mathrm{d}G(p)=\mathrm{d}p$
(uniform distribution). It is
$\mathrm{d}G(p)=\mathrm{d}p$
(uniform distribution). It is
 \begin{equation} \overline{F}_{T}(t) = \frac{{\mathrm{e}}^{t\theta^{\alpha}}}{\alpha(\lambda_1+\lambda_2)} [\theta E_{({\alpha-1})/{\alpha}}(t\theta^{\alpha})-(\lambda_{1}+\lambda_{2}+\theta) E_{({\alpha-1})/{\alpha}}(t(\lambda_{1}+\lambda_{2}+\theta)^{\alpha})],\end{equation}
where $E_{l}(z)=\int_{1}^{+\infty}{{\mathrm{e}}^{-uz}}/{u^{l}}\,\mathrm{d}u$
is a generalized exponential integral.
$E_{l}(z)=\int_{1}^{+\infty}{{\mathrm{e}}^{-uz}}/{u^{l}}\,\mathrm{d}u$
is a generalized exponential integral.
(ii)
 $$\mathrm{d}G(p) = \frac{ab(1+ap)^{-(b+1)}}{1-(1+a)^{-b}}\,\mathrm{d}p,$$
with $a>0$
and
$a>0$
and $(b>-1) \wedge (b \neq 0)$
(truncated Lomax). Set
$(b>-1) \wedge (b \neq 0)$
(truncated Lomax). Set $a\;:\!=\;({\lambda _{1}+\lambda _{2}})/{\theta}$
and
$a\;:\!=\;({\lambda _{1}+\lambda _{2}})/{\theta}$
and $b+1\;:\!=\;\alpha$
. It is
$b+1\;:\!=\;\alpha$
. It is
 \begin{align} \overline{F}_{T}(t) & = \frac{{\mathrm{e}}^{t\theta^{\alpha}}(\alpha-1)}{\alpha[1-(1+({\lambda_{1}+\lambda_{2}})/{\theta})^{1-\alpha}]} \nonumber \\[5pt] & \quad \times \bigg[E_{2-({1}/{\alpha })}(t\theta^{\alpha}) - \bigg(1+\frac{\lambda_{1}+\lambda_{2}}{\theta}\bigg)^{1-\alpha}E_{2-({1}/{\alpha })} \bigg(t\theta^{\alpha}\bigg(1+\frac{\lambda_{1}+\lambda_{2}}{\theta}\bigg)^{\alpha}\bigg)\bigg].\end{align}
(iii)
 $$\mathrm{d}G(p) = \frac{b}{a}\bigg(\frac{p-c}{a}\bigg)^{b-1}{\mathrm{e}}^{-(({p-c})/{a})^{b}}\,\mathrm{d}p,$$
where a and b are positive values, and c is a real value (truncated three-parameter Weibull). Set $a={1}/({\lambda_1+\lambda_2})$
,
$a={1}/({\lambda_1+\lambda_2})$
, $b=\alpha$
, and
$b=\alpha$
, and $c=-{\theta}/({\lambda_1+\lambda_2})$
. It is
$c=-{\theta}/({\lambda_1+\lambda_2})$
. It is
 \begin{equation} \overline{F}_{T}(t) = \frac{1-{\mathrm{e}}^{-(t+1)[(\lambda_{1}+\lambda_{2}+\theta)^{\alpha}-\theta^{\alpha}]}} {(t+1)[1-{\mathrm{e}}^{-[(\lambda_{1}+\lambda_{2}+\theta)^{\alpha}-\theta^{\alpha}]}]}.\end{equation}
The graphs in Figures 1, 2, and 3 illustrate the special cases for some particular values of the parameters.
Plots of the reliability function (4.12) with $\lambda_1=\lambda_2=1$
and
$\lambda_1=\lambda_2=1$
and $\theta=1$
on the left,
$\theta=1$
on the left, $\alpha=0.5$
on the right.
$\alpha=0.5$
on the right.

Plots of the reliability function (4.13) with $\lambda_1=\lambda_2=1$
and
$\lambda_1=\lambda_2=1$
and $\theta=1$
on the left,
$\theta=1$
on the left, $\alpha=0.5$
on the right.
$\alpha=0.5$
on the right.
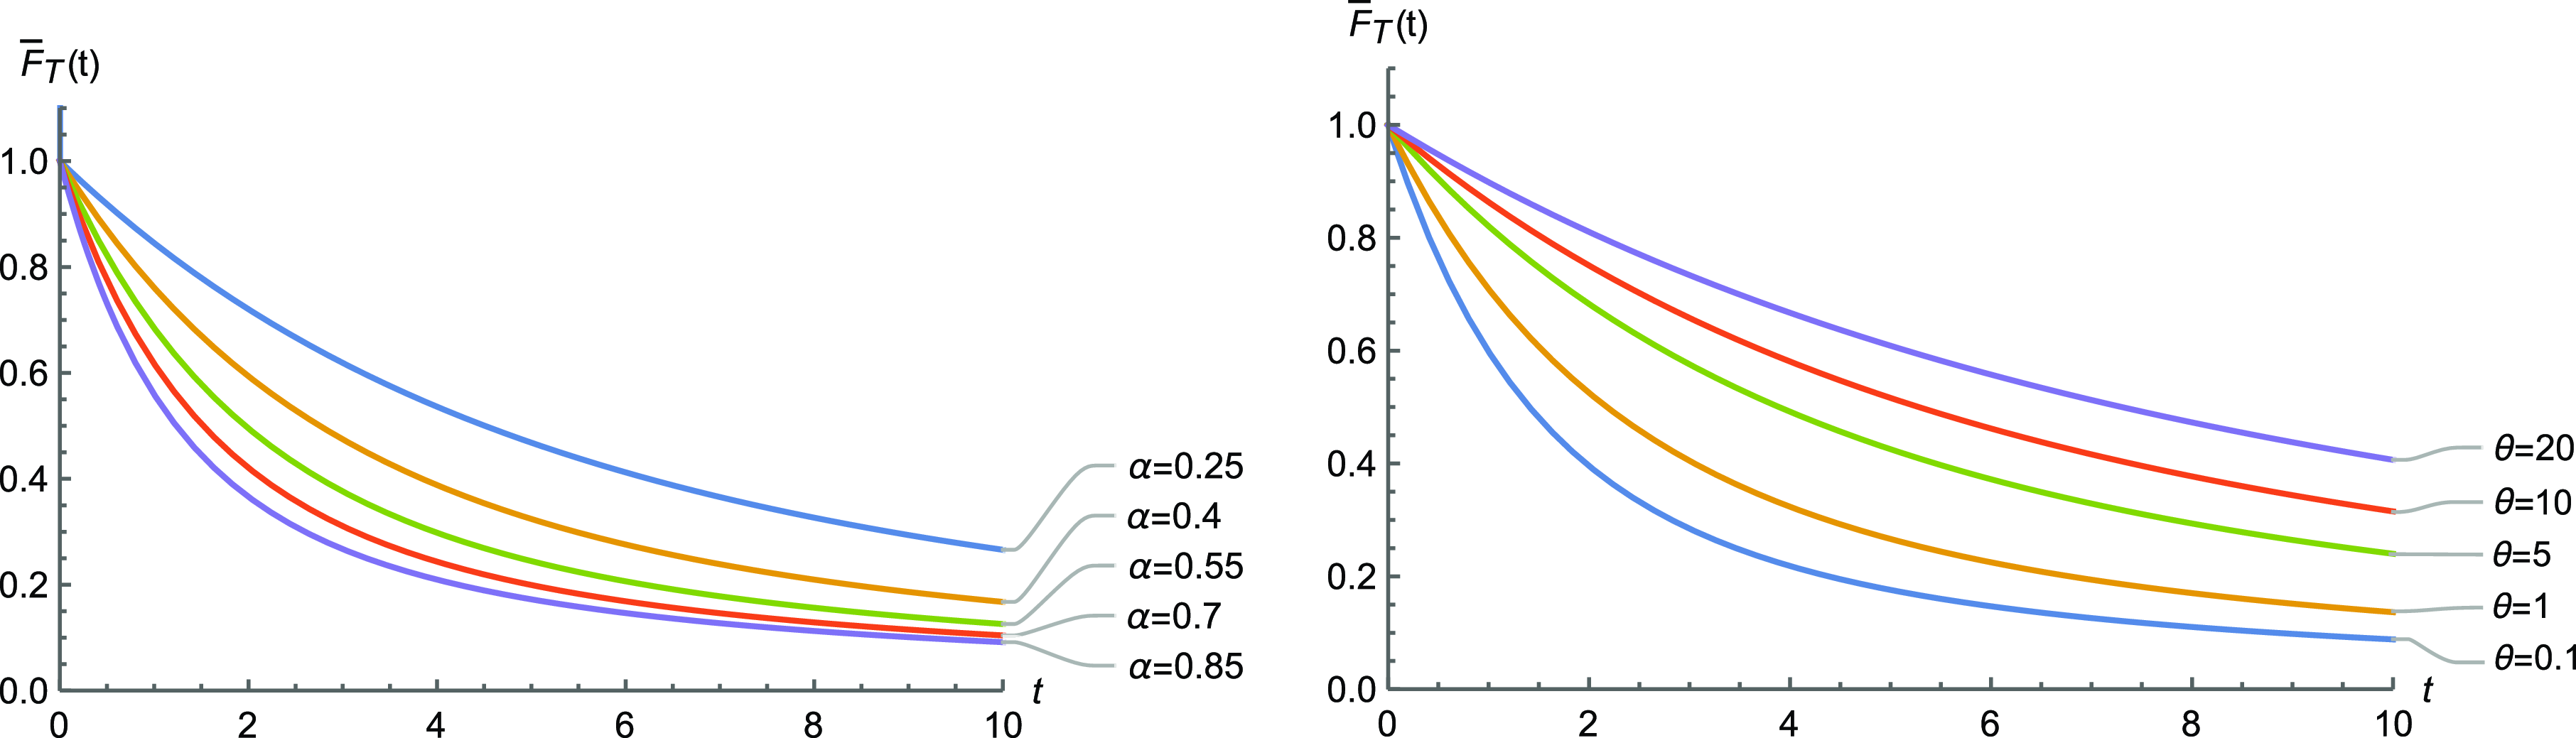
Plots of the reliability function (4.14) with $\lambda_1=\lambda_2=1$
and
$\lambda_1=\lambda_2=1$
and $\theta=1$
on the left,
$\theta=1$
on the left, $\alpha=0.5$
on the right.
$\alpha=0.5$
on the right.
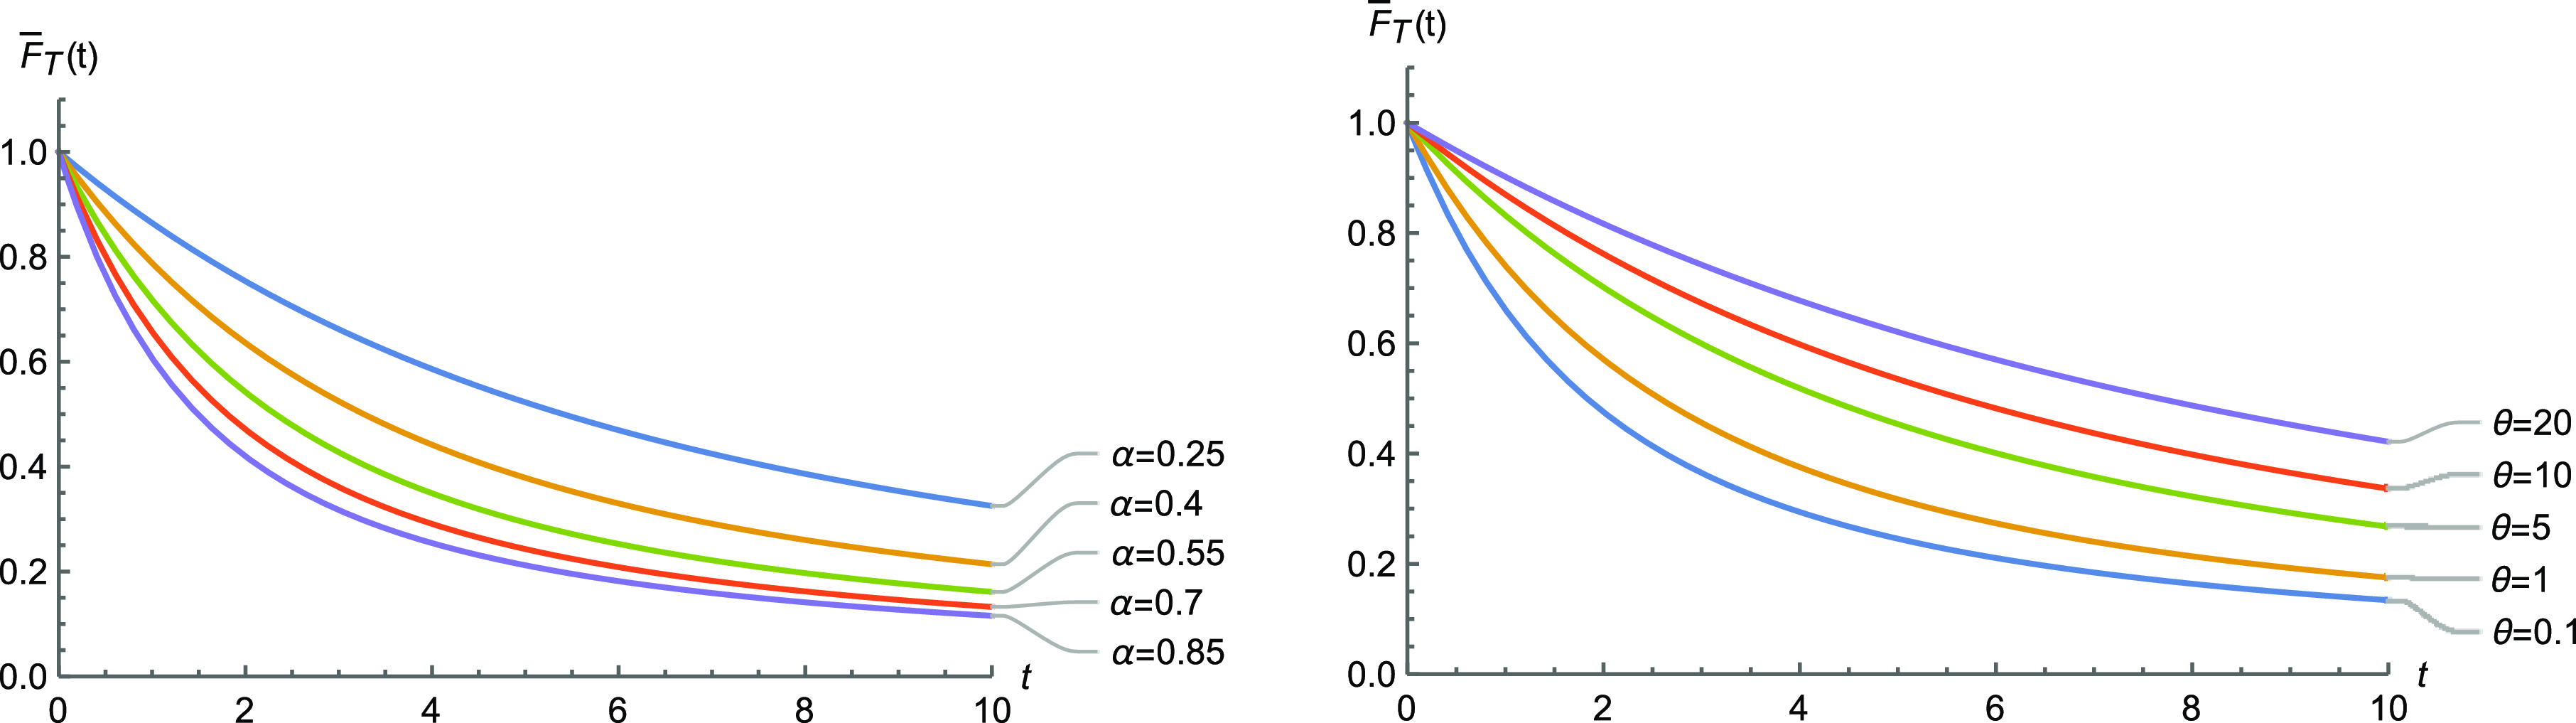
5. Concluding remarks
In this paper, we have proposed a bivariate tempered space-fractional Poisson process by time-changing the bivariate Poisson process with an independent tempered $\alpha$
-stable subordinator. First, we derived the expression for the probability mass function and expressed it in terms of the generalized Wright function, then we obtained the governing differential equations for the PMF and the PGF. We also derived the Lévy measure density for the BTSFPP. Tempering the distribution of an
$\alpha$
-stable subordinator. First, we derived the expression for the probability mass function and expressed it in terms of the generalized Wright function, then we obtained the governing differential equations for the PMF and the PGF. We also derived the Lévy measure density for the BTSFPP. Tempering the distribution of an $\alpha$
-stable subordinator by a decreasing exponential gives the new process the property of behaving like a stable subordinator at small times, but with lighter tails at large times. As a consequence, all moments are finite and its density is also infinitely divisible, although it is no more self-similar. Parameter estimation procedures are also well known (see, for instance, [Reference Küchler and Tappe18]). Moreover, as outlined in [Reference Orsingher and Toaldo27], time-changing a Poisson process with a tempered stable subordinator, rather than with a stable subordinator, has its advantages since it results in high jumps occurring with smaller probability. This might be of interest when it comes to modeling real phenomena. Many financial applications, like option pricing, rely on tempered stable distributions, but, to our knowledge, the use of such processes in reliability is totally unexplored. Therefore, we presented a bivariate competing risk and shock model based on the BTSFPP and derived various reliability quantities to predict the life of the system. Finally, we discussed a generalized shock model and various typical examples. We have focused our study here on the bivariate case, but our work can be explored in multivariate cases also. We could possibly develop the model in subsequent studies by taking into account nonhomogeneous, multistable, and multifractional counting processes. The next step in the research might potentially include consideration of the ageing properties of the random failure time and some additional reliability notions.
$\alpha$
-stable subordinator by a decreasing exponential gives the new process the property of behaving like a stable subordinator at small times, but with lighter tails at large times. As a consequence, all moments are finite and its density is also infinitely divisible, although it is no more self-similar. Parameter estimation procedures are also well known (see, for instance, [Reference Küchler and Tappe18]). Moreover, as outlined in [Reference Orsingher and Toaldo27], time-changing a Poisson process with a tempered stable subordinator, rather than with a stable subordinator, has its advantages since it results in high jumps occurring with smaller probability. This might be of interest when it comes to modeling real phenomena. Many financial applications, like option pricing, rely on tempered stable distributions, but, to our knowledge, the use of such processes in reliability is totally unexplored. Therefore, we presented a bivariate competing risk and shock model based on the BTSFPP and derived various reliability quantities to predict the life of the system. Finally, we discussed a generalized shock model and various typical examples. We have focused our study here on the bivariate case, but our work can be explored in multivariate cases also. We could possibly develop the model in subsequent studies by taking into account nonhomogeneous, multistable, and multifractional counting processes. The next step in the research might potentially include consideration of the ageing properties of the random failure time and some additional reliability notions.
Acknowledgements
The authors are grateful to the editor and anonymous referees for their constructive and helpful comments which have significantly improved the article. A.D.C. and A.M. are members of the GNCS group of INdAM (Istituto Nazionale di Alta Matematica).
Funding information
This work is partially supported by CSIR India (File No: 09/1051(11349)/2021-EMR-I), DST-SERB Government of India (MATRICS Grant: MTR/2022/000796) and European Union – Next Generation EU through MUR-PRIN 2022 PNRR, project P2022XSF5H Stochastic Models in Biomathematics and Applications, and MUR–PRIN 2022, Project Anomalous Phenomena on Regular and Irregular Domains: Approximating Complexity for the Applied Sciences (no. 2022XZSAFN).
Competing interests
There were no competing interests to declare which arose during the preparation or publication process of this article.


 Open access