


Significant outcomes
-
FC alterations were observed in several networks in PeD patients, compared to controls, with most pronounced differences at baseline.
-
No consistent longitudinal effect was found on FC that could be attributed to degarelix treatment.
Limitations
-
Results should not be externally generalised since they are presented on group-level and our help-seeking PeD sample is not representative of the PeD population as a whole and considerably differs from most forensic populations.
-
No validation on whether the self-report of CSA crimes and convictions or if the CSA risk measure used in the study relate to actual CSA.
-
rsfMRI results from ten weeks post-injection of degarelix or placebo are not directly compared with results from baseline and two weeks post-injection examinations, as different experimental setups i.e., 7T versus 3T MR field strengths, and thus imaging acquisition parameters were used at these timepoints.
Introduction
Child sexual abuse (CSA) is a widespread societal problem. A meta-analysis estimated that 16.4–19.7% of girls and 6.6–8.8% of boys are victims of CSA (Stoltenborgh et al., Reference Stoltenborgh, van Ijzendoorn, Euser and Bakermans-Kranenburg2011). CSA preventive strategies are of utmost importance as CSA often incurs substantial long-term physical and mental consequences for victims (Irish et al., Reference Irish, Kobayashi and Delahanty2010; Collin-Vézina et al., Reference Collin-Vézina, Daigneault and Hébert2013).
Among CSA offenders, around 50% are individuals with paedophilic disorder (PeD) (Malamuth and Huppin, Reference Malamuth and Huppin2007), and up to 95% of sexual offences are committed by previously non-convicted individuals (Sandler et al., Reference Sandler, Freeman and Socia2008). A study on convicted sex offenders reported that 61% of study participants said they would have sought help before the sexual offence, if such help was perceived as available and accessible (Piché et al., Reference Piché, Mathesius, Lussier and Schweighofer2018). Thus, providing effective treatment for individuals with PeD is a necessary preventive strategy for CSA.
To improve treatment of PeD and prevent CSA, there is a need for a deeper understanding of neurological and psychological aspects of the disorder which might lead to improved diagnostics, treatment, and risk assessment (Jordan et al., Reference Jordan, Wild, Fromberger, Müller and Müller2020). Measures from functional magnetic resonance imaging (fMRI), as a complement to other clinical measures, have been suggested as potential imaging biomarkers (Jordan et al., Reference Jordan, Fromberger, Laubinger, Dechent and Müller2014). Functional connectivity (FC) differences between paedophilic offenders and controls have been reported in default mode network and frontoparietal network in an independent component analysis (Cantor et al., Reference Cantor, Lafaille, Hannah, Kucyi, Soh, Girard and Mikulis2016). Another study investigated FC in the default mode network and the limbic network between individuals with PeD who engaged in CSA, individuals with PeD who did not engage in CSA, and healthy controls. They found FC alterations in individuals with PeD engaging in CSA compared to both those who did not and healthy controls in both networks, but no differences between individuals with PeD not engaging in CSA and healthy controls (Kärgel et al., Reference Kärgel, Massau, Weiß, Walter, Kruger and Schiffer2015). Notably, all these study differences were found in comparisons using PeD cohorts consisting of CSA offenders. Only the later study tested, without observing any alterations related to non-offending PeD individuals, but the sample size in this study was small (Kärgel et al., Reference Kärgel, Massau, Weiß, Walter, Kruger and Schiffer2015). To our knowledge, the effect of treatment in PeD has not been studied with resting state fMRI (rsfMRI).
Androgen deprivation therapy (ADT) is frequently used for the treatment of androgen-sensitive prostate cancer and less commonly so for more severe cases of paraphilias (predominantly PeD) and compulsive sexual behaviour disorder (Landgren et al., Reference Landgren, Savard, Dhejne, Jokinen, Arver, Seto and Rahm2022; Culos et al., Reference Culos, Di Grazia and Meneguzzo2024). Landgren et al. (Reference Landgren, Malki, Bottai, Arver and Rahm2020) showed that degarelix treatment decreased the risk score of committing CSA after 2 weeks in a help-seeking PeD sample. Degarelix is a gonadotropin-releasing hormone antagonist that classifies as an ADT through suppression of androgen (and testosterone) levels. To our knowledge, human fMRI literature on the effects of degarelix and gonadotropin-releasing hormone antagonists is non-existent. Meanwhile, the fMRI literature on ADT is limited and consists of one rsfMRI study after ADT treatment (Plata-Bello et al., Reference Plata-Bello, Plata-Bello, Pérez-Martín, López-Curtis, Acosta-López, Modroño and Concepción-Massip2021), two on task-based fMRI (Cherrier et al., Reference Cherrier, Borghesani, Shelton and Higano2010; Chao et al., Reference Chao, Uchio, Zhang, Hu, Bednarski, Luo, Rose, Concato and Li2012) with the only studies on ADT for PeD being two task-based fMRI case-studies (Habermeyer et al., Reference Habermeyer, Händel, Lemoine, Klarhöfer, Seifritz, Dittmann and Graf2012; Jordan et al., Reference Jordan, Fromberger, Laubinger, Dechent and Müller2014). Plata-Bello et al. (Reference Plata-Bello, Plata-Bello, Pérez-Martín, López-Curtis, Acosta-López, Modroño and Concepción-Massip2021) found altered ALFF (Amplitude of low frequency fluctuations) in prostate cancer patients treated with ADT compared to non-treated patients in several brain regions as well as altered ReHo (Regional Homogeneity) in left superior occipital gyrus. They also found altered FC in several brain regions using regions-of-interest based on selected brain areas with the highest androgen receptor expression as seeds in a seed-based analysis.
The aims of this study were to evaluate resting state FC in men with PeD compared to healthy controls and to evaluate potential effects of degarelix treatment on FC in an exploratory manner. We also sought to evaluate FC in different subgroups of the PeD study participants, for example, pertaining to CSA risk and comorbidity.
Material and methods
Subjects
Participants with PeD (51 men, mean age 36, range 18–66 years) were recruited from the PRIOTAB study detailed in an earlier publication (Landgren et al., Reference Landgren, Malki, Bottai, Arver and Rahm2020). Exclusion criteria were MRI contraindications, severe psychiatric comorbidity, and degarelix contraindications. Study participants were randomised to receive either degarelix (n = 25) or placebo (n = 26). Five of the participants were later excluded due to incomplete image acquisition. Age matched healthy men (n = 55, mean age 36, range 18–64 years) with no MRI contraindications were recruited to the control group.
Cohort characteristics
At baseline, i.e., before injection of degarelix or placebo, at two weeks follow-up, and at ten weeks follow-up, patients underwent psychiatric testing. Four empirically derived dynamic risk domains for committing CSA were assessed (paedophilic interest, sexual preoccupation, impaired self-regulation, and low empathy) and self-rated risk, each of which could be rated from 0 to 3 points. They were combined to a dynamic risk score constructed in the PRIOTAB (paedophilia at risk – investigations of treatment and biomarkers) project, ranging from 0 to 15, with 0–5 considered as low-risk, 6–10 medium-risk, and 11–15 as high-risk for committing CSA. For details on the risk score and its subscales, see elsewhere (Wittström et al., Reference Wittström, Långström, Landgren and Rahm2020).
Participants were also assessed for autistic traits (Ritvo Autism and Asperger Diagnostic Scale-Revised (14 Screen), RAADS-14 (Eriksson et al., Reference Eriksson, Andersen and Bejerot2013), hypersexuality symptoms (Hypersexual Behaviour Inventory, HBI-19 (Reid et al., Reference Reid, Garos and Carpenter2011) and self-reported convictions of sexual offences. Additionally, the paedophilic interest subscale score, part of the dynamic risk score, was used to determine if individuals had paedophilic attraction (score of > 0) or not (score of 0). Due to missing dynamic risk score and RAADS-14 score for one patient in the degarelix group, that patient was excluded in analyses requiring those scores.
MRI image acquisition
MRI-examinations were performed on a 3T MR system at baseline (B 3T) and two weeks follow-up (2w 3T) and on a 7T MR system at ten weeks follow-up (10w 7T). Data used for this study consisted of a T1-weighted (T1w) structural scan and a rsfMRI scan. B 3T and 2w 3T follow-up imaging was performed on a Siemens Prisma 3T scanner with scan parameters for the T1w scan: resolution 1 × 1 × 1 mm3, TR 1900 ms, TE 2.52 ms; and for the rsfMRI scan: resolution 3 × 3 × 3 mm3, TR 2500 ms, TE 34 ms, flip angle 90°, dynamic scans 180.
10w 7T was performed on a Philips Achieva 7T scanner with scan parameters for T1w scan: resolution 1 × 1 × 1 mm3, TR 8 ms, TE 1.97 ms, flip angle 8°; for the rsfMRI scan: resolution 1 × 1 × 2.5 mm3 with 0.25 mm gap between slices, TR 1700 ms, TE 12 ms, flip angle 70°, dynamic scans 250 and for the B0-map scan: resolution 3.75 × 3.75 × 3.75 mm3, TR 3.9 ms, TE 1.55 ms, flip angle 10°.
MRI image quality
Mean framewise displacement (FD) was calculated for the three different imaging timepoints and compared between the PeD and Control groups. Also mean FD at B 3T and 2w 3T were compared for the PeD group. Comparisons were made using student’s t-test. 3T and 7T timepoints were not compared due to the different acquired scanning resolutions used at the different scanners and as 3T and 7T data were not compared.
Preprocessing of image data
Preprocessing was performed with FMRIB (Oxford centre for fMRI of the brain) Software Library (FSL) v6.0 (Jenkinson et al., Reference Jenkinson, Beckmann, Behrens, Woolrich and Smith2012) and ICA-AROMA (independent component analysis-automatic removal of motion artefacts) (Pruim et al., Reference Pruim, Mennes, van Rooij, Llera, Buitelaar and Beckmann2015). Brain extraction and white matter and cerebrospinal fluid (CSF) segmentation was performed on the T1w structural scans. Motion correction, slice timing correction and smoothing with a Gaussian filter (3T scans: FWHM (full width half maximum) 6 mm, 7T: FWHM 4 mm) was performed on the rsfMRI scans. B0 unwarping using the B0-map was performed for the 7T rsfMRI scans.
Mean time series for white matter and CSF-signal was calculated using the white matter and CSF segmentation eroded masks. ICA-AROMA was used to extract noise components and their time series. Denoising was performed by regressing out white matter, CSF, and noise time series from the whole brain functional scans using fsl_regfilt (FSL software). A temporal high-pass filter was applied (0.01 Hz cut off). Functional data was transformed to MNI152 (Montreal Neurological Institute)-space using FNIRT (FMRIB’s nonlinear image registration tool).
Functional connectivity (FC) analysis
Group-ICA (independent component analysis) was performed using FSLs MELODIC (Multivariate Exploratory Linear Optimised Decomposition into Independent Components) with multi-session temporal concatenation to receive group-level spatial maps of components. The number of output components was restricted to 30. Dual-regression was performed to calculate the subject-specific component maps for each of the components found on group-level (Beckmann et al., Reference Beckmann, Mackay, Filippini and Smith2009). 30 components were chosen to avoid over- and underfitting data, which might result in large-scale resting state networks splitting into several components or smaller networks merging into same components. All detected networks were inspected visually and, if not clearly attributed to canonical RSNs labelled as unidentified with anatomical information.
Statistics
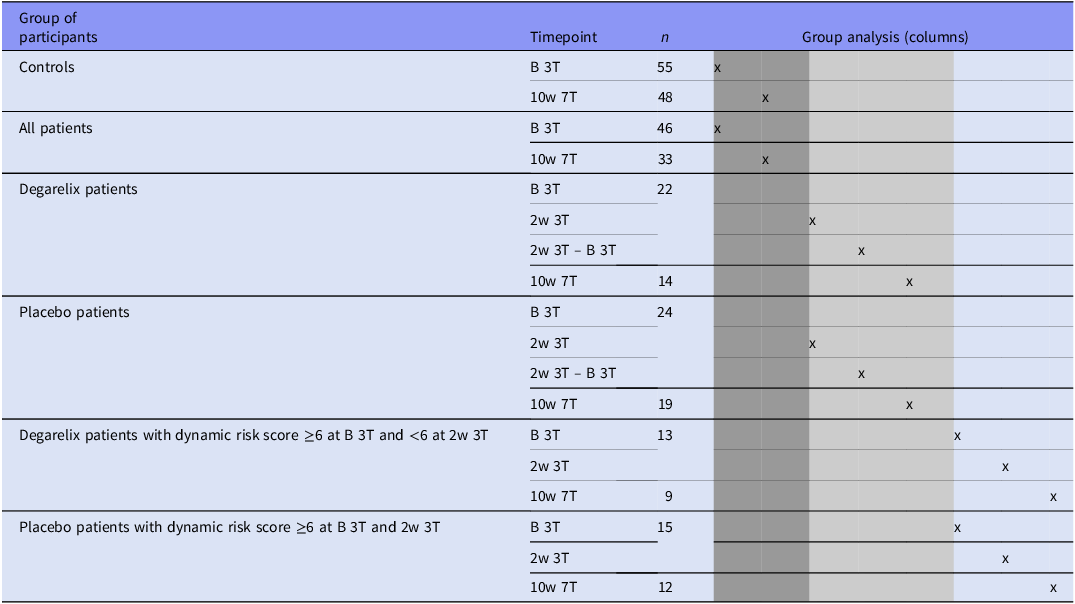
Group comparisons were carried out to evaluate potential FC differences related to PeD (controls vs. patients), degarelix treatment effect (degarelix patients vs. placebo patients), and CSA risk (based on dynamic risk score) (Table 1).
Group comparisons performed to evaluate functional connectivity differences related to paedophilic disorder (PeD) (dark grey columns) and related to degarelix treatment effect (middle grey columns), CSA dynamic risk scores (white columns). Each column under ‘Group analysis’ represents the comparison between two specific groups of participants and timepoints marked with ‘x’. B 3T, baseline 3T MR examination; 2w 3T, 2 weeks follow-up 3T MR examination; 10w 7T, 10 weeks follow-up 7T MR examination

Group comparisons were carried out on the resulting statistical maps from the dual-regression procedure, with two-sample t-tests using FSLs ‘randomise’ with non-parametric permutation testing (5000 permutations) and statistic thresholding performed using threshold-free cluster enhancement and FWE (family-wise error)-corrected significance threshold of p ≤ 0.05.
Age was included as a regressor of no interest. Due to the exploratory nature of this study, results of main comparisons are given both uncorrected for multiple comparisons as well as with p-values adjusted for multiple testing using the Benjamini–Hochberg procedure to control the false discovery rate (FDR) at 5%. Statistically significant differences without correction were visualised by overlaying the thresholded p-value maps on the component maps where the differences were found in MNI-space. The component maps were thresholded at z-score = 3. We also report mean and standard deviation for the network z-score, using the threshold z = 3, and the cluster z-score.
Despite limited and uneven statistical power but based on the uniqueness of the material, several additional tests of hypothesis-generating nature were performed and included in Supplements only (Supplement Tables S1–S5).
7T data are only used for subgroup analysis at one time point (10w follow-up) and not for longitudinal analysis against 3T data.
Results
Cohort characteristics
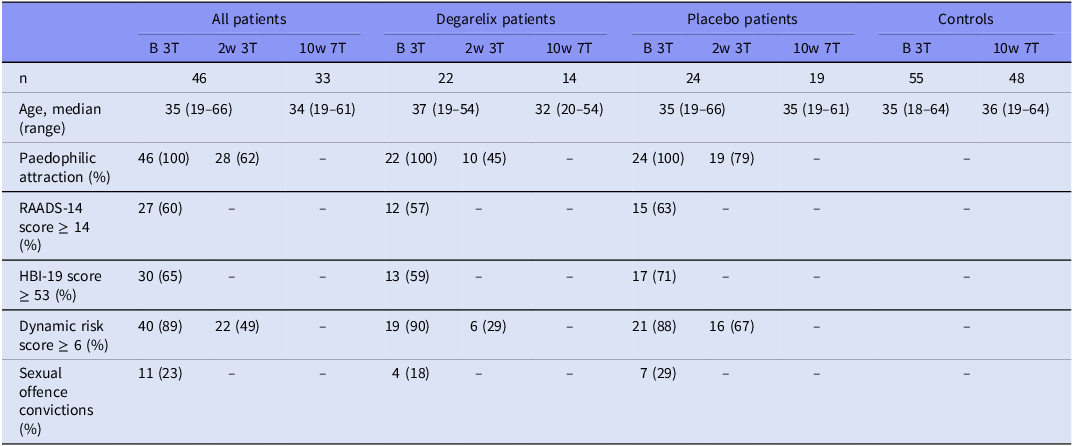
Cohort characteristics relevant for the statistical analyses are summarised in Table 2.
Cohort characteristics at baseline (B 3T), at 2-weeks (2w 3T) and at 10-weeks (10w 7T) follow-up. B, baseline; 2w and 10w, 2-week and 10-week follow up visit respectively; 3T and 7T, magnetic resonance imaging with 3 T and 7 T field strength, respectively; RAADS-14, Ritvo Autism and Asperger Diagnostic Scale, 14 Screen (score range: 0–42, where ≥ 14 indicates a positive screening for autism spectrum disorder with a sensitivity of 97% and a specificity of 46% to 64%); HBI, Hypersexual Behavioural Inventory (score range: 19–95, where ≥53 has been proposed as a cut-off point for clinically significant hypersexuality)

MRI image quality
Mean FD did not differ statistically (p > 0.05) between PeD and Controls at any time point (separate evaluation of 3T data and 7T data) nor between the time points B 3T and 2w 3T.
Functional connectivity differences related to PeD
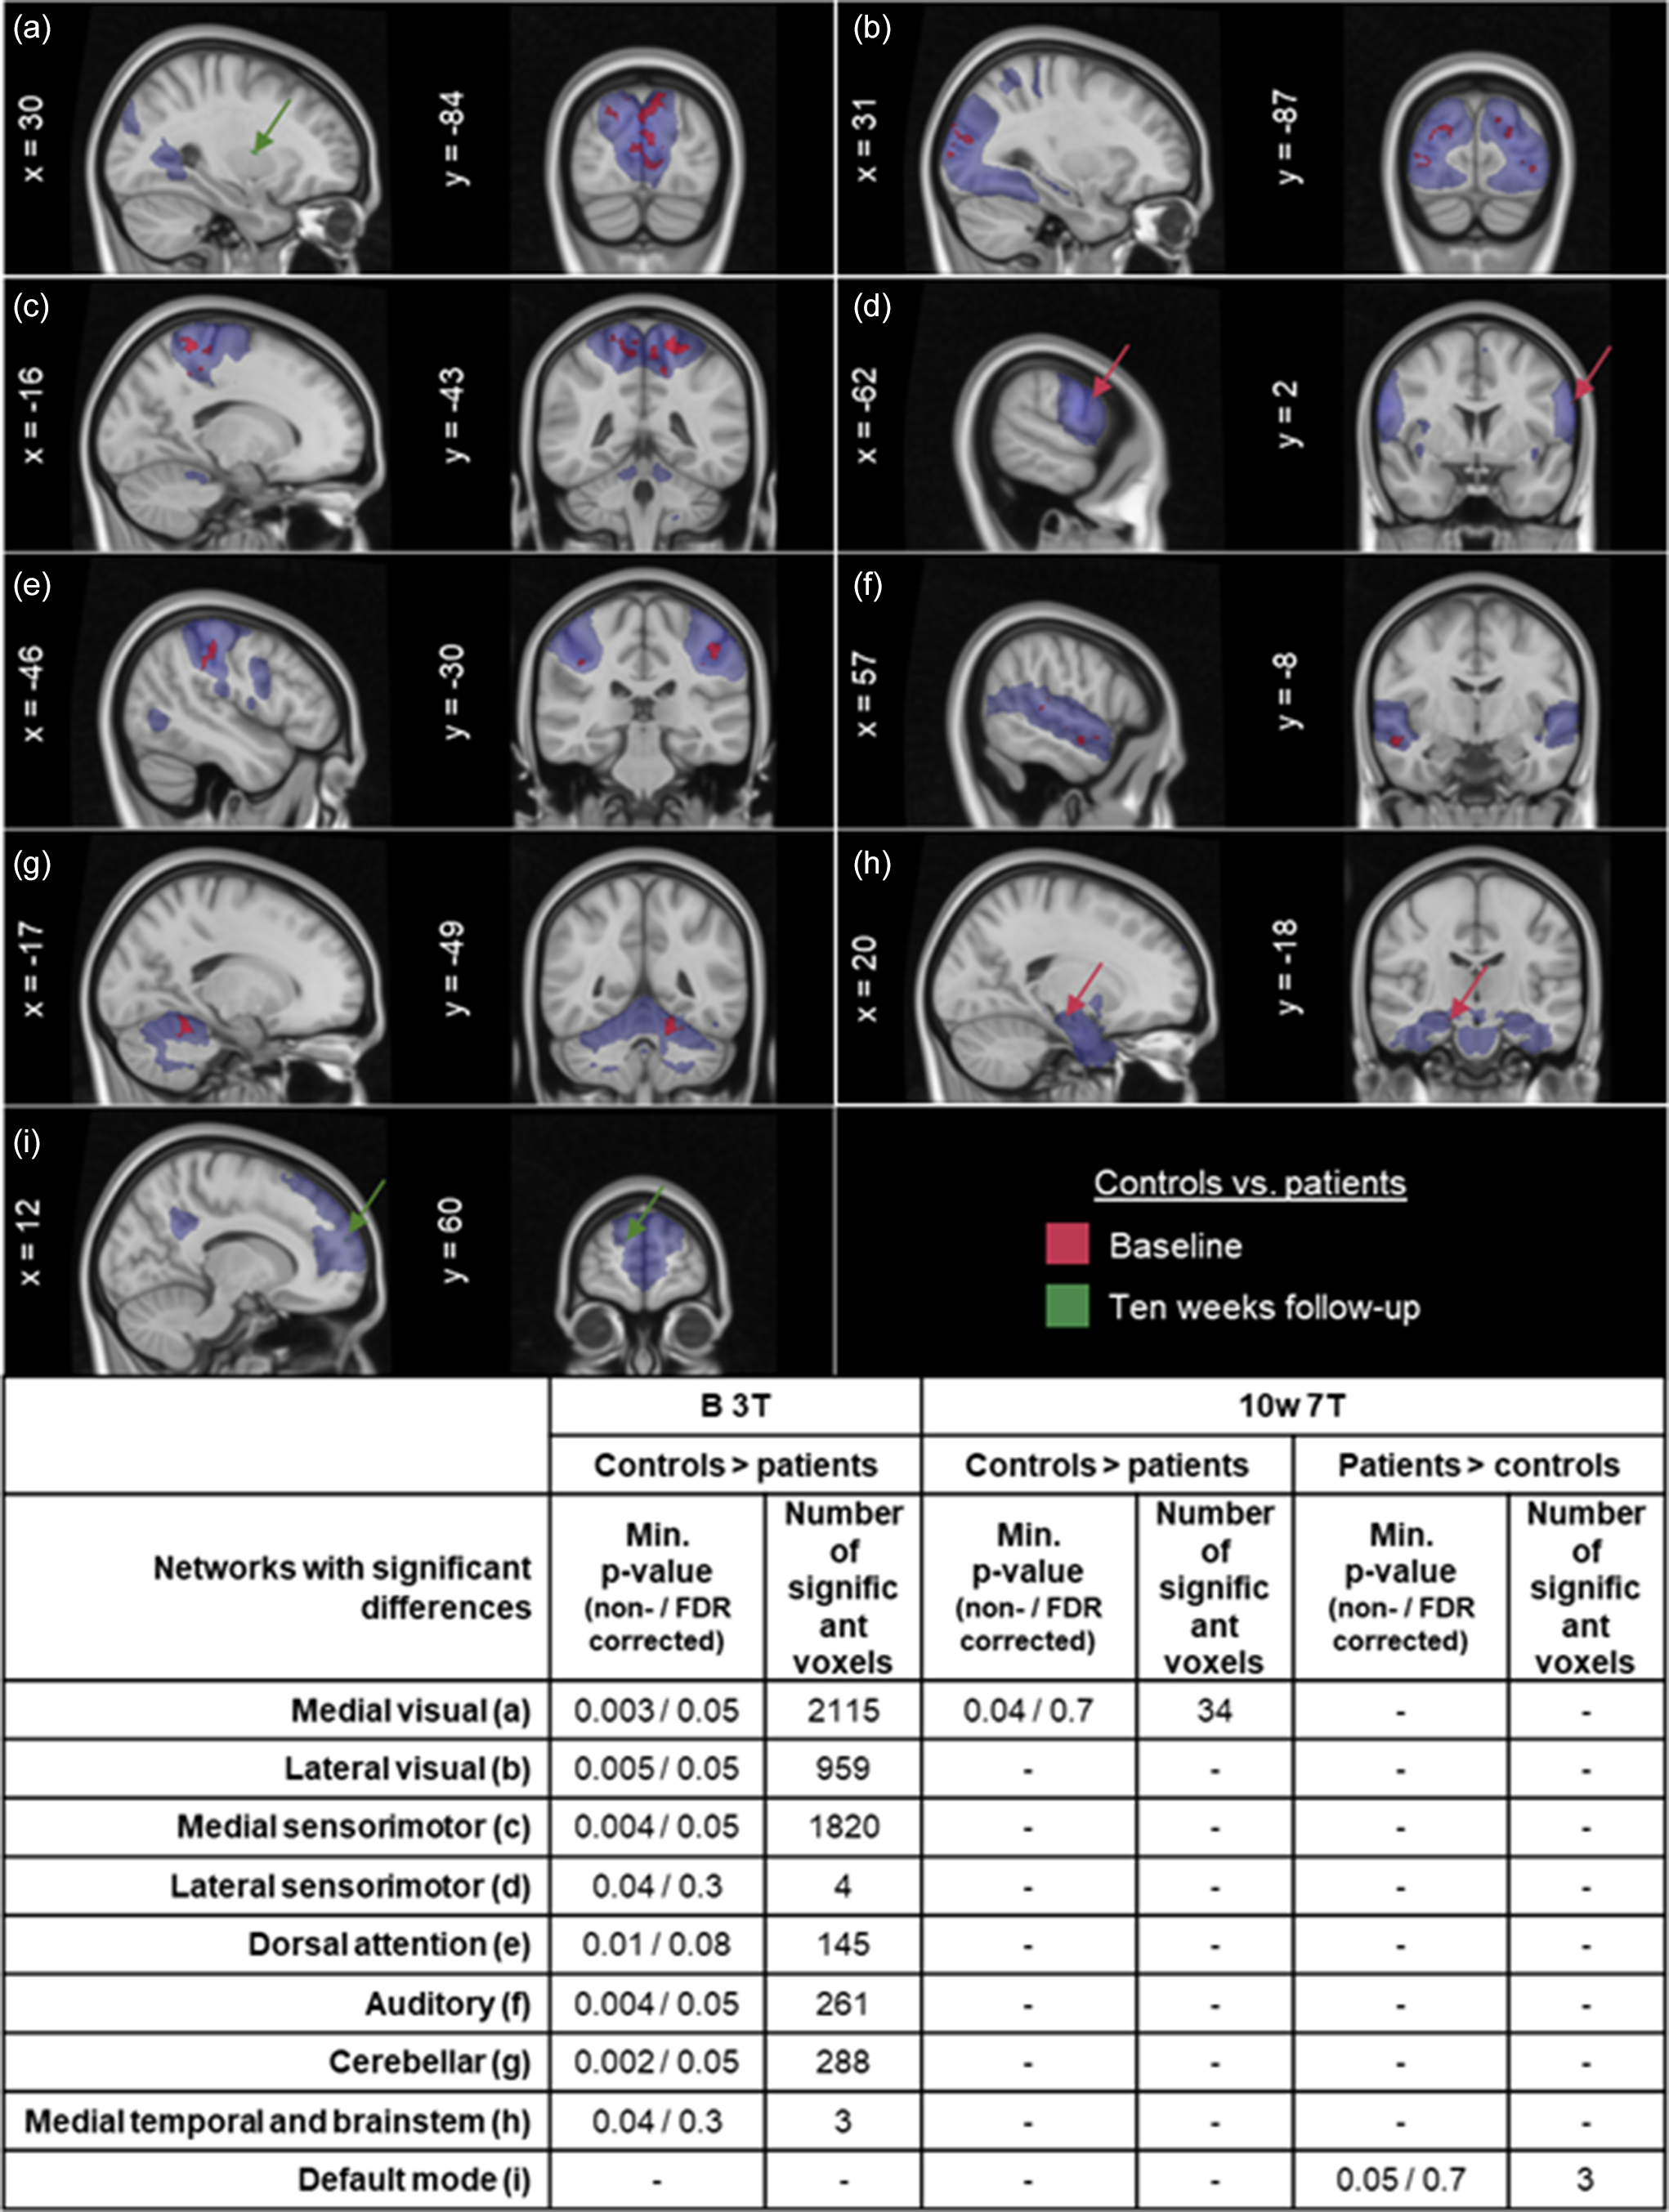
Eight networks showed before FDR correction statistically significant differences between the control group and the patient group at B 3T and two networks at 10w 7T (Figure 1) with p-values ranging from 0.002 to 0.04. After FDR correction, the five networks with the highest numbers of significant voxels (range 261–2115) at B 3T remain statistically significant (Figure 1), however with FDR corrected p-values of 0.05. These represent visual, sensorimotor, auditory, and cerebellar networks, and their mean network z-scores ranged between 5.4 and 9.8. FDR corrected data, network z-scores, cluster z-scores for 3T measurements are given in Supplement Table S3a, and for 10w 7T in Supplement Table S3b, respectively.
Functional connectivity differences related to paedophilic disorder. Minimum voxel p-value within clusters of significant differences before FDR correction (and FDR corrected p-values) and the number of significant voxels within clusters are reported. Letters a–i in the figure refer to the networks in the table. The spatial distribution of the components where differences were found are shown in blue for networks a–i. Differences found at B 3T are shown in red and differences found at 10w 7T are shown in green.

Functional connectivity differences related to degarelix treatment effect
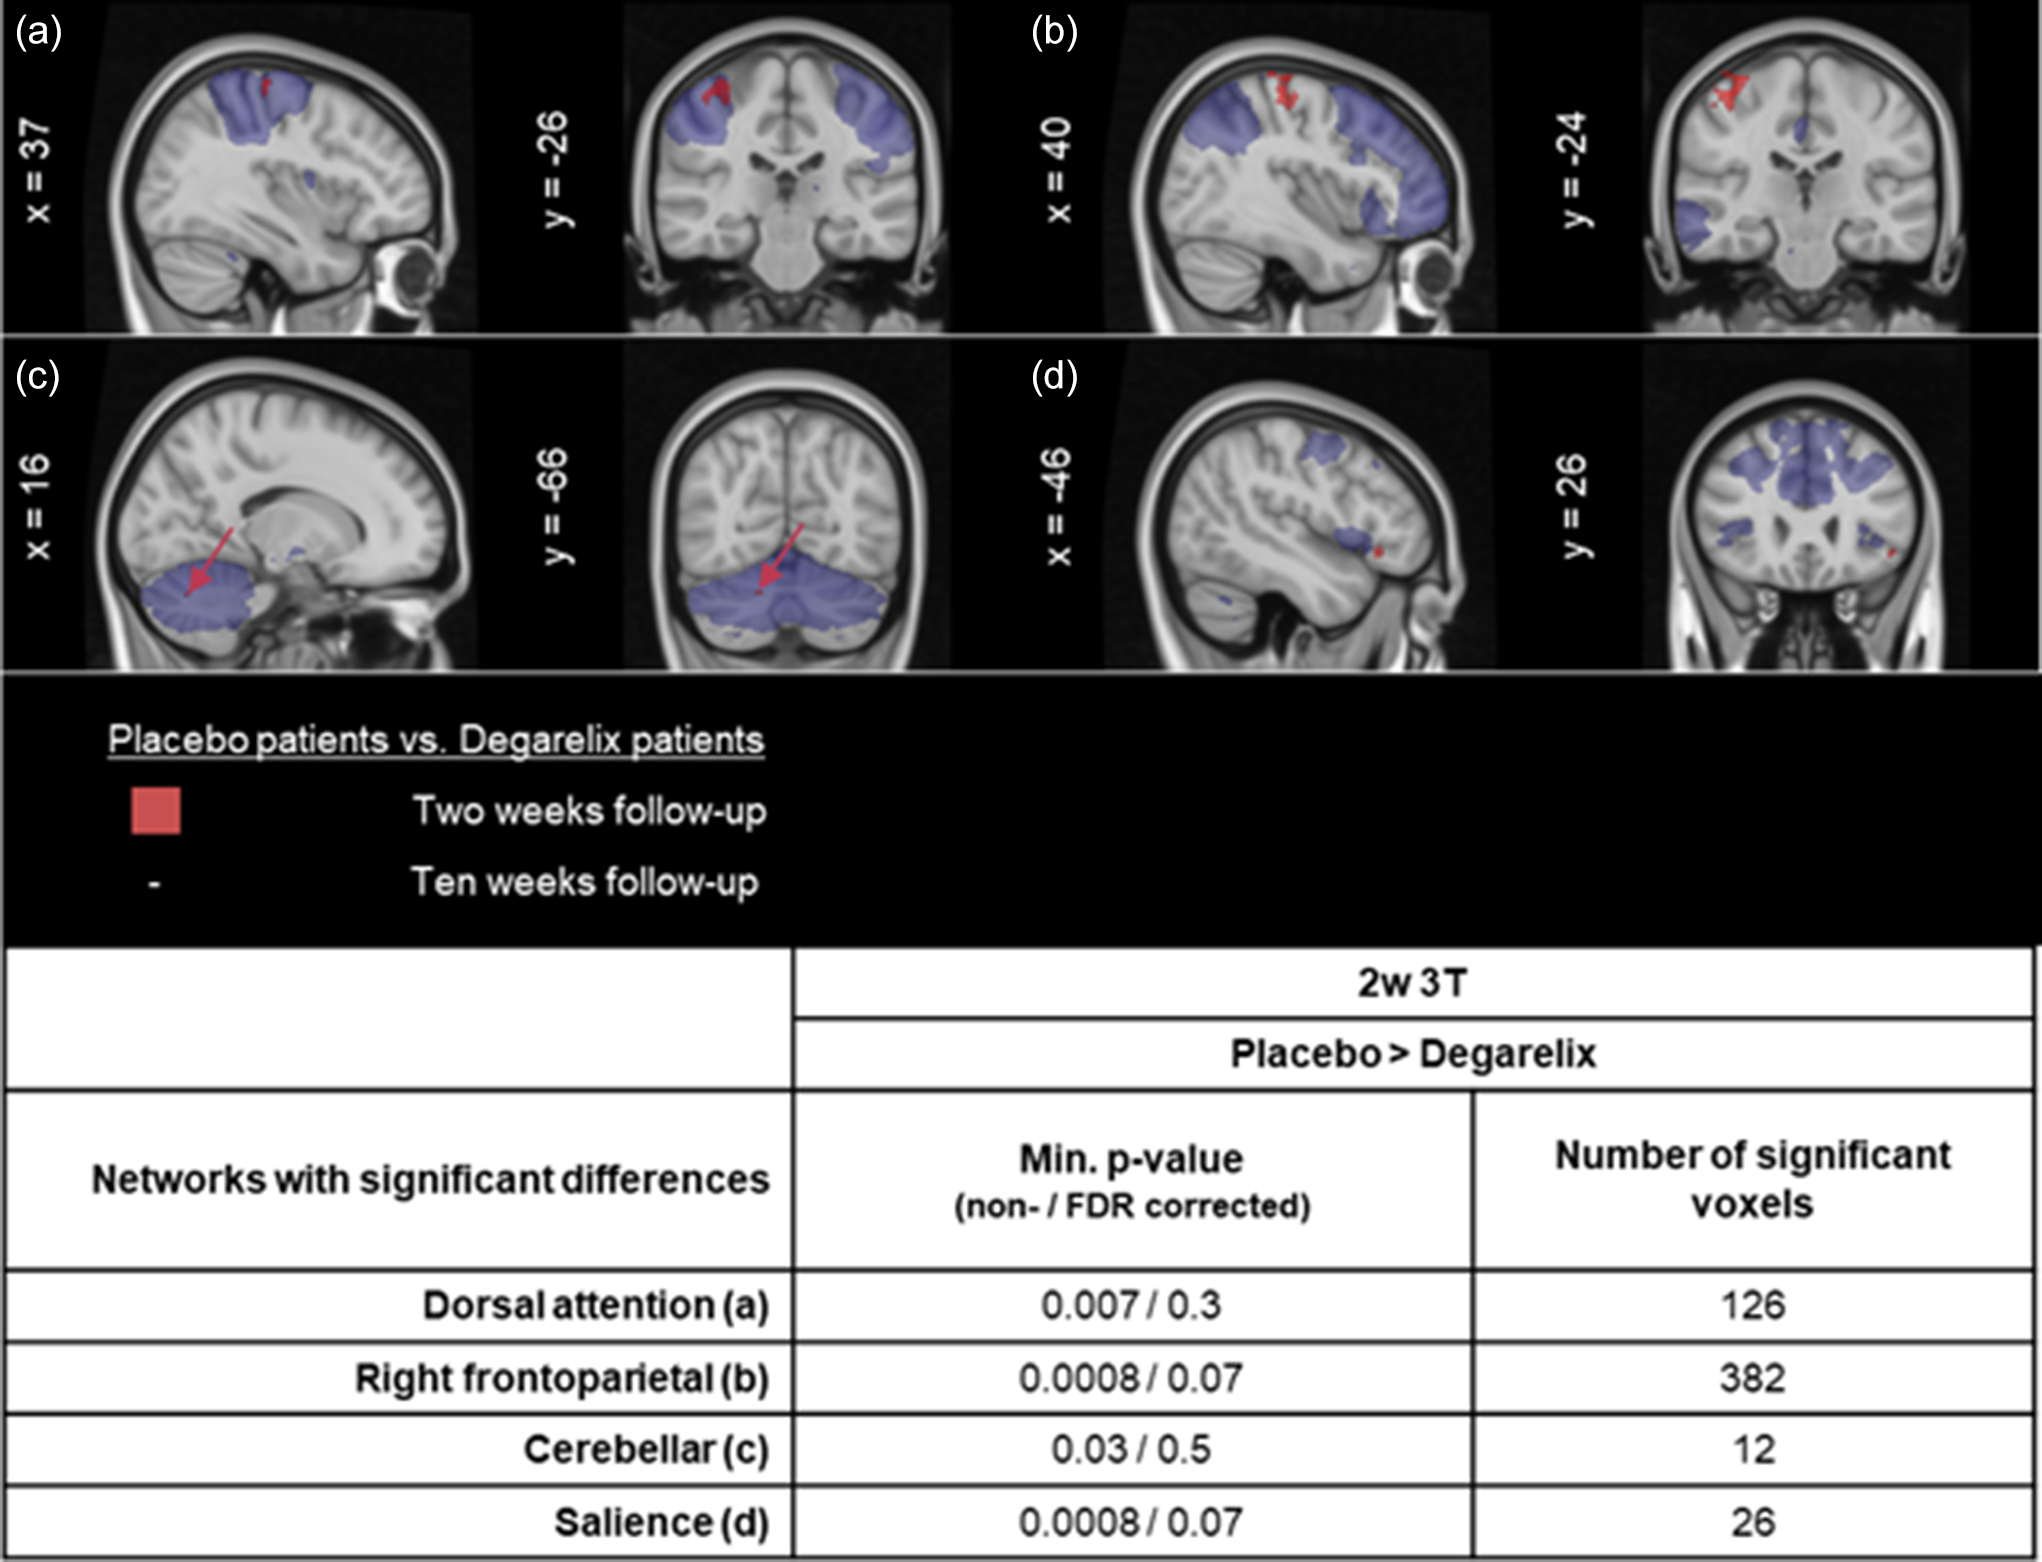
Four networks showed before FDR correction statistically significant differences between patients treated with placebo and patients treated with degarelix at 2w 3T (placebo > degarelix contrast) (Figure 2), p-values 0.0008 to 0.03, and number of significant voxels 12-382. After FDR correction, no networks remained statistically significant (Figure 2, Supplement Table S4). Further comparisons according to Table 1 were inconclusive – no differences were found when comparing the FC change from B 3T to 2w 3T between patients treated with placebo and patients treated with degarelix and no differences were found at 10w 3T between the degarelix group and placebo group. FDR corrected data, network z-scores, cluster z-scores are given in Supplement Table S4.
Functional connectivity differences related to degarelix treatment effect. Minimum voxel p-value within clusters of significant differences before FDR correction (and FDR corrected p-values) and the number of significant voxels within clusters are reported. Letters a–d in the figure refer to the networks in the table. The spatial distribution of the components where differences were found are shown in blue for networks a–d. Differences between degarelix and placebo groups were found at 2w 3T in the placebo > degarelix contrast and are shown in red.

Functional connectivity differences related to child sexual abuse (CSA) dynamic risk score
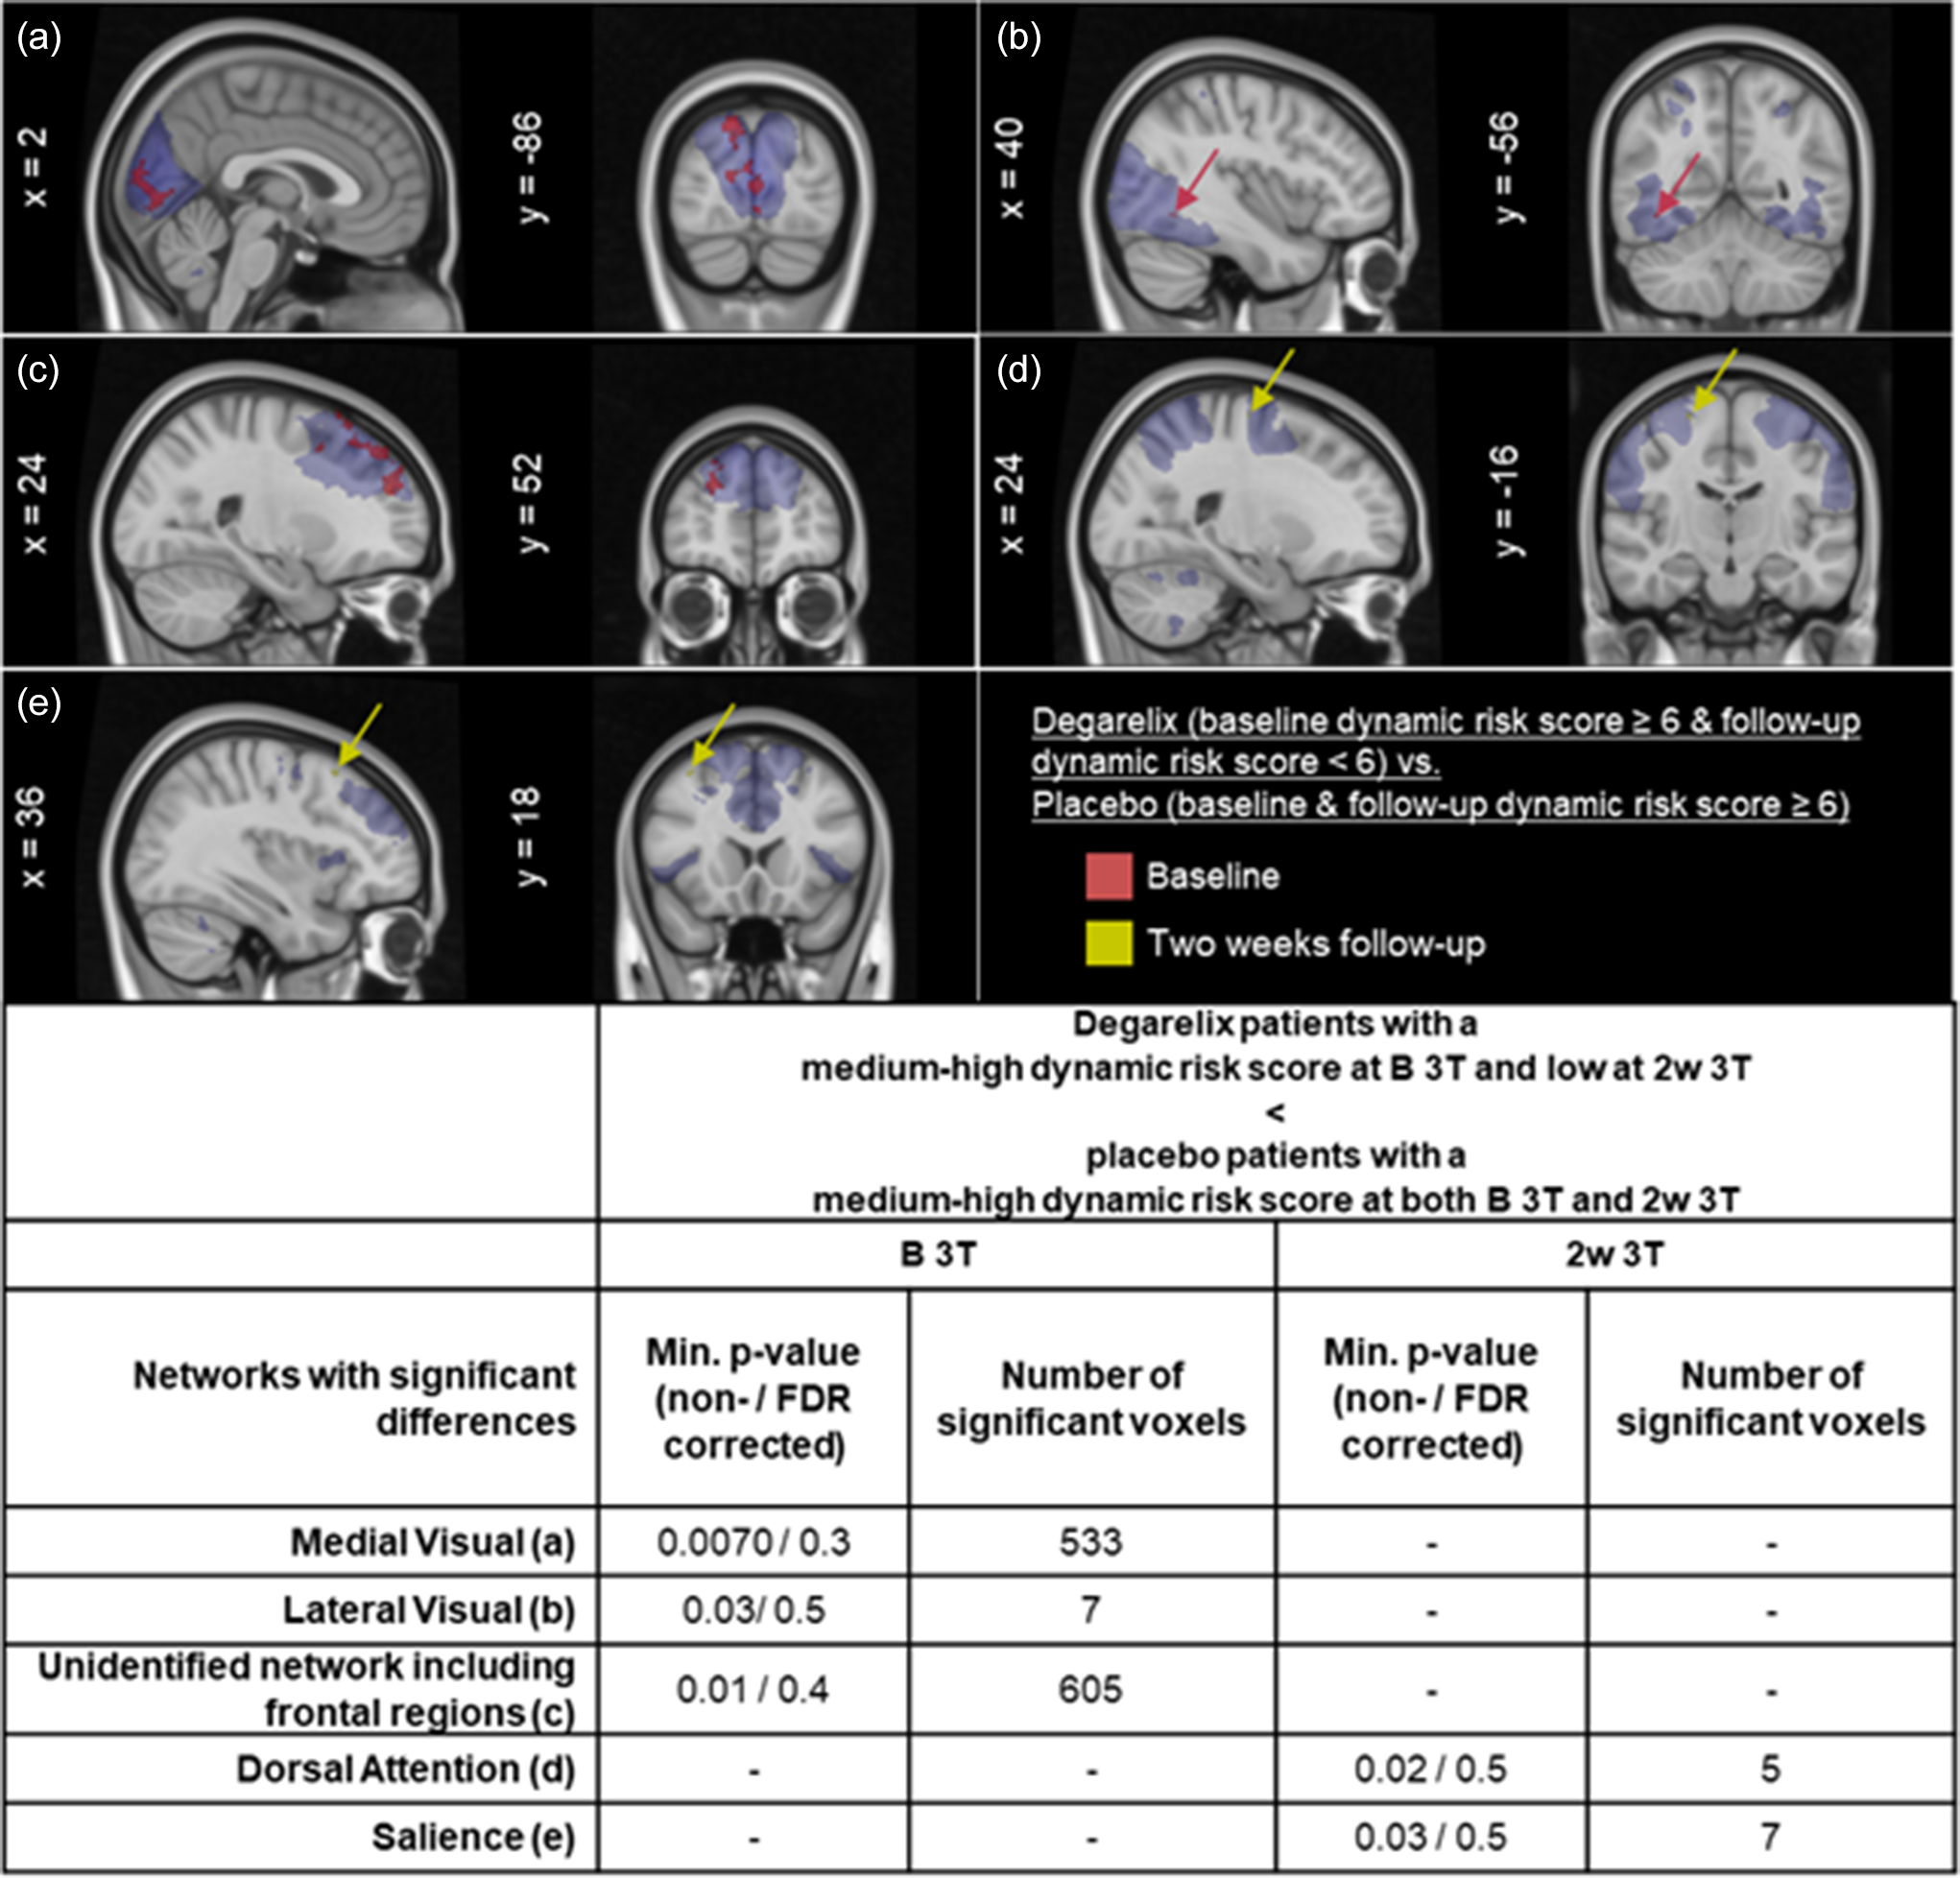
Statistically significant differences between the subgroups of patients with low score (<6) vs. medium–high score (≥6) CSA dynamic risk score were found before but not after FDR correction (Figure 3). Before FDR correction, FC differences (p-values 0.007 to 0.03) were found at B 3T and 2w 3T between the degarelix patients with a decrease in dynamic risk score from medium-high at B 3T to low at 2w 3T and the placebo patients with medium-high dynamic risk score at both B 3T and 2w 3T. However, after FDR correction, the identified networks showed p-values of 0.3 to 0.5. FDR corrected data, network z-scores, cluster z-scores are given in Supplement Table S5.
Functional connectivity differences found between subgroups of patients related to child sexual abuse (CSA) dynamic risk scores. Minimum voxel p-value found within clusters of significant differences before FDR correction (and FDR corrected p-values) and the number of significant voxels within clusters are reported. Letters a–e in the figure refer to the networks in the table. The spatial distribution of the components where differences were found are shown in blue for networks a–e. Differences at baseline are shown in red and differences at 2w 3T in yellow.

Additional hypothesis-generating comparisons
Uncorrected connectivity results for several group comparisons carried out for explorative purposes are given in Supplement Table S1 (comparisons related to PeD and degarelix treatment effect) and in Supplement Table S2 (comparisons related to CSA dynamic risk score, RAADS-14 score, HBI-19 score, paedophilic attraction, and sexual offence conviction). These comparisons were inconclusive after FDR correction.
Discussion
Results presented in this study are specific to a specialised, treatment-seeking subgroup of PeD patients and may not translate to high-risk, non-help-seeking, or forensic populations. At baseline, FC alterations were observed in PeD patients compared to controls. Any other FC alterations observed between patients and controls or potentially related to treatment, CSA dynamic risk scores, HBI-19 or RAADS-14 scores were not statistically significant after FDR correction.
FC alterations at B 3T in the PeD group compared to controls showed the largest cluster sizes in medial sensorimotor and visual networks. Baseline FC alterations between patients and controls could not be confirmed at later time points. This might be related to smaller sample sizes in the patient group at different time points (n = 46 at baseline and n = 33 at 10w), different MR field strengths used (3T and 7T), resulting in different scan parameters in addition to potential treatment effects, since 14 patients had undergone degarelix treatment at the 10w follow-up.
A previous study compared a cohort of offending individuals with PeD to a control group consisting of both individuals who had committed at least one non-sexual offence and non-offending individuals. This study reported alterations in relation to the default mode network and the frontoparietal network (Cantor et al., Reference Cantor, Lafaille, Hannah, Kucyi, Soh, Girard and Mikulis2016). We did not observe any FC differences related to these two networks at baseline in our study, but we did not separate PeD individuals with no history of CSA from PeD individuals with a history of CSA, when comparing the PeD group with controls. Furthermore, it is of interest that some of the clusters of differences found in their study anatomically overlap with clusters of differences found in our study. However, these were inconclusive as significant differences did not remain after FDR correction. From a hypothesis-generating point of view, however, visual and sensorimotor networks might be of further interest. The study by Kärgel et al. (Reference Kärgel, Massau, Weiß, Walter, Kruger and Schiffer2015), reported no FC differences between PeD individuals with no CSA history and healthy controls but they did find differences between PeD individuals with CSA history in comparison to both healthy controls and PeD individuals with no CSA history, suggesting relevance of CSA history. The differences they found were in a seed-based analysis using the posterior cingulate cortex, which is a part of the default mode network, and left and right amygdalae as seeds. We tested for differences between PeD individuals who reported at least one sexual offence conviction and PeD individuals who did not report any sexual offence convictions. However, these comparisons were of hypothesis-generating nature only and did not render conclusive results - sample size of individuals with a sexual offence conviction was small (n = 11), and participants may have committed sexual crimes without being convicted or omitting this information during the study self-report.
Studying the effect of degarelix treatment, we only observed FC differences between the degarelix and placebo group at 2w 3T, which however were not statistically significant after FDR correction and thus inconclusive. There were no similarities with the findings by Plata-Bello et al. (Reference Plata-Bello, Plata-Bello, Pérez-Martín, López-Curtis, Acosta-López, Modroño and Concepción-Massip2021) in their study on ADT treatment of patients with prostate cancer.
A lack of conclusive treatment effects on FC in PeD observed in this study does however not exclude such effects and unspecific effects from study participation and regression to the mean effects are potential explanations. As an example, 42% of the placebo patients experienced a subjective positive treatment effect on sexuality (Landgren et al., Reference Landgren, Malki, Bottai, Arver and Rahm2020). An explanation to why these differences were not detected when analysing the groups separately could be the smaller sample sizes.
Altered FC in Autism Spectrum Disorder (ASD) has been reported in numerous studies through the years, although consensus is lacking on which specific FC alterations are to be expected in an ASD cohort (Hull et al., Reference Hull, Dokovna, Jacokes, Torgerson, Irimia and Van Horn2017). We could not replicate previous findings, as group comparisons on PeD patients screening positive for ASD, i.e. with RAADS-14 score ≥ 14, and those screening negative did not render FC alterations between the groups. Our analyses were hampered by small sample sizes and have to be judged as inconclusive.
Although based on small sample sizes, FC alterations have previously been reported between left superior temporal gyrus and left precuneus and also between left superior temporal gyrus and right caudate in individuals with problematic hypersexual behaviour (Seok & Sohn, Reference Seok and Sohn2018), between left amygdala and bilateral prefrontal cortex in compulsive sexual behaviour (Schmidt et al., Reference Schmidt, Morris, Kvamme, Hall, Birchard and Voon2017) and between several regions in individuals with Compulsive Sexual Behaviour Disorder (Draps et al., Reference Draps, Adamus, Wierzba and Gola2022).
Again, our findings were inconclusive and did not render statistically significant FC alterations related to hypersexuality, which 65% of study participants screened positive for using the HBI-19 questionnaire.
A treatment effect could have been reflected in alterations of FC related to the level of dynamic risk score – medium-high dynamic risk score (≥6) vs. low dynamic risk score (<6) – but not related to paedophilic attraction, an analysis rendering inconclusive results as statistical significance did not remain after FDR correction.
Apart from the major limitation of small sample sizes for some group comparisons reported in this study, a further limitation is that participants could not be examined at both field strengths at the different time points as the two MR systems were located 600 km apart from each other. We included 7T long term follow-up examinations as we hoped to achieve superior detection of functional dynamics at 7T based on its increased signal-to-noise ratio (SNR), however, at 10 weeks we might also expect a potential decrease in treatment effects.
It is important to emphasise that our PeD sample is not representative of the PeD population in general, since our sample only included male participants that were seeking medical help for their disorder in addition to approximately only a third reporting convictions for sexual offences, and as such our results may be of questionable relevance for the larger PeD population, especially those at high risk of committing CSA, not seeking help for their condition, or with previous sexual convictions or crimes.
Conclusions
The current study found FC alterations in PeD patients compared to healthy controls at baseline. Findings did not coincide with those previously reported in the literature, but some anatomically overlapping cluster areas warrant further investigation. No consistent, treatment specific FC signature of degarelix was demonstrated.
Supplementary material
The supplementary material for this article can be found at https://doi.org/10.1017/neu.2026.10073.
Acknowledgements
We thank Maria Andersson, Kerstin Eriksson, Pia Jaensen, and Susanne Jarlvik Alm from Karolinska University Hospital and Boel Hansson and Karin Markenroth Bloch from Lund University for assistance with data collection, and Tomas Jonsson, Maria Kristoffersen-Wiberg, and Torkel Brismar for help with the trial organisation. We thank the staff at ANOVA and PrevenTell for participant recruitment.
Author contributions
All authors have substantially contributed to conceptualisation, data collection and/or interpretation of data, and manuscript preparation. LA contributed with data analysis. All authors approved the submission of this manuscript.
Funding statement
This study was funded by the Swedish Society for Medicine (SLS-501421and SLS-886481), the Swedish Society for Medical Research (P14-0136), the Söderström König Foundation; the Fredrik and Ingrid Thuring Foundation (FITS-2015-00157), the Center for Psychiatry Research, Department of Clinical Neuroscience, Karolinska Institutet (CPF-99/2016), grants from the Swedish state under the agreement between the Swedish government and the county councils, the ALF agreement (ALFGBG- 966177, IBB).
Competing interests
The authors declare none.
Ethical standards
This study was approved by the Swedish Central Ethical Review Board (Ö-26 2014) and the Swedish Medical Products Agency (approved May 19th 2014; EU Clinical Trials Register Identifier: 2014-000647-32). The authors assert that all procedures contributing to this work comply with the ethical standards of the relevant national and institutional committees on human experimentation and with the Helsinki Declaration of 1975, as revised in 2008.


 Open access