

Introduction
The domain of firm performance and success has presented several challenges for researchers over the years. Theories describing firm success formulate measures in terms of growth and profitability, while productivity is often depicted as a precursor of firm performance. Theoretical underpinnings further postulate independence of firm size and growth, and a negative relationship between size and profitability. Empirical evidence, as detailed in this paper, on the other hand suggests contradicting results, reinforcing the perspective of the resource-based view (RBV), in that firm performance is a consequence of availability of strategically valuable resources.
The idiosyncrasies presented by theory regarding the relationships of firm growth and profitability, and the variety of empirical evidence call for further investigation of this domain. It is important to gain better understanding how firm profitability and growth relate over time, as this provides small business managers direction on how to manage their firms towards growth, and also gives a benchmark to address the quality and sustainability of firm growth.
Davidsson, Steffens, and Fitzsimmons (Reference Davidsson and Wiklund2009) set out to examine the phenomenon of business success in terms of firm growth and profitability, through the perspective of RBV. It is asserted that profitability is a necessary, but not sufficient, requirement for firm growth, which in the broader context of RBV suggests that firm competitiveness is the result of firm capacity/capabilities, among a variety of factors. Furthermore, Laurenti and Viviani (Reference Laurenti and Viviani2011) investigating competitiveness at the firm level, emphasise that the concept of competitiveness is multidimensional and link competitiveness to various aspects of firm performance. Kivilouto (Reference Kivilouto2013) exploring the concept of firm performance, posited that it is in fact more than just sales growth over time and that firm successes marked by the simultaneous presence of growth and profitability resonating with conclusions by Davidsson, Steffens, and Fitzsimmons (Reference Davidsson and Wiklund2009) and Laurenti and Viviani (Reference Laurenti and Viviani2011).
Further to this, as postulated by the RBV, growth is a consequence of profitability. The relationship between growth and profitability of businesses is described in the profit–growth nexus (Cowling, Reference Cowling2004). The relationship between firm profitability and growth, as implied by the RBV, has also been extensively researched phenomenon (Barney, Reference Bagozzi1991, Reference Barney2001), and results suggest the necessity of re-investing the role of profitability in SMEs in achieving growth. Indeed, Davidsson, Steffens, and Fitzsimmons (Reference Davidsson and Wiklund2009) in their seminal work demonstrate that firm profitability is a precursor of firm growth. More specifically, they also show that growth and profitability together are achievable, if profitability is previously achieved by organisations. In other words, profitability comes before growth in firm success.
The profit–growth relationship – as described in the theoretical foundation of the profit–growth nexus – is influenced by a variety of population specific factors (Lee & Chu, Reference Lee and Chu2013). Out of these, firm size (measured by full time equivalent employee number) and growth intentions are widely acknowledged as factors influencing actual firm growth (Baum, Locke, & Smith, Reference Barney2001). Gibrat’s Law (Gibrat, Reference Gibrat1931) states that firm growth is independent of firm size. Empirical evidence for (Audretsch, Klomp, Santarelli, & Thurik, Reference Audretsch, Klomp, Santarelli and Thurik2004; Davidsson, Delmar, & Wiklund, Reference Davidsson, Steffens and Fitzsimmons2006; Reid, Reference Rossiter2007) and against (Baum, Locke, & Smith, Reference Barney2001; Szerb & Ulbert, Reference Tan and Smyrnios2006; Bentzen, Madsen, & Smith, Reference Baum, Locke and Smith2012; Daunfeldt & Elert, Reference Daunfeldt and Elert2013) Gibrat’s Law is available in literature dependent on the industry of the study, highlighting the importance of context specific factors. Firm size measured introduced were a combination of annual sales/turnover (Audretsch et al., Reference Audretsch, Klomp, Santarelli and Thurik2004; Bentzen, Madsen, & Smith, Reference Baum, Locke and Smith2012; Daunfeldt & Elert, Reference Daunfeldt and Elert2013), asset value (Reid, Reference Rossiter2007), and number of employees (Baum, Locke, & Smith, Reference Barney2001; Daunfeldt & Elert, Reference Daunfeldt and Elert2013; Davidsson, Delmar, & Wiklund, Reference Davidsson, Steffens and Fitzsimmons2006; Szerb & Ulbert, Reference Tan and Smyrnios2006). Thus, Gibrat’s Law and the profit–growth relationship imply a further question with regards to the relationship between firm size and profitability. RBV suggests a positive relationship between firm size and profitability, which is supported by several scholars (Lee, Reference Lee2009; Mukhopadhyay & AmirKhalkhali, Reference Mukhopadhyay and AmirKhalkhali2010; Pervan & Višic, Reference Pervan and Višic2012; Babalola, Reference Babalola2013) but also contradicted by others (Baum, Locke, & Smith, Reference Barney2001; Greve, Reference Greve2008). Firm size measures employed were a combination of asset value (Lee, Reference Lee2009; Pervan & Višic, Reference Pervan and Višic2012; Babalola, Reference Babalola2013), sales (Greve, Reference Greve2008; Mukhopadhyay, & AmirKhalkhali, Reference Mukhopadhyay and AmirKhalkhali2010; Babalola, Reference Babalola2013) and number of employees (Baum, Locke, & Smith, Reference Barney2001). When combining this finding with previous empirical evidence on the relationships between past profitability, current growth and profitability of successful firms, it can be concluded, that the relationship between past profitability and current size is similar to that of between current profitability and size.
The gap in the body of current knowledge is spanned between the well-established Gibrat’s Law from the domain of economics; the principle dynamics of the RBV in particular with regards to the conditions under which firm growth can happen; and more specifically the profit–growth nexus. The gap between what theory says about the profit–growth nexus, and what empirical investigations of the relationships between firm size, growth, and profitability found define the research problem in this paper. Previous studies found that profit is a necessary, but not sufficient requirement of firm growth. Thus, this paper tests this assumption in order to validate previous research findings of economics (Gibrat’s Law) and business (RBV) contextualising the firm growth phenomenon in the profit–growth nexus.
It has been highlighted, that context specific factors can have a strong impact on how the above described relationships are formulated. For the purposes of investigation, it has been determined that it is advantageous to choose a population from a particular country and industry, eliminating cross-industry variation. Audretsch et al. (Reference Audretsch, Klomp, Santarelli and Thurik2004) for instance investigate the services sector, Daunfeldt and Elert (Reference Daunfeldt and Elert2013) study innovative sectors, others explore manufacturing (Lee, Reference Lee2009) and non-manufacturing (Bhattacharyya & Saxena, 2009) sectors, deriving a variety of conclusions. Focusing on ICT firms promises in terms of being subject to research is its inherent dynamism, and the likelihood of providing a context in which the study can go beyond the mere statistical confirmation of Gibrat’s Law. By reducing the size range of the investigated firm population, variance related to firm size can be reduced and relationships can be kept within the linear domain (Hymer & Pashigian, Reference Hymer and Pashigian1962; Cabral, Reference Cabral1995; Hoffmann, Bertín, & Warleta, Reference Hoffmann, Bertín and Warleta2014). For example, Daunfeldt and Elert (Reference Daunfeldt and Elert2013) investigating Gibrat’s Law have identified differences on various firm populations. Their findings suggest that Gibrat’s Law is more likely to be rejected for SMEs, while it is more likely to be acceptable for larger firms. This is further supported by Lotti, Santarelli, and Vivarelli (Reference Lotti, Santarelli and Vivarelli2009), who also suggest that every firm population will display Gibrat’s Law in the long run. It is within this context that the authors of this paper set out to achieve three objectives. First, comprehensive testing of the relationships in the profit–growth nexus in the Australian context is nouvelle in the literature. The results of statistical testing contribute to the body of empirical literature, and in particular on Gibrat’s Law, and the growth–profitability relationship in the context of the Australian ICT sector, for SMEs. Second, the study will address a temporal dimension within the profit–growth nexus, namely by using past profitability to be tested against current growth. This will allow for testing the antecedence of profitability to growth, as suggested in literature, in a specific target population. Third, on the contrary to numerous empirical studies reliant on selected firm growth metrics, this research tests growth and profitability measures based on the perceptions of firm owners and managers.
In Australia the ABS defines an SME in terms of employee numbers (Trewin, Reference van Prooijen and van der Kloot2002). Firms with less than 200 employees are mentioned as small and medium sized (Trewin, 2005). This definition covers the employment-based measure of firm size, but does not provide guidelines of firm size thresholds in terms of assets and sales for medium sized firms. Eurostat (EC, 2008) defines SMEs both in terms of employment, sales and assets. Although the Eurostat definition of SMEs is slightly larger (less than 250 employees), it encompasses all three dimensions in which firms can be categorised, thereby allowing the classification of firms in terms of their size. Table 1 provides an overview of the size classification nomenclature and provides details of various size categories. These size categories are employed to build firm size measures as discussed in the methodology section.
Firm size classification nomenclatures
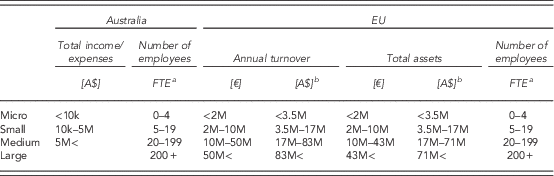
Notes.
a FTE=full time equivalent.
b Calculated using average exchange rates of the 2004–2008 time period.
In terms of the country selection, researchers are always constrained by possibilities and feasibility. Australia has proven to be a good country context for the purpose of this investigation for a variety of reasons. Firm growth studies in Australia have been previously focussing on the stages (McMahon, Reference McMahon1998; Reference McMahon2001) and process of growth (Snooks, Reference Storey1973; Mankelow, Reference Mankelow2007), the factors of growth (Wijewardena & Tibbits, Reference Wijewardena and Tibbits1999), growth strategies (Aharoni, Ho, & Zeng, Reference Aharoni, Ho and Zeng2012) growth and profitability (Fitzsimmons, Steffens, & Douglas, Reference Fitzsimmons, Steffens and Douglas2005; Davidsson, Steffens, & Fitzsimmons, Reference Davidsson and Wiklund2009), productivity growth (Wadud, Reference Wadud2007) and other aspects of growing firms, such as training and learning (Jones, Reference Jarvis, Mackenzie, Podsakoff, Mick and Bearden2012). The profit–growth nexus specifically has not been investigated thus far, opening up the avenue for this study. Our research specifically extends the body of knowledge on the profit–growth nexus building on the findings of Davidsson, Steffens, and Fitzsimmons (Reference Davidsson and Wiklund2009) and Fitzsimmons, Steffens, and Douglas (Reference Fitzsimmons, Steffens and Douglas2005), by controlling for firm size during the empirical testing.
In 2009, the year of the data collection, Australia and Australian organisations were only moderately impacted by the global economic downturn (Naudé, Dickie, & Butler, Reference Naudé, Dickie and Butler2012; Perlich, Reference Perlich2013), providing a disturbance free economic context to study the profit–growth nexus. This paper hence aims to show how owners and managers of ICT SMEs in Australia see the profit–growth trade-off, while controlling for firm size, considering the validity of Gibrat’s Law. Testing the profit–growth nexus using financial and other firm statistics acquired from various databases has its advantages and disadvantages. Advantages are the comprehensiveness of the data, and the rigour of sampling. And although this can provide more accurate information for analysis, there are also shortcomings of such data. Accessibility of financial information varies, and can be limited to specific firm populations, such as firms of particular size, legal form, ownership structure and registration details. Accuracy of recorded financial information is also often ambiguous, especially in small businesses, as their reported details can be subject to fluctuations both of personal and market-based nature, and biases due to tax effects.
The remainder of the paper is structured as follows. Section two of the paper provides a summary of literature pertaining to the profit–growth nexus, and in particular to the growth–profitability, size–growth, and size–profitability relationships. Measures are discussed and hypotheses are formulated in this section as well. In section three of the paper, the data collection and analysis are discussed. Finally, section four provides a discussion and summary of the results, identifying limitations of the research and providing suggestions for further areas of investigation.
Conceptual Background
The profit–growth nexus (Cowling, Reference Cowling2004) examines the relationships between firm size, growth and profitability. Besides the nature of the size–growth relationship (Gibrat’s Law), the profit–growth trade-off has also been highlighted during an extensive survey of prior research (Coad, Reference Coad2009). The RBV provides a theoretical background for conceptualising relationships firm profitability, growth and size. There is an important relationship between growth and profitability (Fitzsimmons, Steffens, & Douglas, Reference Fitzsimmons, Steffens and Douglas2005). The emergence of a dynamic models of small firms, and firm growth in particular (Levie & Lichtenstein, Reference Levie and Lichtenstein2010) implies the need to challenge previous assumptions and theories (Wiklund, Davidsson, Audretsch, & Karlsson, Reference Wiklund, Davidsson, Audretsch and Karlsson2011; Davidsson & Wiklund, Reference Davidsson, Delmar and Wiklund2013).
Cowling (Reference Cowling2004) finds that there is a trade-off between growth and short term profitability for firms. This trade-off is also highlighted by Davidsson, Delmar and Wiklund (Reference Davidsson, Steffens and Fitzsimmons2006). Coad (Reference Coad2009) emphasises, that growth is a consequence of productivity growth, which in turn is positively related to profitability. Others testing the relationship between growth and profitability of Australian SMEs, replicating the longitudinal study of Cowling (Reference Cowling2004) in the United Kingdom, find the relationship at best to be ambiguous, and dependent on other factors, such as size of the firm (Fitzsimmons, Steffens, & Douglas, Reference Fitzsimmons, Steffens and Douglas2005). Other findings reaffirm the positive relationship between past profitability and current firm growth (Davidsson, Steffens, & Fitzsimmons, Reference Davidsson and Wiklund2009). The analysis of Jang and Park (Reference Jang and Park2011) for SMEs in hospitality finds that there is a positive relationship between previous year’s profitability and current growth, but a negative relationship the other way around. This result is confirmed by Lee (Reference Lee2014) on Korean firm level panel data. Evidence from Welsh SMEs suggests that the profit–turnover ratio is dependent on a range of external and internal factors to the firm, and results imply a significant trade-off relation between profit and growth (Foreman-Peck, Makepeace, & Morgan, Reference Foreman-Peck, Makepeace and Morgan2006). Further findings show that firm growth pattern is dependent on industry, age and size, and that growth is not static in time (Delmar, Davidsson, & Gartner, Reference Delmar, Davidsson and Gartner2003; Davidsson, Steffens, & Fitzsimmons, Reference Davidsson and Wiklund2009). Other studies look at the firms’ growth from the managerial perspective, arguing that the firms’ performance is positively linked to its entrepreneurial orientation (Lee & Chu, Reference Lee and Chu2013); board size and level of involvement (Tien, Chen, & Chuang, Reference Trewin2013) and composition of the top-management team (Cabrera-Suarez & Martin-Santana, Reference Cabrera-Suarez and Martin-Santana2013). This provides further impetus to a context specific examination of the profit–growth nexus in Australia.
The temporal dimension of the profit–growth relationship needs further attention in terms of establishing the link between the two dimensions of firm performance. Davidsson, Steffens, and Fitzsimmons (Reference Davidsson and Wiklund2009) found that earlier profitability affects later growth. According to Markman and Gartner (Reference Markman and Gartner2002), growth is a precursor of profitability. MacMillan and Day (1987) also argue that growth leads to higher profitability, while Hoy, McDougall, and D’Souza (Reference Hoy, McDougall and D’Souza1992) suggest that the pursuit of growth will result in low profitability. Cowling (Reference Cowling2004) investigates the relationship between growth and profitability and finds little evidence of the growth–profit trade-off. There has been little consensus on this matter (Fitzsimmons, Steffens, & Douglas, Reference Fitzsimmons, Steffens and Douglas2005), suggesting that population and context-specific factors need to be considered to inform theory development and testing.
Gibrat’s Law of proportionate effect states that firm size is independent of firm growth (Gibrat, Reference Gibrat1931). Audretsch et al. (Reference Audretsch, Klomp, Santarelli and Thurik2004) conduct a review of extant literature to review empirical evidence for this theorem. They find that Gibrat’s Law has been supported only by two out of the approximately 60 studies reviewed, conducted on a mixture of manufacturing and service sector firms (including the ICT sector itself). For instance, Gibrat’s Law holds up for Dutch firms but does not for Italian ones, according to these studies. On the sample of 150 Scottish entrepreneurs, Reid (Reference Rossiter2007) finds Gibrat’s Law inaccurate, and Davidsson, Delmar, and Wiklund (Reference Davidsson, Steffens and Fitzsimmons2006) actually shows in a large scale study that smaller firms do grow faster. Others find significant positive (Szerb & Ulbert, Reference Tan and Smyrnios2006; Bentzen, Madsen, & Smith, Reference Baum, Locke and Smith2012) or negative (Daunfeldt & Elert, Reference Daunfeldt and Elert2013) relationships between firm growth and size. This variety of outcomes – particularly diverse in terms of the country specific contexts – draws the attention to the importance of re-examining Gibrat’s Law. It is expected, that the test results are context-dependant, and thus country specific testing will contribute to more significant and conclusive results.
The size–profitability relationship can be viewed as a derivative of the relationships between firm size and growth, and profitability and growth. If accepting the growth–profit trade-off, and Gibrat’s Law, the logical assumption is the independence of firm size and profitability. A negative relationship between size and growth is shown in the results of investigating non-manufacturing sectors (Bhattacharyya & Saxena, Reference Baumgartner and Steenkamp2009), while in several empirical studies, a positive size–profitability is demonstrated (Lee, Reference Lee2009; Mukhopadhyay & AmirKhalkhali, Reference Mukhopadhyay and AmirKhalkhali2010; Kouser et al., 2012; Pervan & Višić, Reference Pervan and Višic2012; Babalola, Reference Babalola2013). These empirical results contradict the supposed independence derived from the growth–profit trade-off assumption and Gibrat’s Law, emphasising the need for research in the profit–growth nexus.
Further to the above described imperative, and strongly building on the notion addressed by Davidsson, Steffens, and Fitzsimmons (Reference Davidsson and Wiklund2009), the temporal aspect of and conditions for creating possibilities for growth needs investigation. Especially for small firms, as growth has been in the focus of research interest (Korsgaard & Anderson, Reference Korsgaard and Anderson2011), an investigation of how practitioners see the necessity of profitability (as a proxy of productivity) as a condition of growth at their specific stage of development (firm size) is warranted.
Firm growth, size, profitability, and their measures
Research presented so far used a variety of ways of measuring firm growth. Firm growth is clearly a multidimensional phenomenon (Storey, Reference Szerb and Ulbert1982; Penrose, Reference Penrose1995; Davidsson, Delmar, & Wiklund, Reference Davidsson, Steffens and Fitzsimmons2006). Fitzsimmons, Steffens, and Douglas (Reference Fitzsimmons, Steffens and Douglas2005) describe firm growth measures based on Delmar, Davidsson, and Gartner (Reference Delmar, Davidsson and Gartner2003) with the intention to evaluate measures of firm performance. Markman and Gartner (Reference Markman and Gartner2002) review several articles, and find that relative growth measures create a bias favouring small firms, for example a small firm can rank higher in a relative increase of any measure compared with a larger counterpart with the same absolute increase.
Coviello and Jones (Reference Coviello and Jones2004) point out in their review that employee number and annual sales are the two most frequently used size measures for firms. Total assets have also been employed by researchers to measure firm size. Several authors operationalised firm size an indicator based on total assets (such as: Lee & Chu, Reference Lee and Chu2013), particularly when considering the change of firm assets as a measure of their growth (Davidsson & Wiklund, Reference Davidsson, Delmar and Wiklund2013). Drawing on research practice in the area, measures of firm size are built around the dimensions of employment, sales, and total asset value. Davidsson, Delmar, and Wiklund (Reference Davidsson, Steffens and Fitzsimmons2006) give account of theoretical development and empirical validation efforts of SME growth theories, repeatedly augmented by Davidsson and Wiklund (Reference Davidsson, Delmar and Wiklund2013), finding the issue of measuring absolute and relative change of firm size to be one of the key questions in firm growth measurement. Perception-based measures are also widely discussed in firm growth literature and used by researchers. For example: Merz, Weber, and Laetz (Reference Merz, Weber and Laetz1994) combine firm indicator-based measures with perception-based measures; Davidsson, Steffens, and Fitzsimmons (Reference Davidsson and Wiklund2009) solely rely on secondary indicators drawn from large national databases, Majumdar (Reference Majumdar2014) concludes that there is a substantial discrepancy between financial and other, soft growth indicators, which suggests that there can be room for perception-based measurement, in particular when factors that may distort financial indicator-based information are ample in the target population. Kaplan and Pathania (Reference Kaplan and Pathania2010) find, that perception-based measures are influenced by the broader economic environment, providing a strong argument for the use of soft measures in one specific context. Tan and Smyrnios (Reference Tien, Chen-Nan and Chuang-Min2011) demonstrate that Australian firms use a broad variety of growth and other performance measures. Accounting literature has provided example for using perceptions of stakeholders (auditors) to measure growth based on perceptions (Mckinley, Ponemon, & Schick, Reference McKinley, Ponemon and Schick1996). Alistair and Farid (Reference Alistair and Farid2014) highlight the gap between entrepreneurial praxis and growth studies in the context of small business research. Achtenhagen, Naldi and Melin (Reference Achtenhagen, Naldi and Melin2010) point out the lack of studies building on how practitioners actually perceive growth. It is with the intent to address the gap regarding measuring perceptions of practitioners in relation to firm growth, that growth measures are formulated in this research.
Based on this evaluation, a perception-based measure is adopted to assess firm growth, encompassing the three most commonly assessed dimensions of growth: the number of employees (measured in terms of full time equivalents); annual turnover; and the total value of assets (Davidsson, Delmar, & Wiklund, Reference Davidsson, Steffens and Fitzsimmons2006; Delmar, Reference Delmar2006). Total value of assets has been included among the measurable dimensions, as this dimension is also commonly part of quantifiable measures of firm size (EC, 2008).
The development of a measurement tool for firm growth is based on the summary of Davidsson, Delmar, and Wiklund (Reference Davidsson, Steffens and Fitzsimmons2006), and especially the review by Delmar (Reference Delmar2006), in terms of observing the dimensions of growth. Perceived levels of growth are assessed in order to measure the firm growth construct. The application of perception-based measures in this research firstly eliminates the bias inherent to the application issue of absolute versus relative growth measures. Second, by not asking for financially potentially sensitive information, respondents are less likely to abstain. These are particularly important, as the data is collected in the framework of a larger study, and self-selection bias is considered a substantial issue. The measures are designed based on previously developed and worded items, using a 5-point Likert scale. Questionnaire items are phrased to reflect ‘low’, ‘high’, ‘faster than competitors’ and ‘below potential’ growth and profitability scenarios, on order to construct valid and reliable multivariate measures for these constructs. Growth is measured as of the ‘last financial year’ of 2009 (the year of the data collection). While this measure is not very robust in terms of indicating the long-term growth performance of the firm, as far as perception-based measures go, this can be considered relatively free of retrospective bias.
Profitability measures are developed in the style of the previously applied measurement tools, also measured on a 5-point Likert scale. The proposed profitability scale includes positively worded and relative (to competition and to potential) items, to eliminate response biases and inconsistencies.
Firm size is measured along similar dimensions as firm growth. Alternative to organisational behavioural measures, firm size measures used in this study focus on the quantifiable measures of the firm: employee number, turnover and asset values, as categorised by the Australian Bureau of Statistics (Trewin, Reference van Prooijen and van der Kloot2002, 2005) and EuroStat (EC, 2008). Even though these measures are not perception based, the scaling and distribution is compatible with the other scales, hence are appropriate for inclusion in the model. Quantitative measures of firm size – as per last years’ annual report – have been collected using these categories.
As identified in the literature, a decision has been necessary regarding the temporal configuration of testing the growth–profitability relationship. Davidsson, Steffens, and Fitzsimmons (Reference Davidsson and Wiklund2009) find that past profitability is linked with current firm growth. Growth and profitability questions are designed to encompass a past time period as opposed to a single point in time. The cross-sectional research design holds the possibility of a retrospective bias, due to the collection of information from the past (Golden, Reference Golden1997). A 4-year time interval chosen for this purpose, as the review by Davidsson, Delmar, and Wiklund (Reference Davidsson, Steffens and Fitzsimmons2006) points out, has been commonly used in firm growth studies. Respondents are asked to evaluate the profitability of the firm they own or manage over the past 4-year time period. Table 2 displays the variables, on which data has been collected for the study.
Variables in the study

It is important to note, some redundant items have been included in the questionnaire in order to increase the robustness of the data collection process. The practice of scale development is a well described process (Rossiter, Reference Santarelli, Klomp and Thurik2002). Rattary and Jones (Reference Reid2007) suggest the use of exploratory factor analysis (EFA) to expose and eliminate redundant items from surveys. However, the redundant items can also be identified on the account of content or logical validity (McGartland Rubio & Kimberly, Reference McGartland Rubio2005). Brennan, Hayward, and Voros (Reference Brennan, Hayward and Voros2008) suggest controlling for such validity within the context of the investigation, as well as within the context of the scale itself. In order to established face validity, considerations can be made with regards to eliminating redundant items from the scale before actually analysing the data using EFA. To this effect, items EPP1 (Low profitability), TVAGO1 (Slow asset growth), ATGO1 (Slow turnover growth), and FTEGO1 (Slow employment growth) have been removed from further analysis, as these items are negatively worded versions of other, items, and are expected to correlate with them negatively.
Hypothesising the profit–growth nexus
The relationship between profit and growth is hypothesised in light of the research design informed by Davidsson, Steffens, and Fitzsimmons (Reference Davidsson and Wiklund2009). Studies examining the relationship between past profitability and current firm growth predominantly find positive relationships (Jang & Park, Reference Jang and Park2011; Lee, Reference Lee2014). Although Davidsson, Steffens, and Fitzsimmons (Reference Davidsson and Wiklund2009) demonstrate a significant relationship, in the Australian context Fitzsimmons, Steffens, and Douglas (Reference Fitzsimmons, Steffens and Douglas2005) find the growth–profitability relationship ambiguous. Markman and Gartner (Reference Markman and Gartner2002) find the opposite, namely that past growth is a precursor to current profitability, while Foreman-Peck, Makepeace, and Morgan (Reference Foreman-Peck, Makepeace and Morgan2006) show a negative relationship between growth and profits. In light of the variety of empirical evidence, it is expected, that the national context of the investigation can inform hypothesising the best. Based on Australian empirical evidence, the first hypothesis of the study is formulated as follows:
Hypothesis 1: There is a positive relationship between current firm growth and past profitability.
Gibrat’s Law – asserting the independence of firm size and growth – is also subjected to varied empirical results. Audretsch et al. (Reference Audretsch, Klomp, Santarelli and Thurik2004), Davidsson, Delmar, and Wiklund (Reference Davidsson, Steffens and Fitzsimmons2006) and Reid (Reference Rossiter2007) are in support of this theorem, while Szerb and Ulbert (Reference Tan and Smyrnios2006) and Bentzen, Madsen, and Smith (Reference Baum, Locke and Smith2012) find positive, on the other hand Daunfeldt and Elert (Reference Daunfeldt and Elert2013) show a negative relationship between firm size and growth. In light of the contradicting evidence regarding the applicability of Gibrat’s Law on SMEs, it is important to justify the hypothesis carefully. Gibrat’s Law is rejected for SMEs (Daunfeldt & Elert, Reference Daunfeldt and Elert2013), and particularly service sector firms (Daunfeldt, Elert, & Lang, Reference Daunfeldt, Elert and Lang2012), however, the direction of this rejection is also important. Following the results of Santarelli, Klomp, and Thurik (Reference Snooks2006) and also the findings of Reid (Reference Rossiter2007), Davidsson, Delmar, and Wiklund (Reference Davidsson, Steffens and Fitzsimmons2006) and many others, the smaller the firm, the more likely the higher the growth will be. This negative relationship between size and growth can also be considered a reasonable assumption when looking at the ICT sector, where small innovative firms often display fast growth. Corresponding to the narrative provided by examining SMEs, Gibrat’s Law is hypothesised to be rejected:
Hypothesis 2: There is a negative relationship between firm size and growth.
The third component of the profit–growth nexus – the relationship between firm size and profitability – has received less theoretical and empirical attention. Arguments can be made using the RBV, in that larger firms having more resources can become more productive and hence profitable, but dependent on the nature of the industry and the market environment, the opposite can also be argued for. However, assuming a positive relationship not only corresponds to the logic of RBV, but is also consistent with the other two relationships of the model. As articulated earlier, a growth–profitability trade-off relationship and Gibrat’s Law imply a size–profitability independence. Following the above hypothesised relationships – the growth–profitability connection and the size–growth trade-off – independence of size and profitability can be implied. This however is not reflected by empirical literature, providing ample evidence for a positive size–profitability relationship (Lee, Reference Lee2009; Mukhopadhyay & AmirKhalkhali, Reference Mukhopadhyay and AmirKhalkhali2010; Pervan & Višic, Reference Pervan and Višic2012; Babalola, Reference Babalola2013). This allows the establishment of the third hypothesis tested in this study:
Hypothesis 3: Firm size is positively related to profitability.
Figure 1 summarises the discussions on theory, and the conceptual model hypothesised. The hypotheses are tested using quantitative methods, employing a multivariate statistical analytical technique. Details of the data collection and analysis are discussed in the following section of the paper.
Theory based and hypothesised conceptualisation of the size–growth–profit triangle

The relationships presented in Figure 1 present a strong inconsistency between theory and the hypothesised relationships: all three of the hypothesised relationships cannot be supported. This provides further purpose to the research, in that empirical evidence for one of the three relationships needs to be contested.
Data Collection and Analysis
The research employs quantitative methodology. Relationships between constructs – namely growth, profitability and size – are tested using multivariate statistical methods. The data was collected in 2009, using on-line survey distribution. Owners and managers of ICT SMEs in Australia were invited to participate in a larger study. The survey also contained questions in relation to the above mentioned three constructs. The survey invited respondents to evaluate firm growth and profitability by expressing the degree of agreement on statements in relation to these constructs. A total of 141 responses were collected from a diverse cohort of firms from Australia wide. The data were controlled for outliers, normality, skewness and kurtosis, showing no departure from the requirements of multivariate statistical analysis. Missing data were insubstantial, missing values were imputed using regression-based imputation in SPSS version 21.
Data collection
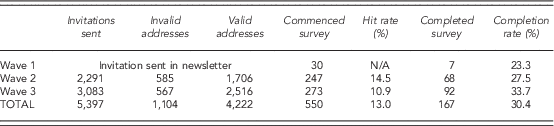
An on-line survey was distributed among Australian ICT SMEs. Data were collected in three distribution waves. Wave 1 distribution of the survey was conducted in newsletters of the Australian Computer Society and the Australian Information Industry Association. Wave 2 distribution of the survey was conducted by email targeted at ICT SMEs whose contacts were acquired through the Multimedia Victoria web-based registry and the AusTrade directory. Wave 3 distribution of the survey was targeted at a distribution list of ICT SMEs throughout Australia, compiled by an independent list broker company (IncNET). Overlapping entries between the Wave 2 and Wave 3 distribution list were eliminated to rule out duplication of responses.
The response figures and rates are displayed in Table 3. An overall response rate of 3.96% can be considered very low, but not unusual for the on-line survey distribution channel. Although there is no reason to assume a lower response rate for web based compared with paper-based surveys (Porter, Reference Porter2004), the response rate gap between the different kinds of survey administration channels can be quite substantial, and depends on the access for and comfort of the population in responding via a digital medium. The very low response rates shown in Table 3 need some explanation. An ~20% rate of bounced emails was experienced in both sets of addresses (in Wave 2 and Wave 3). Several addressees indicated that their business was not within the requested industry and these contacts were classified as invalid. The survey engine collected data on the actual hits on the survey link, providing an account of the number of times the survey was commenced, and also the number of instances the survey was completed. Overall, 13% of the recipients of the invitations opened the survey, and 30.4% of these completed the survey. The relatively low completion rate is due to the fact that the survey items providing data for this paper have been embedded in a longer survey, and substantial survey fatigue contributed to the lower completion rate. The 13% ‘hit’ rate is also low, and can be a consequence of the distribution method, and in particular either to the under-estimation of the extent of invalid addresses (not all bounces may have been noticed and recorded), or to the presence of generic email addresses on the contact list (such as ‘info@’), which may have ended up going unnoticed or ignored.
Australian response statistics
Descriptive analysis
Missing data has been assessed and remedied according to standard statistical practice. Cases containing excessive (over 50% per construct) missing data were removed from the analysis, as replacement of such quantity of missing information is not advised (Hair, Black, Babin, Anderson, & Tatham, Reference Hair, Black, Babin, Anderson and Tatham2006). Missing data were imputed using regression-based imputation method available in SPSS, and outliers were controlled using univariate and multivariate methods. No significant outliers were identified. The data set showed no significant departure from non-normality (based on Kruskall–Wallis and Kolmogorov–Smirnoff tests).
Measures of growth were developed on a perception basis, allowing respondents to reflect on the growth of their firms both compared with their potential, and their competitors. Firm profitability was also operationalised on a perception basis, but as a retrospective measure, to reflect the temporal aspect of the profit–growth relationship hypothesised. Firm size is measured on categorical variables in three dimensions (employment, assets and turnover). Table 4 details the respondent characteristics in terms of firm size, demonstrating that all respondents were within the required size category, with a full size range represented. Median size figures also demonstrate that firms in the industry are labour as opposed to asset intensive, and that their average value added per employee corresponds to the high productivity and recognition of professionals in the sector.
Firm size statistics
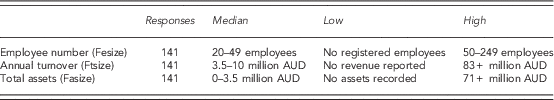
Table 5 contains the basic descriptive statistics concerning firm growth and profitability, measured on a scale of 1 (strongly disagree) to 5 (strongly agree). An even distribution of responses is also shown in Table 5, marked by means and medians being close to the mid-points of the scales and standard deviations relatively large compared with the means indicated, providing a approval for the basic assumptions of multivariate statistical analysis. While respondents are somewhat less optimistic about their firms’ profitability, they are predominantly more positive about their growth. The items pertaining to very fast growth are somewhat skewed, and suggest that respondents have mostly not thought of their businesses as very fast growth businesses. This suggests that these items potentially lack validity. Items addressing growth potential suggest that respondents have seen their businesses as lacking growth for the future.
Growth and profitability statistics

In all, 77.1% of the respondents represent proprietary companies, 12.1% public companies, while the remainders are almost evenly distributed among sole proprietors, subsidiaries and other for profit and not for profit organisations. On average, respondents have marked two components of the ICT sector their companies were pursuing activities in. The majority of respondents (23.5%) report activities in consultancy, the second biggest category is retail and wholesale with 14% of the respondents active in this domain. Information and data-related services (12.5%) and research and development (12.1%) have also been important activity areas for the responding firms. Further 21% of the respondents provide other ICT-related services or participate in other activities in the sector; 5.5% of the respondents are in the telecommunications sector, and another 5.5% in IT education. IT manufacturing only constitutes 5.9% of the sample. These proportions are not surprising for the Australian economy, and it is widely known that Australian organisations in the services sector outperform those in the manufacturing area due to a number of global economic circumstances.
Approximately 50% of the respondents indicate that their firms are ten years or younger (at the time of the data collection), only about 25% are older than 20 years and 5% over 30 years of age. In case of the high-tech ICT sector, it is not surprising, that the majority of the firms are relatively young, in fact it is interesting how many 20 years or older firms got selected in the sample. Nevertheless, it can be established, that firm age does not show substantial signs of misrepresentation.
Figure 2 displays the distribution of location of respondents Australia wide. A concentration of respondents in the state of Victoria and to a smaller extent New South Wales can be identified. Queensland and the Northern Territory are under-represented in the sample, while the remaining states are more or less equally represented to their share in the economic performance and firm population.
Location of respondents in Australia

Measurement model validation
The data analysis proceeded with factor analysis using SPSS and AMOS Version 23. EFA is used to establish the dimensionality of the data and confirmatory factor analysis (CFA) is employed to confirm validity of the scales. Concerns raised in literature about the application of CFA after EFA on the same data set (Hair et al. Reference Hair, Black, Babin, Anderson and Tatham2006) are noted. However, as suggested by Prooijen and van der Kloot (Reference Radder, Pietersen, Wang and Han2001), CFA can be used subsequent to CFA to seek additional confirmation or disconfirmation of the results in absence of other data, or when other data may be expected to draw substantially different results. Previous literature operationalising growth and profitability measures has not employed such perception-based scales, hence data were not available to control for their psychometric characteristics. Thus the application of EFA and CFA endeavours to some extent control for this lack of prior results. Several studies demonstrated successful application of CFA after EFA, providing evidence for the appropriateness of this procedure (see: Dickinson, Goldberg, Gold, Elvevag, & Weinberger, Reference Dickinson, Goldberg, Gold, Elvevag and Weinberger2011; Radder, Pietersen, Wang, & Han, Reference Rattary and Jones2010; Jordan et al., Reference Jordan, Buchbinder, Briggs, Elsworth, Busija, Batterham and Osborne2013). These studies provide examples of similar structural measurement evaluation design as the present study, in which subsequent application of EFA and CFA resulted in the confirmation of valid and reliable measures for further multivariate statistical analyses.
Table 6 displays the EFA (Principal Axis Factoring, Direct Oblimin rotation) involving all indicators of the proposed scales. The suitable number of factors was determined using the Eigen value criterion. Four factors accounted for 58.44% of the variance, with a middling level of sampling adequacy (KMO=0.761) and significant sphericity test (p<.000).
Pattern matrix

a Loadings below 0.4 suppressed.
Loadings below 0.4 were suppressed in Table 6. As indicated by Hair et al. (Reference Hair, Black, Babin, Anderson and Tatham2006), factor loadings below 0.4 do not imply practical significance, especially for samples below the size of 200 observations. ‘Profitability below potential’ (EPP3) is a negatively worded item, explaining its negative loading. Negatively worded items are generally recommended in scale development (Baumgartner & Steenkamp, Reference Bhattacharyya and Saxena2001), the loadings of negatively worded items often fall lower than that of positively worded ones (Hinkin, Reference Hinkin1995). This item is retained for further analysis, despite the lower loading. Cronbach’s α scores above 0.7 (Hair et al. Reference Hair, Black, Babin, Anderson and Tatham2006) suggest that the scales are reliable.
Three factors are clearly identified in the data. In order to validate the measurement models, CFA is employed. Figure 3 shows the results of the CFA for the measurement model including the two growth factors and profitability. A poor model fit has been achieved, showing strong cross-loadings within the ‘fast’ growth scale. Examination of standardised residual covariances and modification indices suggest, that model fit is possible to achieve by progressive elimination of FTEGO4, ATGO4 and TVAGO4 ‘very fast growth’ indicators. This however, changes the construct of ‘fast growth’, as its indicators are more specifically aligned with fast growth compared with competitors. The construct was renamed ‘comparative growth’ subsequently to the removal of the afore mentioned indicators.
Initial measurement model CFA assessment

Figure 4 shows the details of the CFA for the revised measurement model. Convergent validity is demonstrated by the fit indices, and in particular the non-significant Bollen-Stine bootstrap fit index. Reliability of the newly established ‘comparative growth’ scale remained satisfactory, as assured by the Cronbach’s α score of 0.846.
Revised measurement model CFA assessment

Discriminant validity of the scales is ascertained by the Fornell-Larcker criterion (Fornell & Larcker, Reference Fornell and Larcker1981). Table 7 demonstrates that correlations between the factor scores in the measurement model remain below the squared root of average variance extracted by the measures of each factor, confirming discriminant validity between the scales.
Discriminant validity evaluation

*n.s., ** Correlation is significant at the 0.01 level (2-tailed).
Measures of firm size were not subjected to psychometric testing as they were actual measures of the phenomenon, as opposed to perceived measures. Such formative indicators (Jarvis, Mackenzie, Podsakoff, Mick, & Bearden, Reference Jones2003) are not to be subject to factor analysis as a positive correlation may not necessarily be assumed (Bollen, Reference Bollen1984). In order to investigate how the size indicators relate to each other, bivariate Spearman correlations were calculated between the firm size categorisations in terms of employment, assets and sales turnover. This is to confirm if the indicators are related, and if so, to what extent (Bagozzi, Reference Bentzen, Madsen and Smith2011). Table 8 shows that there are significant and high correlations between the items of the scale, warranting the calculation of an aggregated firm size index.
Correlations between indices of firm size
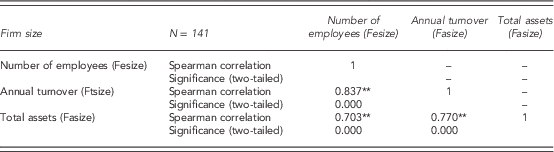
Note. **Correlation is significant at the 0.01 level (two-tailed).
After the confirmation of the measures, the assessment of correlations between the scales enables evaluation of the proposed hypotheses. Indices are calculated based on the straight average of indicator scores. An average of indicator scores is most appropriate when scale validation is not well progressed, and indicator loadings do not vary too much (Hair et al., Reference Hair, Black, Babin, Anderson and Tatham2006). In the case the formative size indicator, loadings are not available anyway. Significance, direction and strength of relationships between the constructs are used to reflect on the hypotheses formulated based on literature.
Testing relationships in the profit–growth nexus
Table 9 provides details of the Pearson’s correlation coefficients between the constructs in the model, and the significance of these correlations respectively. All correlations – except for the one between the growth factors – have been found to be significant, showing that a conclusive response can be given to all three hypotheses.
Correlations between the components of the profit–growth nexus
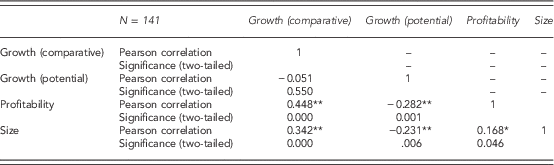
Notes. **Correlation is significant at the 0.01 level (two-tailed); *Correlation is significant at the 0.05 level (two-tailed).
Potential growth and growth compared to competitors’ growth are shown to be independent, as the correlation between these two scales is not significant. Both growth factors are significantly correlated with firm size, and to profitability. Firm size and profitability are also significantly correlated, although this correlation is less significant. These results demonstrate a positive relationship between firm growth and past profitability (Hypothesis 1-supported). Comparative growth has a significant and positive correlation to profitability, and potential growth – a reverse worded indicator – has a significant negative correlation to profitability. A positive relationship between firm size and growth is identified (Hypothesis 2-rejected). Comparative growth has a significant and positive correlation to firm size, and potential growth – a reverse worded indicator – has a significant negative correlation to firm size. Finally, a positive relationship between firm size and past profitability is supported by the data (Hypothesis 3-supported), although the significance of this correlation is not as high as of the others.
Results and Implications
The paper set out to address three matters of importance. The profit–growth nexus has been investigated for Australian SMEs in the ICT sector, disapproving of Gibrat’s Law, and contradicting prior empirical evidence on the firm size–growth relationship. Furthermore, evidence has been provided, that profitability is a significant precursor to firm growth. The use of perception-based growth measures has also been investigated, and the results have been consistent across two different aspects of perceived growth, demonstrating that perception-based measures of firm growth are – in this regard – robust against common method bias. This section details the outcome of hypothesis testing, and reflects on subsequent conceptual issues derived from the outcomes. Limitations of the research are used to identify future research avenues in light of the outcomes of this paper.
Model results in light of literature
Figure 5 summarises the results of hypothesis testing, using a sample of 141 responses, provided by owners and managers of SMEs in the ICT sector in Australia. When evaluating the results, it needs to be noted, that growth potential is a reversed scale, and so the correlations indicate opposite direction relationships to the other constructs. The support of Hypothesis 1 – a positive relationship between firm growth and past profitability – is aligned with extant literature demonstrating a positive relationship between past profit and current firm growth (Davidsson, Steffens, & Fitzsimmons, Reference Davidsson and Wiklund2009; Jang & Park, Reference Jang and Park2011; Lee, Reference Lee2014). Furthermore, it corresponds to the findings of Hall and Tochterman (Reference Hall and Tochterman2008) on Australian firms, empirically supporting that past profitability is related to current firm growth.
Hypothesis testing in the profit–growth nexus

The rejection of Hypothesis 2 – a positive relationship between size and growth – is a rejection of Gibrat’s Law and corresponds with extant literature (Daunfeldt, Elert, & Lang, Reference Daunfeldt, Elert and Lang2012; Daunfeldt & Elert, Reference Daunfeldt and Elert2013), but contradicts other previous findings (Baum, Locke, & Smith, Reference Barney2001; Santarelli, Klomp, & Thurik, Reference Snooks2006; Reid, Reference Rossiter2007). This ambiguity in terms of the relation of our results to prior literature and findings requires further attention, and is addressed in the discussion. The support of Hypothesis 3 – a positive relationship of past profitability and firm size – is reaffirming the results for the growth–profitability relationship, and conforms to previous empirical findings (Lee, Reference Lee2009; Mukhopadhyay & AmirKhalkhali, Reference Mukhopadhyay and AmirKhalkhali2010; Pervan & Višic, Reference Pervan and Višic2012; Babalola, Reference Babalola2013).
Discussion and implications
The implications of these results are both of conceptual and practical concern. This section is dedicated to both, by presenting a discussion of theoretical concerns followed by those of a practical nature. Within the context of Cowling’s (Reference Cowling2004) profit–growth nexus, a positive reinforcing cycle can be identified between firm growth, profitability and size, based on the results of this study. This reflects positively on the growth process discussed in RBV by Pettus (Reference Pettus2001), and combined with the assertion that past profitability and current growth are positively related, support the conclusions of Davidsson, Steffens, and Fitzsimmons (Reference Davidsson and Wiklund2009), namely that Australian ICT entrepreneurs indeed ‘put the horse in front of the cart’. Capacity to grow – as reflected by profitability – is a necessary condition of actual growth, and is converted to growth over time. Growth results in increased firm size, but based on findings of Hall and Tochterman (Reference Hall and Tochterman2008), increased firm size does not result in increased productivity. In fact, they suggest that there is empirical evidence for a trade-off between profitability and growth in a given time frame, and profitability is only positively related to future growth. So, what may seem to be a self-fuelling upward spiral is in fact capped by the question whether growth inspires development of further capabilities that result in enhanced profitability. However, there is yet hope for explaining periods of prolonged firm growth based on RBV. Pettus (Reference Pettus2001) finds that economy of scale precedes capability development, leading to innovation, which in turn fuels enhanced profitability turning into growth. The question hence, is whether economy of scale – as a phenomenon – is present among ICT SMEs. Due to the wide range of activities classified into the ICT sector – amalgamating high-tech manufacturing, service provision and R&D – this question may only be answered by more sub-sector specific studies.
However, the rejection of Gibrat’s Law – the independence of growth from firm size – and the finding of a positive relationship raises more questions than it answers. A negative such relationship is understandable in the sense that larger companies grow slower, and in a dynamic and technology-driven field, flexibility – a consequence of smaller size – can be a key factor of success. Unfortunately, the findings are counter-indicative of this argument. A positive relationship between past firm profitability and current growth (Hypothesis 1) implies certain causality between the two constructs, in that periods of high profitability are followed by periods of growth. This is reaffirmed by the positive relationship between past firm profitability and firm size, demonstrating that productivity – as earmarked by profitability – is a necessary condition to growth, according to owners and managers of Australian ICT SMEs.
Results of testing Hypothesis 2 demonstrate the positive relationship – within the sample – of firm growth and size, rejecting Gibrat’s Law. This is in line with RBV, and the findings of Szerb and Ulbert (Reference Tan and Smyrnios2006) and Bentzen, Madsen, and Smith (Reference Baum, Locke and Smith2012), but contradicts the findings of other studies modelling firm growth. Baum, Locke, and Smith (Reference Barney2001) exploring a complex and multidisciplinary model of firm growth finds size not to be significantly related to firm growth, and instead suggest a positive and significant relationship of firm growth with competencies, motivations and strategy. This outcome is reflected by Audretsch et al. (Reference Audretsch, Klomp, Santarelli and Thurik2004), Davidsson, Delmar, and Wiklund (Reference Davidsson, Steffens and Fitzsimmons2006) and Reid (Reference Rossiter2007) all basing their conceptualisations on the theory of the firm (Penrose, Reference Penrose1995). The Darwinian logic of the Penrose’s firm theory (providing a foundation to the dynamic capabilities view (DCV)) complements RBV in its approach (Galvin, Rice, & Liao, Reference Galvin, Rice and Liao2014). In terms of theory development, this creates a way to integrate complimentary theories of RBV and the DCV, in that empirical tests show that either one of the two theories is able to explain practical findings. In the case of ICT SMEs, RBV ‘has won’, suggesting that the assumptions of RBV are more valid – or important – for these businesses as opposed to the Darwinian DCV. This finding on the other hand contradicts that of Baum, Locke, and Smith (Reference Barney2001) using firm size as a control when testing a multidimensional model of firm growth, suggesting, that firm size – as an aggregate – can be disaggregated into specific factors, explaining further variance in firm growth.
The positive relationship between past profitability and firm size (as per the result of testing Hypothesis 3) corresponds with the work of Greve (Reference Greve2008), Lee (Reference Lee2009), Mukhopadhyay and AmirKhalkhali (Reference Mukhopadhyay and AmirKhalkhali2010), Pervan and Višic (Reference Pervan and Višic2012) and Babalola (Reference Babalola2013) and can be explained by RBV as a conceptual basis. More productive SMEs – having access to more capabilities – will grow and achieve thereby larger firm size. This also has some implications in terms of the pressure on small businesses to grow, and highlights a controversial situation, in that firms need to grow to become larger, but before they can do so, they need to become more profitable. This is consistent with the finding relating to Hypothesis 3.
Conceptually, these findings within the profit–growth nexus imply, that measuring one of these three aspects of performance is likely to sufficiently inform about firm performance. This is consistent with the assertions of Kivilouto (Reference Kivilouto2013), Davidsson, Steffens, and Fitzsimmons (Reference Davidsson and Wiklund2009) and Laurenti and Viviani (Reference Laurenti and Viviani2011) in that growth and profitability are simultaneously present in successful firms, but questions whether all three dimensions (size, profitability and growth) are necessary to identify high performing firms, and measuring their performance.
It has also been demonstrated, that potential growth is similar – in terms of results – as growth measured in comparison to the competitors. In case the growth perception of owners and managers accurately represents the actual growth of their businesses, it can be concluded, that actual growth and potential growth measure firm growth to the same effect, and are thus interchangeable for the purposes of researching perspectives and opinions on growth.
Limitations and future research
Limitations of this study are in two areas. Firstly, the size, representativeness and composition of the sample need to be addressed, which in its current state does not warrant representativeness by design. As a consequence, the results of the analysis are representative of the sample, but not necessarily for the total population of Australian ICT SMEs. Data from the Business Longitudinal Survey of the Australian Bureau of Statistics, as used by McMahon (Reference McMahon1998; Reference McMahon2001) and Davidsson, Steffens, and Fitzsimmons (Reference Davidsson and Wiklund2009) can be used to build a comprehensive data panel, which can be used for the purpose of testing the profit–growth nexus.
Due to the lack of longitudinal data, causality between the factors could not be comprehensively tested. The nature of the data collection is cross-sectional, and thus contains retrospective bias. Either the use of the Business Longitudinal Survey from the Australian Bureau of Statistics eliminates this issue by providing comparable, longitudinal business information (although the latest data is only from 2011), or development of a regular and periodical, large scale distribution of a ‘business barometer’ style poll can provide basis to a data set, although confidentiality of responses and ensuring linking responses between circulations of the survey will be a challenge.
Moving forward from the platform of the profit–growth nexus for ICT SMEs in Australia, initially established in this paper, and proposed for representative testing, based on the findings of McMahon (Reference McMahon1998; Reference McMahon2001), and building on the model of dynamic stages by Levie and Lichtenstein (Reference Levie and Lichtenstein2010), a specifically market and institutional context tailored SME growth model can be devised, that reflects on both achievable growth rates of these firms, and also could be used to project ‘graduation’ of these businesses from the SME size category. After all, it would be very interesting to know ‘where SMEs go’ once they are not SMEs any more.
More specifically in terms of the identification of a the appropriate theoretical background for understanding SME growth in the profit–growth nexus, RBV (Barney, Reference Bagozzi1991; Reference Barney2001), DCV (Galvin, Rice, & Liao, Reference Galvin, Rice and Liao2014) or other perspectives such as the life cycle theory or a dynamic stages model (Levie & Lichtenstein, Reference Levie and Lichtenstein2010) need to be cross-referenced and potentially considered in terms of what premise of these theories match the conditions of the investigated firms. A broader understanding of under what conditions are the respective theories capable of explaining the findings of the profit–growth nexus can highlight how to effectively integrate appropriate components of the theories to achieve a holistic firm growth model, such as attempted by Baum, Locke, and Smith (Reference Barney2001), Davidsson, Delmar, and Wiklund (Reference Davidsson, Steffens and Fitzsimmons2006), Wiklund et al. (Reference Wiklund, Davidsson, Audretsch and Karlsson2011), Davidsson and Wiklund (Reference Davidsson, Delmar and Wiklund2013) and many others.
Acknowledgement
The authors wish to acknowledge the support of Professor Christopher Selvarajah and Dr Siva Muthaly in supervising the PhD project in whose framework the data for this publication was collected. The authors also wish to thank the editors and reviewers of JMO, and in particular Professor Peter Galvin for supporting the authors in theirwork, revising the manuscript.


