Many studies examining stability and change in personality have been conducted over the past 20 years. Two types of stability and change at the population level, mean-level change, and rank-order stability have been examined in those studies (for meta-analytic reviews, see Roberts & DelVecchio, Reference Roberts and DelVecchio2000; Roberts et al., Reference Roberts, Walton and Viechtbauer2006).
To date, both longitudinal and cross-sectional studies have reported mean-level personality changes in the Big Five, which measures human personality in five domains—Extraversion, Agreeableness, Conscientiousness, Neuroticism, and Openness to Experiences—and is widely used (John et al., Reference John, Naumann, Soto, John, Robins and Pervin2008) across the life span. Taking particular note of mean-level personality change across adolescence, the findings of previous studies were inconsistent. The meta-analytic results by Roberts et al. (Reference Roberts, Walton and Viechtbauer2006) indicated significant increases in social dominance, one of the facets of Extraversion, and emotional stability, the opposite pole to Neuroticism, across adolescence. Two studies also showed increases in Extraversion (Canals et al., Reference Canals, Vigil-Colet, Chico and Martí-Henneberg2005; Pullmann et al., Reference Pullmann, Raudsepp and Allik2006); in contrast, other studies have failed to observe a significant change in Extraversion (Allik et al., Reference Allik, Laidra, Realo and Pullmann2004; De Fruyt et al., Reference De Fruyt, Bartels, Van Leeuwen, De Clercq, Decuyper and Mervielde2006; Klimstra et al., Reference Klimstra, Hale, Raaijmakers, Branje and Meeus2009; McCrae et al., Reference McCrae, Costa, Terracciano, Parker, Mills, De Fruyt and Mervielde2002), or conversely, have found its decline (Branje et al., Reference Branje, Lieshout and Gerris2007; Lamb et al., Reference Lamb, Chuang, Wessels, Broberg and Hwang2002; Soto et al., Reference Soto, John, Gosling and Potter2011; Van den Akker et al., Reference Van den Akker, Deković, Asscher and Prinzie2014). In respect of Neuroticism, De Fruyt et al. (Reference De Fruyt, Bartels, Van Leeuwen, De Clercq, Decuyper and Mervielde2006), Klimstra et al. (Reference Klimstra, Hale, Raaijmakers, Branje and Meeus2009), and the meta-analysis results by Roberts et al. (Reference Roberts, Walton and Viechtbauer2006) indicated declines in Neuroticism (i.e., increases in emotional stability). Alternatively, some previous studies have failed to observe a significant change in Neuroticism (Allik et al., Reference Allik, Laidra, Realo and Pullmann2004; Branje et al., Reference Branje, Lieshout and Gerris2007; Lamb et al., Reference Lamb, Chuang, Wessels, Broberg and Hwang2002; Pullman et al., Reference Pullmann, Raudsepp and Allik2006), or found an increase, especially in female adolescents (Canals et al., Reference Canals, Vigil-Colet, Chico and Martí-Henneberg2005; McCrae et al., Reference McCrae, Costa, Terracciano, Parker, Mills, De Fruyt and Mervielde2002; Soto et al., Reference Soto, John, Gosling and Potter2011; Van den Akker et al., Reference Van den Akker, Deković, Asscher and Prinzie2014).
The literature shows that there is change and stability in Extraversion and Neuroticism; however, these findings are inconsistent. Moreover, the results were all drawn from Western adolescent samples, which suggest some degree of bias. To offer new insight into research regarding personality development, we need data from non-Western countries.
Further, the preceding studies explain only the description of the phenomenon and do not provide information about the causal relationship, namely, which factors contribute to the stability or change of personality during specific periods of the lifespan. Behavioral genetic studies on longitudinal data offer ways to reveal the genetic and environmental factors contributing to stability and change in personality (Johnson, Reference Johnson, Neyer and Spinath2008). It is considered a firm fact that heritability estimates for broad personality traits, like the Big Five, fall about approximately 0.50. Although the remaining variance is derived from non-shared environmental influences, which make twins within the same family more different from each other, shared environmental influences, which make twins within the same family more similar to each other, seem to play only a limited role (for reviews, see Johnson et al., Reference Johnson, Vernon, Feiler and Boyle2008; Turkheimer et al., Reference Turkheimer, Pettersson and Horn2014).
Several longitudinal behavioral genetic studies on personality development have recently been conducted. These studies focused on three issues: change and stability in heritability and environmentality during the measurement interval, change and stability in genetic and environmental influences on personality over time, and the extent of genetic and environmental influences on change and stability in personality (Bleidorn et al., Reference Bleidorn, Kandler and Caspi2014). As for the first issue, although some studies focusing on young adulthood showed heritability and environmentality are stable during the interval (Blonigen et al., Reference Blonigen, Carlson, Hicks, Krueger and Iacono2008; Bratko & Butkovic, Reference Bratko and Butkovic2007; Hopwood et al., Reference Hopwood, Donnellan, Bloningen, Krueger, McGue, Iacono and Burt2011), other empirical studies (Kandler et al., Reference Kandler, Bleidorn, Riemann, Spinath, Thiel and Angleitner2010; Reference Kandler, Riemann and Angleitner2013; McGue et al., Reference McGue, Bacon and Lykken1993) and a meta-analytic review (Kandler, Reference Kandler2012) indicated that heritability of specific personality traits decreases during the whole of adulthood. Based on the latter, Bleidorn et al. (Reference Bleidorn, Kandler and Caspi2014) argued that genetic factors seem to be most important in early adulthood and tend to decrease during middle and older adulthood.
With respect to the second issue, previous studies have examined these factors by two indexes: genetic correlation (r g) and environmental correlation (r e). Genetic or environmental correlation, representing the rank-order stability of genetic or environmental factors over two measurement points, means the degree to which individual differences in genetic or environmental factors remain stable over time. Therefore, when a genetic or environmental correlation coefficient is equal to one, genetic or environmental factors contributing to individual differences in personality endure across measurement points; when a genetic or environmental correlation coefficient is equal to zero, there is no overlap in them across the two time points. Previous studies investigating the genetic and environmental correlation with longitudinal adult twin samples showed that genetic rank-order stability is relatively high and environmental rank-order stability is lower (Blonigen et al., Reference Blonigen, Carlson, Hicks, Krueger and Iacono2008; Bratko & Butkovic, Reference Bratko and Butkovic2007; Hopwood et al., Reference Hopwood, Donnellan, Bloningen, Krueger, McGue, Iacono and Burt2011; Johnson et al., Reference Johnson, McGue and Krueger2005; Kandler et al., Reference Kandler, Bleidorn, Riemann, Spinath, Thiel and Angleitner2010; Kandler, Reference Kandler, Riemann and Angleitner2013; McGue et al., Reference McGue, Bacon and Lykken1993; Viken et al., Reference Viken, Rose, Kaprio and Koskenvuo1994). These studies have established strong evidence for a highly stable genetic foundation of individual differences in broad personality traits in adulthood.
In terms of the third issue, longitudinal twin studies have investigated the extent to which genetic and environmental factors influence change and stability in personality. There are several studies that particularly examined the genetic and environmental foundations of stability in personality traits, and that demonstrated the stability of personality in adulthood is due mainly to a firm genetic underpinning and partly to the stability of environmental influences (Bratko & Butkovic, Reference Bratko and Butkovic2007; Johnson et al., Reference Johnson, McGue and Krueger2005; McGue et al., Reference McGue, Bacon and Lykken1993). Additionally, more recent longitudinal twin studies have investigated the genetic and environmental contributions to personality change. For example, Hopwood et al. (Reference Hopwood, Donnellan, Bloningen, Krueger, McGue, Iacono and Burt2011) used latent growth modeling to show that the foundations of personality changes across young adulthood were explained by both genetic and non-shared environmental factors. Similar findings were reported by some studies (Bleidorn et al., Reference Bleidorn, Kandler, Riemann, Angleitner and Spinath2009; Blonigen et al., Reference Blonigen, Carlson, Hicks, Krueger and Iacono2008). However, there are some studies with longitudinal multiple-rater twin data (i.e., data including both self- and peer-reported personality) that offered slightly different findings; that is, that personality change is chiefly due to environmental factors (Bleidorn et al., Reference Bleidorn, Kandler, Riemann, Angleitner and Spinath2012; Kandler et al., Reference Kandler, Bleidorn, Riemann, Spinath, Thiel and Angleitner2010). These recent studies, with some exceptions, insisted that both genetic and non-shared environmental factors influence personality development, although some earlier studies found genetic factors to affect rank-order stability in personality.
Although there are some studies focusing on personality change and stability in adulthood, as described above, such studies in childhood or adolescence are scarce. One of the previous studies with childhood or adolescent samples, De Fruyt et al. (Reference De Fruyt, Bartels, Van Leeuwen, De Clercq, Decuyper and Mervielde2006), showed high stability in genetic influences and change in non-shared environmental influences on personality over a time period of three years from late childhood to early adolescence. Similar findings were obtained in a more recent study (Spengler et al., Reference Spengler, Gottschling and Spinath2012). However, until the present, there have been no longitudinal twin studies with a sample from early to late adolescence. Therefore, this study aimed to fill a gap in the literature with a longitudinal twin study in adolescence.
Because the present study utilized two waves of longitudinal twin data, this study design addresses the first two issues about the genetic and environmental influences on personality development across adolescence. Specifically, this study first investigated whether heritability and environmentality of personality changes from early to late adolescence. Based on previous studies in children or young adults, we expected a similar heritability and environmentality as the preceding findings, characterized by roughly equal genetic and non-shared environmental influences. Then we examined change and stability in genetic and environmental influences on adolescent personality over time. Because the pattern of high stability in genetic influence and the relatively lower stability in environmental influence over time have been replicated by many previous studies using adult or child twin samples from different nations, and by employing different measures of personality, we can expect a similar pattern of genetic and environmental factors with a Japanese adolescent sample.
Materials and Methods
Participants and Procedure
This study used archival data from students who entered a secondary school affiliated with the Faculty of Education, the University of Tokyo. The students in the school were invited to participate in the research after entering the school. The research began in 1950, and numerous educational, psychological, and physical indicators have been collected up to the present. In addition to other non-twin students, the school takes in approximately 10 –20 twin pairs every year, and many variables from the twin students have been gathered. Personality indicators of the twin students were collected from 1981 to 2010 and were assembled as part of the archival data.
The archival data used in this study include 321 same-sex twin pairs (180 female twins). The analyses presented here were carried out on all twins participating in the study (273 MZ twin pairs and 48 DZ twin pairs). Approximately 45% of the total, 146 twins (121 MZ twin pairs and 25 DZ twin pairs), completed the questionnaire approximately three years later (M = 3.2, SD = 0.66, range 2–4 years). The age range varied from 12 to 14 years (M = 12.7; SD 1 0.59) at the first time point, and from 15 to 17 years (M = 15.8; SD = 0.74) at the second time point.
Zygosity diagnosis was conducted at school entry. Approximately, 30 physiological indicators were checked by school physicians, including blood type, serum, uric acid level, cholesterol level, height, weight, and so forth.
Measure
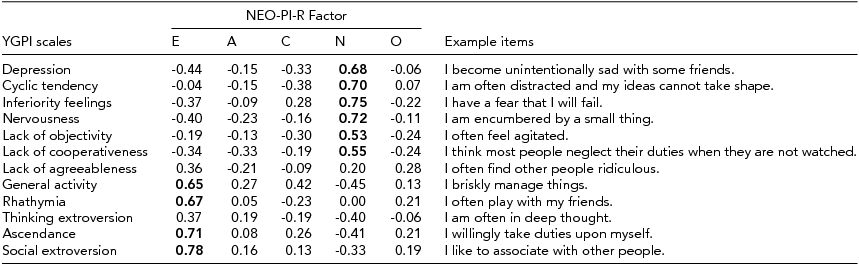
The sample for this study was given the Yatabe-Guilford Personality Inventory (YGPI; Yatabe, Reference Yatabe and Okado1975), which was developed in Japan, based on three Guilford–Martin inventories (Guilford, Reference Guilford1940; Guilford & Martin, Reference Guilford and Martin1943a, Reference Guilford and Martin1943b). The YGPI consists of 12 traits: Depression, Cyclic Tendency, Inferiority Feelings, Nervousness, Lack of Objectivity, Lack of Cooperativeness, Lack of Agreeableness, General Activity, Rhathymia, Thinking Extroversion, Ascendance, and Social Extroversion. Depression refers to the inclination to become gloomy and pessimistic and to have feelings of guilt. Cyclic Tendency describes the tendency to conspicuously change one's mood and to become emotionally unstable. Inferiority Feelings denotes a lack of confidence, uncomfortableness, and underestimation of oneself. Nervousness represents the tendency to become surprised, impatient with trivial matters, and restless. Lack of Objectivity indicates the inclination to refer everything to oneself, to be sensitive to criticism, and to become easily confused. Lack of Cooperativeness describes the inclination to suspect others, to dislike successful people, and to have a belief that people are dishonest. Lack of Agreeableness represents the tendency to hate to lose, to be selfish, and to quarrel with others. General Activity denotes the tendency to be lively and eager. Rhathymia describes the tendency to be easygoing, lighthearted, and happy. Thinking Extroversion indicates the tendency to not pay attention to details and to take one's failures quite easily. Ascendance refers to social dominance and social leaderships. Social Extroversion describes a social vitality and tendency to seek social relationships. Item examples of each YGPI scale are shown in the Appendix.
The 12 YGPI scales cover the Neuroticism and Extraversion domains of the Big Five personality inventory (Natsuno, Reference Natsuno and Tsuji1998; Shimonaka, Reference Shimonaka1996). In this regard, the YGPI is similar to the Guilford–Zimmerman Temperament Survey (GZTS; Guilford et al., Reference Guilford, Zimmerman and Guilford1976). Shimonaka (Reference Shimonaka1996) investigated correlations between the YGPI and the Revised NEO Personality Inventory (NEO-PI-R), and the results are also shown in the Appendix. The NEO-PI-R domains, especially Neuroticism and Extraversion, are correlated with some of the YGPI subscales.
The YGPI-12 scales have enough validity and reliability (Tsujioka, Reference Tsujioka2000). Cronbach's alpha reliability coefficients range from 0.70 to 0.92 (Mdn = 0.85), and test–retest reliability estimates among one-month for the 12 scales ranged from 0.56 to 0.82 (Mdn = 0.73; Tsujioka, Reference Tsujioka2000). All participants in the present study completed the YGPI at school. Each trait of the YGPI contains 10 items rated on a 3-point scale: 0 (no), 1 (yes and no), and 2 (yes). The score of each trait was calculated from the 10 items after dealing with the reverse scoring. The theoretical range of personality scores is from 0 to 20.
Data Analyses
Phenotypic analyses
Before all data analyses, the YGPI scores were standardized as t scores (M = 50, SD = 10). Phenotypic analyses were conducted on all available data. We first calculated correlations for the YGPI trait scores among co-twins and two time points. Then we analyzed mean-level changes in YGPI trait scores across adolescent years. These phenotypic analyses were conducted with R 3.1.0.
Biometric analyses
Genetic model fitting of twin data utilizes the difference in genetic similarity between MZ, who share 100% of their genetic material, and DZ twins, who share an average of 50% of their segregating genetic material, to index the relative genetic and environmental contributions to an observed phenotype. This analytic method typically decomposes the variance of a phenotype into three components: additive genetic effects (a 2), shared environmental effects (c 2), and non-shared environmental effects (e 2). The additive genetic effects describe the effect of multiple genes that have influence in a linear or additive fashion. The shared environments represent influences that are common to each member of a twin pair. The non-shared environments, including measurement error and state fluctuations, stand for influences that are unique to each member of a twin pair. This methodology is based on the equal environments assumption (EEA), which assumes that MZ pairs are no more likely to share the environmental events of etiologic importance for the phenotype under study than DZ pairs (Kendler et al., Reference Kendler, Neale, Kessler, Heath and Eaves1993). Thus, any differences in the MZ and DZ correlations are assumed to be attributed to differences in the genetic similarity of the corresponding twins.
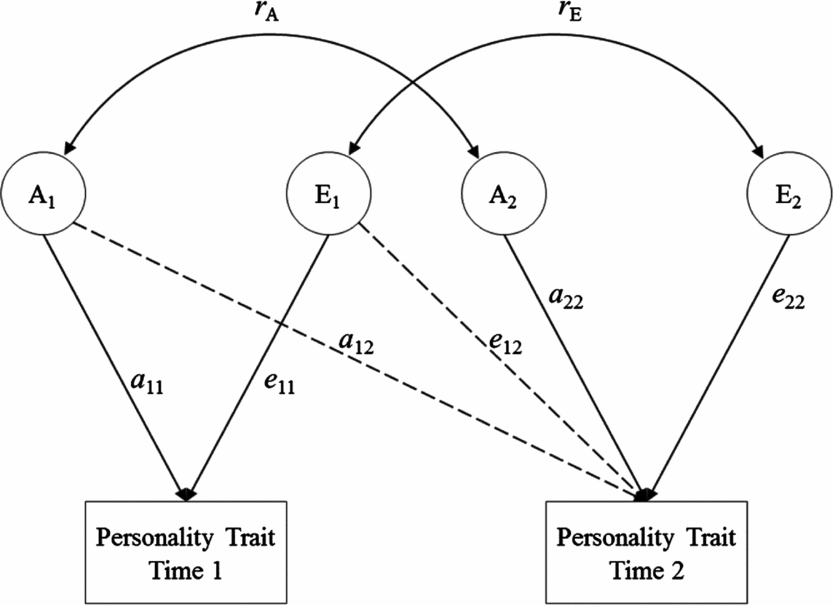
To evaluate the origins of rank-order stability of personality, we fitted a Cholesky decomposition model. Within a Cholesky decomposition model (see Figure 1), the variance within and the covariance between personality traits across each assessment are split into their genetic and environmental components. The genetic, shared environmental, and non-shared environmental covariances can be standardized on their respective variances to produce genetic, shared environmental, and non-shared environmental correlations in this model. These statistics indicate the extent to which a particular effect at one assessment is correlated with the same effect at another assessment. A genetic correlation of 1.0 (i.e., r g = 1) would mean that all genetic influences persist across assessments, whereas a correlation of zero would indicate no genetic overlap. Much the same is true of an environmental correlation. Thus, this model made it possible for us to specifically estimate the extent to which genetic and environmental influences contribute to the rank-order stability of personality over time. Cholesky models were fitted via maximum likelihood using Mplus version 7 (Muthén & Muthén, Reference Muthén and Muthén2012).
Path diagram of the Cholesky decomposition model. The variance of personality at each assessment is decomposed into additive genetic effects (A1 and A2) and non-shared environmental effects (E1 and E2). This path diagram represents only one twin in a pair (results are identical for the co-twin).
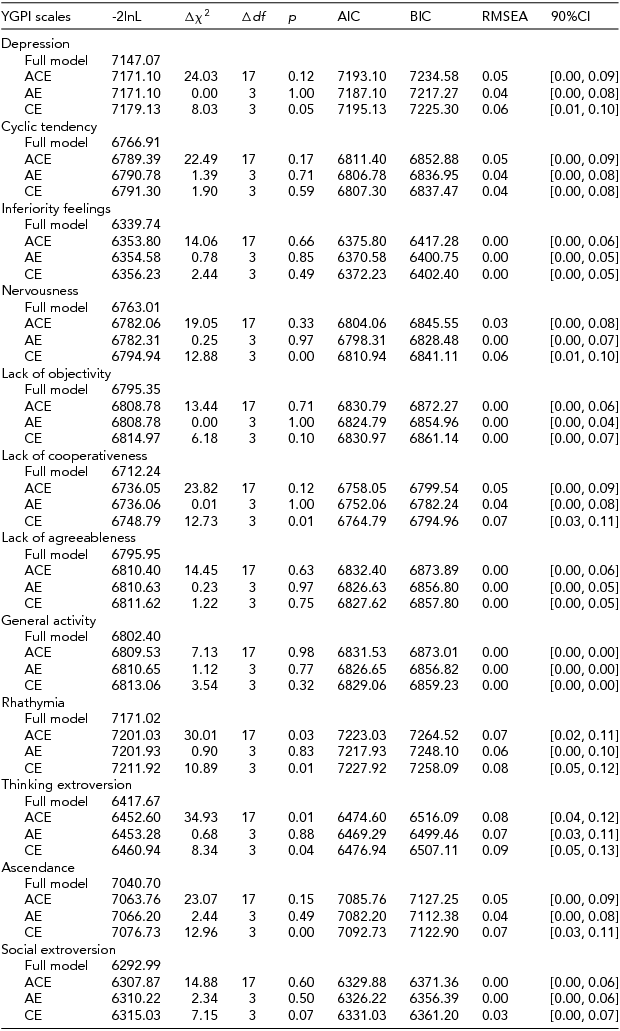
When fitting a Cholesky model, variances, covariances, and means are freely estimated by minimizing the deviance statistic, minus twice the log-likelihood (-2l nL). The -2l nL under this unrestricted baseline model is compared with -2l nL under more restrictive biometric models. This comparison provides a likelihood-ratio χ2 test of goodness of fit for the model. The model fit was assessed by χ2 difference tests, Akaike Information Criterion (AIC; Akaike, Reference Akaike1974), Bayesian Information Criterion (BIC; Schwartz, Reference Schwartz1978), and root-mean-square error of approximation (RMSEA; cf. Hu & Bentler, Reference Hu and Bentler1999). The lower χ2 values, the more negative AIC and BIC (AIC = χ2 – 2df; BIC = χ2 – kln[n]) values, and the lower RMSEA, suggesting a better fit.
Results
Attrition Analyses
Almost 45% of the Time 1 participants completed the questionnaires at Time 2 in the present study. Attrition effects were inspected for split samples by comparing mean age, gender, zygosity, and personality scores at Time 1 between participants (MZ and DZ twins) who completed the YGPI at both assessments (MZ, N = 121; DZ, N = 25) and those who completed it at Time 1 but did not take part at the next assessment (MZ, N = 152; DZ, N = 23). For demographic variables, we found no differences in zygosity (χ2 = 0.79, df = 1, p = .38), and gender (χ2 = 0.60, df = 1, p = .44). However, a small difference in mean age was observed (t = 2.63, df = 249.9, p = .009, Cohen's d = 0.30), which shows that the mean age of participants who completed the YGPI at both times was slightly lower. Uncorrected for multiple testing effects, no differences were revealed in each YGPI scale for both co-twins (-1.58 < ts < 1.37, ps > .115). Therefore, the twins who participated in both assessments in this study did not substantively differ from the other twins who took part in only the first assessment, except for their mean age.
Phenotypic Results
Rank-order stability and twin intraclass correlation
Rank-order stability coefficients of longitudinal twin data and twin intraclass correlation coefficients are reported in Table 1. Results showed moderate stability of the YGPI scores among adolescent years. Because of the small sample size of DZ twins, the estimates of rank-order stability coefficients of DZ twins varied widely. The magnitude of rank-order stability was not substantially different across MZ and DZ twins.
Twin Correlations for the YGPI Traits and Two Time Points
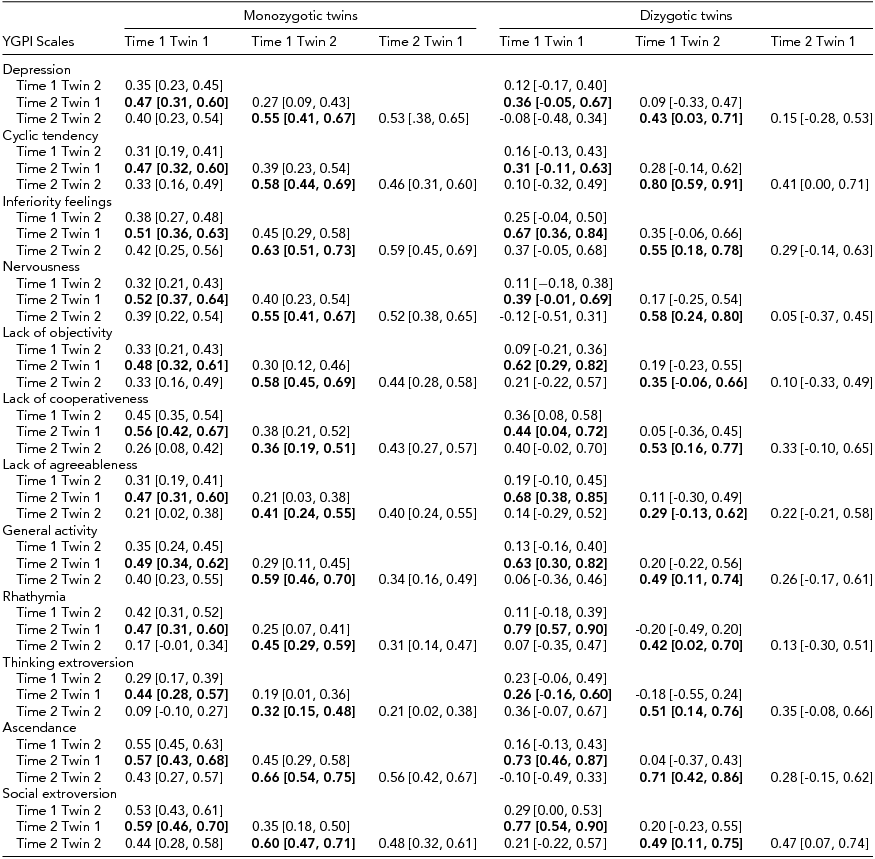
95% confidence intervals are shown in parentheses. Rank-order stability coefficients are presented in bold type. YGPI = Yatabe-Guilford Personality Inventory.
Mean-level change
For an illustration of change in mean-levels of the YGPI scales, averaged t scores were calculated on data from participants who completed the YGPI twice. Results showed that moderate mean-level changes were observed in seven YGPI traits: Depression, Cyclic Tendency, Inferiority Feelings, Nervousness, Lack of Agreeableness, Thinking Extroversion, and Social Extroversion (see Table 2).
Mean-Level Change and Stability in the YGPI Scales
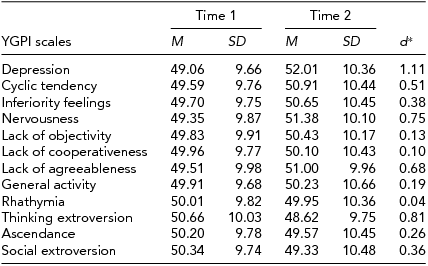
d = estimated effect size for Cohen's d paired measurements: tc[2(1-r)/n]½, in which tc = M diff/(SD diff/n)½ (Dunlap et al., Reference Dunlap, Cortina, Vaslow and Burke1996). YGPI = Yatabe-Guilford Personality Inventory.
Biometric Results
Longitudinal Genetic Analyses
Based on the obtained pattern of MZ–DZ correlations shown in Table 1, the first tested model included A, C, and E. Compared between longitudinal Cholesky decomposition models by χ2 tests and other model-fit indices, the AE model, including additive genetic and non-shared environmental effects, was the best fit for all YGPI scales. Detailed results of model fittings are given in Table 3. Thus, we showed the parameter estimates of AE models (Figure 1) for each YGPI scale. The detailed estimates are presented in Table 4. Heritability estimates obtained from the bivariate genetic analyses ranged from 0.27 (for Thinking Extroversion at Time 1) to 0.62 (for Ascendance at Time 2). Estimates of genetic and environmental correlation coefficients for each YGPI scale reveal if genetic or environmental influences contribute to stability or change in personality in the period from early to late adolescence. Genetic correlation coefficients (Mdn = 0.74) ranged between 0.62 (for Thinking Extroversion) to 0.83 (for Nervousness) and environmental correlations (Mdn = 0.31) ranged from 0.26 (for Lack of Cooperativeness) to 0.35 (for Rhathymia). These estimates indicate that genetic influences on individual differences highly persist across measurement points and that those from environment moderately change over time.
Results of Longitudinal Cholesky Decomposition Model Fitting for the YGPI Scales
Parameter Estimates for the Longitudinal Cholesky Decomposition Model
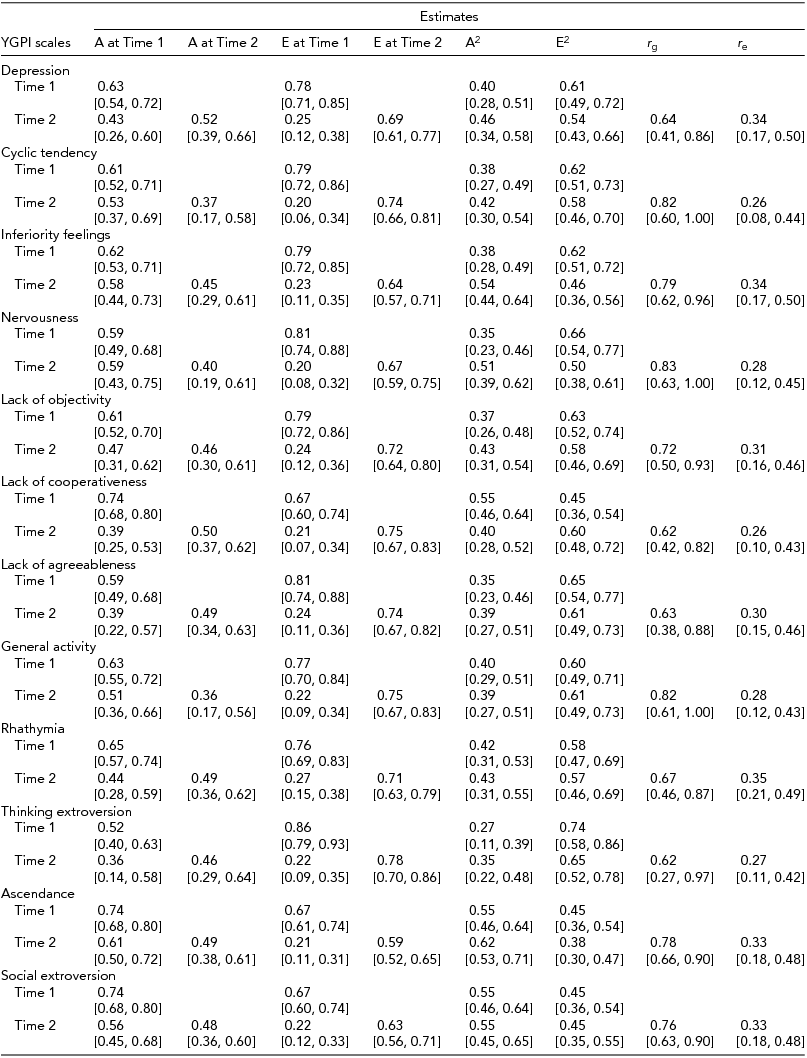
A = additive genetic effect, E = non-shared environmental effect, r g = genetic correlation between two time points, r e = environmental correlation between two time points, 95% confidence intervals are shown in parentheses.
Discussion
This study extends the research on personality development by examining genetic and environmental contributions to rank-order stability in adolescent personality traits. The strengths of this study were the use of a relatively rare Japanese sample and the filling of a gap in the literature with a longitudinal twin study in adolescence. The limitations of this study are the use of a single, self-reported questionnaire to measure adolescent personality; the Japanese domestic questionnaire, YGPI; the small sample size, especially the number of DZ twin pairs; and the small number of measurements of personality. It has been indicated that there are stable individual differences in self-report response styles (McCrae & Costa, Reference McCrae, Costa, John, Robins and Pervin2008), and it is also well known that mono-rater measures of personality constructs are susceptible to random and systematic error components (Campbell & Fiske, Reference Campbell and Fiske1959). To control for these biases, it is effective to use additional measurement methods or independent ratings by well-informed observers (Hofstee, Reference Hofstee1994; Kandler et al., Reference Kandler, Bleidorn, Riemann, Spinath, Thiel and Angleitner2010). Indeed, some previous studies have obtained reasonable findings regarding personality development through the use of self- and peer-reported personality scores (Bleidorn et al., Reference Bleidorn, Kandler, Riemann, Angleitner and Spinath2012; Kandler et al., Reference Kandler, Bleidorn, Riemann, Spinath, Thiel and Angleitner2010, Reference Kandler, Riemann and Angleitner2013). Future research should investigate adolescent personality development with multiple-method or multiple-rater personality data to reduce random and systematic error effects. Moreover, the small number of assessment times was also a limitation of this study. We could not analyze genetic and environmental effect on mean-level change and stability in personality because the sample was composed of individuals with only one or two waves of longitudinal data. Future research should collect longitudinal data from three or more assessments, resulting in the further investigation of individual differences in personality development across adolescence.
Despite these limitations, this study obtained significant results. Results of the bivariate Cholesky decomposition model analyses showed that additive genetic and non-shared environmental influences explain the variances of each YGPI scale and that the heritability was approximately 40%, which is consistent with previous studies (De Fruyt et al., Reference De Fruyt, Bartels, Van Leeuwen, De Clercq, Decuyper and Mervielde2006; Spengler et al., Reference Spengler, Gottschling and Spinath2012) and supports the hypotheses of this study. Results of the bivariate analyses also showed that the rank-order stability of personality traits across adolescence are mainly due to high genetic rank-order stability, which agrees with previous studies dealing with samples after emerging adulthood (Blonigen et al., Reference Blonigen, Carlson, Hicks, Krueger and Iacono2008; Bratko & Butkovic, Reference Bratko and Butkovic2007; Hopwood et al., Reference Hopwood, Donnellan, Bloningen, Krueger, McGue, Iacono and Burt2011; Johnson et al., Reference Johnson, McGue and Krueger2005; Kandler et al., Reference Kandler, Bleidorn, Riemann, Spinath, Thiel and Angleitner2010, Reference Kandler, Riemann and Angleitner2013; McGue et al., Reference McGue, Bacon and Lykken1993; Viken et al., Reference Viken, Rose, Kaprio and Koskenvuo1994) and also supports the hypotheses of the present study.
Adolescent Personality Development: Results From Phenotypic Analyses
Although the sample size of this study was small; we obtained some phenotypic results that offer valuable insight to prior inconsistent findings. Mean-level changes in the YGPI scales were examined by differences in the YGPI scale scores between times. The results showed large increases in Depression, Cyclic Tendency, Nervousness, and Lack of Agreeableness, and large decline in Thinking Extroversion (ds > 0.50). These results indicated that adolescents become more neurotic. Moreover, there were small differences in the Inferiority Feelings, Ascendance, and Social Extroversion over time (approximately ds = 0.30). Ascendance refers to one of the facets of Extraversion, social dominance, and Social Extroversion denotes the other facet of Extraversion, sociability. The differences in mean levels of Ascendance, and Social Extroversion over time implied declines in Extraversion across adolescence.
These results are roughly comparable with studies by Soto et al. (Reference Soto, John, Gosling and Potter2011) and Van den Akker (Reference Van den Akker, Deković, Asscher and Prinzie2014). However, it should be noted that these phenotypic results were obtained from same-sex twins. Watzlawik (Reference Watzlawik2009) argued that MZ twins focused more on the internal differences, such as personality, during adolescence. Perhaps developmental trajectories of adolescent personality may be slightly different between twins and non-twins. We should, therefore, further investigate whether the obtained phenotypic results were unique to twins. And, if so, future research should examine whether personality development is unique in twin adolescents who grow up with siblings similar with themselves.
Heritability and Environmentality of Adolescent Personality
The first research theme of this study was the relative contributions of genetic and environmental influences on individual differences in personality. The obtained results indicated that both effects remain stable across adolescence. Although previous studies focusing on adult samples suggested slight but significant decreases in heritability throughout the adult life span (e.g., Kandler et al., Reference Kandler, Riemann, Spinath and Angleitner2010; Viken et al., Reference Viken, Rose, Kaprio and Koskenvuo1994), this study did not observe a significant decrease in heritability from 12 to 17 years age. However, it has been indicated that internalizing problems, especially depression and anxiety, change etiologic structures from childhood to young adulthood and that genetic contributions to childhood depression are different from those in adolescent or adult depression (Waszczuk et al., Reference Waszczuk, Zavos, Gregory and Eley2014). Based on these findings, it remains possible that the heritability and environmentality of Neuroticism-related traits change from childhood to adolescence. Future research should examine the heritability of personality traits with a younger sample, to fill a gap in the literature with a longitudinal behavior genetic study of personality traits.
Rank-Order Stability in Genetic Influences
The causes of rank-order stability in personality were the second research theme of this study. Consistent with previous studies, the present study showed high rank-order stability of genetic factors. Indeed, we observed the three-year stability of genetic influences was approximately r g = 0.70 and that of environmental effects was approximately r e = 0.30. These estimates are nearly identical to the previous studies focused on similar age groups (e.g., Bratko & Butkovic, Reference Bratko and Butkovic2007; Viken et al., Reference Viken, Rose, Kaprio and Koskenvuo1994). These results mean that a large part of genetic factors influencing personality traits in early adolescence also contribute to those in late adolescence. In contrast, there is a substantial change in non-shared environmental influences. These reproducible results have enormous importance for personality development research.
It is also worth noting that these results denote the same tendency of each YGPI scale. The YGPI scales cover the Neuroticism and Extraversion domains (Natsuno, Reference Natsuno and Tsuji1998; Shimonaka, Reference Shimonaka1996); however, the observed genetic and environmental correlations were almost the same as each other. For example, Bratko and Butkovic (Reference Bratko and Butkovic2007) showed similar results on the Eysenck Personality Questionnaire (Eysenck & Eysenck, Reference Eysenck and Eysenck1975) scales, except for the lie scale. De Fruyt et al. (Reference De Fruyt, Bartels, Van Leeuwen, De Clercq, Decuyper and Mervielde2006) and Spengler et al. (Reference Spengler, Gottschling and Spinath2012) also suggested similar results on Big Five personality traits, except for Openness. Based on these findings, we can say that the genetic factors contributing to at least Neuroticism and Extraversion remain equally stable and that the results of this study supported these findings.
However, the results of the Cholesky model analyses showed not only genetic stability in personality but also the novel genetic influences after mid-adolescence, despite the small proportion of total variance. Previous studies revealed that genetic effects on anxiety, depression and behavioral problems varied over the adolescent years through genetic innovation (Kendler et al., Reference Kendler, Gardner and Lichtenstein2008; Lewis & Plomin, Reference Lewis and Plomin2015); the results of the present study are consistent with these findings. Although the details of the genetic innovation are unclear, they may be attributable to unique physical changes during adolescence. Juvenile physical changes, including the onset of puberty or brain maturation, are highly genetically determined (e.g., Chiang et al., Reference Chiang, McMahon, de Zubicaray, Martin, Hickie, Toga and Thompson2011; Silventoinen et al., Reference Silventoinen, Haukka, Dunkel, Tynelius and Rasmussen2008). It has been suggested that these physical changes may have effects on emotional instability and Extraversion (e.g., Blankstein et al., Reference Blankstein, Chen, Mincic, McGrath and Davis2009; Mensah et al., Reference Mensah, Bayer, Wake, Carlin, Allen and Patton2013). In fact, an association between personality and physical change has been shown; changes in Conscientiousness, Extraversion, and Neuroticism were significantly associated with changes in mental and physical health status (Magee et al., Reference Magee, Heaven and Miller2013). Therefore, future research should explore the specific genes related to this genetic innovation and investigate the mutual trajectories of personality and physical development across adolescence.
Acknowledgments
Preparation of this manuscript was supported by JSPS KAKENHI Grant Number 26-12061. The author would like to thank Enago (www.enago.jp) for the English language review.
Correlations Between the YGPI Scales and NEO-PI-R Factors reported in Shimonaka (Reference Shimonaka1996) and the YGPI Example Items