


Introduction
Much attention to the mechanical behavior of ice has focused on the slow strain rates, low confining pressures and small deviatoric stresses associated with deformation within glaciers. Ice mechanics applied to ice–structure interaction introduces new challenges both for experimental studies and for constitutive modeling of ice behavior. The extreme interaction rates, high shear stresses, high confining pressures, rapid and continuous damaging of the ice during impact and the occurrence of multiple deformation mechanisms within a contact zone make the problem extremely complex. We have focused on two objectives: (1) laboratory studies of the critical factors involved in ice failure under the range of conditions acting in an impact zone, and (2) the development of a constitutive relation that will describe the complex behavior of ice under these conditions.
The studies presented in this and the two companion papers (Reference Melanson, Meglis, Jordaan and StoneMelanson and others, 1999; Reference Muggeridge and JordaanMuggeridge and jordaan, 1999) are primarily aimed at addressing the first objective and using the results to guide our approach to the second. The experimental work presented in Reference Melanson, Meglis, Jordaan and StoneMelanson and others (1999) and this paper was not undertaken to reproduce impact conditions. Rather, the approach was to isolate two of the critical elements — high-stress conditions and the damage-formation process — and systematically characterize the mechanical and microstructural response of ice to these factors. In Reference Muggeridge and JordaanMuggeridge and jordaan (1999), iceberg ice subjected to true impact conditions in field tests is characterized.
Measurements of loads during ship-ramming trials, indentation tests and laboratory compression tests indicate ice can sustain, and therefore transmit, very high loads during impact. Pressures on the order of 70 MPa have been documented in indentation tests for a sensor of diameter 12.7 mm (Reference Frederking, Jordaan and McCallumFrederking and others, 1990); pressures up to 51 MPa were detected on an instrumented ship hull for a sensor of area 0.0472 m2 (Reference Glen, Blount and LunardiniGlen and Blount, 1984). These high loads occur within localized areas termed “high-pressure zones’. The ice is able to sustain these loads in part due to the confining action of the surrounding ice mass. Extensive damage to the ice occurs rapidly (typically within a few seconds or less), and extrusion of pulverized ice is commonly observed. Large deformations arc accommodated by intense damage within a localized zone adjacent to the impact surface. Observations of ice subjected to impact tests indicate that fracturing, recrystallization and melting are deformation mechanisms acting within an impact zone (Reference Kheisin and CherepanovKheisin and Cherepanov, 1973).
The term “damage” has typically been used to define microstructural elements (such as microcracks) which accumulate in a material under sustained stress and cause the degradation of properties such as modulus or strength. In the context of the current research there are a number of potential damage elements, including microcracks, dislocations and melt fraction, that can act to soften or weaken the ice. A key objective of this work is therefore to understand the microstructural changes associated with the change in mechanical behavior resulting from damage. For further discussion of damage to ice during ice—structure interaction, see Reference Jordaan, Matskevitch and MeglisJordaan and others (1999) and Reference Melanson, Meglis, Jordaan and StoneMelanson and others (1999).
While extensive experimental work has been done on many types of ice under uniaxial and biaxial conditions (Reference SinhaSinha,1979; Reference ColeCole, 1983; Reference Mellor and ColeMellor and Cole, 1983; Reference Jacka and MaccagnanJacka and Maccagnan, 1984; Reference Smith and SchulsonSmith and Schulson,1993), fewer studies have addressed the deformation and failure of granular ice under triaxial confinement Reference Jones and JohariJones and Johari, 1977; Reference JonesJones, 1982; Reference Jones and Chew.Jones and Chew, 1983; Reference Rist, Murrell, Sammonds, Saeki and HirayamaRist and others, 1988; Reference Stone, Jordaan, Jones, McKenna, Axelsson and FranssonStone and others, 1989; Reference Kalifa, Ouillon and DuvalKalifa and others, 1992; Reference Rist, Jones and SladeRist and Murrell, 1994; Reference Rist and MurrellRist and others, 1994; Reference Gagnon and GammonGagnon and Gammon, 1995; Reference Stone, Jordaan, Xiao and JonesStone and others, 1997). Because high confinements, high shear stresses and large strains occur in impact zones during ice—structure interaction, the present study was undertaken to assess the mechanical behavior and associated microstructural changes in ice under these stress conditions. Laboratory test conditions covered a range of confinements from low pressures (present at the periphery of the high-pressure zone) to high pressures (found at the center of a high-pressure zone where the ice is either relatively intact or is highly damaged and constrained by the surrounding ice). A range of deviatoric stresses from 2 to 25 MPa was used; microstructural characterization focused on samples tested using a deviatoric stress of 15MPa.
Experimental Procedures
Sample preparation
Cylindrical test specimens of granular ice measuring 70 mm in diameter and 155 mm in length were made using the procedure described in Reference Melanson, Meglis, Jordaan and StoneMelanson and others (1999). In order to compare the effects of initial grain-size on ice behavior, one sample was made from a block for which snow, rather than crushed ice, was used as seed material to produce a finer-grained ice. Another sample was prepared from one of the large-grained blocks typically used for crushing into seed.
Test procedure
Constant-axial-load tests were done using a Materials Testing Systems (MTS) test frame with independent servo-controlled actuators for applying axial load and confining pressure. Load paths were programmed using MTS Test-Star software. Samples were jacketed in latex to exclude the confining medium (silicon oil) and placed in the triaxial confining cell. The cell was filled and a small axial load was applied to ensure contact between the loading piston and the specimen. Then the confining pressure was increased at a rate of 0.5 MPa s−1 and held for approximately 1 minute prior to the creep-load step. The creep load was applied rapidly (the target load was typically reached within 0.1s) and then held constant as the sample deformed. Axial load was monitored on two load cells located inside and outside the triaxial vessel. Strain was not monitored directly on the specimens, because the apparatus could not accommodate the large sample distortions. Displacement of the loading piston was therefore used to monitor the amount of sample shortening. The axial load was quickly removed as soon as the specified strain limit was reached, and then the confining pressure was slowly decreased.
In general, samples were allowed to deform until a prescribed limit of axial strain was reached. Most were taken to the maximum limit (approximately 44% true strain). For two values of confining pressure (5 and 50 MPa), a number of tests were halted at several intermediate levels of strain in order to examine the progressive microstructural changes occurring.
The point of contact with the piston could generally be determined to within 0.4 mm at the start of the creep step; for a sample taken to 4% strain, this introduces uncertainties on the order of 5–6% of the total strain measurement (or approximately 0.2% strain). For the tests taken to the maximum strain limit, it reflects an uncertainty of < 1% of the total strain measurement, For this reason we have not focused on the behavior of the samples at very small strains in the tests presented here; they were not designed for that purpose.
The test samples, confining oil and test apparatus were held at a temperature of –10°C for at least 12 hours prior to testing. Work by B. M. Stone (unpublished data, 1995) and subsequent calibration experiments byReference Melanson Melanson (1998) indicate that the application of confining pressure causes an increase in temperature at the center of an ice specimen of approximately 0.02°C MPa−1 and an increase in the temperature of the confining oil of approximately 0.11°C MPa−1. In the tests done at the highest confining pressures, attempts were made to compensate for this shift in temperature by using a slightly colder initial sample/oil temperature of –11° to –12°C. More precise control over the sample temperature was not possible given the configuration of the test apparatus.
States of stress and damage
The primary focus of testing was to study the creep behavior of initially intact ice under a range of triaxial confinements with high deviatoric stresses. A number of additional stress paths were also investigated to assess the effects of deviatoric stress, prior damage and the effects of a rapid drop in confinement which would accompany ice failure in a contact zone. In our notation, the applied confining pressure is designated P c. The deviatoric stress (equivalent to the von Mises stress in this case, i.e. the difference between the axial stress and the applied confining pressure) is designated s.
Creep tests an intact ice
The majority of creep tests were done on initially intact ice using a nominal deviatoric stress (s) of 15 MPa with confining pressures (P c) of 5–60 MPa (Table 1). Tests were done over the range of confinements to assess the pressure dependence of creep at a constant deviatoric stress. 16 investigate the deviatoric stress dependence of creep, a series of tests was done in which s ranged from 2 to 20 MPa and P c was 20 MPa. A series of tests aimed at characterizing the sample behavior for a constant hydrostatic stress (p) and different deviatoric stresses is also presented. The hydrostatic stress, p, is defined under these test conditions as p = s/3 + P c. (This parameter is used primarily in the constitutive modeling (Reference MelansonMelanson, 1998; Reference Jordaan, Matskevitch and MeglisJordaan and others, 1999)). In these tests, the applied confining pressure (P c) was adjusted such that the hydrostatic pressure was held at p = 55 MPa for all the tests.
The maximum axial strain (in % true strain) for each lest specimen, with the confining pressure (Pc) and deviatoric stress (s) during the creep phase of the test

Finally, one specimen was subjected to an axial loading resulting in part from stress relief. In this test, a confining pressure of 30 MPa was applied and the piston was brought into contact with the sample. Then the confining pressure was dropped rapidly while the high axial load was maintained, resulting in an increase in deviatoric stress.
Creep tests on damaged ice
Because of the demonstrated difference in mechanical behavior between intact and damaged ice (Reference Stone, Jordaan, Xiao and JonesStone and others, 1997), the impact of prior damage on the creep behavior of ice was investigated. In these tests, samples were subjected to axial strains of either 2%, 4% or 12% at a constant rate of either 10−2 s−1 or 10−4 s−1 under 20 MPa confinement, prior to application of the creep load (Table 2). (For further details of these tests see Reference MelansonMelanson, 1998.) In one additional test, the sample was subjected to 18% strain under creep conditions s = 15 MPa and P c = 5 MPa. The confinement was then increased to 50 MPa and the sample was allowed to continue deforming at s = 15 MPa until the maximum strain limit was reached (see Table 1, footnote 1).
Eight specimens were subjected to a damage step at the constant strain rate given, under confinement of 20 MPa. Following this step, a deviatoric stress (s) was applied with confining pressure (Pc), and the sample was allowed to creep to the maximum axial strain shown. These tests are noted with “d” in the plots

Stress Correction for Lateral Strain
For the tests taken to large strains, the increasing cross-sectional area resulting from lateral strain caused a decrease in the actual deviatoric stress applied under constant-load conditions. A correction has been applied to the measured loads to estimate the true stress, as discussed in Reference Melanson, Meglis, Jordaan and StoneMelanson and others (1999). These values are designated in our figures as “corrected deviatoric stresses”.
Sample Analysis
Samples were removed from the confining vessel, and then thin-sectioned and photographed within 24 hours of testing to minimize the influence of static recrystallization or crack healing. Most of these samples were analyzed within 2 or 3 hours of testing. Although the possibility of crack healing is always a concern, samples which were significantly micro-cracked in thin section were, without exception, visibly cracked immediately upon removal from the confining cell. Samples taken to the higher strain levels were, in fact, opaque. Samples which were predominantly clear and transparent upon removal from the cell had correspondingly few cracks in thin section. Occasionally the presence was noted of a few larger (i.e. grain-sized) cracks immediately adjacent to the loading platens; this is a region in which the stress distribution is highly non-uniform, and thin sections were therefore not taken close to the platens.
Thin sections were cut perpendicular and parallel to the sample axis (designated as horizontal and vertical sections, respectively) and polished on both sides using a microtome, to a final thickness of 0.5 mm (±0.1 mm). To preserve the microstructure, the sections were “welded” to glass plates using a thin head of water around the perimeter, rather than melted on. Photographs were taken under several different lighting conditions, as discussed in Reference Melanson, Meglis, Jordaan and StoneMelanson and others (1999). Grain-size was determined using the intercept method (Reference DieterDieter, 1976) for a number of samples.
Results
Mechanical behavior
Figure 1 shows an example of the axial strain, confining pressure and corrected deviatoric stress measured during a complete test sequence. The confining pressure was slowly increased and held, then the deviatoric stress was applied quickly and held until a specified limit of axial shortening was reached. Figures 2–8 show the axial strain with time (view a) and the strain rate plotted as a function of total strain (view b) for only the creep portion of all tests. Three factors are highlighted by these plots: the time prior to accelerated creep (view a), and the creep rate and stability or failure under load (view b).
Example of the corrected deviatoric stress, confining pressure and strain curves from a typical creep test.

Axial true strain as a function of time (a), and strain rate as a function of total cumulative axial strain (b), plotted for four tests done with a confinement Pc = 20 MPa and deviatoric stresses as shown. Sample subjected to prior damage is noted.

Axial true strain (a) and strain rate (b) plotted for four tests done at a hydrostatic stress p = 55 MPa and deviatoric stresses as shown. Curve marked with * asterisk is from a sample which ruptured.

Axial true strain (a) and strain rate (b) plotted for six tests done at a deviatoric stress s =15 MPa with confinement Pc = 5 MPa.

Axial true strain (a) and strain rate (b) plotted for 11 tests done at a deviatoric stress s =15 MPa with confinement Pc = 50 MPa. Curves marked with asterisk are from samples which ruptured. Curves marked “lg” and “fg” are from initially large- and fine-grained samples; for the curve marked “18% d” the pressure was increased from 5 MPa to 50 MPa after an initial 18% axial strain.

Axial true strain (a) and strain rate (b) plotted for six tests done at deviatoric stress s = 15 MPa with confinement between Pc = 15 MPa and 60 MPa. Curves marked with an asterisk are from samples which ruptured. Curves marked with a tilde show hard contact with ram during initial application of creep load.

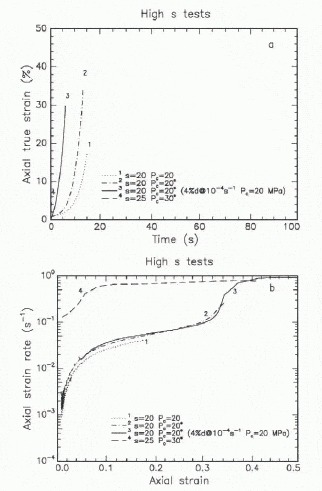
Axial true strain (a) and strain rate (b) plotted for four tests done using high deviatoric stress s = 20–25 MPa. Curve marked “4% d” is for the sample subjected to a damage step prior to creep loading.
Axial true strain (a) and strain rate (b) plotted for six tests which were subjected to a prior damage step of 12% axial strain at constant strain rates as given. These creep tests were done at a deviatoric stress s = 15 MPa with Pc = 15, 30 or 50 MPa.

Figures 2 and 3 demonstrate the effects of varying the deviatoric stress for a selected confining pressure (P c = 20; Fig. 2) and for a selected hydrostatic stress (p = 55 MPa; Fig. 3). The effects of an increased deviatoric stress are to decrease the time prior to accelerated creep and to increase the tertiary creep rate, at both lower and higher confining pressures. In most of the samples shown in Figures 2–8, creep rates showed a rapid increase within the first 10% strain, and then increased much more slowly with continuing deformation.
The exceptions to this pattern were, in every case, samples which ruptured macroscopically during testing, as shown in curve 4 of Figure 3b. Rupture is defined, for our purposes, as failure of the specimen along a through-going fault plane. (See Figure 11 for a schematic representation, and Plate 10Footnote * for examples of thin sections through ruptured specimens.) The generic term “rupture” is used because the faulted specimens often show evidence of both brittle fracture and ductile deformation; the contributions of each mechanism to the ultimate failure cannot be clearly distinguished in our samples. Curves for samples which ruptured arc marked with an asterisk.
Axial strain rate vs the corrected deviatoric stress plotted for all tests. Strain rate was determined at five levels of axial strain.

Time to accelerated creep vs the initial (i.e. uncorrected) deviatoric stress for all tests. Linear regression was done only with data marked by filled symbols; these are distinguished at 15 MPa for low and high confining-pressure tests. Open circles are samples subjected to a prior damage step. Open diamond reflects a lower bound, as discussed in the text.

Schematic representation of macroscopic shape of deformed samples following testing. Most samples deformed relatively uniformly (a). Samples which ruptured typically showed a combination of lateral strain and faulting (b). 1n two cases, samples failed rapidly without significant lateral strain (c).

The tests done at a deviatoric stress of s = 15 MPa and confining pressures Pc = 5 and 50 MPa are plotted in Figures 4 and 5, respectively. All remaining tests at s = 15 MPa and various confinements arc plotted in Figure 6. Figure 7 shows curves for four tests done using the very highest deviatoric stresses. Figure 8 shows the creep tests of Reference MelansonMelanson (1998) in which samples were subjected to a prior damage step of 12% axial strain.
In general, the tests at P c = 5 MPa show the onset of accelerating creep within 10–15 s following application of the deviatoric stress (Fig. 4a). Deformation was extremely rapid after that point, with creep rates on the order of 5 to 9 × 10⁻² s−1. Curve 2 is the sample that was subjected to a pressure drop during loading; its behavior is indistinguishable from samples which had the axial load applied directly.
At confining pressures of > 5 MPa, there was more variation in both the time to reach accelerated creep and the creep rate. Eight tests were done at P c = 50 MPa using the standard granular ice (Fig. 5). Some of these tests (curves 1–3) failed along a rupture plane; the strain rates do not stabilize at higher strains and the ice did not sustain the applied load (Fig. 5b). The samples which did not rupture (curves 4–8) reached a relatively constant strain rate (1 to 3 × 10⁻² s−1) after a slightly longer period of time.
Three additional tests plotted in Figure 5 were done under the same stress conditions using a fine-grained sample (curve 9), a large-grained sample (curve 10) and a standard ice sample that was subjected to a prior damage step (curve 11). The fine-grained specimen behaved similarly to the standard grain-size specimens that did not rupture. The large-grained sample experienced only a small amount of strain before rupturing. The damaged sample had previously been subjected to 18% strain using a deviatoric stress of 15 MPa at a confinement of 5 MPa (shown as curve 5 in Figure 3). The impact of this damage on the subsequent creep behavior at 50 MPa confinement is dramatic. The sample had reached the stage of accelerated creep during the initial loading, with a peak strain rate on the order of 3 × 10⁻² s−1. In the subsequent loading at higher confinement, the strain rate was immediately very high (2 × 10⁻² s−1) without a stage of slow deformation, and the specimen ultimately ruptured.
The remaining specimens tested at s = 15 MPa and various confinements (Fig. 6) were, in general, slower to reach accelerated creep than samples tested at P c = 5 MPa. Tests with Pc. in the range 30–40 MPa (curves 4–6) tended to behave more like the samples tested at P c = 50 MPa which did not rupture, with a longer time to accelerated creep and a lower creep rate (1 to 3 × 10⁻² s−1). Two tests in which the ram made relatively hard contact during application of the creep load (marked with a tilde) do not appear to be significantly different from the rest. The tests at the highest confining pressures shown (P c = 45 and 60 MPa; curves 1 and 3) both had a very rapid creep rate which continued to increase with axial strain; both these samples ruptured fairly late in the deformation. With the sample tested at P c = 60 MPa, for example, the two sections of ice were fused together when the sample was removed from the confining cell (see Plate 10); only about 1 cm of offset had occurred.
Four tests subjected to very high deviatoric stresses are plotted in Figure 7. One specimen was subjected to a damage step of 4% axial shortening at a strain rate of 10−4 s−1 with a confinement of 20 MPa prior to the application of the creep load. This sample and the two specimens tested at Pc = 20 MPa and s = 20 MPa reached accelerated creep very rapidly, and have virtually identical strain-rate vs strain curves (Fig. 7b). Two samples ruptured near the end of the test (curves 2 and 3). The specimen tested at P c = 30 MPa and s = 25 MPa ruptured in < 2 s (curve 4).
Six specimens were subjected to a damage step of 12% axial strain at constant strain rates prior to the application of the creep load (Fig. 8a). Like the damaged sample shown in Figure 5 (curve 11), these samples have extremely high strain rates immediately upon application of the creep load. However, the creep rates are comparable with the initially undamaged samples (i.e. samples subjected only to creep loading) when the rates are compared at the equivalent level of total axial strain.
This consistency in the creep rates is evident in Figure 9, which shows strain rates plotted against the corrected deviatoric stress at a number of axial strain levels for all of the test data presented, including the constant-strain-rate deformation steps on the damaged samples. Strain rates for samples that ruptured are shown only for creep prior to the loss of strength; beyond that point, the rate reflects the limit of the ram acceleration. Linear least-squares regressions were done for the data at strain levels 2%, 5%, 10%, 20% and 30%. Because most of the samples taken to the higher axial strain levels were subjected to a deviatoric stress of 15 MPa, the regression lines are shown for general comparison. The data taken at a given level of strain fit an equation of the form:

where v is the effective viscosity and n characterizes the dependence of the strain rate  on the deviatoric stress (S). The values of these parameters are given in Table 3. Although there are fewer data available at high strains, the overall trend of the values v and n is consistent with the raw data. The effective viscosity decreases by more than an order of magnitude with the initial 10% strain, during which the most substantial microstructural changes occur in the ice. At higher strain levels, the effective viscosity stabilizes. Although creep rates increase by several orders of magnitude with increasing axial strain, the stress exponent n remains within the range 4.0–4.6 over the full range of strains.
Effective viscosity (v), stress exponent (n) and correlation coefficient (r2) derived from the strain rate and corrected deviatoric-stress data at selected levels of cumulative axial strain

The significance of the deviatoric stress in the creep behavior of ice is also seen in the time required for the sample to reach accelerated creep, as shown in Figure 10. For our purposes, a measure of the time to accelerated creep was derived from a line fit to the strain-time curves at 5–10% strain; the time-intercept of this line was used. This strain interval was chosen because in general all the samples show a dramatic increase in strain rate above approximately 5% strain. Although the choice is somewhat arbitrary, it allows for objective determination of a time (rather than identification of the inflection by eye), it allows us to compare most of the test data (since some samples were taken only to intermediate strain levels) and it yields results consistent with qualitative observations of the raw data. These results show a strong correlation between deviatoric stress and the time to accelerated creep. The regression line is fit only to the data. from initially intact ice samples:

where t ac is our measure of the time to accelerated creep. The data point at 2 MPa was excluded from the regression because this sample reached only 2% strain in approximately 43 000s. It represents a lower bound on the measure we are using.
Microstructure
Schematic representations of the macroscopic shapes of typical deformed samples are shown in Figure 11. Samples that deformed without rupture showed axial shortening and lateral expansion which was relatively uniform along the length of the sample (Fig. 11a); often ice had extruded around the end platens. Samples that ruptured after a significant period of creep generally showed both lateral strain (similar to the intact creep samples) and a distinct failure plane at approximately 45° to the axial loading direction (Fig. 11b). These samples did not show uniform lateral expansion; often they had a prominent bulge near the center, indicative of strain localization. Samples that failed rapidly following the application of the creep load had a rupture plane oriented at approximately 45° to the axial load direction (Fig. 11c). These samples showed no appreciable lateral expansion, consistent with the fact that they ruptured at very low axial strain levels.
Photographs of thin sections from some of the test specimens are shown in Plates 4–10. Refer to Plate 1 for a view of a horizontal thin section through an undeformed specimen. In general, the grain boundaries are straight and regular prior to deformation, and few bubbles or flaws are visible.
Plates 4–10 show photographs of both horizontal and vertical thin sections of selected specimens following testing. Sections are shown which contrast the progressive micro-structural change with strain for tests with a deviatoric stress of 15 MPa at two confining pressures, P c = 5 MPa (Plates 4–6) and P c = 50 MPa ( Plates 7–9).
At the lowest confining pressure, the first increment of strain (4% ) causes the formation of both intra-granular and inter-granular microcracks (Plates 4–6, view a). Most of the original grains are preserved, with only localized formation of fine-grained material in areas where extensive cracking has occurred. Intra-granular cracks tend to be highly aligned within a given grain (Plate 4), possibly reflecting the strike of the basal plane. Some grains have more than one set of oriented cracks within them. With increasing strain (Plates 46, view b), crack density within grains increases, and these cracks tend to remain strongly aligned.
At the maximum strain (44%) (Plates 4–6, view c), few original grains remain intact. Between crossed polarizing filters, the sample appears as a mass of extremely fine-grained material surrounding a few large grains. Many of these large grains have a preferred alignment of c axes parallel to the loading direction (inferred from persistent optical extinction in horizontal thin sections as they are rotated). The addition of side lighting reveals that the fine-grained material corresponds with local dense concentrations of highly aligned cracks. Although this specimen did not rupture, the vertical section (Plate 6c) shows evidence of some localization on a plane, visible in the bulge at the lower right and upper left corners (relative to the sample axis). There is remarkable uniformity of texture throughout the specimen, even in the ice that has extruded around the platen. The grains directly adjacent to the platen remain slightly larger (possibly a result of non-uniform stress distribution), but this zone is only a few grain diameters wide.
Increasing the confining pressure to 15 MPa or higher results in suppression of microcracks as a dominant microstructural element. The sections shown in Plates 7–9 are typical of the non-ruptured samples from tests with P c > 5 MPa. Some cracking is visible in the sample subjected to 4% strain (Plates 7–9, view a), hut the crack density is significantly lower than in the specimens tested at low confinement. Fine-grained material forms initially at the grain boundaries. With increasing axial strain the fraction of fine-grained material increases (Plates 7–9, views b and c). The size of the fine grains is slightly larger than in the highly microcracked samples (Plates 4–6), and the grain boundaries are straight and regular. However, the texture consisting of isolated large grains in a fine-grained matrix is similar. In some cases, fine-grained material is clearly associated with cracks (as in the large black grain in Plate 8b). In general, however, these grains are untracked.
Macroscopic rupture occurred in a number of the specimens subjected to very high deviatoric stresses (s > 15 MPa) at confinements of > 15 MPa. Two such samples are shown in Plate 10. The sample tested at P c = 60 MPa and s = 15 MPa is shown in a vertical thin section (Plate 10a). Rupture occurred along a plane at approximately 45° to the axis, visible as the protrusion on the left edge and the bright cracks in the center. The two portions of the sample were fused together when the triaxial cell was opened. Slip along this plane is believed to have occurred only during the last stages of strain, as indicated by the small amount of offset visible along the fault and by the strain-rate history (Fig. 6b). The grain texture of this sample is similar to others deformed under high confinement, with a mixture of large and fine grains and very few cracks. When viewed with side lighting, only a few small cracks are visible along the trace of the fault plane itself In contrast, a sample which ruptured under conditions P c = 30 MPa and s = 30 MPa after only a small amount of strain (a few per cent) has extensive microcrack damage to grains throughout, and a zone of fine-grained material is adjacent to the fault plane (Plate 10b and c).
Average grain-sizes are plotted in Figure 12 as a function of the total axial strain to which the sample was subjected during testing. (Note: not all the samples were analyzed for grain-size.) The average grain diameter remains relatively high for the first few per cent of axial strain. It decreases significantly by 10% axial strain and then tends to stabilize with increasing deformation. Low (P c = 5 MPa) and high (P c >5 MPa) confinement tests are differentiated, as are the very highest deviatoric stress tests. The scatter in values from the undeformed samples indicates the variability of the starting material, rather than error in the measurements. The fine-grained samples marked by solid squares were made using snow as the seed ice. Though initial grain-size of these samples was smaller and more uniform than that of the standard specimens, the grain-size of the deformed sample does not differ significantly.
Plot of average grain diameter as a function of the total cumulative axial strain (in % true strain).

Discussion
We consider the mechanical behavior of the ice in relation to the microstructural changes observed in thin section, with a caution that the sections may not entirely reflect the state of the ice while it is under load. (The release of stress at the end of the test, and the time lag prior to thin-sectioning, may cause some additional microstructural changes, such as the quenching of melted regions, stress-relief cracking, static recrystallization, grain growth or crack healing.)
Microstructure
Much of the microstructural change in the initial stage of deformation is associated with grain boundaries, by cracking at low confinement and by nucleation of new grains at higher confinement. Grain-size decreases most dramatically during the first 10% axial strain. At high strains, the texture (consisting of a fine-grained mass surrounding isolated, large grains) is common to samples tested at all levels of confinement. Only the two specimens that ruptured after a very small amount of axial strain retained a strong signature of the original grain texture. We interpret the large grains as remnants which survived the initial breakdown of ice structure, possibly because they were not favorably oriented for either dense fracturing or recrystallization. As deformation proceeded and the surrounding material softened, the resolved shear stress on these large grains could in fact be quite small, allowing their preservation even with considerable sample strain.
Although the apparent mechanism by which the fine-grained material formed is quite different at low and high pressures (dense cracking vs dynamic recrystallization), there is no strong confining pressure dependence observed in the average grain-size (Fig. 12). Rather, the grain-size tends to be consistently related to the total accumulated axial strain. This conclusion is supported by work of Reference Melanson, Meglis, Jordaan and StoneMelanson and others (1999) in which samples were subjected to constant-strain-rate tests rather than constant-load tests. Those tests show a dependence of average grain-size on total axial strain similar to that in the creep tests presented here. Results from both these studies demonstrate that during the first few per cent of axial strain the most dramatic microstructural changes occur, the ice passes through its peak strength, the strain rates are at their lowest and the greatest variability in strain rates is observed.
Mechanical behavior
At all confining pressures, creep rates during the first few per cent of strain were relatively low. The differences in these rates among samples tested under the same nominal conditions may be a function of microstructural differences in the undeformed specimens, differences in test conditions such as confinement or temperature, or the occurrence of localization along rupture planes in some samples. However, the variations in time to accelerated creep among, for example, the samples tested at 15 MPa deviatoric stress are relatively small compared with the substantial influence of the deviatoric stress itself. The dramatic effects of prior damage are also evident, in the very short times within which the damaged samples reach accelerated creep.
In this work, results have been compared for samples that were subjected to several different loading paths: deformation by creep; deformation by creep following a damage step at a constant rate; and deformation at a constant axial strain rate (Reference Melanson, Meglis, Jordaan and StoneMelanson and others, 1999). With only a few exceptions, creep rates were remarkably similar among samples at specific levels of strain for a given deviatoric stress. They were relatively insensitive to how that level of strain had been attained. This leads us to conclude that the total strain accumulated during the prior load history of a sample is a strong factor in determining the creep rate at a given deviatoric stress. This conclusion is consistent with results from uniaxial tests on granular fresh-water ice by Reference ColeCole (1983) at lower strain rates and stresses, and with the work of Reference JackaJacka (1984), Reference Jacka and MaccagnanJacka and Maccagnan (1984) and Reference Jacka and Jun.Jacka and Li (1994), which demonstrated that an equilibrium grain-size and a grain fabric develop during tertiary creep of ice deformed to high strains in uniaxial tests. The final grain-size can represent a reduction or an increase in average grain-size, depending on the initial ice structure and test conditions. A characterization of previous stress history that focused on the effect of hydrostatic pressure during the test was given in Reference Jordaan, Matskevitch and MeglisJordaan and others (1999). This indicated an initial hardening with pressure related to suppression of cracking, and a subsequent softening that is believed to be related to the effect of pressure melting. Though we have not focused here on the pressure-dependence of creep rates, their findings are consistent with the present test results.
In the present study, the strain rate in a given sample increases by two to three orders of magnitude as the total axial strain increases. This is reflected in the mechanical properties of the test specimens by the drop in effective viscosity within the first 10% strain, correlating with the dramatic microstructural changes visible in thin sections. Yet, there is remarkably consistent power-law behavior among the entire suite of samples. The material does continue to soften (seen in the viscosities, which continue to decrease, and the creep rates, which continue to increase with strain), but the most dramatic softening corresponds to the initial breakdown of grain structure. In effect, the ice undergoes a transformation to a material with a new structure and different properties that responds to the stress conditions in a relatively predictable way.
The most significant exceptions to this pattern were the samples that ruptured. Among samples tested under the same stress conditions, the difference was, in most cases, evident early in the strain history. The samples which eventually ruptured tended to have higher strain rates early on, suggesting that localization associated with rupture began during the initial breakdown of the ice structure. Relatively small variations in the test temperature, differences in the magnitude of stress concentrations, or variability in the flaw or grain structure of the undeformed specimens may act alone or in combination to weaken the material at this stage of the deformation.
Deformation mechanisms/damage
Several deformation mechanisms are known to influence the mechanical behavior of ice under a range of load conditions. The importance of cracking, dynamic recrystallization and pressure melting in the deformation of ice has long been recognized (Reference GlenGlen, 1955; Reference Barnes and TaborBarnes and Tabor 1966; Reference Jonas and Müller.Jonas and Muller 1969; Reference Kheisin and CherepanovKheisin and Cherepanov,1973; Reference JonesJones, 1982; Reference Jones and Chew.Jones and Chew 1983; Reference Glen,. and IvesGlen and Ives, 1988; Reference Xiao, Jordaan and SinghXiao and others 1993).
In broad terms one may conclude on the basis of our results that cracking is the predominant damage mechanism at the lowest confining pressure, and dynamic recrystallizadon and melting at the higher pressures. However, observations of microstructural changes demonstrate that all three mechanisms combine under a wide range of load conditions to accommodate deformation. At low confinements, where cracks are a dominant microstructural element, grain-size reduction is not exclusively defined by the formation of cracks. The formation of new, smaller grains is intimately associated with both isolated cracks and dense arrays of cracks, but fine-grained regions that are clear of cracks are also found. The consistency in the constitutive behavior suggests that dynamic recrystallization may be acting in conjunction with the cracking even at low confinements to enhance creep rates. Furthermore, melting in ice under load can result from both pressure melting and frictional heating, as observed by Reference GagnonGagnon (1994) during laboratory compression tests. Melting may therefore also play a role in deformation at low confinements, where pressure melting would not be expected.
At the higher confining pressures, persistence of a few isolated cracks to very high strains within the large grains might suggest that some evidence would be seen if extensive cracking were occurring. Cracking followed by rapid healing may be occurring continuously within the fine-grained mass while these specimens are under load, particularly if local melt is also present. The release of stress and the quenching of specimens at the end of tests would obscure evidence of this process. Clearly the texture of these specimens is markedly different from that of specimens deformed at low confinement. Only direct observation of the samples under load (as done at lower confinements by Reference Rist and MurrellRist and others, 1994, for example) would establish conclusively that cracking is not occurring at the higher confinements.
Indirect evidence suggests that at the highest confinements, melting contributes to the deformation. First, the samples tested at high confinements were in some cases perfectly welded across the rupture plane by the time the sample was retrieved from the confining cell. Second, reducing the temperature by only 1° or 2°C for some of the higher-confinement tests resulted in deformation without rupture and lower creep rates. Third, the sample tested first at 5 MPa and then at 50 MPa confinement contained regions that were extremely fine-grained but perfectly clear, despite the fact that the initial deformation at low confinement would have caused extensive cracking. The occurrence of local melting under higher-confinement conditions is one explanation for all these observations.
We conclude therefore that the “damage” which results in the softening of these specimens cannot be quantified simply as, for example, a density of cracks. Rather, the softening may be more appropriately related to the deformation process that is activated while the specimen is under load. Elements such as the volume of grain boundary, the dislocation density and distribution, the density of transient cracks which occur and then heal under load and the volume of melt at the grain boundaries may all constitute damage. However, they are not easily quantified in thin sections at ambient pressure and therefore cannot be related in a straightforward manner to the dynamic condition of the sample while it is under load.
The behavior of ice has strong similarities with the deformation of metals at high homologous temperatures, due to the prevalence of dynamic recrystallization as a deformation mechanism (Reference Bailey and HirschBailey and Hirsch, 1961; Reference SellarsSellars, 1978). The results from our tests are also consistent with observations of strain localizations and brittle/ductile behavior at both large and small scales in rocks (Reference Derby, Barber and MeredithDerby, 1990). Mylonites, for example, are fine-grained rocks which occur localized in fault zones, are soft or weak relative to the surrounding intact rock and are believed to accommodate large shearing strains in fault zones (Reference Etheridge and WilkieEtheridge and Wilkie, 1979). There are many analogous deformational features seen in these laboratory ice samples. In field examples of deformation localization, evidence is present that the material within shear zones has experienced sufficient frictional heating to cause melting and extrusion of molten material (Reference Hobbs, Means and WilliamsHobbs and others, 1976; Reference ScholzScholz, 1990). Furthermore, a deformation mechanism analogous to pressure melting in ice is pressure solution in other rocks, in which local high stress concentrations enhance the chemical dissolution of material in the presence of pore fluids (Reference RajRaj, 1982). Therefore, studies of microstructural change in ice may have much wider implications for understanding the mechanisms of deformation and metamorphism in a variety of materials.
Significance in ice–structure interaction
Thin sections of iceberg ice deformed in field-scale impact test (Reference Muggeridge and JordaanMuggeridge and Jordaan, 1999) show extensive damage in the form of ice fragments, often rotated and offset along localized rupture zones, and larger zones that contain primarily fine-grained material. The microstructural changes observed in these samples, deformed under true impact conditions, are strikingly similar to those produced in some of the laboratory tests presented here.
The ejection of fine-grained crushed material from the contact zone has been observed during some field impact and indentation tests. While this crushed material is softer than intact ice, the work of Reference Singh, Jordaan, Xiao and SpencerSingh and others (1995) and the results presented here indicate that even soft, highly damaged ice is capable of sustaining, and therefore transmitting, high loads for short periods of time. In the context of ice–structure interaction, a significant amount of damage can be done to a vessel or structure in a short period of time by impact with an iceberg. Because of the complexity of this problem, the approach to modeling ice behavior during ice–structure interaction has involved deriving a workable constitutive relation from these and other laboratory tests, and then implementing it in finite element simulations of contact zones (Reference Jordaan, Matskevitch and MeglisJordaan and others, 1999).
Conclusions
This experimental study was undertaken to characterize the mechanical behavior and microstructural changes in ice subjected to stress conditions present in an ice–structure interaction zone. Results of triaxial creep tests under confining pressures up to 60 MPa, deviatoric stresses up to 25 MPa and axial strains up to 44% have been presented. Micro-structural characterization focused on those tests using a deviatoric stress of 15 MPa at low (5 MPa) and high (50 MPa) confinement.
In general, samples tested at a confining pressure of 5 MPa failed rapidly without rupture and contain dense microcrack populations. Samples tested at higher confining pressure deformed more slowly if the sample remained intact, or very quickly if the sample failed along a macroscopic rupture plane. In all cases, if the sample experienced more than a few per cent strain, substantial microstructural change was visible in thin sections. The original texture was replaced by a matrix of fine-grained material surrounding larger grains interpreted as remnants of the original grains. In samples tested at 5 MPa confinement, this fine-grained matrix was highly microcrackcd; in samples tested at high confinement, cracks were scarce.
The constitutive behavior of this ice obeys a power law when the strain rates are correlated with the deviatoric stress at the same levels of cumulative axial strain. The effective viscosity decreases from 107.8 to 106.4 with the initial 10% strain, correlating with the most substantial microstructural changes in the ice. At higher strain levels, the effective viscosity reaches a relatively stable value. The exponent representing the deviatoric stress dependence remains within the range 4.0–4.6. This behavior is notable given that the apparent deformation mechanism is quite different at low and high confinements. The time to accelerated creep, being another measure of the creep rate at low strains, also correlates very strongly with the deviatoric stress. Factors such as the temperature and confining pressure contribute to the variation in sample behavior at a given deviatoric stress. The exceptional cases were those samples which ruptured immediately, and those which had been subjected to a damage step prior to application of the creep load. In both cases these samples reached accelerated creep very quickly.
Several potential deformation mechanisms exist in ice under these conditions, including microcracking, pressure melting, melting caused by frictional heating, and recrystallization-enhanced creep. Microstructural observations suggest that all these elements are active over a range of stress conditions, though the relative importance of each is a function of the confinement, deviatoric stress level, total accumulated strain and temperature.
Acknowledgements
The authors wish to acknowledge funding by the Canada–Newfoundland Offshore Development Fund, the Natural Sciences and Engineering Research Council and the National Energy Board under the Program for Energy Research and Development. This work was possible due to the extensive support provided by the Institute for Marine Dynamics, National Research Council of Canada (NRC). We are grateful to R. E. Gagnon and S. J. Jones of the NRC and to P. Finlay and B. M. Stone of Memorial University of Newfoundland for their contributions to this research. The authors thank the reviewers for their constructive and useful comments.



