


1. Introduction
Equation of state (EOS) of matter at extreme thermodynamic states is of relevance for several fields in physics, especially in laboratory astrophysics and in inertial confinement fusion (ICF), where precise knowledge of the EOS is required. Water is predicted to be abundant in the outer planets of the Solar System, as well as in many of the recently discovered exoplanets. In particular, it is one of the principal ingredients of the mantles of giant planets such as Uranus, Neptune, and Jupiter [Reference Mazevet, Licari, Chabrier and Potekhin1]. The observation of large and asymmetric magnetic fields in these planets [Reference Ness, Acuña and Behannon2–Reference Chen, Na and Curry4] indicated that the mantle is the origin of the field. As the dynamo theory requires the presence of a conductive material, it was suggested that one or all of the main ingredients of the mantle (ammonia, water, and methane, i.e., carbon [Reference Wang, Zhang and Jiang5, Reference Jakubowska, Mancelli and Benocci6]) experience a phase transition to a conducting state. Pioneering theoretical work has been done calculating the properties of the superionic phase of water at planetary conditions [Reference Cavazzoni, Chiarotti, Scandolo, Tosatti, Bernasconi and Parrinello7–Reference French, Mattsson, Nettelmann and Redmer9]. Therefore, water at very high pressures has been extensively studied in recent works [Reference Mattsson and Desjarlais8, Reference Kimura, Ozaki and Sano10–Reference Nagayama, Mori, Shimada and Nakahara14]. Recently [Reference Millot, Hamel and Rygg15, Reference Millot, Coppari and Rygg16], the superionic phase of water was detected experimentally along the Uranus and Neptune isentropes at about 1.5 Mbar by laser shocking water samples precompressed up to 28 kbar. The new superionic phase is predicted to span the pressure range of 1.5 to 6 Mbars.
Superionic water is a solid system that has high ionic conductivity well below the melting temperature. Whether H2O in planetary interiors is in the superionic or metallic state is of great importance for understanding the source of the planetary magnetic field.
Laser-driven shock compression is a useful technique for generating high pressure and temperature conditions similar to the inner part of Neptune and Uranus. However, measuring P − ρ − T simultaneously is challenging, particularly temperature, as this requires absolute intensity measurements which are not necessary for the determination of the pressure or the density. In this work, we conducted laser-driven shock experiments on H2O samples up to 4.6 Mbar; along with pressure and density, we evaluated the temperature from measured reflectivity and thermal emission of the shocked sample.
The impedance mismatch (IM) method is widely used for the determination of Hugoniot of sample material. Given that one knows Hugoniot of a “standard” material that is used as a reference, the Rankine–Hugoniot (RH) [Reference Zel’dovich and Raizer17] set of equations, expressing the conservation laws, can be used to relate the experimentally measured shock velocity (D s ) in the standard material before the shock reaches the standard-sample interface in the sample after it passes through the interface. In this work, we used z-cut α-quartz (SiO2) as a reference material [Reference Knudson and Desjarlais18, Reference Brygoo, Millot and Loubeyre19] which, at ambient pressure, is transparent to visible light and becomes reflective at pressures above 1 Mbar [Reference Laudernet, Clérouin and Mazevet20]. As diagnostic tools, we used the velocity interferometer system for any reflector (VISAR) [Reference Celliers, Bradley, Collins, Hicks, Boehly and Armstrong21–Reference Barker and Schuler25] which allowed us to make a precise measurement of shock wave parameters and characterize the EOS of water. The RH set provides information of P and ρ, but not of T, whereas T is also an important thermodynamic parameter. Indeed, in this work, we also measured the temperature using streaked optical pyrometry (SOP) diagnostic data.
2. Experimental Setup
2.1. GEKKO XII-ILE Laser Facility
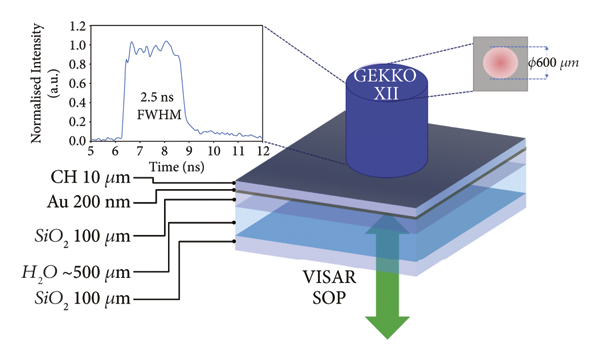
The first experiment was carried out on the HIPER (High-Intensity Plasma Experimental Research) laser facility, a uniaxial irradiation chamber of the GEKKO XII (GXII) laser at the Institute of Laser Engineering (ILE), Osaka University. Up to 12 beams of neodymium-doped yttrium aluminum garnet (Nd:YAG) laser, frequency tripled (351 nm), were used in the experiment. The laser pulse temporal profile was approximately square shape in time with full width at half maximum (FWHM) 2.5 ns with typical rise and fall time of 100 ps each. The focal spot diameter was 600 µm flat top. SSD (smoothing by spectral dispersion technique) was applied to smooth out the beams. Kinoform phase plates were also used to achieve uniform irradiation, resulting in good shock front planarity.
Figure 1 shows the experimental setup and target configuration. A typical target assembly consisting of 10 µm parylene (C8H8) will be referred to as CH/200 nm Au/100 µm quartz (with AR@1054&532 both sides) nominally, ∼500 µm water/100 µm quartz (with AR@1054&532 both sides). The laser initially hits the 0.1 µm-thick Al layer, coated over the CH layer, to avoid laser shine through. The CH layer is the actual ablator, and quartz is the pusher layer. The 200 nm gold layer was placed to stop any X-rays from the plasma corona and avoid preheating of water. Water cells were produced at the Technical University of Darmstadt (Germany) target fabrication department. Due to the low Z ablator and the low laser intensity, X-ray radiation is low and characterized by low photon energy. The Au layer is capable to stop the X-ray radiation; thus, preheating of water is negligible.
Experimental setup: sketch of the multilayered target design in planar geometry with its associated thicknesses used in our experiment. Drive laser from top. From bottom, the VISAR and SOP measure the shock velocity and the self-emission of the shocked sample on the rear side.
The primary diagnostics were the VISAR and SOP. Two line-imaging interferometers (VISARs) allow to record time-resolved Doppler shift of the velocity of the fast-moving reflector and also the optical properties such as reflectivity [Reference Celliers, Bradley, Collins, Hicks, Boehly and Armstrong21–Reference Yan, Liu and Zhang26]. These VISARs had different velocity-per-fringe (VPF) sensitivities to resolve the 2π-phase jump ambiguities due to the shock velocity jump at material interfaces. The sensitivity of the two VISARs was 7.523 km/s and 4.476 km/s taking into account the refractive index of SiO2. The VISAR probe beam was an injection-seeded Q-switched YAG laser. The pulse duration of the probe was ∼10 ns at the FWHM, and its wavelength was 532 nm. The postprocessing of the VISAR raw data obtained in the experiment allows determining [Reference Neutrino27] the fringe position to 10% of a fringe, while the multiple fringe shifts allow the precision of the shock velocity measurements to be a few percent. Our VISAR analysis showed uncertainties in measured D s of the order of 3%.
To measure the shock temperature, we used SOP [Reference Miller, Boehly and Melchior28–Reference He, Jia and Zhang30]. The self-emission of the shocked sample at wavelength 450 nm with 38 nm bandwidth was recorded spatially and temporally resolved, using an absolutely calibrated SOP.
2.2. PHELIX-GSI Laser Facility
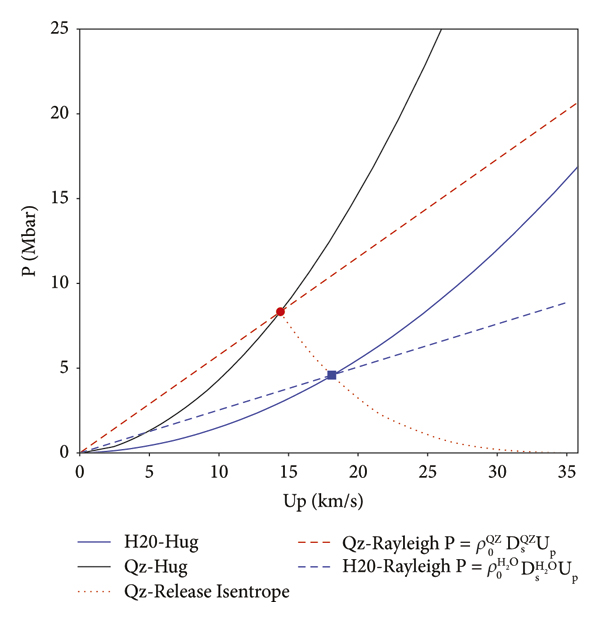
The second experiment was conducted at the GSI facility using the PHELIX laser, a flash-lamp-pumped Nd:glass laser utilizing the second harmonic at wavelength 527 nm. The spatial profile was flat top with spot 350 µm FWHM obtained by an appropriate phase plate [Reference Koenig, Faral, Boudenne, Batani, Benuzzi and Bossi31], and the temporal profile was top hat with a duration of 3.5 ns (FWHM). The laser was focused onto a multilayered target with intensity I 5.49 × 10¹² W/cm2 to 2.52 × 10¹³ W/cm2. The ablation pressure was approximately 12 Mbar, was generated in our plastic ablator (parylene with gross chemical formula C8H8), and was estimated from the well-known scaling laws [Reference Mora32–Reference Chen, Hu and Zhou34] for given intensities.
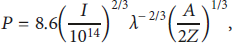
where A and Z are the atomic mass number and the atomic number of the target material: I is in W/cm2, P in Mbar, and λ in μm. A schematic of the PHELIX experimental setup is shown in Figure 2. Targets were also produced at the Technical University of Darmstadt (Germany) target fabrication department.
Experimental setup: a sketch of the multilayered target design at the PHELIX laser facility in planar geometry with its associated thicknesses used in our experiment. Drive laser from the top. Bottom: the VISAR and SOP diagnostics which measure the shock velocity and the self-emission of the shocked target on the rear side.
The target configuration and the experimental setup are presented in Figure 2. The sample consists of 15 µm C8H8 (parylene)/5 µm epoxy/10 µm Al/7 µm epoxy/100 µm quartz (with AR@1054&527 both sides) nominally, ∼500 µm water/100 µm quartz (with AR@1054&527 both sides). The laser initially hits the 0.1 µm-thick Al layer, coated over the CH layer, to avoid direct laser shine through. Epoxy was used to glue CH/Al and Al/quartz interfaces. The CH layer is the actual ablation layer, and quartz is the pusher layer. The 10 µm Al layer was placed to stop any X-rays from the plasma corona and avoid preheating of the quartz/water layers. The VISAR laser had a wavelength of 660 nm, and the associated sensitivities were 1.285 km/s/f and 4.7 km/s/f, respectively. Also, SOP was looking at the self-emission of the shocked target; however, here, we report only VISAR results and compare with findings on water samples from the GEKKO XII laser facility.
3. Impedance Mismatch Method: Single-Shock Data
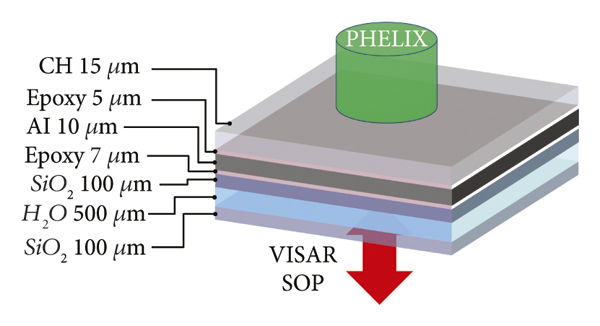
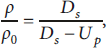
The impedance-matching method [Reference Wang, Zhang and Jiang5, Reference Zel’dovich and Raizer17–Reference Brygoo, Millot and Loubeyre19, Reference Marshall, Lazicki and Erskine35] was used to estimate the shock state in water after passing the quartz/water interface; an illustrative method is shown in Figure 3. Because of the impedance mismatch at the SiO2/H2O interface, the shock wave produced a transmitted shock into H2O and a reflected rarefaction wave propagating back into quartz. In the rarefaction wave, the shock-compressed quartz undergoes isentropic release until its pressure and particle velocity match those of shocked water. The IM method requires precise knowledge of Hugoniot and release behavior of the standard reference material (quartz in our case) and the Rankine–Hugoniot (RH) jump relations, which are derived from the conservation laws, mass, momentum, and energy to close the system and derive all the remaining thermodynamic parameters:where ρ,Ds,Up,P, and ε denote the density, shock velocity, particle velocity, pressure, and internal energy behind the shock. The initial states are denoted with subscript 0. The third equation plotted in the (P − U) plane gives the so-called Rayleigh line of the material. Figure 3 illustrates such a method, deriving the shock pressure in water and the particle velocity. The measurement of
 gives the shock state
 . The crossing of the isentropic release of the quartz standard with the Rayleigh line of the water sample determines the shock state in water
 .
.
P − Up graphical construction of the impedance mismatch procedure for the highest pressure shot of the quartz standard. The shocked state of H2O is constrained to remain on the incident Rayleigh line (blue dashed line) defined for
 for this case. The solid red and dashed lines are the Hugoniot and the Rayleigh line of (SiO2), respectively, associated with the release curve calculated for
 . The crossing of the Rayleigh line with the release isentrope path (blue square) determines the IM point and provides the experimental value of
 which may or may not lay on the shock polar for water, i.e., may (or may not) be in agreement with the used theoretical EOS.
4. Results and Discussion
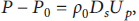
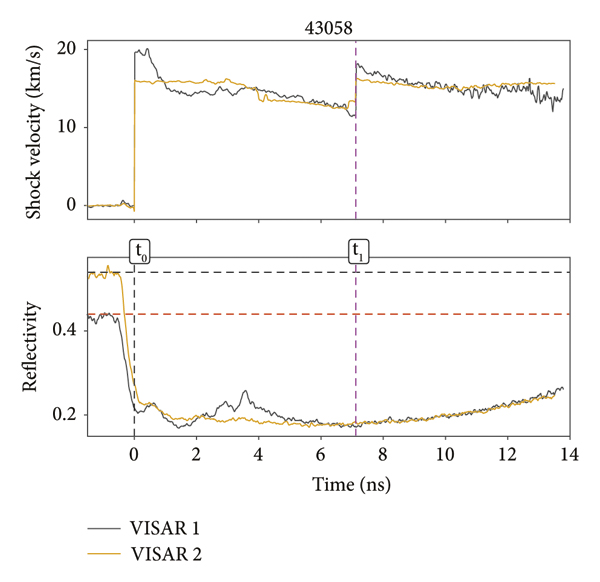
Figure 4 presents the raw data obtained with the VISAR for the shot SID-43058. The arrival time of the shock at the Au/SiO2 interface front side defines the time zero (t
0 = 0). Then, while the shock front enters into SiO2, it becomes highly reflective, and its velocity gradually decreases. It is indicated in the raw image with a dotted line as t
0. At t 1 = 7.21 ns, the shock front strikes the H2O layer as shown in Figure 4. The velocity profile and the reflectivity obtained from Figure 4 are shown in Figure 5. The transmitted shock in H2O also becomes reflective. The shock velocity in SiO2, used in the impedance mismatch analysis, was obtained by analysing VISAR images first by using shock chronometry, i.e., the average shock velocity in SiO2 was given by
 . Then, the analysis is refined by looking at the displacement of the fringe shift and averaging the shock velocities from the two VISAR records taking into account the temporal resolution of the streak camera and the sensitivities of each VISAR. The IM method is applied using the instantaneous value of the shock velocity just before t
1.
. Then, the analysis is refined by looking at the displacement of the fringe shift and averaging the shock velocities from the two VISAR records taking into account the temporal resolution of the streak camera and the sensitivities of each VISAR. The IM method is applied using the instantaneous value of the shock velocity just before t
1.
Experimentally obtained VISAR images for the shot SID-43058.
Top: evolution of the shock velocity in time for SiO2 and H2O extracted from Figure 4: VISAR-1 (black) and VISAR-2 (yellow). Bottom: the reflectivity vs. time. This shows an increase after the shock enters the SiO2 layer owing to the reverberating wave in SiO2 (at about t ≈ 3-4 ns), and a second increase appears when the shock passes the SiO2-H2O interface at time t 1. Shock velocities are listed in Table 1 (SID-43058).

To determine
 , we instead could rely only on the VISAR images. The experimental results were supported with numerical simulation utilizing MULTI-1D, which is a one-dimensional radiation hydrodynamic code [Reference Ramis, Schmalz and Meyer-Ter-Vehn36]. Simulations show that, in the present experiment,
 decays. We observe a decay in the case of
 . Detailed interpretation of simulations will be shown in Section 6.
Getting Hugoniot points for H2O requires that one knows the release isentrope (RI) of SiO2 from its shocked state. This study uses an EOS model to calculate the release isentrope for each shock state in SiO2 utilizing an in-house Python script. The IM method provides the Hugoniot state of H2O as the locus where the release isentrope of SiO2 crosses the Rayleigh line
 of water.
Such a method is shown in Figure 3, with the Hugoniot and the RI of SiO2 (black line and red dotted curve, respectively). Dashed lines denote the Rayleigh lines of SiO2 and water (red and blue), respectively, as well as their associated Hugoniot. The Hugoniot curve is derived from the SESAME database [37] and the QEOS [Reference More, Warren, Young and Zimmerman38], tabulated data 7385 for quartz and 7154 for water. The obtained shocked states of water are compared with other available works and are shown in Figure 6 in the P − ρ plane and in Figure 7 in the P − Up plane.
Water Hugoniot data in the P − ρ plane. Squared data points: our experimental points. The lines correspond to tabulated data from SESAME (SESAME 7150, 7153, and 7154 and P 0 = 10 kbar) [37]. Density functional theory-molecular dynamics (DFT-MD) calculations of Hugoniot of water form French et al. [Reference French, Mattsson, Nettelmann and Redmer9, Reference French, Desjarlais and Redmer39].

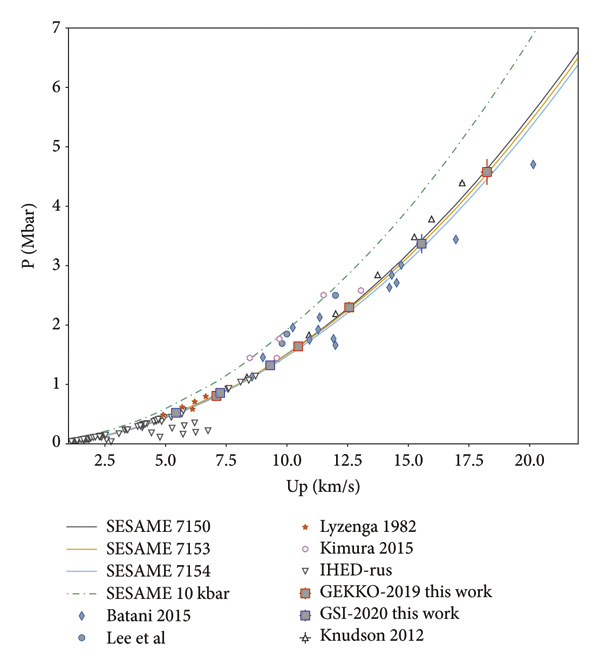
Water Hugoniot data in the P − Up plane. Our data showed good agreement with the SESAME models available for water.
5. Temperature Measurement
The shock front emits thermal radiation, and which, in our experiment, was collected by the SOP [Reference Miller, Boehly and Melchior28, Reference Bossi, Hall and Mahdieh44]. The absolute spectral radiance of the shock front was measured at a wavelength of 450 nm with bandwidth 38 nm. Assuming a grey body spectrum, the spectral radiance I (450 nm) is given by Planck’s black body emissivity corrected for the absorptivity of the material (ε = 1 − R) calculated using the reflectivity R of the shock front measured by VISARs since the light is either absorbed or reflected. Then,
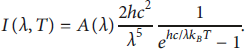
The temperature was determined using this formula (where h, c, and kB are Planck’s constant, speed of light, and Boltzmann’s constants, respectively). A(λ) is a parameter taking into account the reflectivity, the sensitivity of the streak, the geometry, and the collection optics path.
Solving equation (5) with respect to temperature, we get

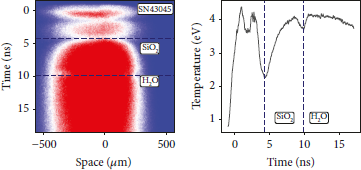
SOP calibration has been made in situ using the quartz standard (GEKKO XII) [Reference Guarguaglini, Hernandez and Okuchi42, Reference Sano, Ozaki and Sakaiya45]. For the temperature estimation, we used the mean reflectivity of the two VISAR records which were taken simultaneously for each shot. The results of SOP temperature estimation are shown in Figure 8 where we report two shots at different laser energies with the associated temperature profile in time (Figure 8(a)).
(a) SOP result for shot SN43045 at a laser energy of 1.1 kJ, the highest energy shot obtained in our experiment, and (b) temperature estimation taking into account the mean reflectivity of VISAR-1 and VISAR-2. The initial luminosity (t ≤ 4 ns) is due to scattered laser light.
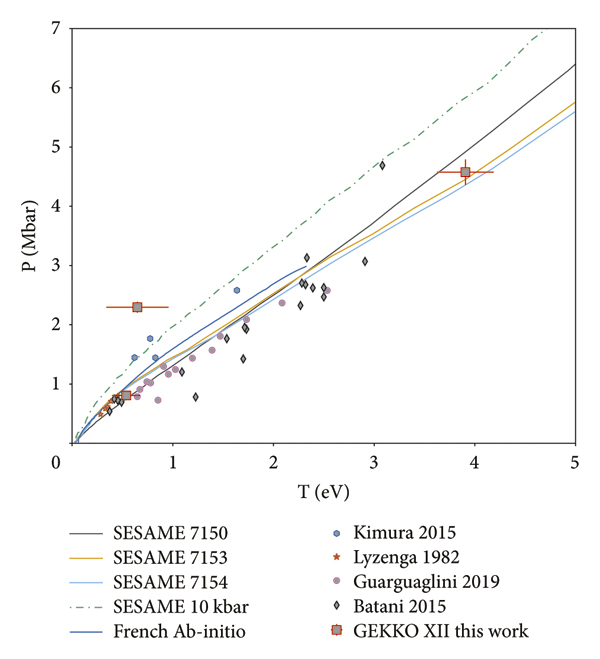
The temperature results as a function of pressure reaching the water interface are shown in Figure 9 together with results from Lyzenga et al. [Reference Lyzenga, Ahrens, Nellis and Mitchell41], Kimura et al. [Reference Kimura, Ozaki and Sano10], and Guarguaglini et al. [Reference Guarguaglini, Hernandez and Okuchi42] and Hugoniot tabulated curves based on SESAME models (SESAME 7150, 7153, and 7154 and P 0 = 10 kbar) and ab initio Hugoniot from French et al. [Reference French, Desjarlais and Redmer39].
Principal Hugoniot data in the P − T plane obtained in this study from the GEKKO XII-ILE laser facility, compared with Lyzenga et al. [Reference Lyzenga, Ahrens, Nellis and Mitchell41], Kimura et al. [Reference Kimura, Ozaki and Sano10], Guarguaglini et al. [Reference Guarguaglini, Hernandez and Okuchi42], and Batani et al. [Reference Batani, Jakubowska and Benuzzi-Mounaix43]. Also shown are SESAME models for three different tabulated EOS data at slightly different initial densities.
6. Hydro Simulations
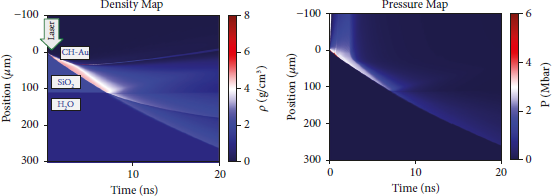
1D radiative hydrodynamic simulations were performed with MULTI-1D [Reference Ramis, Schmalz and Meyer-Ter-Vehn36] to comprehend our experimental results. The laser temporal profile of the pulse was flat top in time with a plateau duration of 2.5 ns at FWHM and rise and fall times of 0.1 ns. In the simulation, we utilized the SESAME tables of the following materials which consist of our target SESAME table 7770 for parylene [37], SESAME table 2700 for gold [37], SESAME 7385 for quartz [37], and SESAME tables 7150, 7153, and 7154 for water [37]. Concerning the water EOS, we compared different models of EOS tables coming from the SESAME database [37], from QEOS [Reference More, Warren, Young and Zimmerman38], and from FEOS [Reference Faik, Tauschwitz and Iosilevskiy46], in all cases setting the initial density at ρ 0 = 0.98 (g/cm3) in order to check the validity of the EOS data. The density and pressure map, reproducing the shot SID-43058 obtained from 1D simulation, is shown in Figures 10(a) and 10(b), respectively. Figure 10(c) shows the change of the maximum density postprocessed from Figure 10(a) at interval times, and Figure 10(d) shows the change of pressure along the shock front of the simulated target top (Figure 10(b)), respectively. The use of 1D simulation to interpret the experimental results is confirmed because of the use of appropriate phase plate resulting in a large focal spot (∼600 µm). In addition to this, the justification of the 1D approximation is supported by two experimental observations; such results can be seen in Figure 4 where good planarity of the shock is observed.
Raw data from VISAR images (see Figure 4) indicate that the shock breakout is quite flat both at metal/SiO2 and at SiO2/H2O interfaces. At this point, we must note that 2D effects will result in curvature, initially affecting the edges of the shock front, yet gradually advancing to the center. However, in our experimental results, the curvature of the shock front is not observed suggesting that the 2D effects in hydrodynamics can be neglected. In our case, the velocity of the shock is maintained and decaying quite slowly, and actually (within error bars), the decay obtained by analysing the VISAR images is compatible with the results of 1D simulations. The reduction of shock pressure and velocity during propagation is caused by two phenomena: (a) the release wave from the target front side catching up the traveling shock and (b) 2D effects in shock front propagation. In fact, due to the fair agreement of conducted experiment with 1D simulations, we conclude that (b) is not important. Indeed, a much faster decay of shock pressure and velocity would be expected if 2D effects were important.
Laser drive beam hits the target from the top as indicated by the arrow symbol; the constituent layers are also indicated with the right order (CH/Au/SiO2/water). (a) Hydrodynamic progression of the density map obtained from MULTI-1D reproducing the experimental results of shot SID-43058 with nominal laser intensity 1.4 × 10¹³ W/cm2; for this particular shot, 3 beams/12 were used for the main drive delivering a total of 252 J on the target. With the above laser parameter, the simulation reproduces well the shock breakout time in the SiO2-H2O inner interface. (b) Variation of the pressure map for the same shot conditions. (c) Time evolution of pressure and density forms MULTI simulation for shot SID-43058. (d) Change of pressure at the shock front up to the maximum simulation time.
7. Conclusion
In summary, we obtained EOS data of water along the principal Hugoniot up to 5 Mbar. Water samples, contained within a multilayered water cell, were dynamically compressed in planar geometry using the high-power laser facilities GEKKO XII (ILE) and PHELIX (GSI). Utilizing quartz as a standard material in both experimental campaigns and the main diagnostics such as VISAR/SOP substantially reduced experimental errors in optimized experimental conditions. The impedance mismatching analysis allowed to verify that P, ρ, (ε − ε 0, and the Hugoniot data are in fair agreement with those predicted by SESAME table 7150, and on the contrary, they show a significant difference concerning the Hugoniot curve calculated using DFT-MD simulations. Also, our experimental outcome showed good agreement with simulations performed with the radiative hydro code MULTI-1D using the SESAME tabulated EOS, the QEOS model, and the FEOS model, a modified version of the QEOS. The agreement with 1D simulations shows indeed that, in our experimental setup, 2D effects in hydrodynamics are negligible, a result which mainly depends on the use of laser focal spots. For a few shots, we could also measure the temperature of shocked material using calibrated SOP diagnostics. Our data confirm previous experimental results and show that, in the pressure range up to 4.6 Mbar, water is in a reflective state.
Data Availability
The data that support the findings of this study are available from the corresponding author upon reasonable request.
Disclosure
This work has been carried out within the framework of the EUROfusion Consortium. The views and opinions expressed herein do not necessarily reflect those of the European Commission. Our findings were presented at the Satellite Meeting of the 47th European Conference on Plasma Physics.
Conflicts of Interest
The authors declare that they have no conflicts of interest.
Acknowledgments
The authors would like to acknowledge the support of the laser technical team at GEKKO XII (ILE) and PHELIX (GSI). This work received funding from the Euratom Research and Training Program 2014–2018 and 2019-2020 (Grant agreement no. 633053). The involved teams were operated within the framework of the Enabling Research Project ENR-IFE19.CEA-01, Study of Direct Drive and Shock Ignition for IFE: Theory, Simulations, Experiments, Diagnostics Development. JIHT RAS team members were supported by the Ministry of Science and Higher Education of the Russian Federation (State Assignment no. 075-00460-21-00).


 Open access