




1. Introduction
In contests, agents spend resources attempting to secure a valuable prize. Examples include R&D competition, lobbying, political campaigns, competition for promotion or bonuses in organizations, and sports. Many contests are sequential, with some agents making investment decisions later than others. In this case, information about prior investments can play a crucial role.
In this paper, we study experimentally sequential contests in which players make investments in stages, and after each stage prior investments are revealed. Hinnosaar Reference Hinnosaar(2024) has proposed a novel approach to the subgame-perfect Nash equilibrium (SPNE) analysis of sequential contests that yields two major predictions. First, aggregate investment should increase with the granularity of information revealed. That is, for a given total number of participants, introducing more sequential stages leads to an increase in aggregate investment. Second, there is a universal earlier-mover advantage: In any sequential contest with three or more participants earlier movers invest more, win more often and earn higher payoffs than later movers. We test these predictions using a laboratory experiment.
In the experiment, we utilize a between-subject design to compare behavior in all possible sequential contests of three players. There are four treatments – (3), (1,2), (2,1), and (1,1,1) – where the dimension of each vector 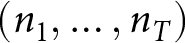 $(n_1,\ldots,n_T)$ is the number of stages, and components nt give the number of players making investment decisions at stage t. Treatment (3) is the standard simultaneous-move contest, (1,1,1) is fully sequential, and the other two treatments are in between. We use the lottery contest success function (CSF) of Tullock Reference Tullock, Buchanan, Tollison and Tullock(1980) to determine the probability of each player winning given the final vector of investments.
In the SPNE, aggregate investment increases in the number of stages, and earlier-mover advantage is predicted in all sequential treatments. These predictions rely heavily on behavior being consistent with backward induction; yet, it is well documented that human subjects are generally bad at backward induction, especially in longer games (e.g., McKelvey & Palfrey, Reference McKelvey and Palfrey1992; Fey et al., Reference Fey, McKelvey and Palfrey1996; Binmore et al., Reference Binmore, McCarthy, Ponti, Samuelson and Shaked2002), although hyper-rational subjects may be very good at it (e.g., Palacios-Huerta & Volij, Reference Palacios-Huerta and Volij2009). It is, therefore, reasonable to expect that at least some parts of the SPNE predictions will fail in our experiment, especially because the contest game is arguably more complex than the centipede or alternating offer bargaining games those earlier studies are based on. However, it is not clear a priori how exactly the SPNE predictions may fail. It is well known, for example, that, on average, subjects tend to invest substantially above equilibrium in contest experiments (e.g., Sheremeta, Reference Sheremeta2013). Will such overbidding continue in sequential contests? Will earlier movers or later movers overbid even more, or will some of them perhaps underbid? What consequences (if any) will those deviations from the SPNE have for aggregate effort in various sequential scenarios? A controlled laboratory experiment allows us to answer these questions and explore the underlying behavioral mechanisms.
The idea that earlier movers have a strategic advantage in markets goes back at least to Stackelberg who studied sequential duopoly with linear demand.Footnote 1 However, due to a peculiar shape of best responses, there is no impact of sequential moves on equilibrium investment in two-stage Tullock contests of two players (Linster, Reference Linster1993).Footnote 2 Thus, three is the minimum number of players for which sequential moves produce any differences in equilibrium. Exploring multi-stage contests with more than two players is technically challenging, and until recently only results for several special cases were available (Dixit, Reference Dixit1987; Glazer & Hassin, Reference Glazer and Hassin2000; Kahana & Klunover, Reference Kahana and Klunover2018). The inverse best response approach of Hinnosaar Reference Hinnosaar(2024) allows for a systematic analysis of a wide class of arbitrary multi-stage games, including contests.
While the experimental literature on behavior in contests is vast (for a review see, e.g.,Dechenaux et al., Reference Dechenaux, Kovenock and Sheremeta2015), the literature on sequential contests is rather scarce. Fonseca Reference Fonseca(2009) compared behavior in two-player sequential and simultaneous-move contests, focusing primarily on the effect of heterogeneity in players’ abilities. In his baseline treatments with symmetric players, Fonseca Reference Fonseca(2009) observed behavior consistent with the neutrality prediction of Linster Reference Linster(1993), that is, no differences in investment between simultaneous and sequential contests. Nelson Reference Nelson2020 studied entry deterrence in two-player and three-player sequential contests. The goal of that study was to test the prediction of Linster Reference Linster(1993) and its breakdown when transitioning from two to three players. However, motivated by third-party entry in political competition with two stable incumbent parties, Nelson Reference Nelson2020 only considered one type of three-player sequential contests – those involving two first movers.Footnote 3 In the present paper, we reuse data from two three-player treatments of Nelson Reference Nelson2020 – simultaneous and (2,1) – and add two other treatments – (1,2) and (1,1,1) – to consider all possible move sequences and directly test the predictions of Hinnosaar Reference Hinnosaar(2024).
The rest of the paper is structured as follows. Section 2 summarizes the theoretical model and main predictions, and Section 3 presents the experimental design. Results are reported in Section 4, and discussed in Section 5.
2. Theory and predictions
We consider sequential contests of n = 3 symmetric, risk-neutral players 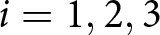 $i=1,2,3$ choosing investments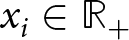 $x_i\in\mathbb{R}_+$. Investments are made in stages, and at the beginning of each stage all prior investments are revealed. The winner of the contest is determined after all three players made their investment decisions. The probability of player i winning is given by the lottery contest success function (CSF) of Tullock Reference Tullock, Buchanan, Tollison and Tullock(1980),
 \begin{equation}
p_i = \left\{\begin{array}{ll}
\frac{x_i}{\sum_{j=1}^n x_j}, & \text{if } \sum_{j=1}^n x_j \gt 0 \\[3ex]
\frac{1}{n}, & \text{if } \sum_{j=1}^n x_j=0\\
\end{array}\right.
\end{equation}
\begin{equation}
p_i = \left\{\begin{array}{ll}
\frac{x_i}{\sum_{j=1}^n x_j}, & \text{if } \sum_{j=1}^n x_j \gt 0 \\[3ex]
\frac{1}{n}, & \text{if } \sum_{j=1}^n x_j=0\\
\end{array}\right.
\end{equation}The winner receives a prize V > 0, and all players lose their investments.
A sequence of moves in a contest of n symmetric players is completely characterized by a T-dimensional vector  $\textbf{n}=(n_1,\ldots,n_T)$, where $T\ge 1$ is the number of stages,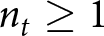 $n_t\ge 1$ is the number of players making investment decisions at stage t, and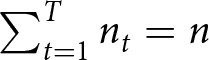 $\sum_{t=1}^Tn_t=n$. For n = 3, there are four possible sequences: (3) is a one-stage simultaneous-move contest, (1,2) and (2,1) are two-stage Stackelberg-like contests with one leader and two followers, and with two leaders and one follower, respectively; finally, (1,1,1) is a three-stage contest where one player makes a decision at each stage.
The solution concept is subgame-perfect Nash equilibrium (SPNE). Let X denote aggregate equilibrium investment in a sequential contest n with unit prize. Following the inverse best response method developed by Hinnosaar Reference Hinnosaar(2024), X can be calculated as the largest root of the equation 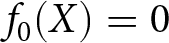 $f_0(X)=0$, where functions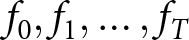 $f_0,f_1,\ldots,f_T$ are obtained recursively using the relation $f_{t-1}(X) = f_t(X)-n_tf'_t(X)X(1-X)$, with terminal condition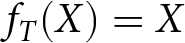 $f_T(X)=X$. Individual equilibrium investment of players making decisions at stage t can then be found as $x_i^* = \frac{1}{n_t}[f_t(X)-f_{t-1}(X)]$. In the experiment, we use n = 3 and prize V = 240. The resulting individual and aggregate equilibrium investment is shown in Table 1. We follow the convention that player i (weakly) precedes player j for i < j. Based on Table 1, there are two main predictions: the first one describes the ranking of aggregate investment across treatments, and the second characterizes the preemptive behavior of early movers.
Prediction 1.
Let Xk denote the observed aggregate investment in treatment k. Then  $X_{(3)} \lt X_{(1,2)}=X_{(2,1)} \lt X_{(1,1,1)}$.
SPNE predictions and summary statistics

Notes: Investments are averaged using data from all rounds. Standard errors clustered by matching group in parentheses.
Prediction 2.
Earlier movers in treatments (1,2), (2,1) and (1,1,1) invest more than later movers, and more than players in (3).
3. Experimental design
3.1. Preliminaries
The experiment followed a between-subject design with four treatments corresponding to the four possible move sequences in three-player contests. A total of 333 subjects (64% of them female) were recruited using ORSEE (Greiner, Reference Greiner2015) from the population of ∼3000 students at Florida State University who, preregistered for participation in social science experiments. There were 81, 90, 81, and 81 subjects in treatments (3), (1,2), (2,1), and (1,1,1), respectively. A total of 21 sessions with 9 or 18 subjects each were conducted in the XSFS Lab at FSU, with subjects making decisions at visually separated computer terminals. The experiment was implemented in zTree (Fischbacher, Reference Fischbacher2007). On average, sessions lasted ∼60 minutes, and subjects earned $21.17 including a $7 participation payment.
3.2. Procedures
Each session consisted of three parts. Instructions for each part were distributed on paper at the beginning of that part and read out loud by the experimenter (sample instructions are available in Online Appendix A). In Part 1, subjects’ risk attitudes were assessed using the method of Holt & Laury Reference Holt and Laury(2002). Subjects made 10 choices between two lotteries,  $A=({\$}2.00,\, {\$}1.60;p,1-p)$ and $B=({\$}3.85,\,{\$}0.10;p,1-p)$, with p taking values $0.1,0.2,\ldots,1.0$. The outcomes of this part were withheld until the end of the session when one of the 10 choices was selected randomly and played out for actual earnings.
In Part 2 – the main part of the experiment – subjects were randomly divided into fixed matching groups of 9 and only interacted within those groups. Subjects went through 25 identical rounds of the contest game with moves sequenced, and information revealed across stages, according to the treatment. Roles were randomly assigned and fixed. At the beginning of each round, subjects within each matching group were randomly matched into groups of 3. Each subject was given an endowment of 240 points, and could invest any integer number of points between 0 and 240 into the contest. After all subjects made their investment decisions, one winner within each group was randomly determined according to CSF (1). The winner received a prize of 240 points, and all subjects lost their investments. One round of the 25 was chosen at the end of the session to base subjects’ actual earnings on, at the exchange rate of 20 points = $1.
In Part 3, we administered a short questionnaire. Subjects reported their gender, age, major, and self-assessed competitiveness measured on a Likert scale from 1 (“much less competitive than average”) to 5 (“much more competitive than average”). After Part 3, earnings from all parts were calculated and revealed, and subjects were paid privately by check.
4. Results
Table 1 shows average individual and aggregate investments by treatment, along with the SPNE predictions. Individual investment xi is indexed by 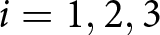 $i=1,2,3$, where player i makes a decision no later than player j for i < j. In what follows, we employ both parametric and nonparametric tests, with clustering at the matching group level in the former and matching group as the unit of observation in the latter. Thus, unless stated otherwise, the number of independent observations is either 9 or 10 for within-treatment comparisons and 18 or 19 for comparisons between any two treatments. All tests are two-sided.Footnote 4
4.1. Aggregate investment
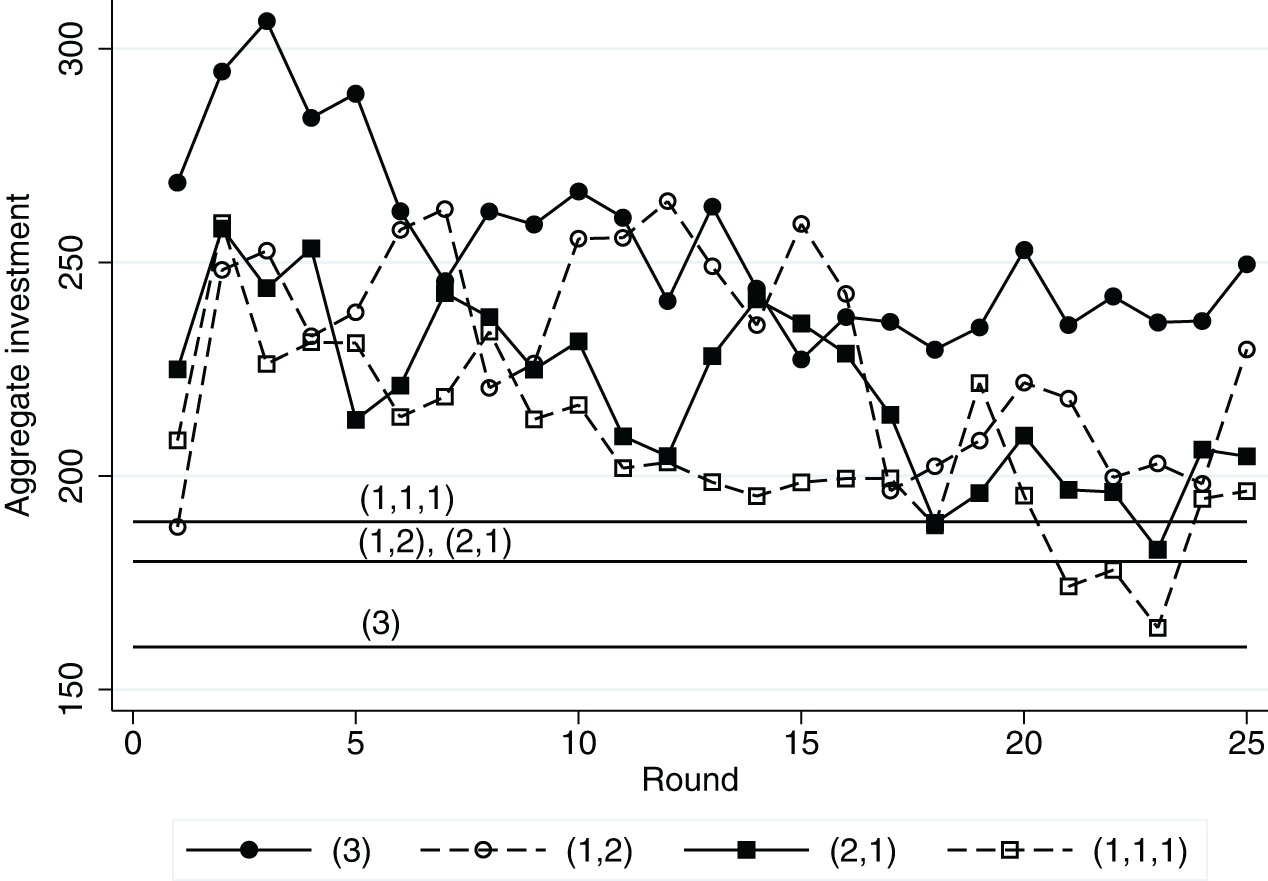
We start with the analysis of aggregate investment, X. As seen from Table 1, the observed averages over all rounds exceed the SPNE predictions. The difference is statistically significant in all treatments except (1,1,1) (p = 0.001, 0.006, 0.019, and 0.295 for (3), (1,2), (2,1), and (1,1,1), respectively, the Wald test). Such excessive investment (often termed “overbidding”) is rather standard for contest experiments (see, e.g., a review by Sheremeta, Reference Sheremeta2013). Figure 1, showing average aggregate investment by round, indicates that overbidding declines over time. A negative time trend is significant in linear regressions of investment on Round in all but one treatment (p = 0.012, 0.170, 0.048, and 0.018, same order as above, the Wald test). As a result, (3) is the only treatment where statistically significant aggregate overbidding is sustained in the last five rounds of the experiment (p = 0.001, 0.118, 0.196 and 0.643, same order as above, the Wald test).
Average aggregate investment as a function of time, by treatment. The horizontal lines show the SPNE predictions

More importantly, Table 1 and Figure 1 show that aggregate investment appears to decline in the number of stages. The decline in investment from one treatment to the next is not large enough to register statistically significant differences between adjacent treatments pairwise,Footnote 5 but the overall decline is significant, especially in later rounds, as evidenced by the Jonckheere–Terpstra test for trend across the four treatments (p = 0.071 for all rounds, 0.036 for the last 10 rounds, and 0.011 for the last 5 rounds; N = 37 and 4 groups in all cases).
Result 1:
Aggregate investment decreases in the number of stages, more so in later rounds.
Result 1 is in striking contradiction to Prediction 1 stating that aggregate investment should increase with the number of stages. We look at individual investment for clues on why we observe this pattern. Given the presence of substantial dynamics in the data (cf. Figure 1), in what follows we restrict attention to the last five rounds to focus on the converged behavior of experienced subjects.
4.2. Individual investment
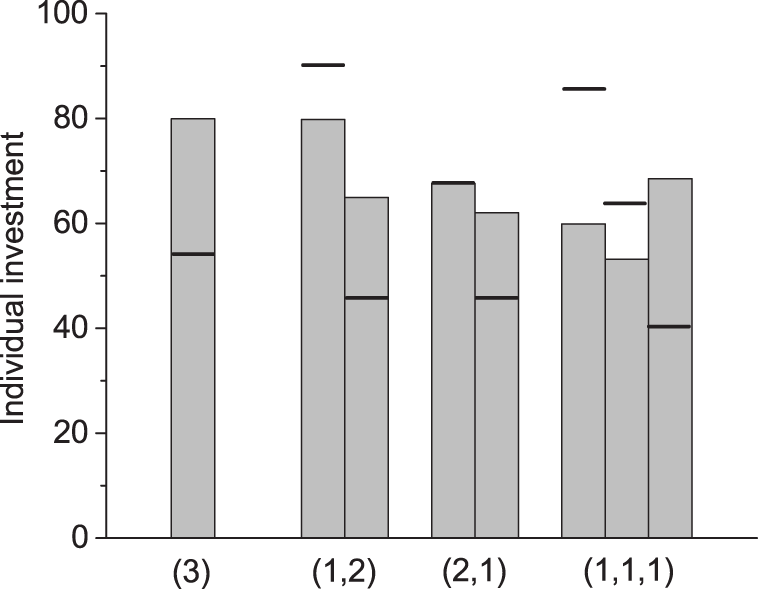
Average individual investment by treatment and role, using data from the last five rounds, is shown in Figure 2. First, we compare individual investment to the SPNE predictions.Footnote 6 In the simultaneous treatment (3), there is significant overbidding of about 50% (p < 0.001, the Wald test), consistent with most other contest experiments. In contrast, in the sequential treatments whether or not overbidding is present depends on the role. In (1,2) and (2,1), first movers’ investment is in line with the SPNE (p = 0.392 and 0.984, respectively, the Wald test), while second movers overbid significantly (p = 0.005 and 0.045, respectively, the Wald test). In (1,1,1), first movers underbid (p = 0.027, the Wald test), second movers are in line with the SPNE (p = 0.206, the Wald test), and third movers overbid (p = 0.002, the Wald test).
Average individual investment, by treatment and move order, using data from the last five rounds of the experiment. The horizontal black lines show the SPNE predictions
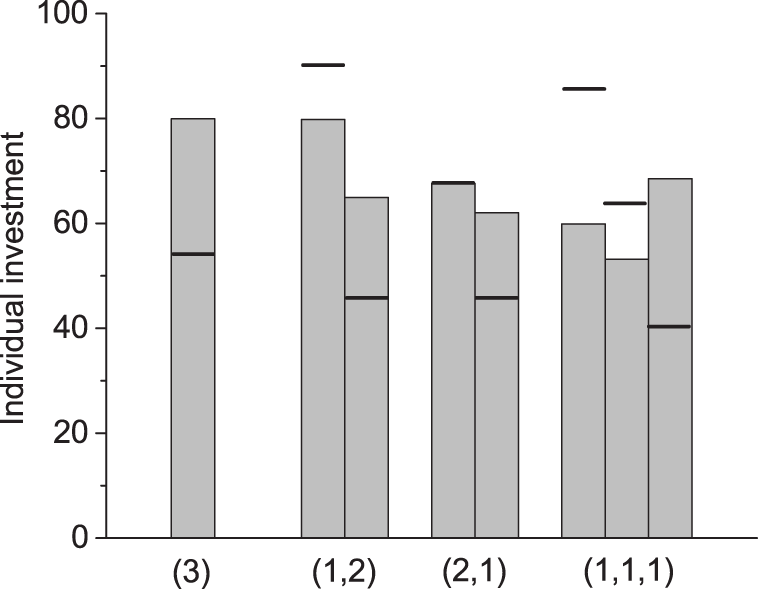
Comparing investment by players in different roles within each of the sequential treatments, we find no statistically significant differences between the bids of first and second movers (p = 0.226, 0.638, and 0.549 in (1,2), (2,1), and (1,1,1), respectively, the Wald test). Third movers in (1,1,1) invest similar to first movers (p = 0.463, the Wald test) and above second movers (this difference is only marginally significant, p = 0.085, the Wald test). We also compare average individual investment in (3) to the investment of early movers in the sequential treatments. There are no statistically significant differences between investment in (3) and first movers’ investments in (1,2) and (2,1) (p = 0.991 and 0.138, respectively, the Wald test). However, both first and second movers in (1,1,1) invest less than subjects in (3), although the latter difference is only marginally significant (p = 0.006 and 0.075, respectively, the Wald test).
Result 2:
(a) First movers and second movers invest similarly in the sequential treatments. Third movers in (1,1,1) invest more than second movers.
(b) First movers in (1,2) and (2,1) invest at the same level as subjects in (3); first and second movers in (1,1,1) invest less than subjects in (3).
Result 2 provides no support for Prediction 2 stipulating preemptive behavior by early movers and accommodation by later movers in the sequential treatments. Instead, first movers in these treatments bid at the level of subjects in (3) or less, while later movers tend to match the investment of early movers. We will now present ex post analysis exploring potential explanations for this behavior.
4.2.1. Joy of winning
Competitive preferences, such as joy of winning, received considerable attention in the contest literature and have been used to explain many experimental findings (e.g.,Sheremeta, Reference Sheremeta2013, Rockenbach & Waligora, Reference Rockenbach and Waligora2016). For example, overinvestment in (3) is consistent with a basic joy of winning model positing that in addition to the monetary prize V there is a nonmonetary reward for winning w, so that the total effective prize in the contest is V + w (e.g.,Goeree et al., Reference Goeree, Holt and Palfrey2002). Using average individual investment in (3) in the last five rounds, 79.94, we estimate w = 119.73, about 50% of the monetary prize.Footnote 7 Assuming that the same joy of winning is present, on average, in the sequential treatments,Footnote 8 we derive the corresponding SPNE predictions adjusted for joy of winning. These, along with average individual and aggregate investments in the last five rounds, are presented in Table 2.
Since the joy of winning correction is simply a multiplier on the SPNE predictions from Table 1, the predicted comparative statics across treatments and roles are preserved. It is, however, instructive to look at the point predictions. As seen from Table 2, aggregate investment in the sequential treatments falls short of the adjusted predictions (p < 0.01 in all cases). This is due to significant underinvestment by early movers (p < 0.01 for first movers in all the treatments and for second movers in (1,1,1)). In contrast, second movers in (1,2) and (2,1), and third movers in (1,1,1) invest in line with the adjusted SPNE (p = 0.651, 0.473 and 0.205, respectively).
SPNE predictions adjusted for joy of winning and average investments
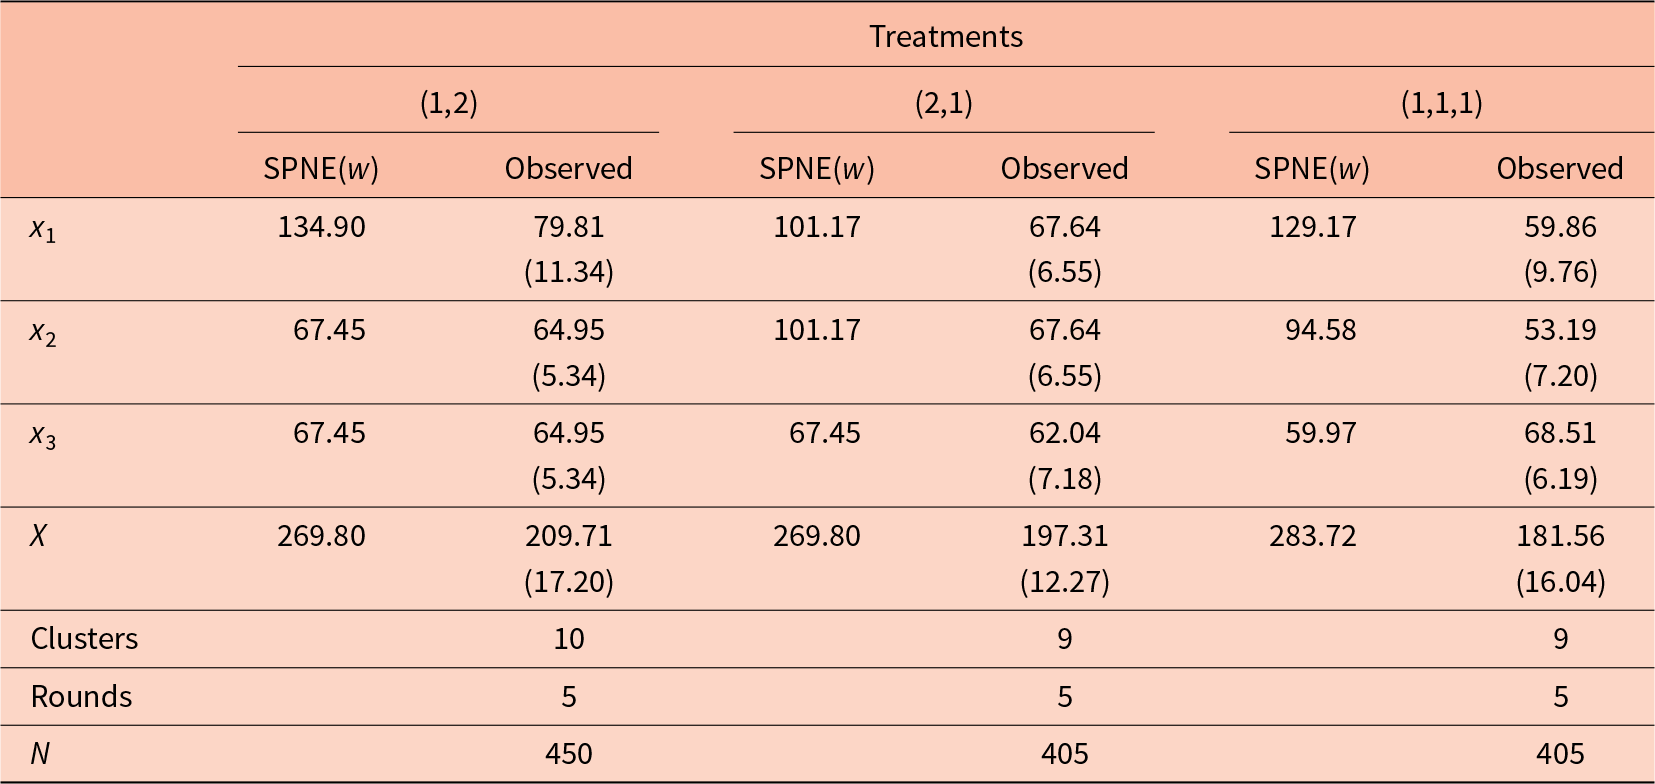
Notes: Joy of winning is calibrated using data from treatment (3). Investments are averaged using data from the last five rounds. Standard errors clustered by matching group in parentheses.
4.2.2. Preemptive investment by first movers
The results in Table 2 suggest that underinvestment by early movers is the main source of the reversal of the SPNE comparative statics. One potential explanation is that early movers fail to preempt; that is, they do not optimally incorporate possible responses by later movers into their investment decisions. To explore this further, we estimate later movers’ response functions of the form  $r_2=\beta_0+\beta_1m_1+\gamma_1m_1^2+u_2$ for second movers and $r_3=\beta_0+\beta_1m_1+\gamma_1m_1^2+\beta_2m_2+\gamma_2m_2^2+u_3$ for third movers.Footnote 9 Here, r 2 and r 3 are the later movers’ investments, m 1 and m 2 are the investments by earlier movers those later movers observe in the corresponding sequential treatments, and u 2 and u 3 are idiosyncratic errors.Footnote 10 Table 3 presents the results of pooled OLS regressions estimating the response functions using data from the first 20 rounds.
Estimated linear-quadratic response models for later movers

* Notes: Pooled OLS regression results based on data from the first 20 rounds, by treatment. Standard errors clustered by matching group in parentheses. Significance levels: p < 0.1, ** p < 0.05, *** p < 0.01.
As seen from Table 3, the linear effects of earlier movers’ investment are positive and the quadratic effects are negative in all treatments, with the exception of (1,2) where the quadratic effect is positive but also very small. Almost none of the estimates are statistically significant, indicating a large amount of noise; nevertheless, the presence of negative quadratic effects points at nonmonotone responses, with estimated turning points at  $m_1=62.25$ and 71.96 for second movers in (2,1) and (1,1,1), respectively; and at $m_1=83.10$ for third movers in (1,1,1).Footnote 11
With the estimated response functions in hand, we compute the optimal preemptive investment by first movers. The idea is that during the first 20 rounds first movers learn, by observing contest outcomes, how the population of later movers responds to their investment decisions. We also include the joy of winning correction. For example, for treatment (1,2) this computation entails solving
 \begin{equation*}
\max_{x_1\in[0,240]} \frac{(240+119.73)x_1}{x_1+2r_2(x_1)} - x_1,
\end{equation*}
\begin{equation*}
\max_{x_1\in[0,240]} \frac{(240+119.73)x_1}{x_1+2r_2(x_1)} - x_1,
\end{equation*} where it is assumed that the two second movers behave symmetrically, and  $r_2(\cdot)$ is the estimated linear-quadratic response function with coefficients from Table 3.Footnote 12 The resulting optimal investments for first movers are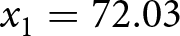 $x_1=72.03$ ( $\text{SE}=14.32$), 83.11 ( $\text{SE}=11.27$), and 82.44 ( $\text{SE}=36.72$) in (1,2), (2,1), and (1,1,1), respectively.Footnote 13 Second movers’ optimal investment in (1,1,1), according to their estimated response function, is 67.60. Comparing these to the average investments in the last five rounds by first movers,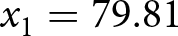 $x_1=79.81$, 67.64, and 59.86, respectively; and by second movers in (1,1,1), $x_2=53.19$ (see Table 2), we observe that subjects in the role of early movers adjust pretty well to the behavior of later movers in (1,2) (p = 0.670, the two-sample z-test). Investment is somewhat lower than optimal in (2,1) and (1,1,1), although there is so much noise in the estimates of optimal investments that those differences are not statistically significant (p = 0.235 and 0.552, respectively, the two-sample z-test).
4.2.3. Reciprocity and learning/strategic teaching
What can explain the behavior of later movers? Despite finding in the previous section that first movers are not that far off anticipating the behavior of later movers, the latter do not invest substantially above the joy of winning-adjusted SPNE, on average (see Table 2). Thus, later movers do not invest that aggressively on average; they do, however, respond aggressively to earlier movers’ investments. In fact, later movers may be interested in strategically teaching earlier movers to invest less.
A striking feature of Figure 2, confirmed by Result 2, is that differences in investments between subjects in different roles in the sequential treatments are less than predicted, if at all present. In other words, contrary to the SPNE predictions, average investments are very similar. Thus, later movers’ behavior can be explained by other-regarding preferences, namely, inequality aversion and reciprocity (e.g.,Fehr & Schmidt, Reference Fehr and Schmidt1999; Bolton & Ockenfels, Reference Bolton and Ockenfels2000; Charness & Rabin, Reference Charness and Rabin2002; Cox et al., Reference Cox, Friedman and Gjerstad2007). These subjects can earn more, in expectation, by investing less than first movers. The gain from such a reduction in investment would, however, be lower for them than for the first movers; hence, sufficiently inequality averse second movers would prefer to equalize investments (and payoffs) instead.Footnote 14 Matching investment can also be interpreted as a form of (negative) reciprocity: If a second mover believes the first mover is too aggressive, she may be willing to reciprocate.Footnote 15
5. Discussion and conclusions
The observed behavior is not consistent with the SPNE (adjusted for joy of winning or not), and the results on aggregate investment are essentially the opposite of the comparative statics predictions of Hinnosaar Reference Hinnosaar(2024): The largest aggregate investment is observed in the simultaneous-move treatment (3), and it declines in the number of stages. Most of these deviations can be explained by a combination of joy of winning and reciprocity.
At first glance, the reduction in investment in the sequential treatments is mostly due to first movers investing substantially below the (joy of winning-adjusted) SPNE predictions. Our analysis of responses by later movers to first movers’ investments reveals that those responses are overly aggressive, teaching the first movers to invest less over time. In treatment (1,2), the resulting investment by first movers in the last five rounds of the experiment is, in fact, consistent with optimization taking the empirical responses of later movers into account (and correcting for joy of winning). In treatments (2,1) and (1,1,1), early movers’ investment is lower than optimal; however, while the differences are substantial, they are not statistically significant. Later movers’ responses are consistent with reciprocity. A similar cautious behavior by first movers and reciprocal responses by second movers have been observed in Stackelberg duopoly experiments by Huck et al. (Reference Huck, Müller and Normann2001, Reference Huck, Müller and Normann2002) and Huck & Wallace Reference Huck and Wallace(2002), although in those studies aggregate output in Stackelberg markets was still higher than in Cournot (simultaneous-move) markets.
It is, of course, not clear what would have happened had first movers remained more aggressive despite the response they encountered. Later movers could have escalated investment even more, or they could have eventually accommodated.Footnote 16 In either case, aggregate investment would likely have increased in the sequential treatments, and the comparative statics of the SPNE would have been preserved.
To conclude, we argue that, ultimately, the failure to produce aggregate investment in line with the SPNE comparative statics is due to the cautious bidding by first movers that is, in turn, caused by reciprocal behavior of later movers. This study was designed to only test the basic comparative statics of the SPNE, and cannot address the underlying causes too deeply. Further investigation of sequential contests, for example, studying longer games and carefully controlling for strategic sophistication, competitive preferences, and other-regarding preferences, can be of interest.
Supplementary material
The supplementary material for this article can be found at https://doi.org/10.1017/esa.2025.4.
Acknowledgments
We are grateful to the editor and two anonymous referees for their helpful comments. The remaining errors are ours. The replication materials for this study are available at https://doi.org/10.17632/n6t49bxhh4.3.





 Open access

