


1. Introduction
Galaxy clusters are the largest gravitationally bound structures in the universe and are important astrophysical environments for understanding the interplay between dark matter halos and their hot gaseous atmospheres. The hot, ionised component of the intracluster gas is observed via its X-ray emission, which is expected to scale with the galaxy cluster’s underlying dark matter halo mass.
Modern high precision X-ray telescopes such as XMM-Newton (e.g. Jansen et al. Reference Jansen2001), Chandra (e.g.Weisskopf et al. Reference Weisskopf, Tananbaum, Van Speybroeck, O’Dell, Truemper and Aschenbach2000), and eROSITA (e.g. Predehl et al. Reference Predehl2021) have enabled precise fits to be made for the radial profile of the intracluster gas density, temperature, and pressure, which can be related to the cluster’s halo mass through the assumption of hydrostatic equilibrium. These hydrostatic halo masses can be correlated with observable probes of the intracluster gas emission to produce a scaling relation – typically to either a mean-weighted X-ray temperature (e.g. Vikhlinin et al. Reference Vikhlinin, Kravtsov, Forman, Jones, Markevitch, Murray and Van Speybroeck2006, Reference Vikhlinin2009; Babyk & McNamara Reference Babyk and McNamara2023), or the shift in the Cosmic Microwave Background (CMB) known as the Sunyaev–Zeldovich (SZ; Sunyaev & Zeldovich Reference Sunyaev and Zeldovich1970, Reference Sunyaev and Zeldovich1972) effect, arising from photon interactions with energetic electrons in the intracluster gas (e.g. Vanderlinde et al. Reference Vanderlinde2010; Andersson et al. Reference Andersson2011).
In this approach, the halo mass is recovered up to a hydrostatic bias, which is believed to lead to an underestimate in the halo mass in relaxed galaxy clusters by at least $\sim$
10–20% (Martizzi & Agrusa Reference Martizzi and Agrusa2016; Ettori & Eckert Reference Ettori and Eckert2022). This hydrostatic bias is attributed to the non-thermal pressure (NTP, hereafter) contributing to the cluster’s hydrostatic state, which is neglected when calculating hydrostatic halo masses. NTP is defined as the pressure of a system that is not attributed to the random motion of the intracluster gas; NTP will be produced by shocks, mergers, and feedback processes.
$\sim$
10–20% (Martizzi & Agrusa Reference Martizzi and Agrusa2016; Ettori & Eckert Reference Ettori and Eckert2022). This hydrostatic bias is attributed to the non-thermal pressure (NTP, hereafter) contributing to the cluster’s hydrostatic state, which is neglected when calculating hydrostatic halo masses. NTP is defined as the pressure of a system that is not attributed to the random motion of the intracluster gas; NTP will be produced by shocks, mergers, and feedback processes.
One of the biggest challenges in estimating halo masses this way is accurately quantifying the hydrostatic bias, which relies on quantifying the fraction of NTP to total pressure in a cluster, at any given halocentric radius. Observationally, the NTP fraction in galaxy clusters is constrained to be $\lesssim$ $11\% $
at halocentric radii of
$11\% $
at halocentric radii of $r_{500}$
for systems with similar mass and at similar redshifts; this is obtained by comparing hydrostatic halo masses with halo masses computed from gravitational lensing (Siegel et al. Reference Siegel2018). Other observational studies have predicted NTP fractions of
$r_{500}$
for systems with similar mass and at similar redshifts; this is obtained by comparing hydrostatic halo masses with halo masses computed from gravitational lensing (Siegel et al. Reference Siegel2018). Other observational studies have predicted NTP fractions of $\lesssim$
9% and
$\lesssim$
9% and $\lesssim$
15% at halo radii of
$\lesssim$
15% at halo radii of $r_{500}$
and
$r_{500}$
and $r_{200}$
, respectively, when calibrating hydrostatic gas mass fractions to the expected universal gas fraction (Eckert et al. Reference Eckert2019); whilst the NTP fraction inferred from X-ray surface brightness fluctuations has been predicted at
$r_{200}$
, respectively, when calibrating hydrostatic gas mass fractions to the expected universal gas fraction (Eckert et al. Reference Eckert2019); whilst the NTP fraction inferred from X-ray surface brightness fluctuations has been predicted at $\sim$
7% near
$\sim$
7% near $r_{500}$
, and only
$r_{500}$
, and only $\sim$ $1$
–
$1$
– $2\%$
closer towards the cluster’s core (Dupourqué et al. Reference Dupourqué, Clerc, Pointecouteau, Eckert, Ettori and Vazza2023). This latter constraint is in relatively good agreement to precise modelling by the Hitomi satellite, which by directly measuring the turbulent gas motion within the central 100 kpc of the Perseus galaxy cluster, has constrained the fraction of kinetic to thermal pressure support to be
$2\%$
closer towards the cluster’s core (Dupourqué et al. Reference Dupourqué, Clerc, Pointecouteau, Eckert, Ettori and Vazza2023). This latter constraint is in relatively good agreement to precise modelling by the Hitomi satellite, which by directly measuring the turbulent gas motion within the central 100 kpc of the Perseus galaxy cluster, has constrained the fraction of kinetic to thermal pressure support to be $\sim$
2–7%, with an upper bound of at most
$\sim$
2–7%, with an upper bound of at most $\sim$
11–13% (Hitomi Collaboration et al. 2016, 2018). These observational constraints suggest that galaxy clusters are consistent with little or no NTP in their central core and a radially increasing NTP fraction that is not expected to be more than
$\sim$
11–13% (Hitomi Collaboration et al. 2016, 2018). These observational constraints suggest that galaxy clusters are consistent with little or no NTP in their central core and a radially increasing NTP fraction that is not expected to be more than $\sim$
10% at
$\sim$
10% at $r_{500}$
.
$r_{500}$
.
The importance of NTP for hydrostatic halo mass estimation has motivated its study in state-of-the-art hydrodynamic cosmological simulations of galaxy clusters. In general, non-radiative simulations predict the cluster’s NTP at a factor of $\sim$
3 above observational constraints, with a NTP fraction of
$\sim$
3 above observational constraints, with a NTP fraction of $\sim$
20–40% near
$\sim$
20–40% near $r_{200}$
(e.g. Nelson, Lau, & Nagai Reference Nelson, Lau and Nagai2014; Martizzi & Agrusa Reference Martizzi and Agrusa2016). These predictions are consistent across studies that vary the sub-grid physics in radiative hydrodynamic codes (e.g. Pearce et al. Reference Pearce, Kay, Barnes, Bower and Schaller2020). Related work has shown that these numerical constraints on the NTP will vary when defined in terms of different definitions of gas motion – total random motion, turbulent motion, radial motion, or any combination of these – and that each definition will vary in its contribution to the NTP fraction associated with the hydrostatic bias (see Angelinelli et al. Reference Angelinelli, Vazza, Giocoli, Ettori, Jones, Brunetti, Brüggen and Eckert2020).
$r_{200}$
(e.g. Nelson, Lau, & Nagai Reference Nelson, Lau and Nagai2014; Martizzi & Agrusa Reference Martizzi and Agrusa2016). These predictions are consistent across studies that vary the sub-grid physics in radiative hydrodynamic codes (e.g. Pearce et al. Reference Pearce, Kay, Barnes, Bower and Schaller2020). Related work has shown that these numerical constraints on the NTP will vary when defined in terms of different definitions of gas motion – total random motion, turbulent motion, radial motion, or any combination of these – and that each definition will vary in its contribution to the NTP fraction associated with the hydrostatic bias (see Angelinelli et al. Reference Angelinelli, Vazza, Giocoli, Ettori, Jones, Brunetti, Brüggen and Eckert2020).
Interestingly, recent observational constraints on the NTP of galaxy clusters with gravitational lensing observations have produced results that are consistent with numerical predictions at 95% confidence, predicting a radially increasing profile with large variation, consistent with a NTP fraction of $\sim$
20% near
$\sim$
20% near $r_{200}$
(Sayers et al. Reference Sayers, Sereno, Ettori, Rasia, Cui, Golwala, Umetsu and Yepes2021), which is in tension with other observational constraints. Unfortunately, this lack of consensus between simulations and observations, and between different sets of observations, represents an important limit in the utility of hydrostatic masses as a tool for halo mass estimation.
$r_{200}$
(Sayers et al. Reference Sayers, Sereno, Ettori, Rasia, Cui, Golwala, Umetsu and Yepes2021), which is in tension with other observational constraints. Unfortunately, this lack of consensus between simulations and observations, and between different sets of observations, represents an important limit in the utility of hydrostatic masses as a tool for halo mass estimation.
In contrast to NTP, the gas entropy, K, is a thermodynamic property of galaxy clusters that is well constrained across both simulations and observations. Astrophysical entropy is related to, but distinct, from statistical entropy from thermodynamics. In galaxy clusters, the gas entropy is a tracer of the evolution of the intracluster gas phase, as it is a sensitive probe of non-gravitational processes and hence is a strong indicator of the thermal state of the cluster. In particular, K is known to scale with the cluster’s halocentric radius, r, as a broken radial power law, scaling differently inside and outside the influence of radiative heating and non-gravitational feedback. In simulations, where the hot gaseous atmosphere is shaped by non-radiative, gravitational processes, the gas entropy is found to follow the radial scaling $K(r) \propto r^{1.1}$
out to
$K(r) \propto r^{1.1}$
out to $r \simeq r_{200}$
(Tozzi & Norman Reference Tozzi and Norman2001; Voit, Kay, & Bryan Reference Voit, Kay and Bryan2005). This is consistent with observational fits, recovering this power law slope of
$r \simeq r_{200}$
(Tozzi & Norman Reference Tozzi and Norman2001; Voit, Kay, & Bryan Reference Voit, Kay and Bryan2005). This is consistent with observational fits, recovering this power law slope of $1.1$
beyond cluster radii of
$1.1$
beyond cluster radii of $r \gtrsim 0.6 r_{500}$
(Hogan et al. Reference Hogan, McNamara, Pulido, Nulsen, Russell, Vantyghem, Edge and Main2017; Ghirardini et al. Reference Ghirardini2019). Within the region
$r \gtrsim 0.6 r_{500}$
(Hogan et al. Reference Hogan, McNamara, Pulido, Nulsen, Russell, Vantyghem, Edge and Main2017; Ghirardini et al. Reference Ghirardini2019). Within the region $0.04 r_{500} \lesssim r \lesssim 0.4r_{500}$
, observational fits find a gradual increase in the entropy slope with increasing cluster radius, with the entropy slope better fit by a shallower power law, of
$0.04 r_{500} \lesssim r \lesssim 0.4r_{500}$
, observational fits find a gradual increase in the entropy slope with increasing cluster radius, with the entropy slope better fit by a shallower power law, of $K(r) \propto r^{1.05}$
, inside this range (Babyk et al. Reference Babyk, McNamara, Nulsen, Russell, Vantyghem, Hogan and Pulido2018). Departures from this power law are expected below a radial break of
$K(r) \propto r^{1.05}$
, inside this range (Babyk et al. Reference Babyk, McNamara, Nulsen, Russell, Vantyghem, Hogan and Pulido2018). Departures from this power law are expected below a radial break of $r \simeq 0.03 r_{500}$
(Babyk et al. Reference Babyk, McNamara, Nulsen, Russell, Vantyghem, Hogan and Pulido2018), where non-gravitational processes become increasingly important towards the cluster’s central region.
$r \simeq 0.03 r_{500}$
(Babyk et al. Reference Babyk, McNamara, Nulsen, Russell, Vantyghem, Hogan and Pulido2018), where non-gravitational processes become increasingly important towards the cluster’s central region.
In the central regions of galaxy clusters, the thermal properties of the intracluster gas are often used to classify clusters as either ‘cool core’ (CC) or ‘non-cool core’ (NCC) clusters. Generally, CCs are associated with a temperature drop in the central region, whilst NCCs show a constant or increasing temperature towards the cluster’s centre (for an overview in defining these classifications, see Hudson et al. Reference Hudson, Mittal, Reiprich, Nulsen, Andernach and Sarazin2010). In terms of their central gas entropy, CCs are expected to follow a shallower radial power law, scaling as $K(r) \propto r^{2/3}$
, as constrained observationally (e.g. Panagoulia, Fabian, & Sanders Reference Panagoulia, Fabian and Sanders2014; Hogan et al. Reference Hogan, McNamara, Pulido, Nulsen, Russell, Vantyghem, Edge and Main2017; Babyk et al. Reference Babyk, McNamara, Nulsen, Russell, Vantyghem, Hogan and Pulido2018; Ghirardini et al. Reference Ghirardini2019), whereas NCCs are expected to be better described by some ‘entropy floor’,
$K(r) \propto r^{2/3}$
, as constrained observationally (e.g. Panagoulia, Fabian, & Sanders Reference Panagoulia, Fabian and Sanders2014; Hogan et al. Reference Hogan, McNamara, Pulido, Nulsen, Russell, Vantyghem, Edge and Main2017; Babyk et al. Reference Babyk, McNamara, Nulsen, Russell, Vantyghem, Hogan and Pulido2018; Ghirardini et al. Reference Ghirardini2019), whereas NCCs are expected to be better described by some ‘entropy floor’, $K(r) \simeq K_0$
, in the core. This general understanding and consensus for the scaling of the gas entropy, within and beyond the central region, for both CC or NCC clusters, motivates our use of these expected constraints in modelling the thermal state of galaxy clusters below; in doing so, we can reveal the amount of NTP that is required to maintain hydrostatic equilibrium.
$K(r) \simeq K_0$
, in the core. This general understanding and consensus for the scaling of the gas entropy, within and beyond the central region, for both CC or NCC clusters, motivates our use of these expected constraints in modelling the thermal state of galaxy clusters below; in doing so, we can reveal the amount of NTP that is required to maintain hydrostatic equilibrium.
In previous work (cf. Sullivan et al. Reference Sullivan, Power, Bottrell, Robotham and Shabala2024, hereafter S24b), we developed an analytic model for galaxy clusters and the properties of their intracluster gas emission, for clusters in virial and hydrostatic equilibrium, and parameterised by the structure and composition of the hot gas and dark matter constituents. However, one important caveat in that model was the lack of NTP, implying an overestimate in its temperature and pressure profiles due to the hydrostatic bias. In this work, we apply the observational and simulation constraints to the gas entropy predicted in that model and analytically predict the functional form of the required NTP to attain the expected scaling. This allows us to propose an analytic profile for the NTP fraction of galaxy clusters, facilitating a comparison to be made to both the observational and numerical predictions for its radial profile.
Our general approach, detailing the mathematical connection between the NTP fraction and the gas entropy, is detailed in Section 2. In Section 3, we analyse the gas entropy predicted by our previous model and propose a weighting function that constrains these profiles to attain the entropy scaling that is expected from the literature. In Section 4, we present the required NTP fraction for our cluster model, and we show how incorporating this profile improves our predictions for the gas’ entropy, temperature, and thermal pressure profiles. We also comment on the expected hydrostatic bias and the impact this has on the cluster scaling relations. We present our conclusions in Section 5.
2. Theoretical background and methods
Hydrostatic equilibrium with non-thermal pressure
In galaxy clusters, the total pressure of the system will comprise the thermal pressure, $p_\mathrm{th}$
, exerted by the intracluster gas, as well as the NTP,
$p_\mathrm{th}$
, exerted by the intracluster gas, as well as the NTP, $p_\mathrm{nt}$
, arising due to gravitational shocks and mergers, or due to feedback processes (e.g. powerful outflows driven by active galactic nuclei) in the central regions. For galaxy clusters in hydrostatic equilibrium, the acceleration exerted by this pressure on the intracluster gas will be balanced by the gravitational force generated by the cluster’s mass, at any halo radius.
$p_\mathrm{nt}$
, arising due to gravitational shocks and mergers, or due to feedback processes (e.g. powerful outflows driven by active galactic nuclei) in the central regions. For galaxy clusters in hydrostatic equilibrium, the acceleration exerted by this pressure on the intracluster gas will be balanced by the gravitational force generated by the cluster’s mass, at any halo radius.
In the idealised case of a spherically symmetric cluster, the hydrostatic equilibrium condition at any halocentric radius, r, is:
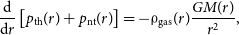 \begin{equation} \frac{\mathrm{d} }{\mathrm{d}r}\left[p_\mathrm{th}(r) + p_\mathrm{nt}(r)\right] = - \unicode{x03C1}_\mathrm{gas}(r)\frac{G M(r)}{r^2},\end{equation}
in terms of the radial derivatives of the thermal pressure profile, $p_\mathrm{th}(r)$
, and the NTP profile,
$p_\mathrm{th}(r)$
, and the NTP profile, $p_\mathrm{nt}(r)$
; the halo’s enclosed mass, M(r); the density profile of the intracluster gas,
$p_\mathrm{nt}(r)$
; the halo’s enclosed mass, M(r); the density profile of the intracluster gas, $\unicode{x03C1}_\mathrm{gas}(r)$
; and the gravitational constant, G. We note that this assumption of spherical symmetry is not necessary always true for a large population of real clusters (see, e.g. Campitiello et al. Reference Campitiello2022); however, we will assume this holds hereafter.
$\unicode{x03C1}_\mathrm{gas}(r)$
; and the gravitational constant, G. We note that this assumption of spherical symmetry is not necessary always true for a large population of real clusters (see, e.g. Campitiello et al. Reference Campitiello2022); however, we will assume this holds hereafter.
In the simplest case, considering only gas and dark matter within the galaxy cluster, the enclosed halo mass, M(r), is given by integrating the sum of the density profiles for the dark matter halo, $\unicode{x03C1}_\mathrm{dm}(r)$
, and the intracluster gas,
$\unicode{x03C1}_\mathrm{dm}(r)$
, and the intracluster gas, $\unicode{x03C1}_\mathrm{gas}(r)$
, within the spherical volume of radius r, as:
$\unicode{x03C1}_\mathrm{gas}(r)$
, within the spherical volume of radius r, as:
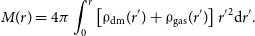 \begin{equation} M(r) = 4\pi \int_0 ^r \left[ \unicode{x03C1}_\mathrm{dm}(r^\prime) + \unicode{x03C1}_\mathrm{gas}(r^\prime) \right] r^\prime{} ^2 \mathrm{d}r^\prime.\end{equation}
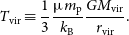
To solve for the temperature profile, T(r), of the intracluster gas, the thermal pressure profile must be related to the gas’ state variables, which for an ideal gas, obeys the relation:
 \begin{equation} p_\mathrm{th} = \frac{k_\mathrm{B}T}{\unicode{x03BC} m_\mathrm{p}} \unicode{x03C1}_\mathrm{gas},\end{equation}
where $k_\mathrm{B}$
is the Boltzmann constant,
$k_\mathrm{B}$
is the Boltzmann constant, $\unicode{x03BC}$
is the mean molecular weight, and
$\unicode{x03BC}$
is the mean molecular weight, and $m_\mathrm{p}$
is the proton mass. Subsequently, Equation (1) can be expressed as:
$m_\mathrm{p}$
is the proton mass. Subsequently, Equation (1) can be expressed as:
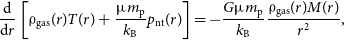 \begin{equation} \frac{\mathrm{d}}{\mathrm{d}r}\left[ \unicode{x03C1}_\mathrm{gas}(r) T(r) + \frac{\unicode{x03BC} m_\mathrm{p}}{k_\mathrm{B}} p_\mathrm{nt} (r)\right] = - \frac{G\unicode{x03BC} m_\mathrm{p}}{k_\mathrm{B}} \frac{\unicode{x03C1}_\mathrm{gas}(r) M(r)}{r^2},\end{equation}
which can be solved for T(r), given some radial parameterisation for the NTP profile, $p_\mathrm{nt}(r)$
.
$p_\mathrm{nt}(r)$
.
When observationally estimating the cluster mass, the NTP term in Equation (4) is generally assumed to be zero (e.g. Vikhlinin et al. Reference Vikhlinin, Kravtsov, Forman, Jones, Markevitch, Murray and Van Speybroeck2006, Reference Vikhlinin2009), circumventing the need to assume the form of $p_\mathrm{nt}(r)$
, which is not well constrained. We took this approach (i.e. neglecting the contribution of
$p_\mathrm{nt}(r)$
, which is not well constrained. We took this approach (i.e. neglecting the contribution of $p_\mathrm{nt}$
) in S24b. Without a NTP term, the hydrostatic equilibrium state of the cluster is assumed to be entirely balanced by the gas’ thermal pressure; this requires the gas to be hotter than it would otherwise be if NTP was present. In this study, hereafter, we will refer to the hydrostatic state without NTP as ‘pristine equilibrium’, to differentiate from the ‘real equilibrium’ state that will include NTP.
$p_\mathrm{nt}$
) in S24b. Without a NTP term, the hydrostatic equilibrium state of the cluster is assumed to be entirely balanced by the gas’ thermal pressure; this requires the gas to be hotter than it would otherwise be if NTP was present. In this study, hereafter, we will refer to the hydrostatic state without NTP as ‘pristine equilibrium’, to differentiate from the ‘real equilibrium’ state that will include NTP.
The pristine equilibrium temperature of the gas, which we denote $T_\mathrm{eq}(r)$
, is then given by the general solution:
$T_\mathrm{eq}(r)$
, is then given by the general solution:
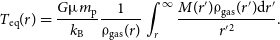 \begin{equation} T_\mathrm{eq}(r) = \frac{G\unicode{x03BC} m_\mathrm{p}}{k_\mathrm{B}} \frac{1}{\unicode{x03C1}_\mathrm{gas}(r)} \int _r^\infty \frac{M(r^\prime) \unicode{x03C1}_\mathrm{gas}(r^\prime) \mathrm{d}r^\prime}{r^\prime{} ^2}.\end{equation}
When including NTP in the cluster’s hydrostatic equilibrium state, that is, Equation (4), the real equilibrium gas temperature, T(r), will instead be given by:
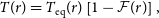 \begin{equation} T(r) = T_\mathrm{eq}(r) \left[1 - \mathcal{F}(r)\right],\end{equation}
where $\mathcal{F}(r)$
parameterises the fraction of NTP to total pressure in the system:
$\mathcal{F}(r)$
parameterises the fraction of NTP to total pressure in the system:
 \begin{equation} \mathcal{F}(r) \equiv \frac{p_\mathrm{nt}}{p}(r).\end{equation}
By this definition, the gas’ thermal pressure, $p_\mathrm{th}(r)$
, will be related to the NTP fraction,
$p_\mathrm{th}(r)$
, will be related to the NTP fraction, $\mathcal{F}(r)$
, by:
$\mathcal{F}(r)$
, by:
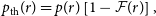 \begin{equation} p_\mathrm{th}(r) = p(r) \left[1 - \mathcal{F}(r) \right],\end{equation}
where p(r) is the cluster’s total pressure. We assume this total pressure will always be given by the hydrostatic equilibrium condition, Equation (1), defining the equilibrium pressure:
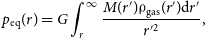 \begin{equation} p_\mathrm{eq}(r) = G \int _r^\infty \frac{M(r^\prime) \unicode{x03C1}_\mathrm{gas}(r^\prime) \mathrm{d}r^\prime}{r^\prime{} ^2},\end{equation}
which, in the pristine equilibrium assumption, will also be the thermal pressure of the gas.
The gas entropy
The definition of the intracluster gas entropy, K, is:
 \begin{equation} K \equiv \frac{k_\mathrm{B}T}{n_\mathrm{e}^{2/3}},\end{equation}
in terms of the Boltzmann constant, $k_\mathrm{B}$
, the gas temperature, T, and the electron number density,
$k_\mathrm{B}$
, the gas temperature, T, and the electron number density, $n_\mathrm{e}$
, which is given by:
$n_\mathrm{e}$
, which is given by:
 \begin{equation} n_\mathrm{e} = \frac{\unicode{x03C1}_\mathrm{gas}}{\unicode{x03BC}_\mathrm{e} m_\mathrm{p}};\end{equation}
here $\unicode{x03BC}_\mathrm{e}$
is the mean molecular weight of electrons and
$\unicode{x03BC}_\mathrm{e}$
is the mean molecular weight of electrons and $m_\mathrm{p}$
is the proton mass. For a spherically symmetric cluster, the radial gas entropy profile, K(r), is then:
$m_\mathrm{p}$
is the proton mass. For a spherically symmetric cluster, the radial gas entropy profile, K(r), is then:
 \begin{equation} K(r) = \left[\frac{\unicode{x03BC}_\mathrm{e} m_\mathrm{p}}{\unicode{x03C1}_\mathrm{gas}(r)}\right]^{2/3}k_\mathrm{B}T(r).\end{equation}
We can assign a pristine equilibrium gas entropy, $K_\mathrm{eq}(r)$
, to a cluster that is in pristine equilibrium, which will be defined as:
$K_\mathrm{eq}(r)$
, to a cluster that is in pristine equilibrium, which will be defined as:
 \begin{equation} K_\mathrm{eq}(r) = \left[\frac{\unicode{x03BC}_\mathrm{e} m_\mathrm{p}}{\unicode{x03C1}_\mathrm{gas}(r)}\right]^{2/3}k_\mathrm{B}T_\mathrm{eq}(r),\end{equation}
in terms of the pristine equilibrium temperature of the gas, $T_\mathrm{eq}(r)$
.
$T_\mathrm{eq}(r)$
.
The gas entropy slope
By taking the logarithmic derivative of Equation (12) with respect to the halocentric radius, r, we define the ‘entropy slope’, k(r), in terms of the logarithmic derivatives of the gas’ temperature and density, as:
 \begin{equation} k(r) \equiv \frac{\mathrm{d} \ln K(r)}{\mathrm{d} \ln r} = \frac{\mathrm{d} \ln T(r)}{\mathrm{d} \ln r} - \frac{2}{3} \frac{\mathrm{d} \ln \unicode{x03C1}_\mathrm{gas}(r)}{\mathrm{d} \ln r}.\end{equation}
For a cluster in pristine equilibrium, the associated pristine equilibrium entropy slope, $k_\mathrm{eq}(r)$
, is obtained from Equation (13), as:
$k_\mathrm{eq}(r)$
, is obtained from Equation (13), as:
 \begin{equation} k_\mathrm{eq}(r) \equiv \frac{\mathrm{d} \ln K_\mathrm{eq}(r)}{\mathrm{d} \ln r} = \frac{\mathrm{d} \ln T_\mathrm{eq}(r)}{\mathrm{d} \ln r} - \frac{2}{3} \frac{\mathrm{d} \ln \unicode{x03C1}_\mathrm{gas}(r)}{\mathrm{d} \ln r}.\end{equation}
By relating the gas’ real equilibrium temperature, T(r), to its pristine equilibrium temperature, $T_\mathrm{eq}(r)$
, by Equation (6), these entropy slopes can be related to the NTP fraction,
$T_\mathrm{eq}(r)$
, by Equation (6), these entropy slopes can be related to the NTP fraction, $\mathcal{F}(r)$
, via the differential equation:
$\mathcal{F}(r)$
, via the differential equation:
 \begin{equation} k(r) = k_\mathrm{eq}(r) + \frac{\mathrm{d} \ln \left[1 - \mathcal{F}(r)\right]}{\mathrm{d} \ln r}.\end{equation}
The NTP fraction is thus constrained if both k(r) and $k_\mathrm{eq}(r)$
are known.
$k_\mathrm{eq}(r)$
are known.
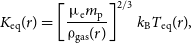
Summary of the five parameters in the ideal baryonic cluster halo model: their symbol, definition, and physical values when $\Delta=500$
.
$\Delta=500$
.

Constraining the non-thermal pressure fraction
One approach for solving Equation (16) is to relate the real entropy slope to its pristine equilibrium value via a weighting function, w(r), such that:
 \begin{equation} k(r) = w(r) \cdot k_\mathrm{eq}(r).\end{equation}
We choose the weighting function such that k(r) matches literature values for the entropy slope over an appropriate range of halocentric radii. Given some form for this weighting function, w(r), we solve Equation (16) in the form:
 \begin{equation} k_\mathrm{eq}(r)\left[w(r) - 1\right] = \frac{\mathrm{d} \mathcal{F}(r)}{\mathrm{d}r}\frac{r}{\left[\mathcal{F}(r) - 1\right]}, \end{equation}
which requires a boundary condition on $\mathcal{F}(r)$
. We introduce the parameter
$\mathcal{F}(r)$
. We introduce the parameter $\mathcal{F}_0 \equiv \mathcal{F}(r=0)$
, as the cluster’s central NTP fraction, such that Equation (18) can be integrated to give:
$\mathcal{F}_0 \equiv \mathcal{F}(r=0)$
, as the cluster’s central NTP fraction, such that Equation (18) can be integrated to give:
 \begin{equation} \mathcal{F}(r) = 1 + (\mathcal{F}_{0} - 1) \cdot \mathrm{e} ^{\int_{0}^r k_\mathrm{eq}(r^\prime) \left[w(r^\prime) - 1\right]\frac{\mathrm{d}r^\prime}{r^\prime}}.\end{equation}
A scale-free approach
We define the cluster’s virial mass, $M_\mathrm{vir}$
, in terms of its virial radius,
$M_\mathrm{vir}$
, in terms of its virial radius, $r_\mathrm{vir}$
, such that:
$r_\mathrm{vir}$
, such that:
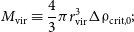 \begin{equation} M_\mathrm{vir} \equiv \frac{4}{3} \pi r_\mathrm{vir}^3 \Delta \unicode{x03C1}_\mathrm{crit,0};\end{equation} $M_\mathrm{vir}$
is the mass enclosing an average density of
$M_\mathrm{vir}$
is the mass enclosing an average density of $\Delta$
times the present-day critical density of the universe,
$\Delta$
times the present-day critical density of the universe, $\unicode{x03C1}_\mathrm{crit,0}$
, with the convention
$\unicode{x03C1}_\mathrm{crit,0}$
, with the convention $\Delta=500$
usually assumed in studies of galaxy clusters. We therefore use
$\Delta=500$
usually assumed in studies of galaxy clusters. We therefore use $M_{500}$
as the virial mass and
$M_{500}$
as the virial mass and $r_{500}$
as the virial radius. We then define a scale-free dimensionless halocentric radius, s, as:
$r_{500}$
as the virial radius. We then define a scale-free dimensionless halocentric radius, s, as:
 \begin{equation} s \equiv \frac{r}{r_\mathrm{vir}},\end{equation}
where $r_\mathrm{vir}$
depends on this choice of
$r_\mathrm{vir}$
depends on this choice of $\Delta$
.
$\Delta$
.
In terms of s, the NTP fraction solution in Equation (19) can be expressed as:
 \begin{equation} \mathcal{F}(s) = 1 + (\mathcal{F}_{0} - 1) \cdot \mathrm{e} ^{\int_{0}^s k_\mathrm{eq}(s^\prime) \left[w(s^\prime) - 1\right]\frac{\mathrm{d}s^\prime}{s^\prime}}.\end{equation}
This can be solved, given a scale-free profile for the pristine equilibrium gas entropy slope, $k_\mathrm{eq}(s)$
; a scale-free weighting function, w(s); and a prescription for the cluster’s central NTP fraction,
$k_\mathrm{eq}(s)$
; a scale-free weighting function, w(s); and a prescription for the cluster’s central NTP fraction, $\mathcal{F}_0$
.
$\mathcal{F}_0$
.
The ideal baryonic cluster halo profiles
In general, a model for a cluster’s pristine equilibrium entropy slope, $k_\mathrm{eq}(s)$
, in scale-free form requires a scale-free structural parameterisation for a cluster’s intracluster gas and dark matter halo, to solve for its hydrostatic state. We use the analytic model derived in S24b, which we briefly summarise.
$k_\mathrm{eq}(s)$
, in scale-free form requires a scale-free structural parameterisation for a cluster’s intracluster gas and dark matter halo, to solve for its hydrostatic state. We use the analytic model derived in S24b, which we briefly summarise.
We obtained an ‘ideal baryonic cluster halo’ in S24b in terms of scale-free density profiles for the dark matter halo, $\unicode{x03C1}_\mathrm{dm}(s)$
, and the intracluster gas,
$\unicode{x03C1}_\mathrm{dm}(s)$
, and the intracluster gas, $\unicode{x03C1}_\mathrm{gas}(s)$
. For the dark matter, this profile was taken as a generalisation to the NFW (Navarro, Frenk, & White Reference Navarro, Frenk and White1995, Reference Navarro, Frenk and White1996, Reference Navarro, Frenk and White1997) profile:
$\unicode{x03C1}_\mathrm{gas}(s)$
. For the dark matter, this profile was taken as a generalisation to the NFW (Navarro, Frenk, & White Reference Navarro, Frenk and White1995, Reference Navarro, Frenk and White1996, Reference Navarro, Frenk and White1997) profile:
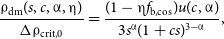 \begin{equation} \frac{\unicode{x03C1}_\mathrm{dm} (s, c, \unicode{x03B1}, \unicode{x03B7})}{\Delta \unicode{x03C1}_\mathrm{crit, 0}} = \frac{(1 - \unicode{x03B7} f_\mathrm{b, cos}) u(c, \unicode{x03B1})}{3s^{\unicode{x03B1}} (1 + cs)^{3-\unicode{x03B1}}},\end{equation}
and for the intracluster gas, by the similarly generalised profile:
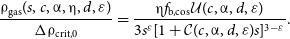 \begin{equation} \frac{\unicode{x03C1}_\mathrm{gas}(s, c, \unicode{x03B1}, \unicode{x03B7}, d, \varepsilon)}{\Delta \unicode{x03C1}_\mathrm{crit,0}} = \frac{\unicode{x03B7} f_\mathrm{b, cos}\mathcal{U}(c, \unicode{x03B1}, d, \varepsilon)}{3s^{\varepsilon} [1 + \mathcal{C}(c, \unicode{x03B1}, d, \varepsilon) s ]^{3-\varepsilon}}.\end{equation}
These density profiles are each a function of the dimensionless halocentric radius, s, and taken in a dimensionless ratio to some overdensity, $\Delta$
, times the present-day critical density of the universe,
$\Delta$
, times the present-day critical density of the universe, $\unicode{x03C1}_\mathrm{crit,0}$
. The five parameters that specify these density profiles are summarised in Table 1, along with their recommended value or range in values (cf. S24b). The parameter functions in Equations (23) and (24) are then specified in terms of these parameters:
$\unicode{x03C1}_\mathrm{crit,0}$
. The five parameters that specify these density profiles are summarised in Table 1, along with their recommended value or range in values (cf. S24b). The parameter functions in Equations (23) and (24) are then specified in terms of these parameters:
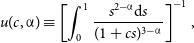 \begin{equation} u(c, \unicode{x03B1}) \equiv \left[\int _0 ^1 \frac{s^{2-\unicode{x03B1}} \mathrm{d}s}{(1 + cs)^{3-\unicode{x03B1}}}\right]^{-1},\end{equation}
 \begin{equation} \mathcal{C}(c, \unicode{x03B1}, d, \varepsilon) \equiv \frac{d(\unicode{x03B1} - \varepsilon) + c(3 - \varepsilon)}{3-\unicode{x03B1}},\end{equation}
and:
 \begin{equation} \mathcal{U}(c, \unicode{x03B1}, d, \varepsilon) \equiv \left[\int _0 ^{1} \frac{s^{2-\varepsilon}\mathrm{d}s}{[1 + \mathcal{C}(c, \unicode{x03B1}, d, \varepsilon) s]^{3-\varepsilon}} \right] ^{-1}.\end{equation}
We adopt a cosmological baryon fraction of $f_\mathrm{b, cos}=0.158$
(Planck Collaboration et al. 2016).
$f_\mathrm{b, cos}=0.158$
(Planck Collaboration et al. 2016).
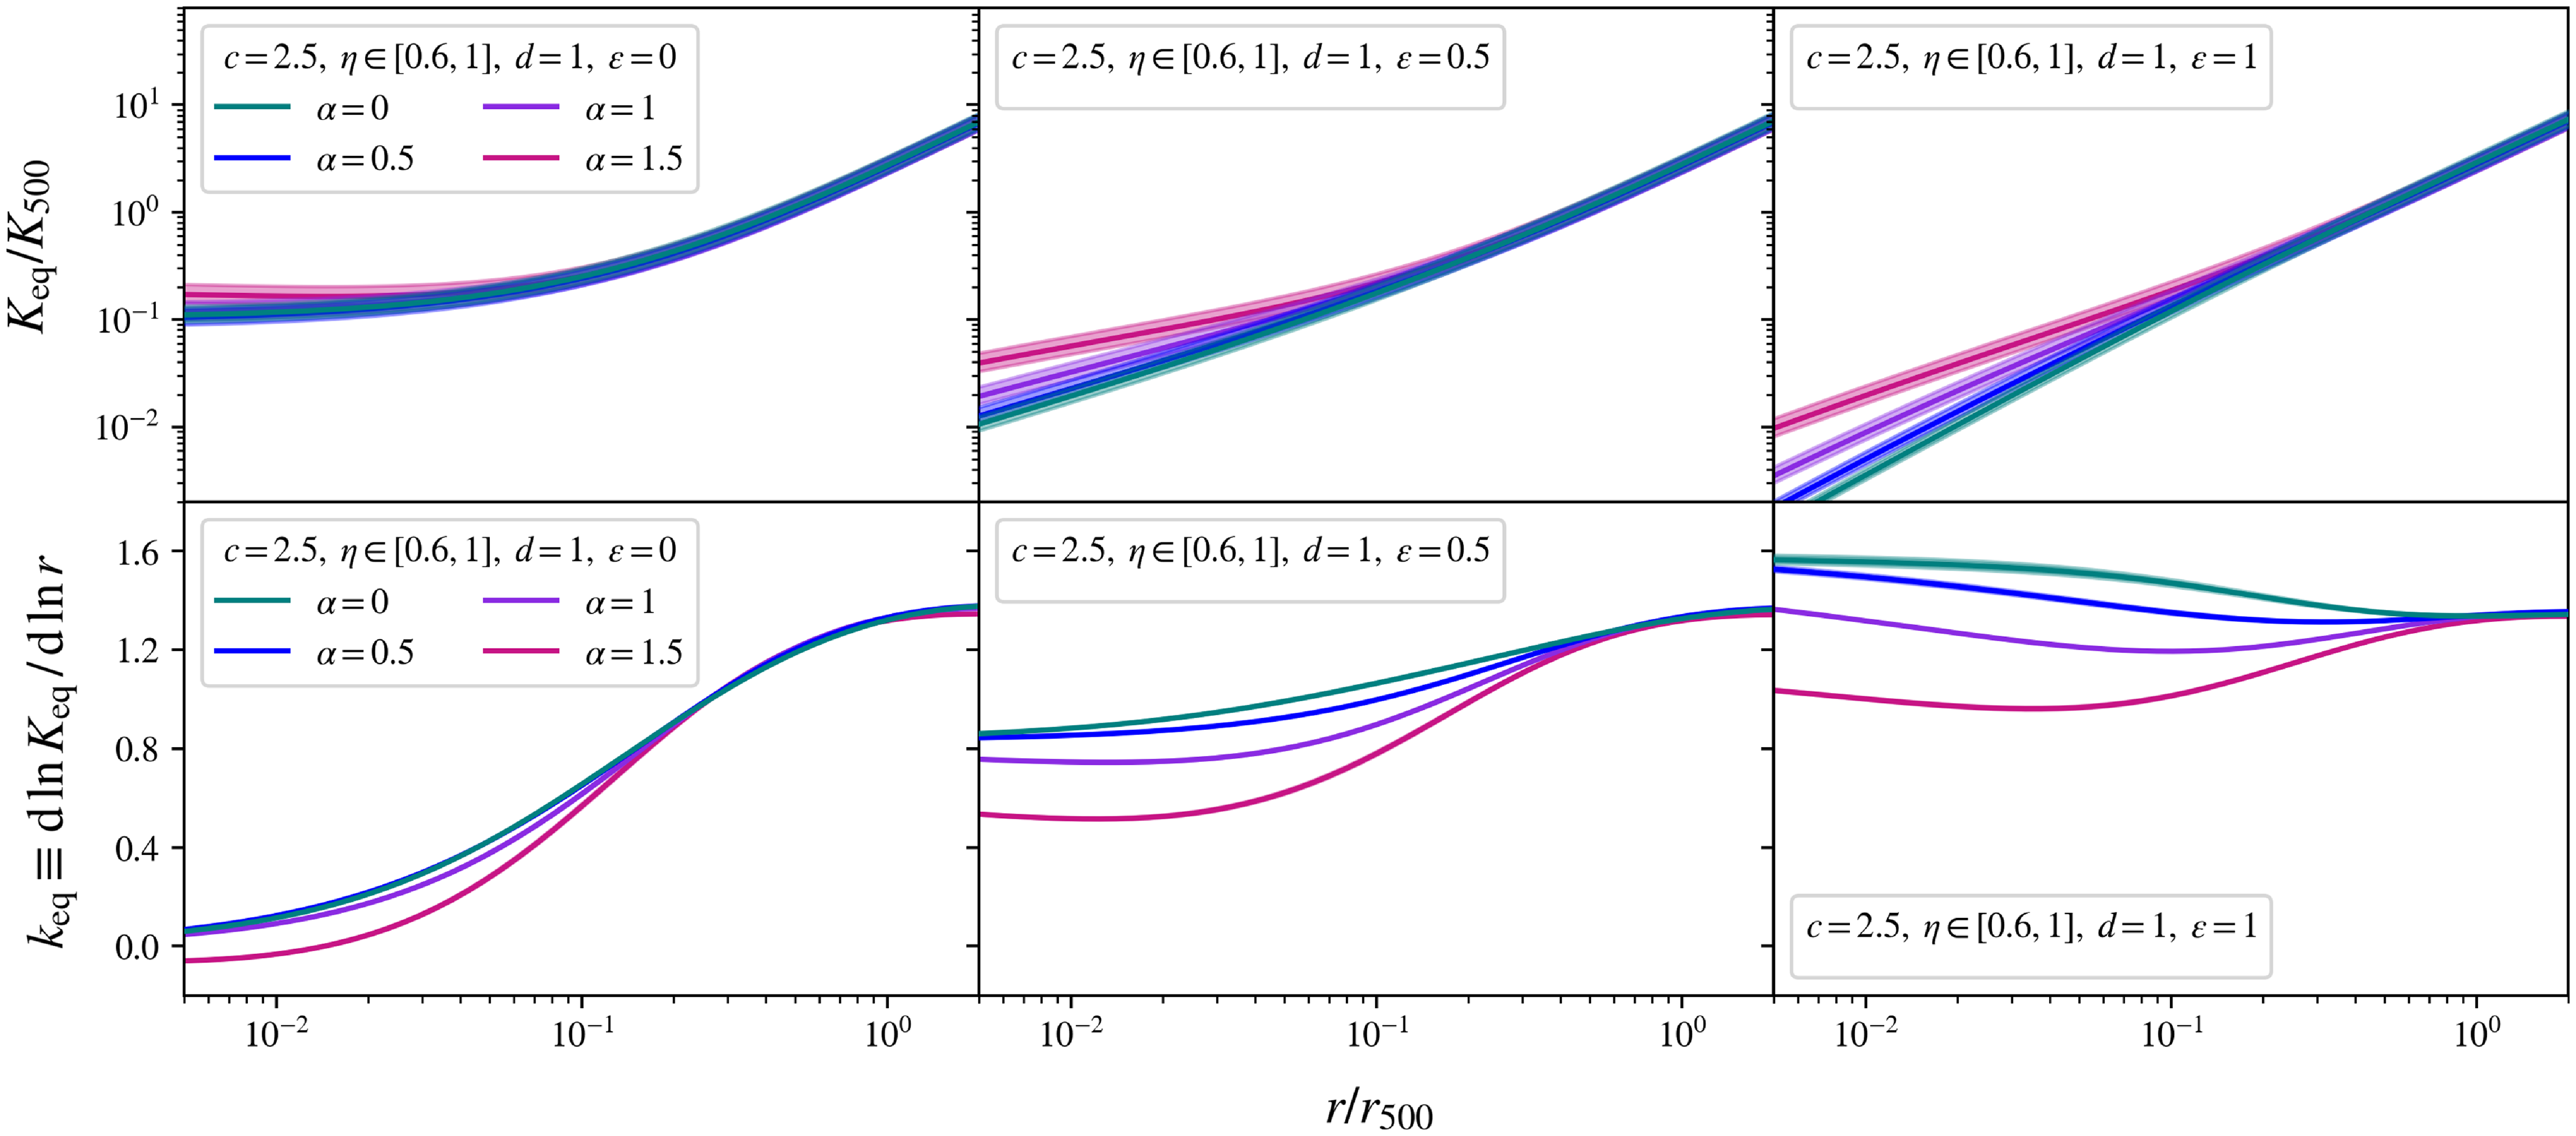
The pristine equilibrium gas entropy profiles, in scale-free form $K_\mathrm{eq}/K_\mathrm{500}$
, shown in the top row, and the pristine equilibrium gas entropy slopes,
$K_\mathrm{eq}/K_\mathrm{500}$
, shown in the top row, and the pristine equilibrium gas entropy slopes, $k_\mathrm{eq} \equiv \mathrm{d} \ln K_\mathrm{eq} / \mathrm{d} \ln r$
, shown in the bottom row, each traced over the scaled halocentric radius
$k_\mathrm{eq} \equiv \mathrm{d} \ln K_\mathrm{eq} / \mathrm{d} \ln r$
, shown in the bottom row, each traced over the scaled halocentric radius $r/r_\mathrm{500}$
, as predicted for the ideal baryonic cluster halo model. The halo concentration, c, and dilution, d, are both fixed parameters, whilst each column varies the gas inner slope,
$r/r_\mathrm{500}$
, as predicted for the ideal baryonic cluster halo model. The halo concentration, c, and dilution, d, are both fixed parameters, whilst each column varies the gas inner slope, $\varepsilon$
. Within each box, each colour varies the halo inner slope,
$\varepsilon$
. Within each box, each colour varies the halo inner slope, $\unicode{x03B1}$
, with the solid coloured lines tracing a fraction of cosmological baryon content of
$\unicode{x03B1}$
, with the solid coloured lines tracing a fraction of cosmological baryon content of $\unicode{x03B7}=0.8$
, and the shaded colour region around each solid line (not visible for all curves) tracing this value continuously between
$\unicode{x03B7}=0.8$
, and the shaded colour region around each solid line (not visible for all curves) tracing this value continuously between $\unicode{x03B7}=0.6$
and
$\unicode{x03B7}=0.6$
and $\unicode{x03B7}=1$
.
$\unicode{x03B7}=1$
.
3. Analysis
The pristine equilibrium gas entropy and gas entropy slope of the ideal baryonic cluster halos
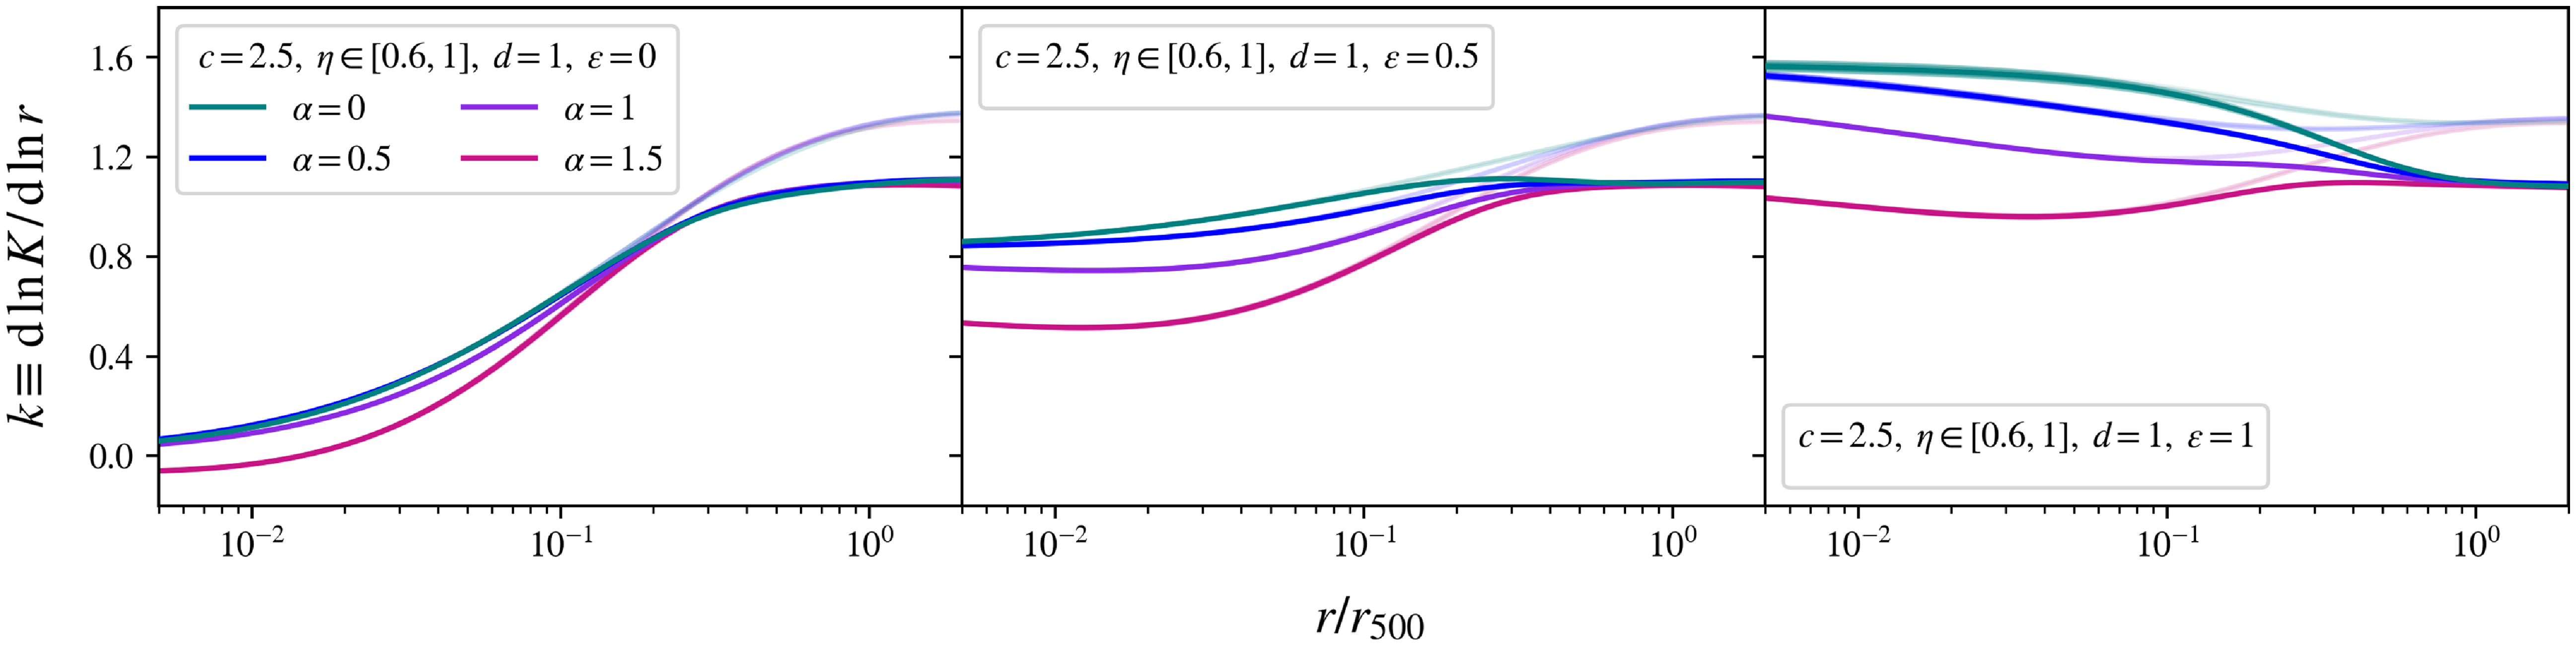
Taking the expression for the pristine equilibrium gas entropy, Equation (13), we can predict the entropy profiles for the ideal baryonic cluster halo model:
 \begin{equation}\begin{aligned} \frac{K_\mathrm{eq}(s, c, \unicode{x03B1}, \unicode{x03B7}, d, \varepsilon)}{K_\mathrm{vir}} &= \frac{\left\{3s^{\varepsilon} \left[1 + \mathcal{C}(c, \unicode{x03B1}, d, \varepsilon)s\right]^{3-\varepsilon}\right\}^{5/3} }{\left[\unicode{x03B7} \, \mathcal{U}(c, \unicode{x03B1}, d, \varepsilon)\right]^{2/3}} \\ & \quad \times \mathcal{I}(s, c, \unicode{x03B1}, \unicode{x03B7}, d, \varepsilon),\end{aligned}\end{equation}
as a function of the dimensionless halocentric radius, s; the five structural parameters from Table 1; and the integral function:
 \begin{equation}\begin{aligned} \mathcal{I}(s, c, \unicode{x03B1}, \unicode{x03B7}, d, \varepsilon)&\equiv \int _s ^\infty \frac{ \mathrm{d}s^\prime \Biggl\{ (1 - \unicode{x03B7} f_\mathrm{b, cos})u(c, \unicode{x03B1}) \cdot \int _0 ^{s^\prime} \frac{s^\prime{}^\prime{} ^{2-\unicode{x03B1}} \mathrm{d}s^\prime{}^\prime}{(1 + cs^\prime{}^\prime )^{3-\unicode{x03B1}}} }{s^\prime{}^{2 + \varepsilon} \left[1 + \mathcal{C}(c, \unicode{x03B1}, d, \varepsilon)s^\prime \right]^{3 - \varepsilon}} \\ & \hspace{-15mm} + \unicode{x03B7} f_\mathrm{b, cos} \mathcal{U}(c, \unicode{x03B1}, d, \varepsilon) \cdot \int _0 ^{s^\prime} \frac{s^\prime{}^\prime{}^{2-\varepsilon} \mathrm{d}s^\prime{}^\prime}{\left[1 + \mathcal{C}(c, \unicode{x03B1}, d, \varepsilon)s^\prime{}^\prime \right]^{3-\varepsilon}} \Biggr\}.\end{aligned}\end{equation}
In this expression, the gas entropy is scaled by the virial entropy, $K_\mathrm{vir}$
, which we define as:
$K_\mathrm{vir}$
, which we define as:
 \begin{equation} K_\mathrm{vir} \equiv \left[\frac{\unicode{x03BC}_\mathrm{e} m_\mathrm{p}}{f_\mathrm{b, cos} \Delta \unicode{x03C1}_\mathrm{crit,0}}\right]^{2/3} k_\mathrm{B}T_\mathrm{vir},\end{equation}
in terms of the virial temperature, $T_\mathrm{vir}$
, defined as:
$T_\mathrm{vir}$
, defined as:
 \begin{equation} T_\mathrm{vir} \equiv \frac{1}{3} \frac{\unicode{x03BC} m_\mathrm{p}}{k_\mathrm{B}} \frac{GM_\mathrm{vir}}{r_\mathrm{vir}}.\end{equation}
When $\Delta=500$
in Equation (30), this allows us to define the entropy and temperature values of
$\Delta=500$
in Equation (30), this allows us to define the entropy and temperature values of $K_{500}$
and
$K_{500}$
and $T_{500}$
.
$T_{500}$
.
Taking the logarithmic derivative of Equation (28) with respect to s, we find that the pristine equilibrium entropy slope, $k_\mathrm{eq}(s)$
, for this model can be solved as:
$k_\mathrm{eq}(s)$
, for this model can be solved as:
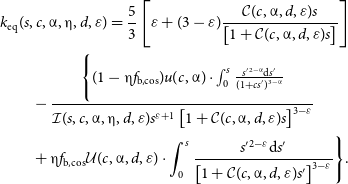 \begin{equation}\begin{aligned} & k_\mathrm{eq}(s, c, \unicode{x03B1}, \unicode{x03B7}, d, \varepsilon) = \frac{5}{3} \left[\varepsilon + (3-\varepsilon) \frac{\mathcal{C}(c, \unicode{x03B1}, d, \varepsilon)s}{\left[1 + \mathcal{C}(c, \unicode{x03B1}, d, \varepsilon)s\right]}\right] \\ &\qquad - \frac{\Biggl\{ (1 - \unicode{x03B7} f_\mathrm{b, cos}) u(c, \unicode{x03B1}) \cdot \int_0 ^s \frac{s^\prime{}^{2-\unicode{x03B1}} \mathrm{d}s^\prime}{(1 + cs^\prime)^{3-\unicode{x03B1}}} }{\mathcal{I}(s, c, \unicode{x03B1}, \unicode{x03B7}, d, \varepsilon) s^{\varepsilon+1}\left[1 + \mathcal{C}(c, \unicode{x03B1}, d, \varepsilon)s\right]^{3-\varepsilon}} \\ &\qquad + \unicode{x03B7} f_\mathrm{b, cos} \mathcal{U}(c, \unicode{x03B1}, d, \varepsilon) \cdot \int_0^s \frac{s^\prime{}^{2-\varepsilon} \mathrm{d}s^\prime}{\left[1 + \mathcal{C}(c, \unicode{x03B1}, d, \varepsilon)s^\prime\right]^{3-\varepsilon}} \Biggr\}.\end{aligned}\end{equation}
Over the parameter space detailed in Table 1, the profiles for the pristine equilibrium gas entropy, in the form $K_\mathrm{eq}/K_{500}$
, and the corresponding slopes,
$K_\mathrm{eq}/K_{500}$
, and the corresponding slopes, $k_\mathrm{eq}$
, are traced within Fig. 1, as a function of the dimensionless halocentric radius
$k_\mathrm{eq}$
, are traced within Fig. 1, as a function of the dimensionless halocentric radius $s \equiv r/r_{500}$
.
$s \equiv r/r_{500}$
.
Fig. 1 shows how varying the gas profile’s inner slope, $\varepsilon$
, drives the behaviour of the gas entropy in the central region. Gas cores,
$\varepsilon$
, drives the behaviour of the gas entropy in the central region. Gas cores, $\varepsilon=0$
, in the left column, produce high central entropy, characteristic of NCC clusters; weak gas cusps,
$\varepsilon=0$
, in the left column, produce high central entropy, characteristic of NCC clusters; weak gas cusps, $\varepsilon=0.5$
, in the centre column, attain a central entropy slope of
$\varepsilon=0.5$
, in the centre column, attain a central entropy slope of $k_\mathrm{eq} \simeq 0.6-0.9$
, which is roughly consistent with observational constraints in CC clusters (e.g. Babyk et al. Reference Babyk, McNamara, Nulsen, Russell, Vantyghem, Hogan and Pulido2018). This association between cuspy gas inner slopes and CCs is a well known observational correlation (see, e.g. Hudson et al. Reference Hudson, Mittal, Reiprich, Nulsen, Andernach and Sarazin2010) and is well reproduced in these panels. In the right panel, showing NFW-like gas cusps,
$k_\mathrm{eq} \simeq 0.6-0.9$
, which is roughly consistent with observational constraints in CC clusters (e.g. Babyk et al. Reference Babyk, McNamara, Nulsen, Russell, Vantyghem, Hogan and Pulido2018). This association between cuspy gas inner slopes and CCs is a well known observational correlation (see, e.g. Hudson et al. Reference Hudson, Mittal, Reiprich, Nulsen, Andernach and Sarazin2010) and is well reproduced in these panels. In the right panel, showing NFW-like gas cusps, $\varepsilon=1$
, the gas entropy becomes increasingly steep towards the centre of the cluster, implying a rapid drop in the gas entropy in the core. We note that such steep gradients are not generally observed or predicted.
$\varepsilon=1$
, the gas entropy becomes increasingly steep towards the centre of the cluster, implying a rapid drop in the gas entropy in the core. We note that such steep gradients are not generally observed or predicted.
Throughout the parameter space traced in Fig. 1, the gas entropy slope converges to a constant value of $k_\mathrm{eq} \simeq 1.4$
in the cluster’s outskirts, beyond halocentric radii
$k_\mathrm{eq} \simeq 1.4$
in the cluster’s outskirts, beyond halocentric radii $r \gtrsim 0.8 r_{500}$
. In comparison to the consensus in the literature, where the gas entropy slope is expected to attain a constant value of
$r \gtrsim 0.8 r_{500}$
. In comparison to the consensus in the literature, where the gas entropy slope is expected to attain a constant value of $k \simeq 1.1$
beyond
$k \simeq 1.1$
beyond $r \gtrsim 0.6 r_{500}$
, this pristine equilibrium model systematically overestimates the gas entropy in the cluster’s outer region. In particular, by Equation (15), when treating the intracluster gas density profile as fixed, this overestimate in
$r \gtrsim 0.6 r_{500}$
, this pristine equilibrium model systematically overestimates the gas entropy in the cluster’s outer region. In particular, by Equation (15), when treating the intracluster gas density profile as fixed, this overestimate in $k_\mathrm{eq}(s)$
reflects an overestimate in the logarithmic derivative of the pristine equilibrium gas temperature,
$k_\mathrm{eq}(s)$
reflects an overestimate in the logarithmic derivative of the pristine equilibrium gas temperature, $T_\mathrm{eq}(s)$
, which, as the gas temperature will be decreasing in the cluster’s outer region, implies that
$T_\mathrm{eq}(s)$
, which, as the gas temperature will be decreasing in the cluster’s outer region, implies that $T_\mathrm{eq}(s)$
is decreasing too gently with radius in the outskirts. If the gas temperature falls more rapidly, this implies that NTP is required, specifically as an increasing function of halocentric radius, to ensure that the cluster remains in hydrostatic equilibrium.
$T_\mathrm{eq}(s)$
is decreasing too gently with radius in the outskirts. If the gas temperature falls more rapidly, this implies that NTP is required, specifically as an increasing function of halocentric radius, to ensure that the cluster remains in hydrostatic equilibrium.
Choosing a weighting function
To relate the pristine and real entropy slopes and thus predict the required NTP function, we must prescribe the weighting function, w(s). At large radii, when $k_\mathrm{eq} \simeq 1.4$
, we require a weighting of
$k_\mathrm{eq} \simeq 1.4$
, we require a weighting of $w \simeq 0.8$
, such that the entropy slope is reduced to
$w \simeq 0.8$
, such that the entropy slope is reduced to $k \simeq 1.1$
, as is observed in both simulations and observations. Leaving the entropy slopes unchanged in the inner region, where slopes consistent with CCs and NCCs are relatively well established, implies that the weighting function must take the form of a continuous step function, transitioning between
$k \simeq 1.1$
, as is observed in both simulations and observations. Leaving the entropy slopes unchanged in the inner region, where slopes consistent with CCs and NCCs are relatively well established, implies that the weighting function must take the form of a continuous step function, transitioning between $w = 1$
and
$w = 1$
and $w = 0.8$
as a function of halocentric radius.
$w = 0.8$
as a function of halocentric radius.
There are two parameters that need to be chosen for such a function: the steepness of the transition and the radius at which the transition occurs. We set the mid-point weight of $w = 0.9$
to occur at a halo radius of
$w = 0.9$
to occur at a halo radius of $r \simeq 0.4 r_{500}$
, with the steepness set by an amplitude of 5 in the exponent. This choice ensures that the entropy slope
$r \simeq 0.4 r_{500}$
, with the steepness set by an amplitude of 5 in the exponent. This choice ensures that the entropy slope $k \simeq 1.1$
is reached and remains fixed, above halocentric radii
$k \simeq 1.1$
is reached and remains fixed, above halocentric radii $r \gtrsim 0.6 r_{500}$
, whilst
$r \gtrsim 0.6 r_{500}$
, whilst $k \simeq 1$
is a better fit to its value within the region
$k \simeq 1$
is a better fit to its value within the region $0.2r_{500} \lesssim r \lesssim 0.4 r_{500}$
.
$0.2r_{500} \lesssim r \lesssim 0.4 r_{500}$
.
The weighted gas entropy slopes, $k \equiv \mathrm{d} \ln K / \mathrm{d} \ln r$
, traced over the scaled halocentric radius
$k \equiv \mathrm{d} \ln K / \mathrm{d} \ln r$
, traced over the scaled halocentric radius $r/r_\mathrm{500}$
, derived as a modification to the pristine equilibrium profiles from Fig. 1, when weighted by the weighting function from Equation (33). The halo concentration, c, and dilution, d, are both fixed parameters, whilst each column varies the gas inner slope,
$r/r_\mathrm{500}$
, derived as a modification to the pristine equilibrium profiles from Fig. 1, when weighted by the weighting function from Equation (33). The halo concentration, c, and dilution, d, are both fixed parameters, whilst each column varies the gas inner slope, $\varepsilon$
. Within each box, each colour varies the halo inner slope,
$\varepsilon$
. Within each box, each colour varies the halo inner slope, $\unicode{x03B1}$
, with the solid coloured lines tracing a fraction of cosmological baryon content of
$\unicode{x03B1}$
, with the solid coloured lines tracing a fraction of cosmological baryon content of $\unicode{x03B7}=0.8$
, and the shaded colour region around each solid line (not visible for all curves) tracing this value continuously between
$\unicode{x03B7}=0.8$
, and the shaded colour region around each solid line (not visible for all curves) tracing this value continuously between $\unicode{x03B7}=0.6$
and
$\unicode{x03B7}=0.6$
and $\unicode{x03B7}=1$
. The faded profiles in the background of each panel correspond to the associated pristine equilibrium entropy slopes,
$\unicode{x03B7}=1$
. The faded profiles in the background of each panel correspond to the associated pristine equilibrium entropy slopes, $k_\mathrm{eq} \equiv \mathrm{d} \ln K_\mathrm{eq} / \mathrm{d} \ln r$
, from the top row of Fig. 1.
$k_\mathrm{eq} \equiv \mathrm{d} \ln K_\mathrm{eq} / \mathrm{d} \ln r$
, from the top row of Fig. 1.
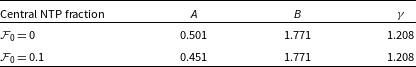
The non-thermal pressure (NTP) fraction, $\mathcal{F} \equiv p_\mathrm{nt} / p$
, traced over the scaled halocentric radius
$\mathcal{F} \equiv p_\mathrm{nt} / p$
, traced over the scaled halocentric radius $r/r_{500}$
, that solves the entropy slope constraints via Equation (22). In each box, the cluster’s structural parameters are varied over the entire parameter space from Table 1, producing the turquoise shaded regions, given a choice in the cluster’s central NTP fraction,
$r/r_{500}$
, that solves the entropy slope constraints via Equation (22). In each box, the cluster’s structural parameters are varied over the entire parameter space from Table 1, producing the turquoise shaded regions, given a choice in the cluster’s central NTP fraction, $\mathcal{F}_0$
, which is set to
$\mathcal{F}_0$
, which is set to $\mathcal{F}_0 = 0$
in the left panel, and
$\mathcal{F}_0 = 0$
in the left panel, and $\mathcal{F}_0 = 0.1$
in the right panel. The black dotted line in each box is the best-fit to the functional form proposed in Nelson et al. (Reference Nelson, Lau and Nagai2014), given in Equation (34), with its best-fitting parameters specified in Table 2. We compare our predictions to numerical fits: from Nelson et al. (Reference Nelson, Lau and Nagai2014), shown by the orange line; and from Angelinelli et al. (Reference Angelinelli, Vazza, Giocoli, Ettori, Jones, Brunetti, Brüggen and Eckert2020), shown by the light blue and blue dashed lines, corresponding to different contributions of the gas motion. We also compare to observational constraints: from the Hitomi Collaboration et al. (2018), as given by the pink shaded region, with the 4% value from Hitomi Collaboration et al. (2016) shown by the pink solid line; from Eckert et al. (Reference Eckert2019), shown by the red error bars; and from Dupourqué et al. (Reference Dupourqué, Clerc, Pointecouteau, Eckert, Ettori and Vazza2023), shown by the purple error bars.
$\mathcal{F}_0 = 0.1$
in the right panel. The black dotted line in each box is the best-fit to the functional form proposed in Nelson et al. (Reference Nelson, Lau and Nagai2014), given in Equation (34), with its best-fitting parameters specified in Table 2. We compare our predictions to numerical fits: from Nelson et al. (Reference Nelson, Lau and Nagai2014), shown by the orange line; and from Angelinelli et al. (Reference Angelinelli, Vazza, Giocoli, Ettori, Jones, Brunetti, Brüggen and Eckert2020), shown by the light blue and blue dashed lines, corresponding to different contributions of the gas motion. We also compare to observational constraints: from the Hitomi Collaboration et al. (2018), as given by the pink shaded region, with the 4% value from Hitomi Collaboration et al. (2016) shown by the pink solid line; from Eckert et al. (Reference Eckert2019), shown by the red error bars; and from Dupourqué et al. (Reference Dupourqué, Clerc, Pointecouteau, Eckert, Ettori and Vazza2023), shown by the purple error bars.

This scale-free weighting function is then specified by the continuous step function:
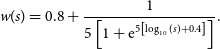 \begin{equation} w(s) = 0.8 + \frac{1}{5\left[1 + \mathrm{e}^{5\left[\log_{10}(s) + 0.4\right]}\right]}.\end{equation}
We emphasise that this choice in parameters within the step function is not unique and could be altered in both the steepness of the transition and its radial occurrence, both of which exhibit a degree of degeneracy to one another, and each of which can quantitatively impact the predicted NTP profile. However, as we have ensured that our choice produces entropy slopes that are consistent with the values in the literature, we do not consider other choices hereafter.
These new entropy slopes, calculated by weighting each of the pristine equilibrium entropy slopes, $k_\mathrm{eq}$
, from Fig. 1, are shown in Fig. 2. For all parameter configurations, these weighted entropy slopes now converge to
$k_\mathrm{eq}$
, from Fig. 1, are shown in Fig. 2. For all parameter configurations, these weighted entropy slopes now converge to $k = 1.1$
in the cluster’s outskirts, as ensured.
$k = 1.1$
in the cluster’s outskirts, as ensured.
4. Results
The predicted non-thermal pressure fraction
We now estimate the scale-free NTP fraction, $\mathcal{F}(s)$
, required for the entropy slope of an ideal baryonic cluster halo to be consistent with the imposed constraints, by using the weighting function in Equation (33). In Fig. 3, we trace these
$\mathcal{F}(s)$
, required for the entropy slope of an ideal baryonic cluster halo to be consistent with the imposed constraints, by using the weighting function in Equation (33). In Fig. 3, we trace these $\mathcal{F}(s)$
profiles over the dimensionless halocentric radius
$\mathcal{F}(s)$
profiles over the dimensionless halocentric radius $s\equiv r/r_{500}$
, for two choices of the central NTP fraction,
$s\equiv r/r_{500}$
, for two choices of the central NTP fraction, $\mathcal{F}_0$
, and subsequently evaluated continuously over the parameter space from Table 1, producing the turquoise shaded intervals.
$\mathcal{F}_0$
, and subsequently evaluated continuously over the parameter space from Table 1, producing the turquoise shaded intervals.
In the left panel, the cluster’s central NTP fraction is set to $\mathcal{F}_0 = 0$
, commensurate with zero NTP in the cluster’s core; this traces the minimum NTP fraction required to attain the imposed entropy constraints. In the right panel, this parameter is set to
$\mathcal{F}_0 = 0$
, commensurate with zero NTP in the cluster’s core; this traces the minimum NTP fraction required to attain the imposed entropy constraints. In the right panel, this parameter is set to $\mathcal{F}_0 = 0.1$
, corresponding to a baseline NTP fraction of 10% in the cluster’s core, as roughly consistent with the Hitomi upper limit. Importantly, this central NTP fraction,
$\mathcal{F}_0 = 0.1$
, corresponding to a baseline NTP fraction of 10% in the cluster’s core, as roughly consistent with the Hitomi upper limit. Importantly, this central NTP fraction, $\mathcal{F}_0$
, does not change the characteristic shape of these NTP fractions; instead, changing this value corresponds to a vertical shift in the NTP fraction over all halocentric radii.
$\mathcal{F}_0$
, does not change the characteristic shape of these NTP fractions; instead, changing this value corresponds to a vertical shift in the NTP fraction over all halocentric radii.
For each of our two predictions, we fit the parameter space of NTP fraction profiles to the functional form suggested in Nelson et al. (Reference Nelson, Lau and Nagai2014), which is given by the parameterisation:
 \begin{equation} \mathcal{F}(s) = 1 - A \left\{ 1 + \mathrm{e} ^{- (s/B)^\gamma }\right \},\end{equation}
which we take as a function of the dimensionless halocentric radius $s \equiv r/r_{500}$
, consistent with our parameter space in Table 1. This fitting procedure allows us to capture the turquoise shaded intervals in Fig. 3 with an analytic approximation. The best-fitting values to the parameters A, B, and
$s \equiv r/r_{500}$
, consistent with our parameter space in Table 1. This fitting procedure allows us to capture the turquoise shaded intervals in Fig. 3 with an analytic approximation. The best-fitting values to the parameters A, B, and $\gamma$
are given in Table 2, for each of the two NTP predictions, specified by our two choices in
$\gamma$
are given in Table 2, for each of the two NTP predictions, specified by our two choices in $\mathcal{F}_0$
. These best-fit curves are shown by the black dotted lines in each panel of Fig. 3.
$\mathcal{F}_0$
. These best-fit curves are shown by the black dotted lines in each panel of Fig. 3.
Analytic fits for the non-thermal pressure (NTP) fraction, $\mathcal{F} \equiv p_\mathrm{nt} / p$
, as a function of the scale-free halocentric radius,
$\mathcal{F} \equiv p_\mathrm{nt} / p$
, as a function of the scale-free halocentric radius, $r/r_{500}$
, when solved by Equation (22) over the parameter space in Table 1, for the weighting function, Equation (33), and specified by the cluster’s central NTP fraction,
$r/r_{500}$
, when solved by Equation (22) over the parameter space in Table 1, for the weighting function, Equation (33), and specified by the cluster’s central NTP fraction, $\mathcal{F}_0$
, in each choice given below. The best-fitting parameters specify the functional form suggested by Nelson et al. (Reference Nelson, Lau and Nagai2014), given in Equation (34).
$\mathcal{F}_0$
, in each choice given below. The best-fitting parameters specify the functional form suggested by Nelson et al. (Reference Nelson, Lau and Nagai2014), given in Equation (34).
We compare these predictions to the mean profiles obtained in non-radiative hydrodynamic simulations: from Nelson et al. (Reference Nelson, Lau and Nagai2014), shown by the orange line, and from Angelinelli et al. (Reference Angelinelli, Vazza, Giocoli, Ettori, Jones, Brunetti, Brüggen and Eckert2020), shown in both the light blue and blue dashed lines, each predicted from different calculations of the gas motion. These numerical fits are each given in terms of a mean density radius, $r_{200\textit{m}}$
, which we re-scale using the conversion
$r_{200\textit{m}}$
, which we re-scale using the conversion $r_{200\textit{m}} \simeq 2.70 r_{500}$
(as in, e.g. Nelson et al. Reference Nelson, Lau and Nagai2014) to plot in comparison to our model. Further, we show comparison to observational constraints on the NTP: from Eckert et al. (Reference Eckert2019), shown by the red error bars, and from Dupourqué et al. (Reference Dupourqué, Clerc, Pointecouteau, Eckert, Ettori and Vazza2023), shown by the purple error bars. We also compare to constraints from the Hitomi Collaboration et al. (2018) in the cluster’s central core, shown by the pink shaded region, with the
$r_{200\textit{m}} \simeq 2.70 r_{500}$
(as in, e.g. Nelson et al. Reference Nelson, Lau and Nagai2014) to plot in comparison to our model. Further, we show comparison to observational constraints on the NTP: from Eckert et al. (Reference Eckert2019), shown by the red error bars, and from Dupourqué et al. (Reference Dupourqué, Clerc, Pointecouteau, Eckert, Ettori and Vazza2023), shown by the purple error bars. We also compare to constraints from the Hitomi Collaboration et al. (2018) in the cluster’s central core, shown by the pink shaded region, with the $4 \% $
value (as given in Hitomi Collaboration et al. 2016) traced by the pink solid line.
$4 \% $
value (as given in Hitomi Collaboration et al. 2016) traced by the pink solid line.
The left panel of Fig. 3 shows that our minimum NTP fraction profile, the $\mathcal{F}_0=0$
result, is in strong agreement with numerical simulation fits at large cluster radii, above
$\mathcal{F}_0=0$
result, is in strong agreement with numerical simulation fits at large cluster radii, above $r \gtrsim 0.7 r_{500}$
. Whilst this is in strong tension with observational constraints at similar halo radii, this minimum profile is consistent the lower limit of observational constraints available in the cluster’s central region (Hitomi Collaboration et al. 2018; Dupourqué et al. Reference Dupourqué, Clerc, Pointecouteau, Eckert, Ettori and Vazza2023). For this minimum NTP fraction, our model predicts
$r \gtrsim 0.7 r_{500}$
. Whilst this is in strong tension with observational constraints at similar halo radii, this minimum profile is consistent the lower limit of observational constraints available in the cluster’s central region (Hitomi Collaboration et al. 2018; Dupourqué et al. Reference Dupourqué, Clerc, Pointecouteau, Eckert, Ettori and Vazza2023). For this minimum NTP fraction, our model predicts $\mathcal{F} \simeq 0.20$
at
$\mathcal{F} \simeq 0.20$
at $r_{500}$
, and
$r_{500}$
, and $\mathcal{F} \simeq 0.34$
at
$\mathcal{F} \simeq 0.34$
at $2r_{500}$
; these predictions are within a few percent of the mean values from Nelson et al. (Reference Nelson, Lau and Nagai2014) and Angelinelli et al. (Reference Angelinelli, Vazza, Giocoli, Ettori, Jones, Brunetti, Brüggen and Eckert2020) in the total gas motion prediction. We use this minimum NTP fraction as our baseline prediction to produce the results that follow below.
$2r_{500}$
; these predictions are within a few percent of the mean values from Nelson et al. (Reference Nelson, Lau and Nagai2014) and Angelinelli et al. (Reference Angelinelli, Vazza, Giocoli, Ettori, Jones, Brunetti, Brüggen and Eckert2020) in the total gas motion prediction. We use this minimum NTP fraction as our baseline prediction to produce the results that follow below.
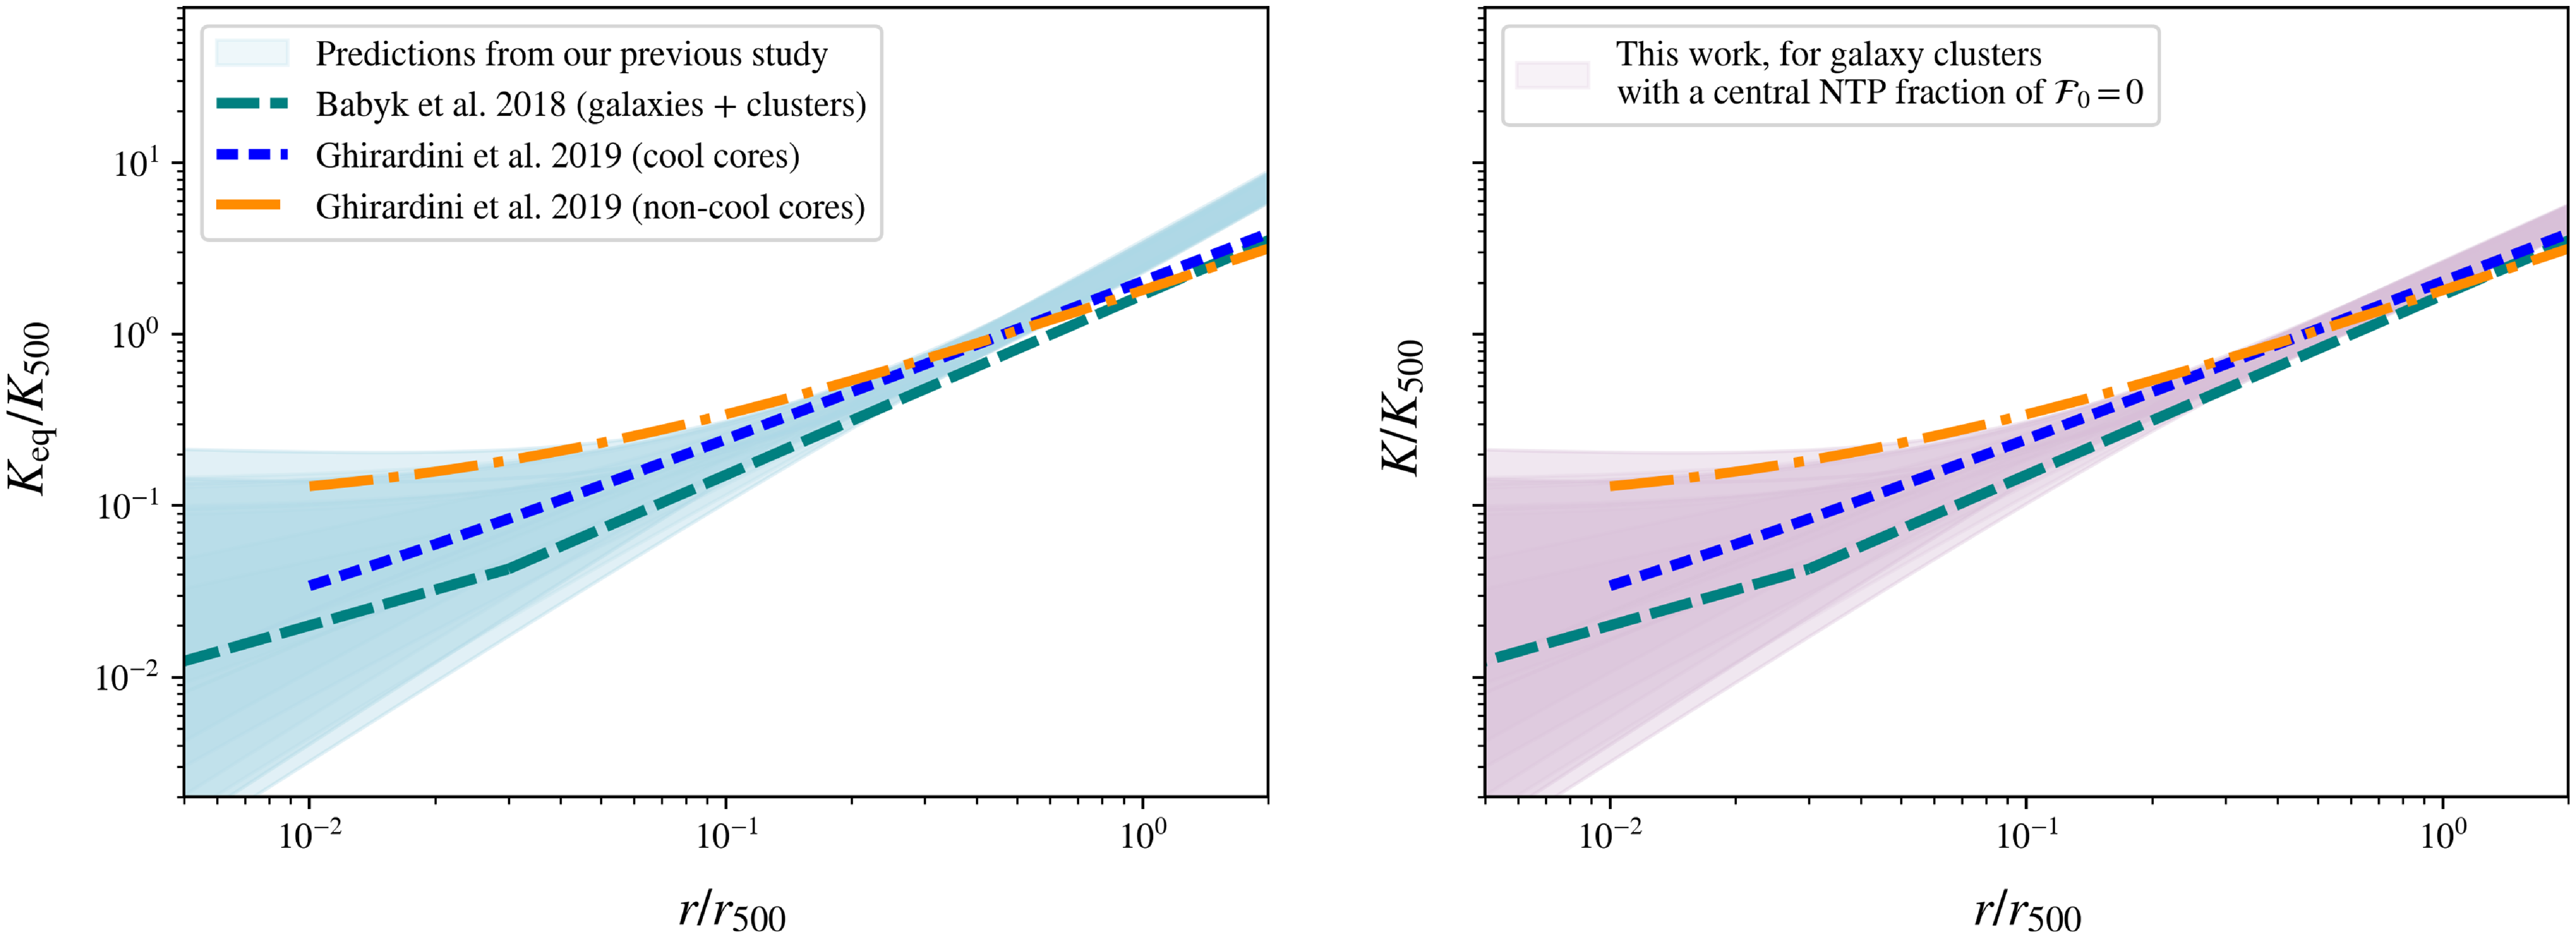
Implications for the gas entropy, temperature and thermal pressure
Fig. 4 shows the improvement in predicting the gas’ entropy profiles when incorporating our minimum NTP fraction profile in the cluster’s hydrostatic state. We show the parameter space of pristine equilibrium entropy profiles, in scale-free form $K_\mathrm{eq}/K_{500}$
, in the left panel, shown in the light blue shaded region; this corresponds to the prediction from our previous work. The new parameter space of scale-free entropy profiles,
$K_\mathrm{eq}/K_{500}$
, in the left panel, shown in the light blue shaded region; this corresponds to the prediction from our previous work. The new parameter space of scale-free entropy profiles, $K/K_{500}$
, are given in the right panel, in the light purple shaded region. In each case, the galaxy cluster’s structural parameters are those specified in Table 1.
$K/K_{500}$
, are given in the right panel, in the light purple shaded region. In each case, the galaxy cluster’s structural parameters are those specified in Table 1.
The gas entropy profiles, in scale-free form $K/K_{500}$
, traced over the scaled halocentric radius
$K/K_{500}$
, traced over the scaled halocentric radius $r/r_\mathrm{500}$
, for the ideal baryonic cluster halos: in pristine equilibrium, in the left panel, indicated by the light blue shaded region; and when including the minimum NTP fraction, as given by the fit for
$r/r_\mathrm{500}$
, for the ideal baryonic cluster halos: in pristine equilibrium, in the left panel, indicated by the light blue shaded region; and when including the minimum NTP fraction, as given by the fit for $\mathcal{F}_0=0$
in Table 2, in the right panel, indicated by the light purple shaded region. These predictions are compared to recent observational fits for the gas entropy profile of galaxy clusters, from Ghirardini et al. (Reference Ghirardini2019), for samples of cool core clusters (the blue dotted line) and non-cool core clusters (the orange dash-dotted line), as well as to the universal gas entropy profile from Babyk et al. (Reference Babyk, McNamara, Nulsen, Russell, Vantyghem, Hogan and Pulido2018) (the teal dashed line).
$\mathcal{F}_0=0$
in Table 2, in the right panel, indicated by the light purple shaded region. These predictions are compared to recent observational fits for the gas entropy profile of galaxy clusters, from Ghirardini et al. (Reference Ghirardini2019), for samples of cool core clusters (the blue dotted line) and non-cool core clusters (the orange dash-dotted line), as well as to the universal gas entropy profile from Babyk et al. (Reference Babyk, McNamara, Nulsen, Russell, Vantyghem, Hogan and Pulido2018) (the teal dashed line).
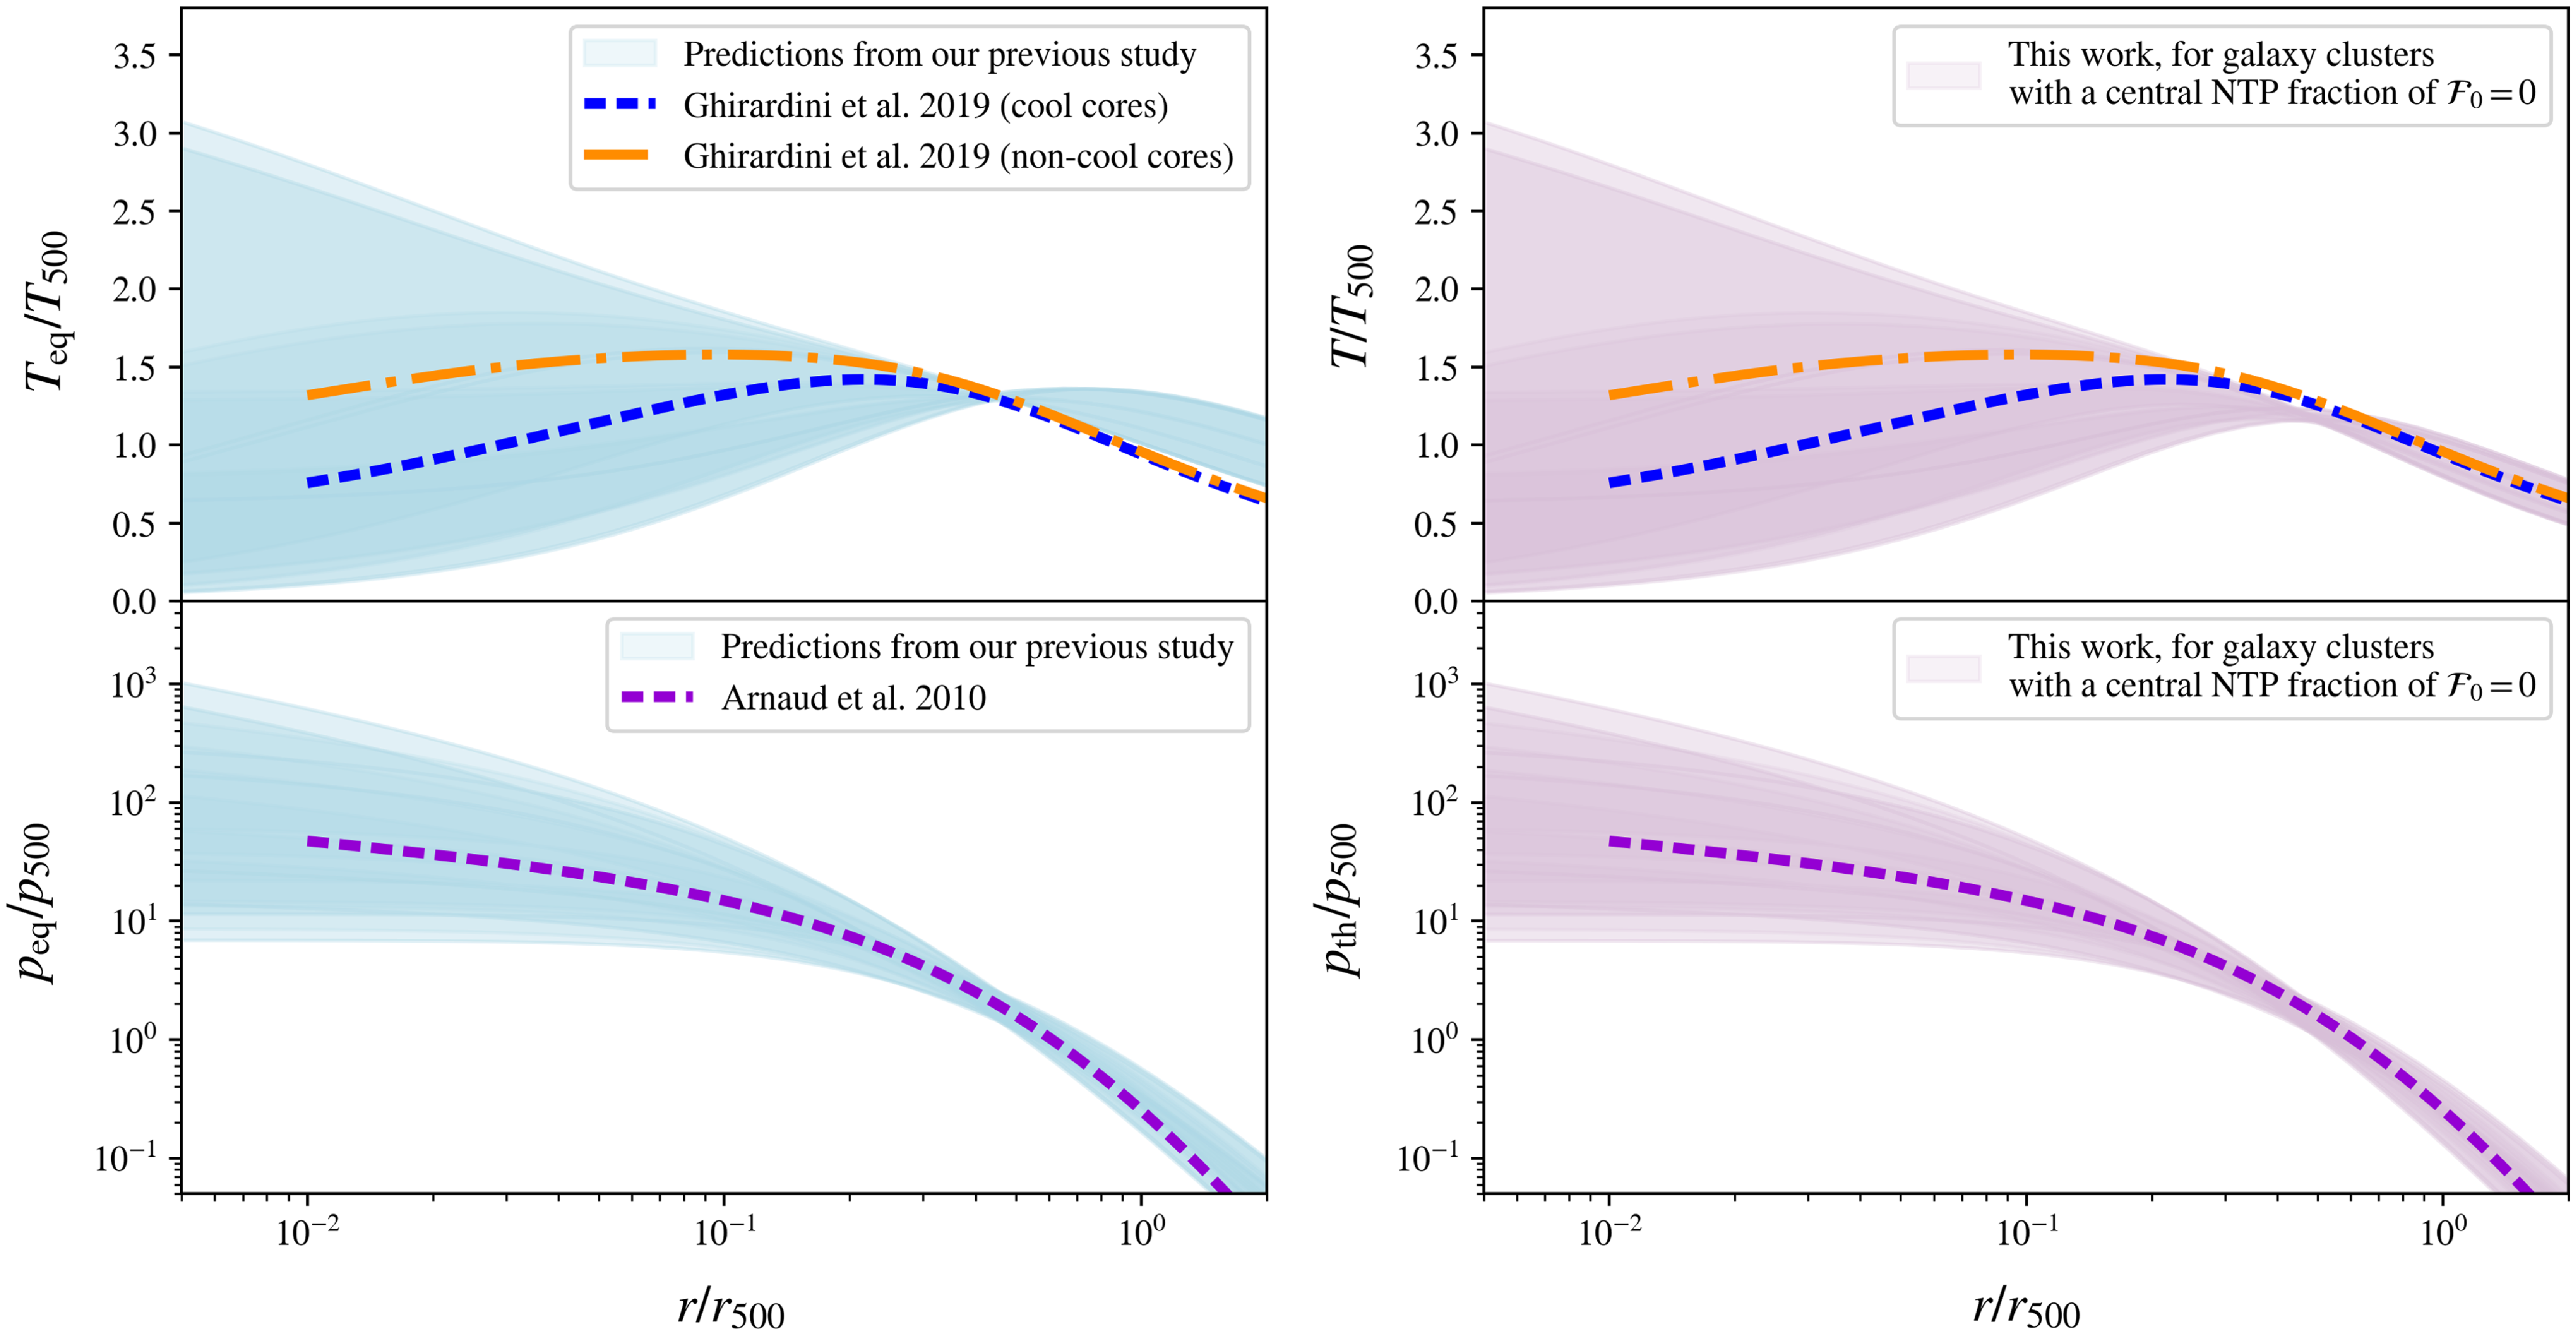
The corresponding scale-free parameter region of gas temperatures, $T/T_{500}$
, and thermal pressures,
$T/T_{500}$
, and thermal pressures, $p_\mathrm{th}/p_{500}$
, are traced over this same parameter space, as shown by the light purple shaded regions in the top right and bottom right panels of Fig. 5, respectively. These profiles are compared to the predictions from our previous work, S24b, given by the light blue shaded regions in the left panels of this figure: tracing the scale-free parameter region of pristine equilibrium temperatures,
$p_\mathrm{th}/p_{500}$
, are traced over this same parameter space, as shown by the light purple shaded regions in the top right and bottom right panels of Fig. 5, respectively. These profiles are compared to the predictions from our previous work, S24b, given by the light blue shaded regions in the left panels of this figure: tracing the scale-free parameter region of pristine equilibrium temperatures, $T_\mathrm{eq}/T_{500}$
, and equilibrium pressures pressures,
$T_\mathrm{eq}/T_{500}$
, and equilibrium pressures pressures, $p_\mathrm{eq}/p_{500}$
(as the thermal pressure, without NTP), in the top left and bottom left panels, respectively. Importantly, we see that including the proposed NTP profile in the cluster’s hydrostatic state predicts gas temperatures that are now consistent with observational constraints at large cluster radii.
$p_\mathrm{eq}/p_{500}$
(as the thermal pressure, without NTP), in the top left and bottom left panels, respectively. Importantly, we see that including the proposed NTP profile in the cluster’s hydrostatic state predicts gas temperatures that are now consistent with observational constraints at large cluster radii.
The gas’ temperature and thermal pressure profiles, in scale-free form $T/T_{500}$
and
$T/T_{500}$
and $p_\mathrm{th}/p_{500}$
, shown in the top and bottom panels, respectively, each traced over the scaled halocentric radius
$p_\mathrm{th}/p_{500}$
, shown in the top and bottom panels, respectively, each traced over the scaled halocentric radius $r/r_\mathrm{500}$
, for the ideal baryonic cluster halos: in pristine equilibrium, in the left panel, indicated by the light blue shaded region; and when including the minimum NTP fraction, as given by the fit for
$r/r_\mathrm{500}$
, for the ideal baryonic cluster halos: in pristine equilibrium, in the left panel, indicated by the light blue shaded region; and when including the minimum NTP fraction, as given by the fit for $\mathcal{F}_0=0 $
in Table 2, in the right panel, indicated by the light purple shaded region. These predictions are compared to recent observational fits for the temperature profile of galaxy clusters, from Ghirardini et al. (Reference Ghirardini2019), for samples of cool core clusters (the blue dotted line) and non-cool core clusters (the orange dash-dotted line), as well as to the universal gas pressure profile from Arnaud et al. (Reference Arnaud, Pratt, Piffaretti, Böhringer, Croston and Pointecouteau2010) (the purple dotted line).
$\mathcal{F}_0=0 $
in Table 2, in the right panel, indicated by the light purple shaded region. These predictions are compared to recent observational fits for the temperature profile of galaxy clusters, from Ghirardini et al. (Reference Ghirardini2019), for samples of cool core clusters (the blue dotted line) and non-cool core clusters (the orange dash-dotted line), as well as to the universal gas pressure profile from Arnaud et al. (Reference Arnaud, Pratt, Piffaretti, Böhringer, Croston and Pointecouteau2010) (the purple dotted line).
Implications for the hydrostatic bias
The NTP fraction at any given halocentric radius of a galaxy cluster will result in a hydrostatic bias, b(r), that arises when estimating the enclosed halo mass, M(r), from its observed thermal properties. This bias is typically quantified (as in, e.g. Pratt et al. Reference Pratt, Arnaud, Biviano, Eckert, Ettori, Nagai, Okabe and Reiprich2019; Salvati et al. Reference Salvati, Douspis, Ritz, Aghanim and Babul2019) by the definition:
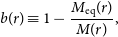 \begin{equation} b(r) \equiv 1 - \frac{M_\mathrm{eq}(r)}{M(r)},\end{equation}
where $M_\mathrm{eq}(r)$
is the halo mass deduced when assuming pristine hydrostatic equilibrium, and M(r) is the halo’s real mass. This hydrostatic bias will then be related to the value of the NTP fraction,
$M_\mathrm{eq}(r)$
is the halo mass deduced when assuming pristine hydrostatic equilibrium, and M(r) is the halo’s real mass. This hydrostatic bias will then be related to the value of the NTP fraction, $\mathcal{F}(r)$
, and its first derivative, in the form (see, e.g. Eckert et al. Reference Eckert2019):
$\mathcal{F}(r)$
, and its first derivative, in the form (see, e.g. Eckert et al. Reference Eckert2019):
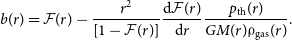 \begin{equation} b(r) = \mathcal{F}(r) - \frac{r^2}{\left[1 - \mathcal{F}(r)\right]} \frac{\mathrm{d} \mathcal{F}(r)}{\mathrm{d}r} \frac{p_\mathrm{th}(r)}{GM(r) \unicode{x03C1}_\mathrm{gas}(r)}.\end{equation}
In our scale-free framework, this is equivalent to:
 \begin{equation} b(s) = \mathcal{F}(s) - \frac{1}{3}\frac{s^2}{\left[1 - \mathcal{F}(s)\right]} \frac{\mathrm{d} \mathcal{F}(s)}{\mathrm{d}s} \frac{M_\mathrm{vir}}{M(s)}\frac{T(s)}{T_\mathrm{vir}},\end{equation}
now in terms of the dimensionless halo radius, s; a dimensionless ratio of the cluster’s true mass, M(s), to its virial mass, $M_\mathrm{vir}$
; and a dimensionless ratio of the cluster’s temperature, T(s), to its virial temperature,
$M_\mathrm{vir}$
; and a dimensionless ratio of the cluster’s temperature, T(s), to its virial temperature, $T_\mathrm{vir}$
. By construction, at
$T_\mathrm{vir}$
. By construction, at $r_{500}$
, the ratio of the cluster’s true mass to the virial mass
$r_{500}$
, the ratio of the cluster’s true mass to the virial mass $M_{500}$
will be unity; similarly, the ratio of the cluster’s temperature to the virial temperature
$M_{500}$
will be unity; similarly, the ratio of the cluster’s temperature to the virial temperature $T_{500}$
will be
$T_{500}$
will be $\simeq$
1 over the chosen parameter space at
$\simeq$
1 over the chosen parameter space at $r_{500}$
(see, e.g. S24b). The hydrostatic bias can then be estimated by our predicted minimum NTP fraction, which gives
$r_{500}$
(see, e.g. S24b). The hydrostatic bias can then be estimated by our predicted minimum NTP fraction, which gives $\mathcal{F} \simeq 0.20$
at
$\mathcal{F} \simeq 0.20$
at $r_{500}$
, as specified by the best-fit in Table 2, and the first derivative of this function, with respect to s, which will be analytic.
$r_{500}$
, as specified by the best-fit in Table 2, and the first derivative of this function, with respect to s, which will be analytic.
This NTP profile imposes a hydrostatic bias in the halo mass $M_{500}$
of
$M_{500}$
of $b \simeq 0.12$
, when measured within
$b \simeq 0.12$
, when measured within $r_{500}$
; in other words, when assuming there is no NTP contribution to the hydrostatic state of a galaxy cluster, the halo mass
$r_{500}$
; in other words, when assuming there is no NTP contribution to the hydrostatic state of a galaxy cluster, the halo mass $M_{500}$
will be underestimated by 12% of its real value. This hydrostatic bias will shift the scaling relations of the halo mass
$M_{500}$
will be underestimated by 12% of its real value. This hydrostatic bias will shift the scaling relations of the halo mass $M_{500}$
with respect to the cluster’s gas’ mean-weighted temperature observables and its integrated SZ signals by approximately this same bias (within
$M_{500}$
with respect to the cluster’s gas’ mean-weighted temperature observables and its integrated SZ signals by approximately this same bias (within $\sim$
12
$\sim$
12 $\pm 5\%$
from the results presented in S24b).
$\pm 5\%$
from the results presented in S24b).
5. Conclusion
We have applied constraints from observed gas entropy slopes to predict the NTP fraction that is required to explain these observations. Our key findings are summarised below.
-
• The required NTP fraction, $\mathcal{F}(r)$
, as a function of halocentric radius, r, is a radially increasing function, and can be parameterised by its value in the cluster’s core,
$\mathcal{F}_0$
.
$\mathcal{F}(r)$
, as a function of halocentric radius, r, is a radially increasing function, and can be parameterised by its value in the cluster’s core,
$\mathcal{F}_0$
. -
• This profile,
$\mathcal{F}(r)$
, is always well-fit to the functional form proposed in hydrodynamic simulations, as given in Nelson et al. (Reference Nelson, Lau and Nagai2014). -
• The profile for the minimum NTP fraction, defined as the case with
$\mathcal{F}_0=0$
, is in excellent agreement with the mean NTP fit predicted by numerical simulations, from Nelson et al. (Reference Nelson, Lau and Nagai2014) and Angelinelli et al. (Reference Angelinelli, Vazza, Giocoli, Ettori, Jones, Brunetti, Brüggen and Eckert2020), at large halocentric radii, when
$r\gtrsim 0.7r_{500}$
. -
• In the cluster’s central region, this minimum NTP fraction is consistent with the lower limit observational constraints from the Hitomi Collaboration et al. (2018) and Dupourqué et al. (Reference Dupourqué, Clerc, Pointecouteau, Eckert, Ettori and Vazza2023), which indicate that clusters have little or no NTP in their core.
-
• This profile for the minimum NTP fraction predicts the fractions of
$\mathcal{F} \simeq 0.20$
at
$r_{500}$
, and
$\mathcal{F} \simeq 0.34$
at
$2r_{500}$
. -
• Inclusion of this minimum NTP fraction into a hydrostatic equilibrium model predicts entropy, temperature, and thermal pressure profiles for the intracluster gas that are consistent with observations.
-
• NTP is an important feature in the halo mass scaling relations. Using the minimum NTP fraction results in a hydrostatic bias of
$b \simeq 0.12$
when measuring the cluster mass
$M_{500}$
within a halocentric radius of
$r_{500}$
.


As noted in the introduction, our expectation is that the NTP profile in a cluster will arise from a combination of gravitationally-driven shocks and mergers, primarily at larger halocentric radii, and feedback processes, such as powerful outflows driven by active galactic nuclei (AGNs), which should manifest at small radius. Our results indicate that the effects of NTP are more pronounced at larger radii, suggesting the important role of gravitational shocks, which are likely to be both strong and long-lived, as predicted by cosmological simulations of clusters (e.g. Power et al. Reference Power2020).
What does this mean for the contribution of feedback to the NTP profile? We observe powerful AGN jets in galaxy clusters (e.g. Shabala Reference Shabala2018) but they are understood to be intermittent, both in their observable properties and in the manner in which they impact their environment (e.g. Yates, Shabala, & Krause Reference Yates, Shabala and Krause2018). If we assume that feedback will be driven by jet dynamics and energetics, what does the implied form of the NTP profile at small radii mean for our physical understanding of the action of feedback? We will investigate this question in a forthcoming paper that investigates the NTP in the central region of galaxy clusters, specifically, whether or not realistic AGN feedback is consistent with zero NTP in the central regions of galaxy clusters.
Acknowledgements
AS acknowledges the support of the Australian Government Research Training Program Fees Offset; the Bruce and Betty Green Postgraduate Research Scholarship; and The University Club of Western Australia Research Travel Scholarship. AS and CP acknowledge the support of the ARC Centre of Excellence for All Sky Astrophysics in 3 Dimensions (ASTRO 3D), through project number CE170100013. CB gratefully acknowledges support from the Forrest Research Foundation.
Data availability
Not applicable.


 Open access