

1. Introduction
Consumers are presented with a vast amount of information when making purchasing decisions. Understanding consumer preferences and finding the optimal way to convey desired information to the consumer can benefit everyone along the supply chain. When it comes to agricultural goods, there has been a growing demand for both organic and locally grown foods. Producers and retailers typically present organic and local information to consumers in one of two ways: with a logo or via text (i.e., in writing). Understanding which presentation method is preferred by consumers can be a useful tool for farmers, producers, retailers, and policy makers. Further, if differences between willingness to pay (WTP) for logos and text are found, it would have considerable implications for studies examining preference and WTP for local and organic products given that recommendations could be affected by the experimental design.
With respect to local, demand for locally grown food has increased over the past decade with local U.S. food sales being estimated at about $6.1 billion in 2012 (Low et al., Reference Low, Adalja, Beaulieu, Key, Martinez, Melton and Perez2015). However, no consensus for the definition of local has been reached. For instance, in the Food, Conservation, and Energy Act of 2008, the U.S. Congress established a definition for local or regionally produced food as “(I) the locality or region in which the final product in marketed, so that the total distance that the product is transported is less than 400 miles from the origin of the product” or “(II) the state in which the product was produced.” (H.R. 6124, 2008, p. 279). However, the U.S. Department of Agriculture (USDA) Food and Nutrition Service (2018) allows entities to define local as they see fit with respect to purchasing for the USDA Farm to School Program. Similarly, states have different definitions of what constitutes local with many states, such as Connecticut (CT), having limited the definition to mean produced within state boundaries. To help in-state producers, states have created marketing programs to increase consumption of local products. According to Onken and Bernard (Reference Onken and Bernard2010), every state has at some point had some type of local promotional activity.
Of specific interest to this article is the value of Connecticut’s “CT Grown” campaign. In 1986, the CT Grown label was established but has only really become an active campaign over the past two decades in response to the growing trend in locally grown goods in the state (Connecticut Department of Agriculture, 2016). The importance of understanding the impact of this campaign has increased given that CT has a target of 5% of total food expenditures within the state that must be expenditures on locally grown food by 2020 (Connecticut General Assembly, 2011). Currently, a CT Grown logo is provided to value chain members wishing to use the logo. However, many value chain members choose to write “CT Grown” instead of using the CT Grown logo. As the CT Department of Agriculture, as well as policy makers, tries to increase local food consumption, it is essential to understand how consumers value these two labeling formats.
Organically grown food has also experienced an increase in demand over the past decade with sales topping $43 billion in 2015 (Organic Trade Association, 2018). According to the USDA, in April 2015, “the number of domestic certified organic operations increased by more than 5 percent over last year,” and since 2002, “the number of domestic organic operations has increased by over 250 percent” (USDA, 2015). The definition of “organic” is federally governed and has a uniform label that can be used on goods that have been certified as organic. Alternatively, value chain members can utilize text to indicate a product is certified organic.
The consumer decision-making process for food, more specifically local and organic food, has been widely researched. Schleenbecker and Hamm (Reference Schleenbecker and Hamm2013) give an overview of the state of research in the organic product market, and Patterson (Reference Patterson2006) presents a review of local state-level promotional programs. This article builds on these past works in several ways. First, by using a choice experiment and a latent class model (LCM), we look to determine whether there are differences in consumer preference and WTP for products labeled with a grown local state logo versus text. Although there have been many studies looking into WTP for locally and organically labeled products (such as Batte et al., Reference Batte, Hooker, Haab and Beaverson2007; Campbell et al., Reference Campbell, Lesschaeve, Bowen, Onufrey and Moskowitz2010; Darby et al., Reference Darby, Batte, Ernst and Roe2008; Deliza et al., Reference Deliza, Rosenthal, Hedderley and Jaeger2010; Govindasamy and Puduri, Reference Govindasamy and Puduri2011; Onozaka and McFadden, Reference Onozaka and McFadden2011), research examining different ways of presenting local/organic information is sparse. Consistent with much of the current research, we hypothesize (H1) that consumers will demonstrate a positive preference, and therefore a price premium, for “local” produce over nonlocal produce. We also hypothesize (H2) that consumers will show a stronger preference and WTP for produce labeled with a CT Grown logo over CT Grown label in text format. With respect to organic labeling, we hypothesize (H3) that organically indicated options (both logo and text) will be preferred to nonorganic options and that consumers will have a greater preference for the certified USDA organic label over certified organic in text format (H4).
Second, we utilized eye-tracking (ET) technology in conjunction with the choice experiment to allow us to better understand the process consumers go through while making their decision. Utilizing new technologies such as ET technology can provide researchers and businesses with new insights to help understand consumers. For instance, in order to sell a product, the product must be seen. If the overarching goal of local campaigns is to increase local sales, then maximizing exposure through visual attentiveness is essential. This includes not only grabbing a consumer’s attention quickly, but also holding it so the brain can process the information. Given findings by Pieters and Wedel (Reference Pieters and Wedel2004) that pictorial images capture attention faster, we hypothesize (H5) that the local and organic logos will be seen faster and looked at longer than their text counterpart given their graphical nature. This finding would be important as Behe et al. (Reference Behe, Campbell, Khachatryan, Hall, Dennis, Huddleston and Fernandez2014) has shown that more important attributes (i.e., have a higher WTP) are generally seen faster and looked at longer compared with less important attributes.
2. Background information
Understanding the consumer decision-making process along with consumer preferences can be beneficial to farmers and retailers in deciding what information to present to potential consumers and how to present it. Decision making is a cognitive process of gathering information from the external environment and using it to make a decision (Olson, Reference Olson and Hunt1978). Consumers in a shopping environment are presented with many cues that can be used to assess the product and make a purchasing decision. Olson (Reference Olson1972) posited a two-step cue assessment theory in which consumers first identify important cues before using them in judgments.
Attributes, or cues, such as price, origin, and production method have been studied extensively in consumer research with varied results. Darby et al. (Reference Darby, Batte, Ernst and Roe2008, p. 485) found evidence to “suggest that consumer demand does indeed exist for locally produced foods and that this demand is independent of other attributes that are often naturally associated with locally produced foods.” Further, Darby et al. (Reference Darby, Batte, Ernst and Roe2008) found that a “nearby” location had a similar impact as a defined state product origin label. Deliza et al. (Reference Deliza, Rosenthal, Hedderley and Jaeger2010) found that in the papaya market in Brazil, consumers valued ripeness higher than price and production method. Studies looking into preferences for local goods versus organic goods have also seen varied results. Both Thilmany, Bond, and Bond (Reference Thilmany, Bond and Bond2008) and Hu, Woods, and Bastin (Reference Hu, Woods and Bastin2009) found evidence that consumer preference was stronger for products identified as local compared with organic, whereas Batte et al. (Reference Batte, Hooker, Haab and Beaverson2007) found that shoppers in Ohio were willing to pay a price premium for organic, value-added products compared with identical products containing locally grown ingredients.
Additionally, previous studies have examined consumer perceptions of labeling. Schleenbecker and Hamm’s (Reference Schleenbecker and Hamm2013) overview finds multiple studies (e.g., Essoussi and Zahaf, Reference Essoussi and Zahaf2009; Hjelmar, Reference Hjelmar2011) that showed consumers look for certification and a label when buying organic, indicating consumers use labels as an indicator. Ernst and Darby (Reference Ernst and Darby2008) researched the effects of a state labeling program in Ohio and found that using an “Ohio Proud” label as a local indicator created significant influence in consumer choice. Furthermore, Campbell et al. (Reference Campbell, Lesschaeve, Bowen, Onufrey and Moskowitz2010) found premiums in Ontario for both the Ontario local label and organically labeled goods.
With respect to ET studies, Wedel and Pieters (Reference Wedel and Pieters2008, pp. 13–14) found that people do not look randomly, saying: “The areas in the visual brain are highly specialized to process information collected during eye fixations and continuously interact with areas that direct eye movement to salient and/or informative locations in visual scenes and stimuli, which enables purposeful and goal-directed eye movement.” In other words, the subconscious movement of the eye is guided by the type of information sought and its value to the task at hand (Behe et al., Reference Behe, Campbell, Khachatryan, Hall, Dennis, Huddleston and Fernandez2014). As technology has evolved, we are now able to begin to examine this process via ET to understand which attributes capture visual attention.
Previous ET research has found that consumers spend more time (fixations) viewing product attributes that are more important to them (Meißner and Decker, Reference Meißner and Decker2010). Teixeira, Wedel, and Pieters (Reference Teixeira, Wedel and Pieters2010) used ET data to investigate whether branded products receive more visual attention compared with unbranded products regardless of product size, and Sorensen, Clement, and Gabrielsen (Reference Sorensen, Clement and Gabrielsen2012) showed that a product name on a label attracted six times more attention than any organic production claim, and that illustrations captured more attention than health claims, even if the illustrations were irrelevant.
3. Materials and methods
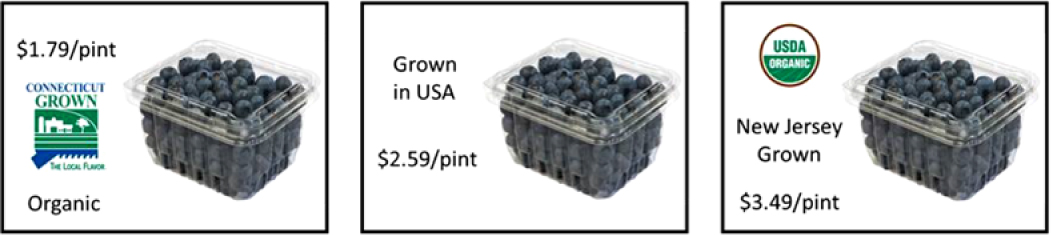
Choice experiments are a widely used method of measuring consumer preferences and WTP (e.g., Carroll, Bernard, and Pesek, Reference Carroll, Bernard and Pesek2013; Darby et al., Reference Darby, Batte, Ernst and Roe2008; Janssen and Hamm, Reference Janssen and Hamm2012). This study utilized a choice experiment in conjunction with ET to explore consumer preferences and WTP for three types of fresh produce (apples, blueberries, and sweet corn). The choice of produce was provided by the CT Department of Agriculture as it wanted to better understand the impact of CT Grown messaging on a variety of produce products (i.e., apples, blueberries, and sweet corn). Respondents were randomly assigned to a produce product before beginning the survey.
Three attributes were included in the design, including product origin, production method, and price (Table 1). For the origin attribute, six levels (CT Grown logo, CT Grown text, within region state grown, U.S. grown, grown outside the United States, and no origin given) were used to identify where the product was produced. The state listed for “within region state” varied by type of produce and was based on the amount of imports into CT. For instance, New York Grown was used for apples and sweet corn, while New Jersey Grown was used for blueberries when the “within region state” attribute level was displayed. The production method attribute had four levels, including certified organic logo, certified organic text, sustainably grown, and no information. Given that definitions of organic and sustainably grown are not generally provided in retail environments, respondents were only provided the logo/text and no supplemental information. The price attribute consisted of four levels that varied by product. Prices for each product were chosen by examining prices at different retail outlets (i.e., grocery stores and farmers’ markets) and in conjunction with the CT Department of Agriculture.
Choice experiment attribute levels

The combination of three attributes with their corresponding levels represented a four-by-four-by-six design, which put the total number of possible product profile combinations at 96 and would likely result in fatigue for the respondent. Similar to Carroll, Bernard, and Pesek (Reference Carroll, Bernard and Pesek2013), among others, a D-efficiency criterion was used to determine the choice sets to be shown during the experiment. The D-efficiency criterion compares an orthogonal balanced design with design efficiency (Kuhfeld, Reference Kuhfeld2010). A total of eight choice sets were presented consisting of three product profiles, as well as a “none” option. Figure 1 shows an example of one choice set presented to a participant. The same picture for each product and the same font size and style for all written attributes were used throughout the choice experiment. The location of the attributes varied within each choice.
Sample choice set (“no choice option” not listed).a
3.1. Data collection
During late summer and fall 2014, data were collected in both a lab setting and at multiple farmers’ markets throughout CT. Though data were collected at different locations and settings, the experiment procedures were constant for each. With respect to recruitment of respondents at the farmers’ market, a tent (similar to other vendors at the farmers’ market) was set up within the farmers’ market. Consumers passing the tent were randomly asked if they would like to participate in the survey. The lab locations were set up at several University of Connecticut extension centers throughout the state, as well as on campus. For the lab locations, respondents were recruited via a number of media outlets (e.g., online, newspapers, and trade bulletins) with the help of University of Connecticut extension personnel. The ET setup and procedures between the field and lab locations were identical except for the location and means of recruiting respondents.
Potential respondents were asked if they had an interest in participating and whether they qualified to participate in the study. To qualify, the respondent had to be 18 years of age or older and had to have purchased produce (i.e., blueberries, apples, sweet corn) that corresponded to the produce product they were randomly assigned. Those agreeing and qualifying to take part in the survey then signed an institutional review board–approved informed consent form.
Respondents were then seated in front of a computer monitor, had the survey procedure explained, and were calibrated to an ET device (Tobii X1 Light, Danderyd, Sweden). The ET device was located just below the computer monitor. The ET device refracts infrared beams of light off the pupil, capturing the position the pupil is fixating or moving on the image/screen, and records the sequence at millisecond intervals. After calibration, respondents continued to the choice experiment portion of the survey. They were encouraged to sit still during the data collection process so that their eye movements could be captured more accurately. The survey started with a slide of written instructions telling participants they would be shown pictures of a group of three products with varying attributes, to assume they were in a shopping situation and would be making a purchasing decision, and to keep in mind their budget constraints when making their decision. Further, they were told that they would be presented with three options on the screen and asked to indicate whether they would purchase option 1 (on the left), 2 (in the center), 3 (on the right), or “none” (if they would not purchase any of the options presented).
During the choice experiment, respondents were asked to verbally indicate their choice to the researcher in order to minimize head movement for more accurate eye-tracking results. Next, participants were shown a sample choice set (different unrelated product) to allow them to become familiar with the format of the study. Once they indicated they were ready and had no questions, they were presented with the first of eight consecutive choice sets. To minimize order bias, slides were randomized with each product having four randomizations. Furthermore, the same laptop and display screen were used at each location to ensure that the image quality and size were the same between locations. After completing the choice experiment of the survey, participants completed a questionnaire containing demographic, purchasing, and behavioral questions (i.e., where to shop and why shop at specific locations). Finally, each respondent was provided $20 for participating in the survey.
In total, 300 respondents (100 per product) were surveyed over the course of the data collection period. Given the primary goal was to better understand the valuations of produce buyers, nonbuyers were excluded from participating in the survey as noted in the qualification process. Participants that indicated they were product purchasers at the beginning (qualifying question) but then marked that they did not purchase the product in the purchase behavior section were eliminated from the analysis. After eliminating nonbuyers, a total of 255 participants were used in the final analysis (88 for apples, 81 for blueberries, and 86 for sweet corn).
Demographics for each product type can be found in Table 2. The median age for apple, blueberry, and sweet corn participants was 37, 44, and 38 years, respectively. U.S. Census data for 2013 have the median age of CT residents as 40 years old, which is very close to our sample median. Median household income for apple, blueberry, and sweet corn participants was $65,242, $70,987, and $78,304, respectively. U.S. Census data reported median household income in CT for 2013 to be $69,461, which is very close to our sample income as well. The percentage of Caucasian consumers ranged from 60% to 65% for each product type, which is below the CT average. With respect to field versus lab setting, a higher proportion of Caucasian consumers was surveyed at the lab setting than in the field. The average total number of people in a household was slightly higher for all products than the average household size in CT of 2.55 (Table 2). Similarly, compared to the average for CT, our sample consisted of more females than males. However, as noted by Zepeda (Reference Zepeda2009), Flagg et al. (Reference Flagg, Sen, Kilgore and Locher2013), and Wolfe (Reference Wolfe2013), women are more likely than men to be the member of the household that shops.
Summary statistics of the sample by product type

3.2. Model: latent class model of consumer choices
A difference in preferences, if any, for local or organic attributes because of the presence or absence of a label may be attributed to potentially unobservable individual characteristics. As noted by Nie and Zepeda (Reference Nie and Zepeda2011), individual characteristics such as demographics have been shown to influence consumer consumption of local and organic food products. Therefore, as numerous studies have used before, we utilized a LCM to account for unobserved heterogeneity between respondents (Boxall and Adamowicz, Reference Boxall and Adamowicz2002; Greene and Hensher, Reference Greene and Hensher2003; Kafle, Swallow, and Smith, Reference Kafle, Swallow and Smith2014, Wedel and Kamakura, Reference Wedel and Kamakura2000). As Greene and Hensher (Reference Greene and Hensher2003) note, the latent class formulation is similar to the mixed logit model commonly used in discrete choice analysis.Footnote 1 The LCM is a semiparametric extension of multinomial logit model that relaxes the mixed logit models requirement that the analyst makes specific assumptions about the distributions of parameters across individuals (Greene and Hensher, Reference Greene and Hensher2003). This is a beneficial model because it is readily recognized that consumers are heterogeneous in their tastes and preferences (Wedel and Kamakura, Reference Wedel and Kamakura2000). Additionally, following much of the LCM literature, we chose the number of classes based on the Akaike information criterion (AIC) comparing improvement in the model fit attributable to an extra class with the best-fitting model having the smallest AIC value (Greene and Hensher, Reference Greene and Hensher2003; Kafle, Swallow, and Smith, Reference Kafle, Swallow and Smith2014; Wedel and Kamakura, Reference Wedel and Kamakura2000). Comparing AIC values, we found that using a model with two classes for each product provided the lowest AIC.
The indirect utility for a consumer i belonging to class s from choosing product j is given by
 $${U_{ij|s}} = {X_j}{\beta _s} + {\varepsilon _{ij}},$$(1)
where Xj represents a vector of attributes of product j, including price, CT Grown logo, CT Grown text, USDA certified organic logo or text, and so forth. βs is a vector of class-specific taste parameters. εij is the error term that follows an independent and identically distributed type I extreme value distribution. LCM estimates the unconditional probability that a consumer i can be attributed to a class s based on sociodemographic characteristics, which is given by
 $$Pro{b_{is}} = {{\exp ({\theta _s}{Z_i})} \over {\sum\nolimits_s {\exp ({\theta _s}{Z_i})} }},$$(2)
where Zi is a set of sociodemographic characteristics for consumer i, and θs is a vector of parameters determining the class membership probability. After matching an individual with his/her likely class, conditional on belonging to class s, probability that individual i chooses product j is given by
 $$Pro{b_{ij|s}} = {{\exp ({\mu _s}{X_j}{\beta _s})} \over {\sum\nolimits_j {\exp ({\mu _s}{X_j}{\beta _s})} }},$$(3)
where μs is the scale parameter for a class s and is normalized to 1. Therefore, the joint probability that consumer i in class s chooses product j can be expressed as
 $$Pro{b_{ijs}} = Pro{b_{j|s}} \times Pro{b_{is}} = {{\exp ({\mu _s}{X_j}{\beta _s})} \over {\sum\nolimits_j {\exp ({\mu _s}{X_j}{\beta _s})} }} \times {{\exp ({\theta _s}{X_i})} \over {\sum\nolimits_s {\exp ({\theta _s}{Z_i})} }}$$(4)
Using the utility parameters from the LCM, we calculate WTP values for each significant attribute. We then utilize a Wald test to determine if there are differences between local logo and local text labeling, as well as organic logo and organic text labeling. Finally, we calculate WTP via βs/(−βp), where βs is the estimated coefficient for the desired attribute, and βp is the estimated price coefficient. In some of the classes, the price coefficient was not significant. In these cases, we did not calculate WTP values given that the price coefficient is not statistically different from zero.
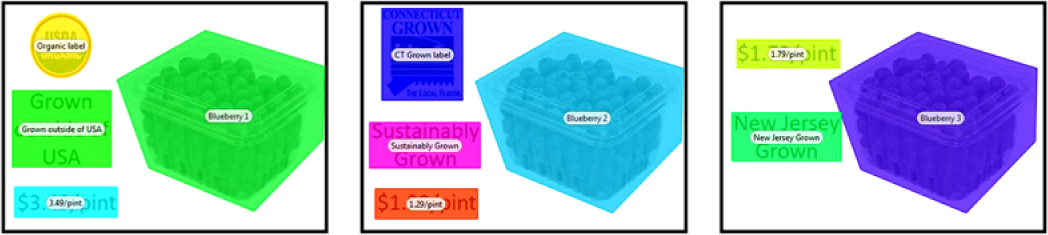
3.3. Eye-tracking analysis
After the experiments, Tobii Studio-3.0.2.218 (Tobii, Danderyd, Sweden) was used to compile the visual metric calculations of specific areas of interest (AOIs). An AOI is a section of the image chosen to be analyzed. In Tobii Studio software, the researcher is able to specifically select these areas before the data are analyzed. In this study, AOIs were created for every attribute in each choice set. Figure 2 gives an example of a choice set with AOIs drawn on attributes. After creating the AOIs, four metrics were selected to be calculated, including time to first fixation (TFF), first fixation duration (FFD), total visit duration (TVD), and fixation count (FC). TFF, FFD, and TVD are measured by the ET at the millisecond level. As noted in Behe et al. (Reference Behe, Campbell, Khachatryan, Hall, Dennis, Huddleston and Fernandez2014), TFF is a measure of how many seconds it took a participant to first fixate on a particular AOI from the time the display (e.g., Figure 1) appeared on the computer screen. A lower TFF implies that the AOI “commands” attention as it “caught” a consumer’s attention quickly. FFD represents the length of time, in seconds, that the participant fixated on an AOI during his or her first fixation. TVD is the total number of seconds that a participant looked at a particular AOI over the total time he or she was observing the presented slide. Finally, FC is the total number of times a participant fixated on an AOI. With respect to ET analysis, we compare ET measures via a t-test. First, we tested whether there were differences in the ET measures across classes for the CT Grown logo, CT Grown text, USDA logo, and organic text. We then examined whether there were significant differences between ET measures for CT logo versus CT text and organic logo versus organic text.
Sample choice set with areas of interest.
4. Results and discussion
4.1. Latent class model and WTP results: apples
The results for the two different LCM model classes for each product are presented in Table 3. The coefficients in Table 3 are partial utility estimates, while the coefficients in the class probability model section represent the probabilities associated with being in a specific class compared to the other class. We find the CT Grown logo is preferred to no label; however, CT Grown text is not significantly preferred to no label. Furthermore, we find the USA grown and NY Grown labels are not significantly different from an apple with no label, whereas the grown outside the U.S. label is preferred less than no label. Examining the apple WTP results in Table 4, we find that respondents in class 1 were willing to pay about $0.68/lb. more for apples with the CT Grown logo than an apple with no label. With respect to differences between the CT Grown logo and CT Grown text, we find a significant difference between the coefficients (Table 5). Notably, the CT Grown logo is preferred to CT Grown text. However, we find that WTP estimates have overlapping confidence intervals, which implies that even though respondents in class 1 preferred the CT Grown logo over CT Grown text, they were not willing to pay a premium for the logo.
Latent class model results

Notes: Bold coefficient estimates represent significant difference from zero at the 0.10 level or less. AIC, Akaike information criterion.
Willingness-to-pay (WTP) values based on the latent model results

Notes: Bold coefficient estimates represent significant difference from zero at the 0.10 level or less. CL, confidence limit.
Wald test results associated with testing various coefficient restrictions

a The latent class comparisons refer to the comparisons being made via in the Wald test. For instance 1/1 implies two coefficients within class 1 are being compared, 2/2 implies two coefficients in class 2 are being compared, and 1/2 implies a coefficient from class 1 is being compared to a coefficient in class 2.
Note: Asterisks (*, **, and ***) represent statistical significance at the P < 0.1, 0.05, and 0.01 levels, respectively.
Evaluating class 2, we find a nonsignificant price coefficient, which could be caused by this class being extremely focused on the origin and production characteristics (Table 3). Given that the price coefficient is not significant, we do not calculate WTP estimates for class 2. However, we do find that the CT Grown logo and CT Grown text are preferred to no label as is the USA grown label. Similar to class 1, a direct comparison of the CT Grown logo with CT Grown text indicates that the logo is preferred to text (Table 5).
With respect to the production attributes for apples, we find that both classes have a preference for production information compared with no label (Table 3). All three methods, organic logo, organic text, and sustainably grown text had positive and statistically significant coefficients. The USDA certified organic logo garnered a $0.79/lb. premium over no production practice label, while certified organic text and sustainably grown labels had a premium of $1.07/lb. and $0.52/lb., respectively (Table 4). However, we do not find that the differences in premiums are significantly different for organic logo, organic text, and sustainably grown labels.
Evaluating the probability model results, we find respondents at a farmers’ market were less likely to be in class 1 compared with class 2. The fact that farmers’ market consumers were more likely to be in class 2 is most likely the driving force behind the significant and higher coefficients for local (CT Grown logo and CT Grown text label) compared with class 1. Furthermore, we find that age, income, and number of persons in the household affect class membership, with class 1 being more likely to be younger, have a middle-income level, and have more persons per household than class 2.
Of central interest to this article is whether local produce is preferred, whether logos or text are preferred, and what attributes one class value might over another class. We find that local and organic produce is preferred to nonlocal and nonorganic produce across classes, which supports H1 (preference for local produce) and H3 (preference for organic produce), respectively (Table 3). With respect to logo versus text, we find that CT Grown logos are preferred to CT Grown text for both classes, which provides support for H2 (local logo preference over local text label). However, the organic logo is not preferred to organic text in either class 1 or class 2 (Table 5), which provides evidence against H4 (organic logo preferred over organic text label). In comparing across classes, we find that class 1 has higher preference for the organic logo than class 2, with both classes preferring the local logo and text the same, as well as organic text the same (Table 5).
4.2. Latent class model and WTP results: blueberries
Class 1 shows a positive preference for locally produced blueberries that are labeled with a logo and text compared with blueberries that are not labeled (Table 3). Notably, blueberries that have a CT Grown logo affixed would garner a $1.33/pint premium compared with nonlabeled blueberries, while the CT Grown text-labeled blueberries would generate a $0.86/pint premium (Table 4). However, our results indicate no significant difference between WTP for the logo and text. Unlike the apple results, we find no significant differences between local logo and local text labels (Table 5).
Class 2 had an insignificant price coefficient, which we hypothesize is the result of respondents in this class caring more about the origin and production attributes than price (Table 3). As such, WTP values are not calculated for class 2. However, the parameter estimates indicate respondents preferred local blueberries given the significant local logo and text. In comparing logo versus text, we find that respondents in class 2 preferred the logo and text the same (Table 5).
Evaluating the production practice results for class 1 indicates that only organic text is different from no label. However, both organic text and logo are preferred to no label by class 2. When examining whether text and logo are different, we find that class 1 prefers organic text to an organic logo; however, class 2 prefers the organic logo to organic text. This is an interesting finding as the results could create an issue for agribusiness firms. Should firms use the organic logo, which is preferred by class 2, or should they utilize organic text, which is preferred by class 1 and, though preferred less by class 2, is still preferred to no label. More research is needed to discover the true reason for why these classes have diverging preferences.
Results from the blueberry sample indicate that most of the participants (81%) fit into class 1 (Table 3). However, unlike the apple model, we were unable to identify any significant variables within the probability model. Together, classes 1 and 2 support H3 (preference for organic produce) with respondents preferring organic blueberries with at least one of either the organic logo or organic text being positive and significant (Table 3). H4 (organic logo over organic text) was supported by results in class 2 as the coefficient for USDA certified organic logo was larger than for certified organic text (Table 5). However, in class 1 certified organic text was preferred to the logo, which provides evidence against H4.
4.3. Latent class model and WTP results: sweet corn
Class 1 shows preference not only for local (CT Grown) sweet corn, but also sweet corn produced in New York compared with product with no label (Table 3). This is similar to the results of Darby et al. (Reference Darby, Batte, Ernst and Roe2008) that consumers may relate nearby areas as local and value them similar to state origins. This equates to a price premium per half dozen of $1.99, $1.45, and $0.71 for CT Grown logo, CT Grown text, and NY Grown, respectively (Table 4). Evaluating differences between CT Grown logo versus CT Grown text, we find that the local logo and text are preferred the same, as well as having similar WTP values (Tables 4 and 5). Of interest, the CT Grown logo has a higher WTP than NY Grown, but CT Grown text and NY Grown WTP difference is not significantly different.
Similar to class 1, class 2 prefers CT Grown logo and CT Grown text to no label; however, unlike class 1, class 2 prefers USA grown to no label (Table 3). The CT Grown logo generates a $2.46 per half dozen premium over no label, while the CT Grown text and USA grown label generate a $1.59 and $0.96 per half dozen premium, respectively (Table 4). Again, similar to class 1, CT Grown logo and CT grown text are preferred the same with WTP values being equivalent as well.
The organic logo and organic text labels are preferred over no label by class 1, but only the organic logo is preferred to no label by class 2 (Table 3). The organic logo might expect to garner a $0.61 and $1.02 per half dozen premium over no label from class 1 and class 2 respondents, respectively (Table 4). The organic text label has a $0.74 per half dozen premium for class 1, but no premium for class 2. However, in comparing logo versus text labels, we find no differences for either class (Table 5). This implies that though organic is preferred to no label by class 2, there is no difference between logo and text for class 2.
In reference to class characteristics, 62% of respondents were classified into class 1 with 38% classified into class 2. Class 1 is more likely to be older and have higher incomes than class 2. We do not find that survey location affected class membership for the sweet corn experiment. Further, gender was not a factor that affected class membership.
With respect to hypothesis testing and class differences, we find that the positive preference for local and organic sweet corn is found in each class, supporting H1 (preference for local produce) and H3 (preference for organic produce). However, we do not find support for H2 (local logo over local text) or H4 (organic logo over organic text) as our results indicate the coefficients are not different from each other. The main differences in preference between class 1 and class 2 for sweet corn related to local labeling. Notably, class 1 has a higher preference for the CT Grown logo compared with class 2, while also preferring CT Grown text more than class 2. We find no differences between class 1 and class 2 for the organic logo or organic text.
4.4. Eye-tracking results: overall comparisons
Table 6 summarizes the statistics of results from the eye-tracking experiments on apples, blueberries, and sweet corn for the origin and production method attributes. Focusing first on the CT Grown logo and CT Grown text comparison, we find that for apples and sweet corn the TFF was lower for the CT Grown logo in comparison with the CT Grown text. This implies that the logo captured attention faster than text. For instance, the logo was seen 0.59 and 0.67 seconds faster than the text for apples and sweet corn, respectively. There was no difference in TFF for blueberries. With respect to organic labeling, we found no difference in TFF between the logo and text across apples, blueberries, and sweet corn. A potential reason for the lack of significance for the organic logo/text compared with the significant difference for CT logo/text could be the coloring and text font associated with the CT logo (green, blue, and white) compared with the USDA organic logo (green, brown, and white). With respect to FC and TVD, we find that across all products the logos (CT and organic) were viewed more times and for longer periods compared with their text (CT and organic) counterparts. The exception is FC in the sweet corn experiment where there is no difference between organic logo and text.
Summary results of the eye-tracking portion of the experiment

Note: Asterisks (*, **, and ***) represent statistical significance at the P < 0.1, 0.05, and 0.01 levels, respectively.
These finding in conjunction with the choice experiment results provide evidence for H5. Thereby, our results are in-line with Meißner and Decker’s (Reference Meißner and Decker2010) assertion that consumers spend more time viewing products that are more important to them. Further, these findings provide evidence for agribusiness firms that a logo is generally seen faster, looked at more times, and viewed for longer durations than text signage. Given consumers generally only take a short amount of time looking for or deciding on which product to purchase, signage that captures and holds consumers’ attention would be beneficial to agribusiness firms.
5. Conclusions
This study used a choice experiment and ET to examine the consumer decision-making process and preferences for local- and organic-labeled agricultural goods. Specifically, we used a choice experiment to determine if there is a difference in consumer WTP when the local or organic information is given with a uniform label or presented by text. In an attempt to account for potential unobserved heterogeneity in consumer preferences, we used an LCM and were able to place consumers into two classes for each product based on their preferences. Additionally, we used ET data to help explain the results. Potential limitations of this study are the relatively small sample size per product and artificial nature of having a respondent look at a computer screen when making a purchasing decision. Future research may want to expand the sample size and test more products in order to see if differences are similar to those found in this article.
Our analysis showed a strong preference for local produce across all products examined. Regardless of class, preference for local goods that used the CT Grown label was higher than for no label. This can be valuable information for farmers, producers, and retailers. Not only can it help them make a decision on creating or promoting goods as local, but it also provides information suggesting that the best course of action would be to have local produce and to promote it using the CT Grown label. For all produce studied, the CT Grown logo was preferred as much as or more than the CT Grown text. Combining this with the ET data that indicated the CT Grown logo will catch the attention of consumers and keep their attention longer as they make their purchasing decision, the CT Grown logo seems to be a better choice than the CT Grown text label. Additionally, this information can be helpful to legislators who have set the goal that 5% of food expenditures in the state be expenditures on locally grown food. Understanding consumers’ preference for local goods marked with the CT Grown label, stakeholders can encourage adoption of the label throughout the state.
Results with respect to production method are less straightforward and present opportunities for future research. Overall, organically grown products were preferred to nonorganic produce, which was expected. However, preference for the organic logo versus organic text varied by product. For instance, for the apple and sweet corn products, the logo and text coefficients were similar; however, for blueberries, class 1 preferred organic text and class 2 preferred the logo. Further, we find that the logo did not capture attention faster but did have a higher TVD. There is research that could start to explain this with findings of poor consumer understanding of organic labeling (Lenzner et al. Reference Lenzner, Kaczmirek and Galesic2011) or a distrust in government labeling (Sonderskov and Daugbjerg, Reference Sonderskov and Daugbjerg2011), but further research building on the relationship between stated preferences and eye-tracking data is needed.
Financial support
Funding has been provided by the Specialty Crop Block Grant Program of the Agricultural Marketing Service, U.S. Department of Agriculture, awarded and administered by the Connecticut Department of Agriculture.


 Open access