


1. Introduction
Increasing commonality within a product family – for example, by reusing modules or platforms across products – is a well-established strategy for reducing internal complexity while maintaining the external variety demanded by the market (Reference Ripperda and KrauseRipperda & Krause, 2017). From a strategic perspective, firms must weigh the benefits of such design strategies against the costs they introduce (Reference Fixson, Simpson, Siddique and JiaoFixson, 2006; Reference Hackl, Krause, Otto, Windheim, Moon, Bursac and LachmayerHackl et al., 2020; Reference LabroLabro, 2004). However, robust methods for evaluating their cost effects remain largely absent in current practice (Reference Nørgaard, Grønvald, Christensen and MortensenNørgaard et al., 2025; Reference Ripperda and KrauseRipperda & Krause, 2017). In particular early-stage development decisions during design have a profound influence on downstream costs (Reference Fixson, Simpson, Siddique and JiaoFixson, 2006; Reference Hackl, Krause, Otto, Windheim, Moon, Bursac and LachmayerHackl et al., 2020). Many benefits of these strategies manifest indirectly, primarily by streamlining overhead and support activities rather than lowering direct component costs. Moreover, commonality introduces interdependencies in how products consume resources (i.e., structural entanglements). This complicates tracing and allocating costs, given that comprehensive data on resource consumption across the entire product family is often impractical and costly to obtain (Reference Balakrishnan, Hansen and LabroBalakrishnan et al., 2011). As a result, current research remains largely conceptual or limited to single case studies, restricting the generalizability of findings.
This study develops a simulation-based framework to assess the resource consumption and cost effects of product family design strategies. Specifically, we investigate how empirically documented product architectures shape resource consumption patterns and consequently costs, and compare them to those generated by established approaches in the cost accounting literature (e.g., Reference Anand, Balakrishnan and LabroAnand et al., 2019). Simulation is widely used in this field for generating benchmarks without extensive resource data, hence most studies lack a solid empirical foundation.
We conduct large-scale numerical experiments using the Extended Axiomatic Design (EAD) framework (Reference Meyer, Meßerschmidt, Mertens, Schröder and WegnerMeyer et al., 2019). EAD integrates Reference SuhSuh’s (1990) axiomatic design principles with the cost accounting model of Reference Anand, Balakrishnan and LabroAnand et al. (2019). It uses Domain Mapping Matrices (DMMs) to represent product families across multiple domains, enabling the derivation of resource consumption patterns directly from the underlying product and system architecture (Reference Mertens, Rennpferdt, Greve, Krause and MeyerMertens et al., 2023). To ensure empirical grounding, the model’s DMMs are calibrated with case studies identified through a systematic review of the product design literature.
This study makes three main contributions to the field of product design and cost modelling. (1) A total of 53 DMMs were processed and standardized from documented case studies. This dataset enhances the generalizability of our results and provides an empirical foundation for our framework. Moreover, it provides a reusable resource for future research. (2) The EAD framework provides a standardized representation of product family design which not only upholds axiomatic design principles (Suh, 2001) but also incorporates an economic perspective. It supports design decision-making and addresses calls for interdisciplinary models capable of evaluating the cost effects of design strategies (Reference Nørgaard, Grønvald, Christensen and MortensenNørgaard et al., 2025; Reference Ripperda and KrauseRipperda & Krause, 2017). (3) Our simulations reveal that resource consumption patterns generated under EAD for product families are significantly denser and more homogeneous compared to prior studies (e.g., Reference Balakrishnan, Hansen and LabroBalakrishnan et al., 2011; Reference Schmidt, Mertens and MeyerSchmidt et al., 2023). Thus, EAD helps generalize insights of previous cost accounting studies based on realistic product family designs (i.e., dense and homogenous scenarios).
2. Related literature
Several streams of prior research in both engineering and cost accounting have assessed product variety and related questions, how many and which variants a firm should offer and how to manage the related complexity costs. Reference Ripperda and KrauseRipperda and Krause (2017) review the cost effects of variety and modularity, along with existing modular design strategies. In addition, various studies propose methods to support cost-based decision-making between alternative modular design strategies (e.g., Reference Hackl, Krause, Otto, Windheim, Moon, Bursac and LachmayerHackl et al., 2020; Reference Ripperda and KrauseRipperda & Krause, 2017; Reference Schwede, Greve, Krause, Otto, Moon, Albers, Kirchner, Lachmayer, Bursac, Inkermann, Rapp, Hausmann and SchneiderSchwede et al., 2022; Reference Skirde, Kersten and SchröderSkirde et al., 2016). Reference Fixson, Simpson, Siddique and JiaoFixson (2006) examines cost effects driven by product architecture, though his focus remains on individual products and does not account for limited cost information. Moreover, the scope of modular design strategies extends beyond the product to the system architecture, encompassing, for example, the production domain (Reference Mertens, Rennpferdt, Greve, Krause and MeyerMertens et al., 2023). Reference LabroLabro (2004) reviews the literature on the cost effects of component commonality across products through the lens of an activity-based costing framework, but does not draw general conclusions. Her broader research extensively employs simulation-based approaches to explore costing system design and support cost-based decision-making (e.g., Reference Anand, Balakrishnan and LabroAnand et al., 2017). Reference Nørgaard, Grønvald, Christensen and MortensenNørgaard et al. (2025) discuss how conventional costing systems fail to accurately capture the cost effects of modular design strategies, hindering their application. Their study highlights a persistent gap between cost accounting and innovation and operations management, reinforcing the need for integrated models.
3. Method
3.1. Extended axiomatic design
This study builds on EAD, enabling the modelling of product family design and the evaluation of its consequences, such as its impact on costs or costing accuracy (Reference MertensMertens, 2020; Reference Mertens, Schmidt, Yildiz and MeyerMertens et al., 2021; Reference Meßerschmidt, Gumpinger, Meyer and MertensMeßerschmidt et al., 2020; Reference MeßerschmidtMeßerschmidt, 2025; Reference Meyer, Meßerschmidt, Mertens, Schröder and WegnerMeyer et al., 2019). The model unifies axiomatic design principles (Suh, 2001) and the cost accounting model of Reference Anand, Balakrishnan and LabroAnand et al. (2019). These design principles are commonly applied to support decision-making during the design process (Reference Gonçalves-Coelho and MourãoGonçalves-Coelho & Mourão, 2007; Reference Kulak, Cebi and KahramanKulak et al., 2010; Reference Mertens, Rennpferdt, Greve, Krause and MeyerMertens et al., 2023), typically by evaluating a design based on its what-to-how mapping. From a technical perspective, a design is considered effective if it satisfies the independence and information axioms (Suh, 2001). In contrast, the economic perspective seeks to maximize revenue by offering a targeted product variety at reasonable costs (Reference Ripperda and KrauseRipperda & Krause, 2017). The EAD framework bridges these perspectives at an operational level.
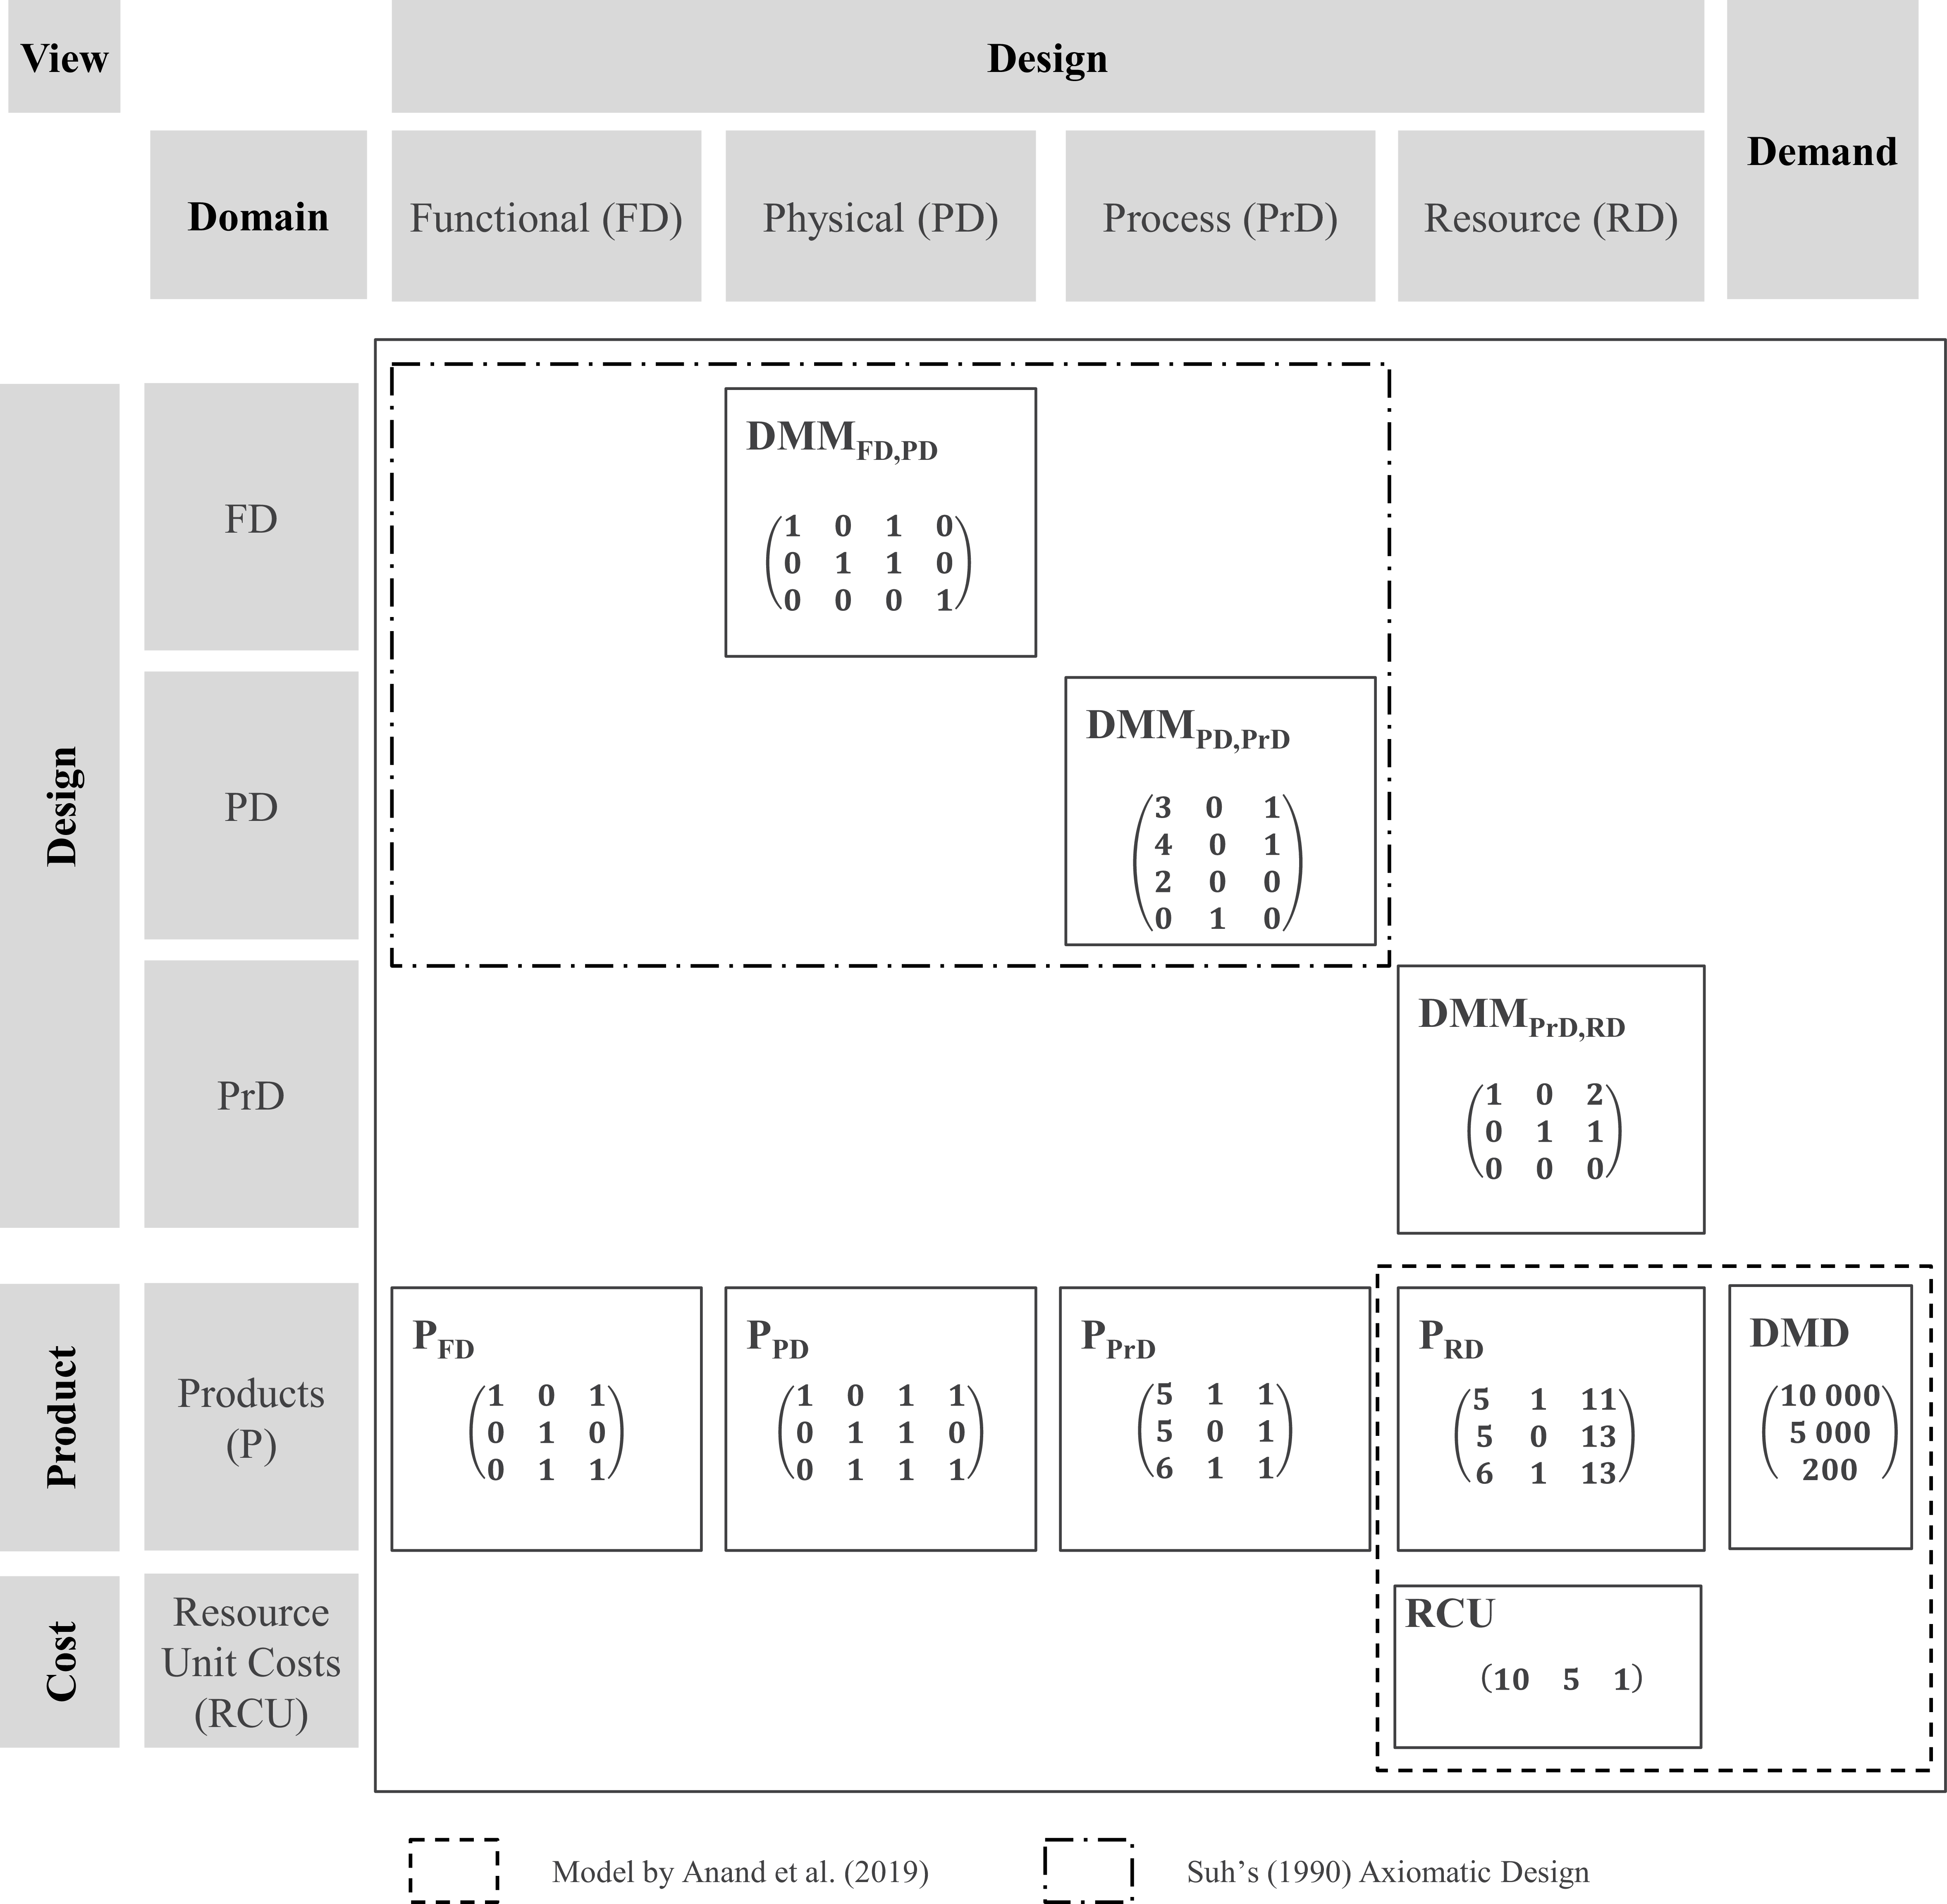
The model is structured across multiple domains, as illustrated in Figure 1. The functional domain (FD) includes all functional requirements of the product family. These are fulfilled by elements in the physical domain (PD), which contains the necessary components. Each component, in turn, requires specific processes defined in the (PrD). Finally, process execution consumes resources specified in the resource domain (RD). Product family design is defined by domain mapping matrices (DMM src,tgt ), where the subscripts indicate the mapping from a source domain (src) to a target domain (tgt). For example, DMM FD,PD (eq. 1) maps functional requirements to physical domain elements and represents the product architecture (Reference UlrichUlrich, 1995). Such early-stage design decisions (Reference Suh, Cavique and FoleySuh et al., 2021) are particularly critical, as they are characterized by greater design freedom and significant leverage over downstream costs (Reference Fixson, Simpson, Siddique and JiaoFixson, 2006). In the resulting physical domain P PD , the degree of component commonality across products can be quantified, for example, using the Product-Line Commonality Index (Reference Kota, Sethuraman and MillerKota et al., 2000).
 $${P_{PD}} = DM{M_{FD,PD}} \cdot {P_{FD}}$$
Each domain transition (i.e., multiplying the DMMs) contributes to the resource consumption pattern (P RD ) – representing the mapping between products and resources (Reference Mertens, Rennpferdt, Greve, Krause and MeyerMertens et al., 2023). Finally, by introducing a product demand vector (DMD) and a resource unit cost vector (RCU), product unit costs can be computed.
Schematic representation of the EAD framework using an example product family

Figure 1 Long description
The matrix is divided into several sections representing different views: Domain, Design, Product, and Cost. The Domain section includes Functional (FD), Physical (PD), Process (PrD), and Resource (RD) categories. The Design section shows matrices for DMM_FD,PD, DMM_PD,PrD, and DMM_PrD,RD, each with specific numerical values. The Product section includes matrices for P_FD, P_PD, P_PrD, and P_RD, along with a DMD matrix. The Cost section features a matrix for Resource Unit Costs (RCU). Each matrix contains numerical values that represent the relationships and interactions between different design domains and their impact on products and costs. The matrices are interconnected, indicating how changes in one domain can affect others.
3.2. Structural characteristics of DMMs
We use the EAD framework to provide a better empirical foundation for investigation. This approach supports the generalizability of cost-related insights beyond the limits of individual case studies. While case studies help identify design patterns and boundary conditions, they are context-specific and lack broad applicability. By systematically generating randomized product families within empirically grounded parameter borders, we can explore the cost effects of design characteristics under controlled and repeatable conditions, enabling more robust and transferable conclusions for design and cost-related decision-making.
The literature provides several measures to assess such characteristics, one of the most common being density (DNS) – defined as the percentage of non-zero entries in a given DMM. For example, the ABL framework in cost accounting uses DNS to operationalize the degree of resource sharing across different production environments (e.g., Reference Anand, Balakrishnan and LabroAnand et al., 2019).
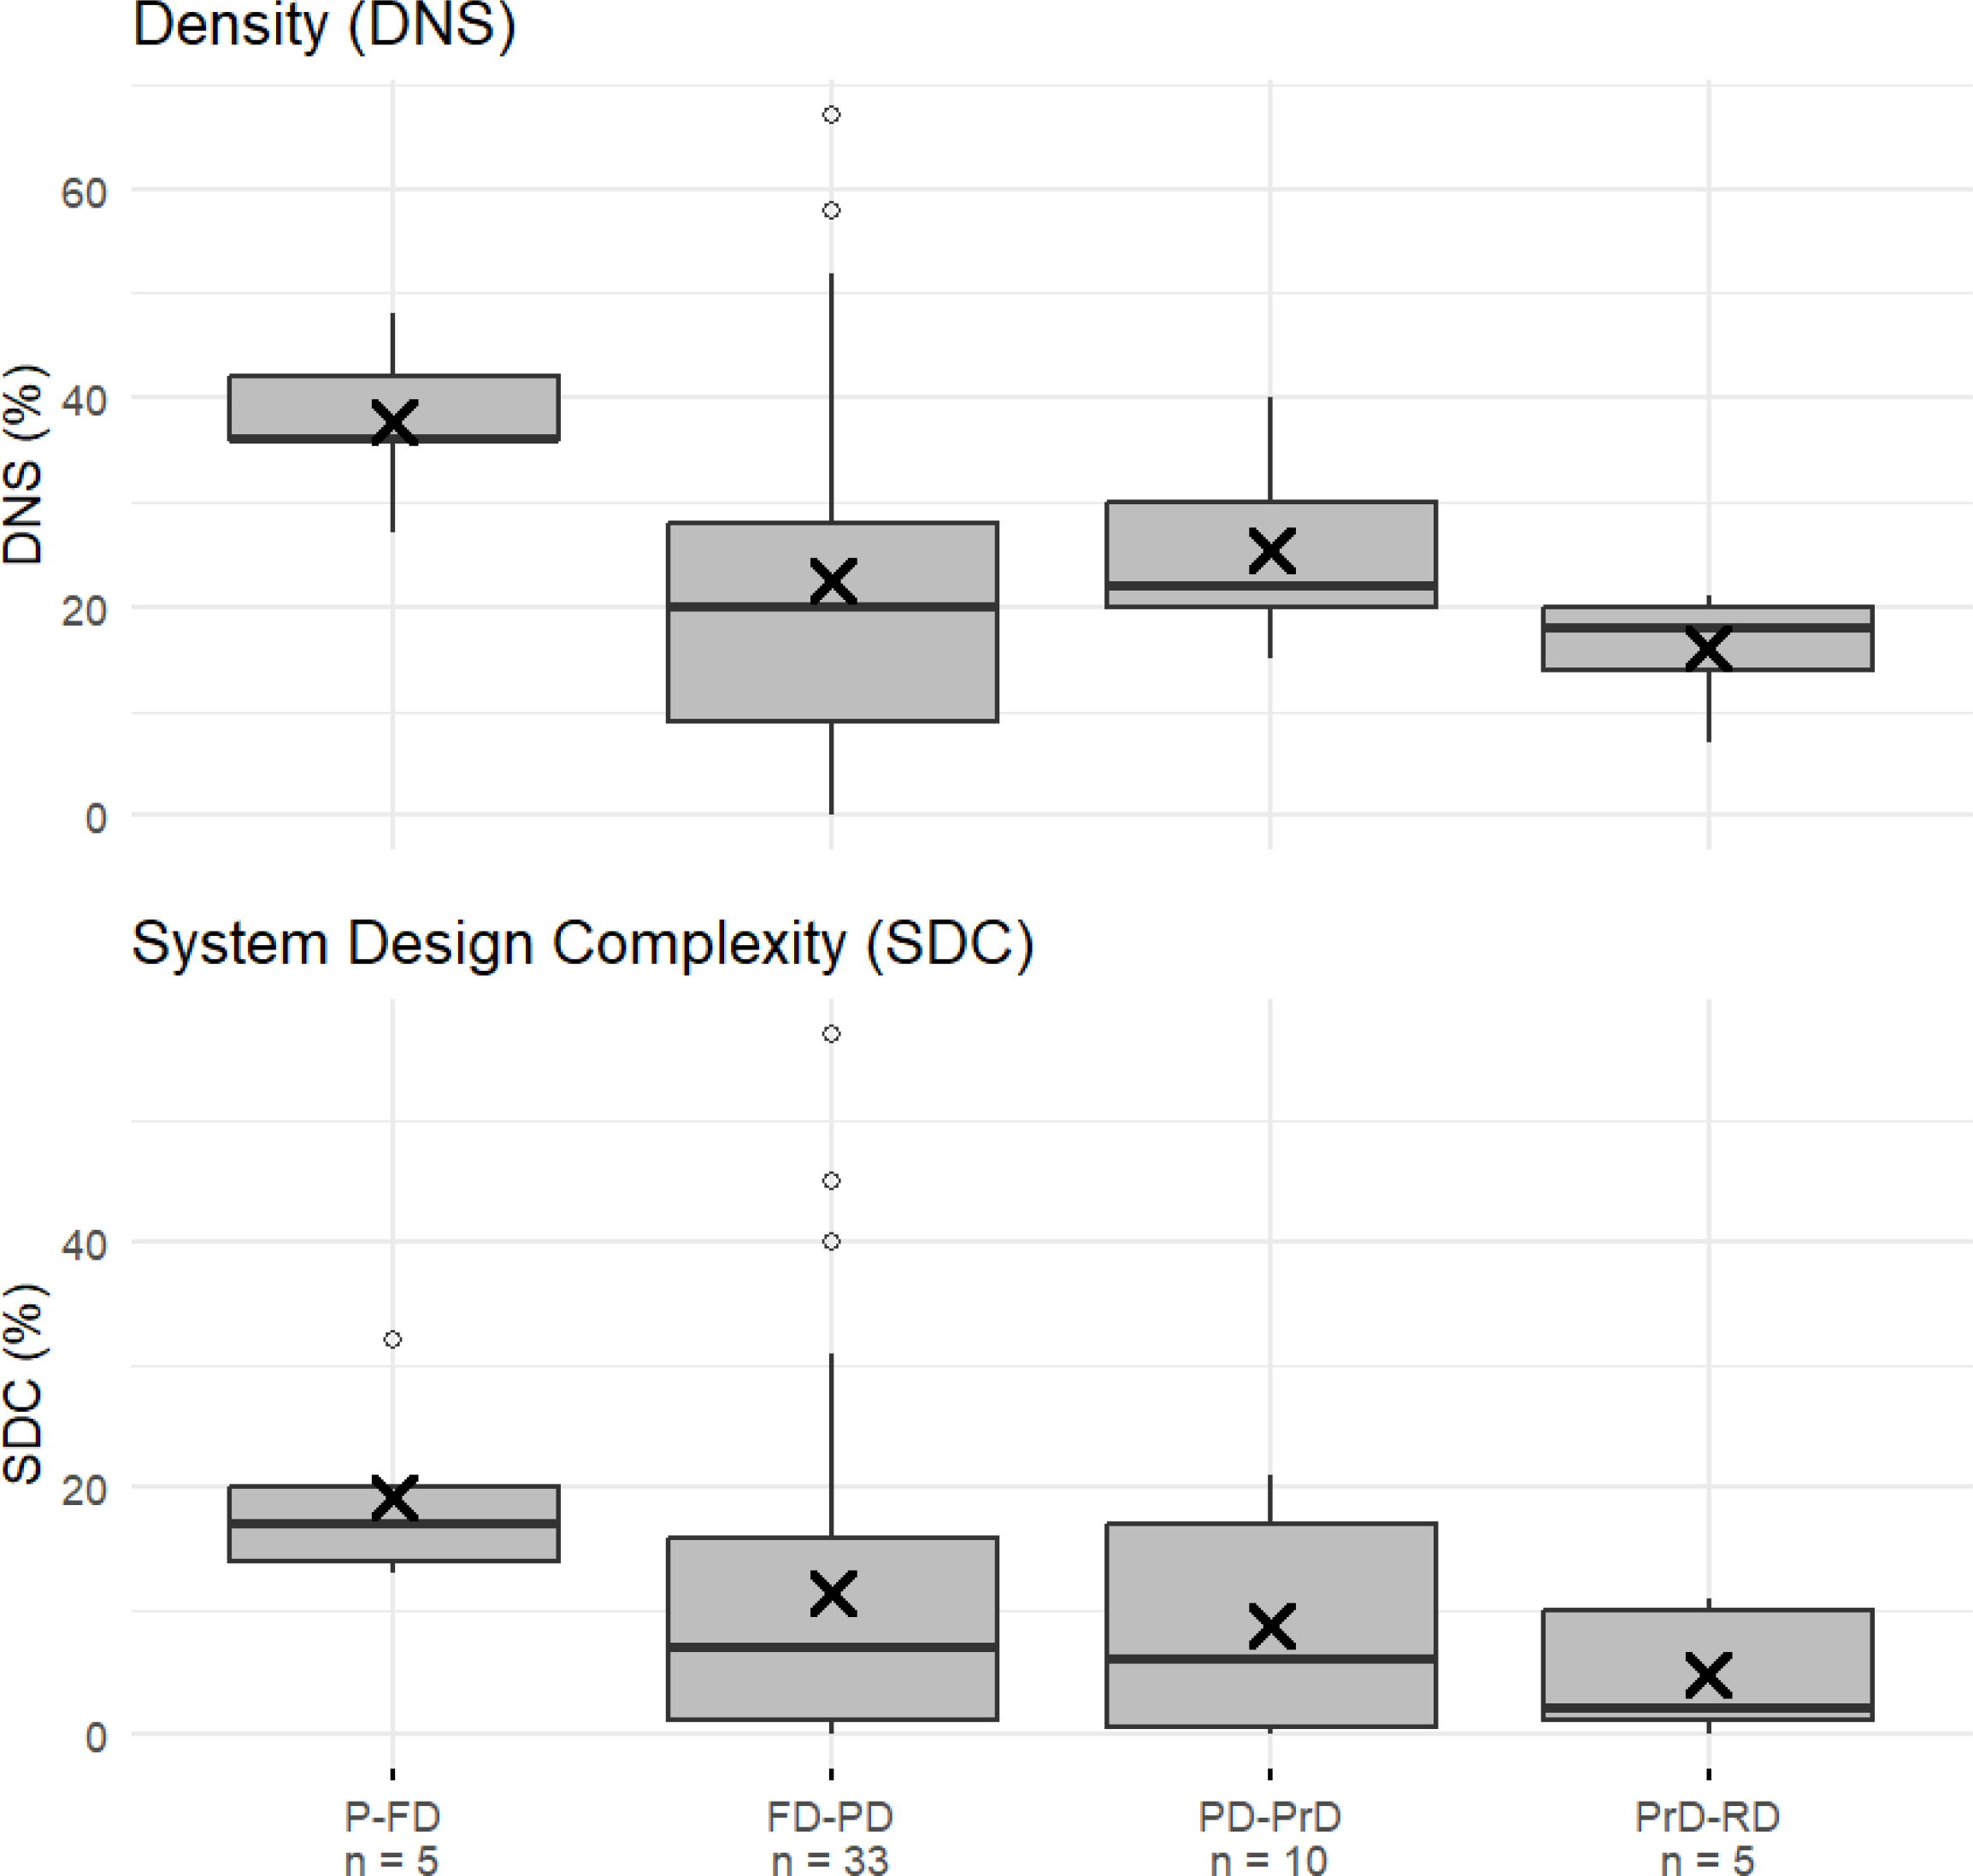
However, the product family design encodes critical aspects of design complexity that are not captured by simple density measures. To reflect this, we apply a more nuanced metric: System Design Complexity (SDC). Based on the information-theoretic concept of entropy, SDC has been widely used by various authors to quantify coupling complexity across domains in the context of product design (Reference Modrak and BednarModrak & Bednar, 2015). This measure quantifies the degree of inter-domain coupling. We use a normalized version of SDC, scaled by the maximum possible coupling. An uncoupled design (SDC = 0) is characterized by complete independence among domain elements. In contrast, a coupled design implies that the elements are interdependent, reflecting higher structural complexity. Figure 2 presents aggregated information from published case studies identified through a literature review conducted following the PRISMA guidelines (Reference Achter, Borit, Cottineau, Polhill, Radchuk and MeyerAchter et al., 2023; Reference Page, McKenzie, Bossuyt, Boutron, Hoffmann, Mulrow, Shamseer, Tetzlaff, Akl, Brennan, Chou, Glanville, Grimshaw, Hróbjartsson, Lalu, Li, Loder, Mayo-Wilson, McDonald, McGuinness, Stewart, Thomas, Tricco, Welch, Whiting and MoherPage et al., 2021). These studies report DMMs relevant to applications within the EAD across various industries.
Review results of 53 empirical DMMs from published case studies

3.3. Simulation protocol
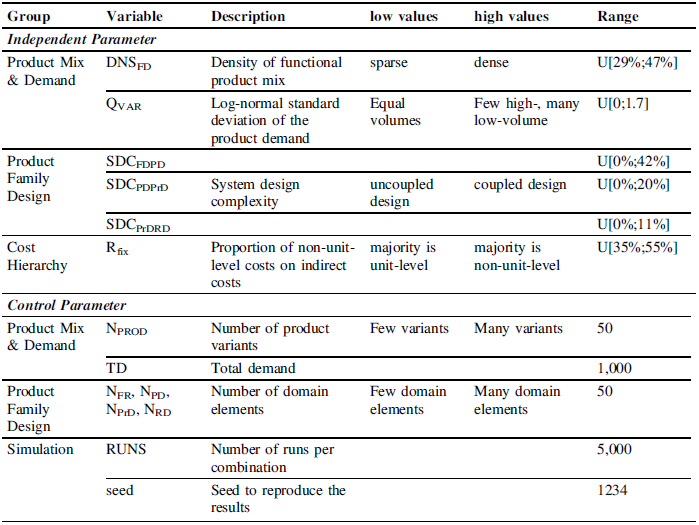
Building on the structural characteristics observed in the case studies, we generate binary-filled matrices by sampling from a uniform distribution bounded by the 5th and 95th percentiles of the data. The functional product mix P FD is modelled using the established approach of drawing a target density (Reference Anand, Balakrishnan and LabroAnand et al., 2019). The DMMs are instead generated based on SDC to reflect their distinct role in capturing design-related coupling. This framework yields resource consumption patterns P RD that reflect empirically grounded architectural characteristics. To further enhance structural realism, we implement a cost hierarchy (Reference Anderson and SedatoleAnderson & Sedatole, 2013; Reference Schmidt, Mertens and MeyerSchmidt et al., 2023), where unit-level consumption scales with production volume, while non-unit-level consumption remains uncorrelated (e.g., Reference Ittner, Larcker and RandallIttner et al., 1997). Product demand is sampled from a log-normal distribution, where the parameter Q_VAR defines the standard deviation on the logarithmic scale. This distribution reflects common demand patterns with few high-volume products alongside many low-volume variants (e.g., Reference Rezaie, Ostadi and TorabiRezaie et al., 2008). The complete design of experiments (Reference Lorscheid, Heine and MeyerLorscheid et al., 2012), including the main parameter configurations, is summarized in Table 1.
We proceed by comparing P RD generated via the EAD framework to a benchmark, adopting a representative design of experiments from the literature (Reference Schmidt, Mertens and MeyerSchmidt et al., 2023), which is primarily characterized by a predefined density drawn from a uniform distribution U[0.2,0.9]. Beyond density, we assess structural differences using Reference GuptaGupta’s (1993) inter- and intra-product heterogeneity. INTER quantifies a product’s position within the product mix. INTER = 0 indicates typical (average) products, while higher values indicate custom-made variants. INTRA captures the internal diversity of a products resource consumption (P RD rows). If INTRA = 0, a product consumes each resource by the same amount; increasing values indicate a skewed distribution. Since both INTER and INTRA are product-level measures, we report their mean value. INTER mean = INTRA mean = 0 represents complete homogeneity in resource consumption (i.e. each entry of P RD is equal), while higher values suggest more heterogeneous patterns.
Simulation protocol and design of experiments

Note. The extracted DMM data is available under https://doi.org/10.15480/882.16631
4. Simulation results
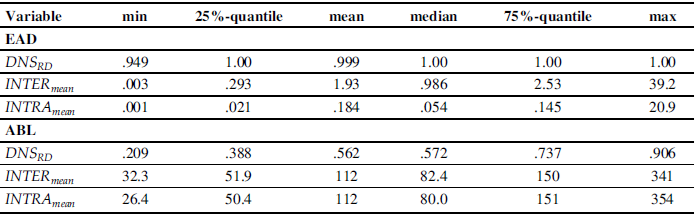
The results in Table 2 show that the two approaches generate distinct patterns. In the EAD framework, these patterns emerge endogenously from the underlying product family design, whereas in the ABL framework they are directly shaped by exogenous parameters defined by the modeler (e.g., Reference Balakrishnan, Hansen and LabroBalakrishnan et al., 2011). A key distinction is that EAD is characterized by a very high degree of resource sharing (DNS RD,mean,EAD = .999), while the ABL benchmark experiments assume a broader range (DNS RD,mean,ABL = .562). Arguably, density in the EAD framework would slightly decrease if more mapping conditions were introduced to further enhance structural realism – for example, considering a family of vehicle variants with either front-wheel drive or all-wheel drive. Nevertheless, the high density values generally reflect product families whose variants share similarities in all relevant product characteristics (Reference BuchholzBuchholz, 2012). In cost accounting, high density values are typically related to mass-customizing firms (Reference Anand, Balakrishnan and GavirneniAnand et al., 2023). We extend this insight by showing that high resource sharing arises naturally from underlying product family design, regardless of scale, and confirm its inherently homogeneous characteristics using more nuanced heterogeneity measures (Reference GuptaGupta, 1993).
Descriptive statistics of resource consumption patterns: EAD vs. ABL

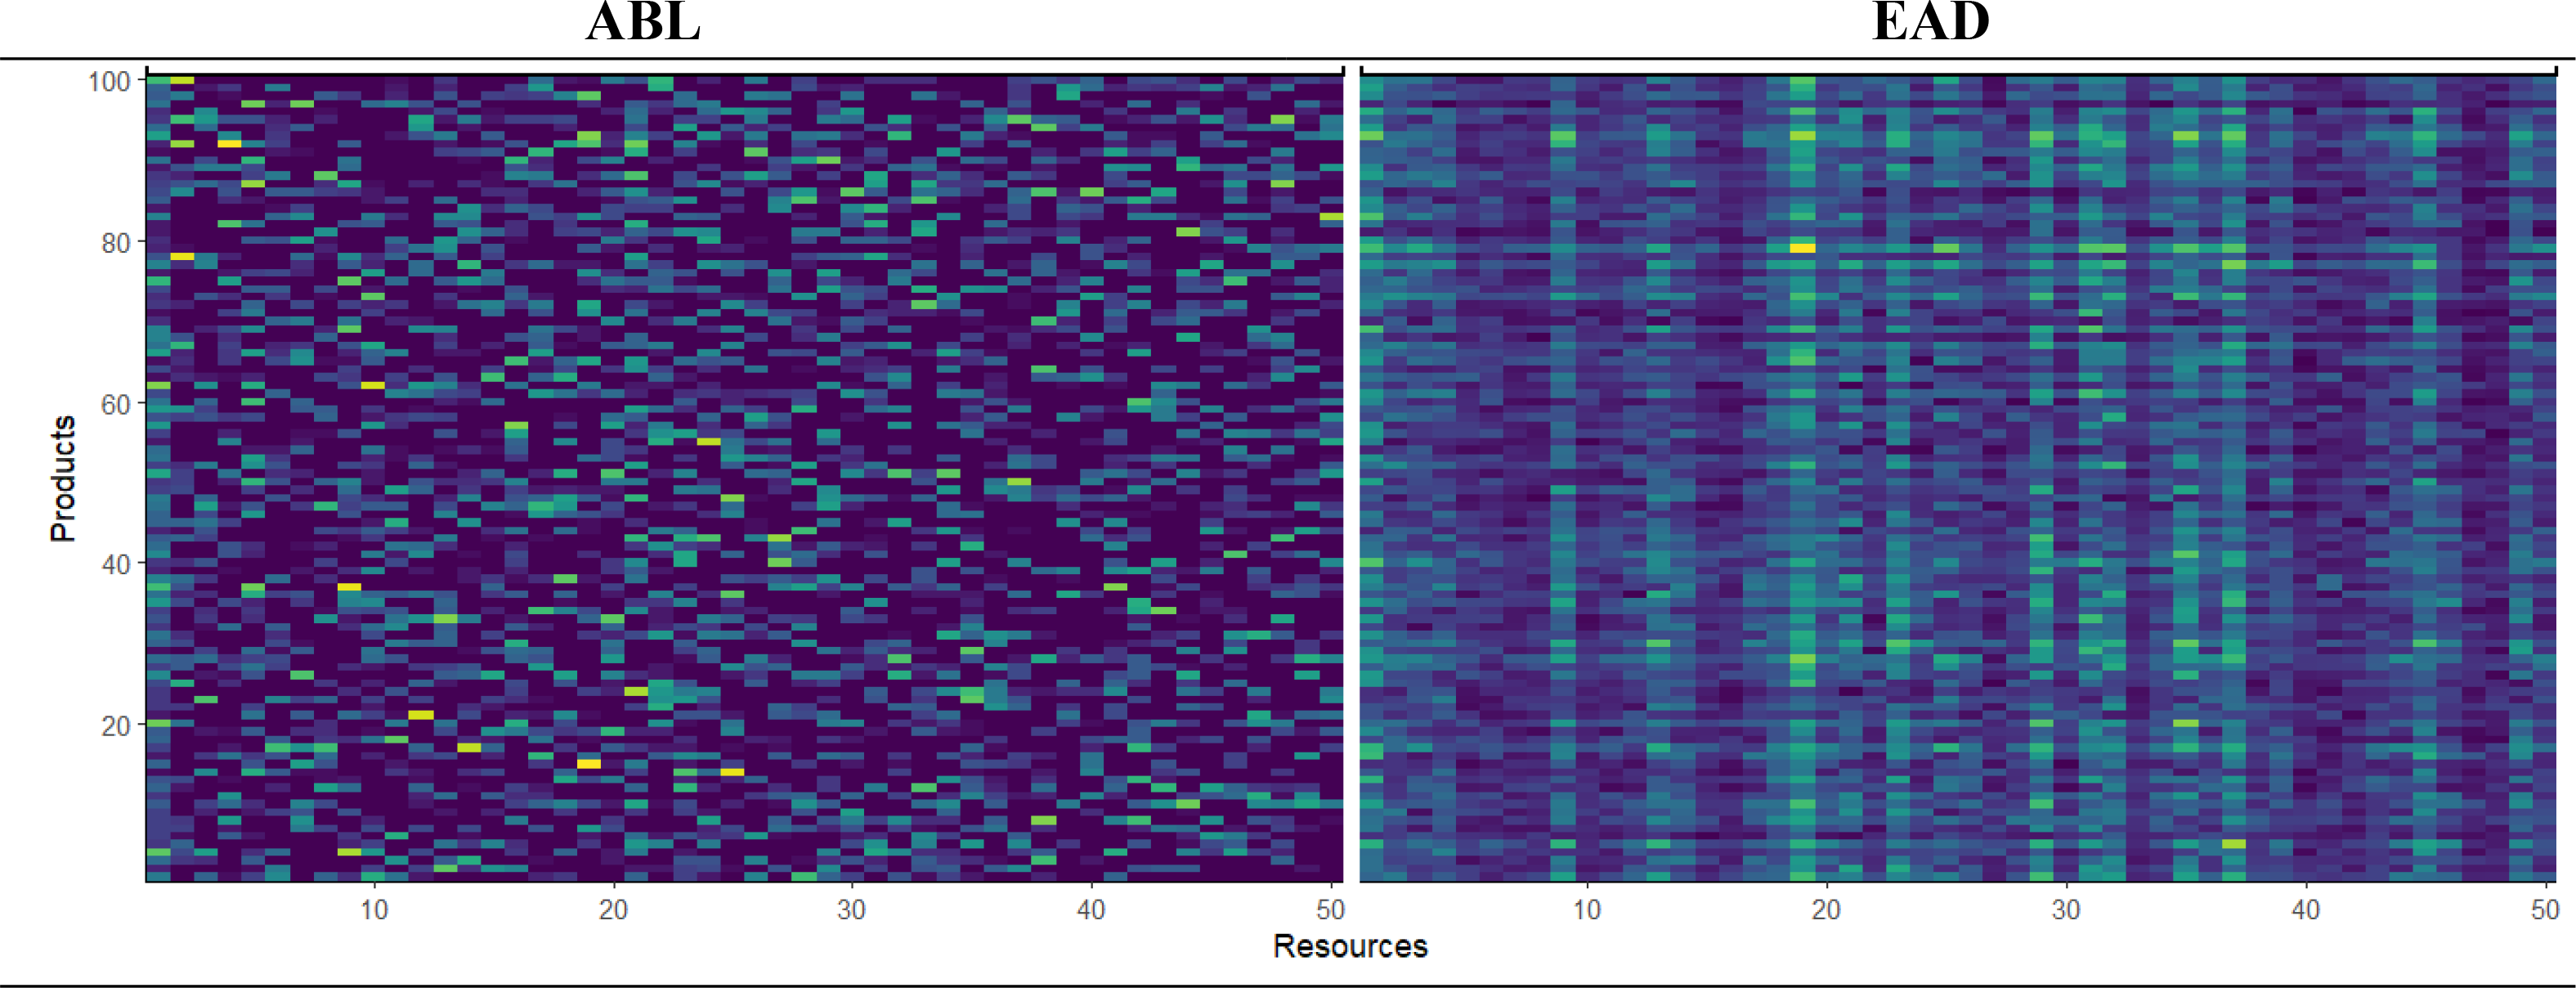
A second key difference lies in inter- and intra-product heterogeneity: EAD exhibits substantially lower values for both metrics (INTER mean = 1.93; INTRA mean = .184) compared to the ABL approach (INTER mean = 112; INTER mean = 112). This reflects a higher degree of homogeneity in resource consumption under EAD. Figure 3 visualizes randomly selected patterns generated in our experiments for each of the two frameworks. Light colours represent high resource consumption, while dark tones indicate low or no consumption. In other words, a lighter tone indicates that a substantial share of a product variant’s total resource consumption can be attributed to this resource. In the ABL model, high and low rates are randomly distributed, whereas EAD-based matrices exhibit a distinct column-wise pattern.
This finding offers new implications for cost transparency within product families, a central challenge in their development (Reference Krause, Vietor, Inkermann, Hanna, Richter, Wortmann, Bender and GerickeKrause et al., 2021; Reference Nørgaard, Grønvald, Christensen and MortensenNørgaard et al., 2025). Reusing platforms, modules, and processes across product variants likely reduces the traceability of resource consumption and necessitates more sophisticated costing systems. Since costing systems based on limited information typically lead to errors, it is often argued that this resource entanglement obscures the true cost effects. However, costing errors increase as heterogeneity in resource consumption within the product family grows (Reference Datar and GuptaDatar & Gupta, 1994; Reference GuptaGupta, 1993; Reference Labro and VanhouckeLabro & Vanhoucke, 2007). Our results show that product families can counter this by promoting homogeneity in resource consumption across variants. As Reference GuptaGupta (1993) notes, greater homogeneity reduces the number of cost pools needed for accurate costing, lowering the effort to implement and maintain costing systems. This valuable downstream effect, which arguably is more pronounced in mature modular systems than during initial strategy launches, may help mitigate concerns about cost intransparency (Reference Nørgaard, Grønvald, Christensen and MortensenNørgaard et al., 2025). In our case, a subset of key resources (visible as “vertical bright lines” in Figure 3) emerge as the dominant cost drivers, which should serve as the allocation bases for aggregated cost pools. New costing system design heuristics could identify these resources, to guide cost pool aggregation around them and allocation ratios. Taken together, we argue that product families can enhance cost transparency while maintaining manageable effort. Lower heterogeneity makes indirect cost effects more readily assessable through established costing systems, thereby facilitating the identification of cause–effect relationships between activities and costs and supporting more objective evaluation of design decisions.
Visualization of the differences in two exemplary resource consumption patterns

Figure 3 Long description
Panel A: A heat map titled ABL showing resource consumption patterns. The y-axis is labeled Products ranging from 0 to 100, and the x-axis is labeled Resources ranging from 0 to 50. The color scale ranges from dark purple to bright yellow, indicating varying levels of resource consumption. Darker colors represent lower consumption, while brighter colors indicate higher consumption. The distribution appears relatively sparse with scattered bright spots. Panel B: A heat map titled EAD showing resource consumption patterns. The y-axis is labeled Products ranging from 0 to 100, and the x-axis is labeled Resources ranging from 0 to 50. The color scale is similar to Panel A, ranging from dark purple to bright yellow. The distribution in this panel shows more concentrated clusters of higher consumption areas compared to Panel A.
5. Conclusion
This study advances the evaluation of product family design strategies by presenting the EAD framework, which systematically integrates design theory with cost accounting perspectives. The use of 53 documented DMMs enables robust empirical calibration, providing a new approach to analysing resource consumption and cost effects. In doing so, the study moves beyond the limitations of single-case studies and abstract conceptual models that have dominated prior research.
Our findings highlight that the resource consumption patterns derived from EAD are significantly denser and more homogeneous than those produced by established cost accounting models (e.g., Reference Balakrishnan, Hansen and LabroBalakrishnan et al., 2011; Reference Schmidt, Mertens and MeyerSchmidt et al., 2023). This reflects the inherent nature of product families, where modular and platform strategies naturally lead to increased commonality across the system architecture (Reference Mertens, Rennpferdt, Greve, Krause and MeyerMertens et al., 2023). Importantly, this challenges the prevailing notion that modularity necessarily increases cost intransparency (Reference Nørgaard, Grønvald, Christensen and MortensenNørgaard et al., 2025; Reference Ripperda and KrauseRipperda & Krause, 2017). Instead, the homogeneity across product variants should translate into fewer required cost pools and more accurate cost allocation. In practice, this implies that firms implementing such design strategies may benefit from greater cost transparency than previously assumed, provided that costing systems are designed to exploit recurring patterns in resource consumption.
The contributions of this study are threefold. (1) We provide the research community with a reusable dataset of DMMs, which can serve as a benchmark for future work on product design and cost modelling. (2) The EAD framework provides a standardized representation of product family design, bridging engineering design and cost accounting and enabling further investigation of the cost effects, such as those of modular design strategies. (3) We show that resource sharing, structural entanglement, and cost allocation interact in ways that may improve cost transparency. Our simulations further demonstrate that the dense and homogeneous patterns generated under EAD extend prior cost accounting insights to empirically grounded product family designs.
Future work could integrate Design Structure Matrices, enabling explicit modelling of modular structures, and benchmark the EAD against modelled costing systems such as activity- or volume-based ones.
Acknowledgement
We thank Shravan Puthige Mohan for his valuable contribution to this paper through his master’s thesis work.

 Open access

