


Introduction
The lithium sodium borosilicate mineral jadarite, LiNaSiB3O7(OH), has potential as an economic mineral resource for co-recovery of Li and B (3.38 wt.% Li and 14.63 wt.% B) (Stanley et al., Reference Stanley, Jones, Rumsey, Blake, Roberts, Stirling, Carpenter, Whitfield, Grice and Lepage2007). Jadarite has a comparable Li content to spodumene, LiAlSi2O6, which represents the main source of Li from processing of ‘hard-rock’ pegmatite deposits (Bowell et al., Reference Bowell, Lagos, De Los Hoyos and Declercq2020). Jadarite is unique to the Jadar deposit of Western Serbia, where it occurs as the principal ore mineral in a resource of 143.5 Mt (0.84 wt.% Li), ranking it in the top tier of global resources in terms of contained Li (Bowell et al., Reference Bowell, Lagos, De Los Hoyos and Declercq2020). Jadarite was first described as a new mineral species by Stanley et al. (Reference Stanley, Jones, Rumsey, Blake, Roberts, Stirling, Carpenter, Whitfield, Grice and Lepage2007), however, the origin of this novel Li ore mineral still remains unclear. Recent studies have proposed that jadarite formed in a high-pH lake system, where it co-precipitated with other borosilicates, such as searlesite, NaBSi2O5(OH)2, and with Na-zeolites (i.e. analcime and natrolite) (Putzolu et al., Reference Putzolu, Armstrong, Garcia, Hawkes, Nebel, Boyce, Najorka and Herrington2022).
Jadarite has a borosilicate framework and crystallises in the space group P21/c (Whitfield et al., Reference Whitfield, Le Page, Grice, Stanley, Jones, Rumsey, Blake, Roberts, Stirling and Carpenter2007). Our study has focussed on developing a novel synthesis route for jadarite using sol-gel synthesis and a variation of the dry-gel conversion technique (Fig. 1). As there were no reported structural analogues to jadarite at the time, we adapted the methods used for synthesis of borosilicate zeolite materials, which have similar frameworks to jadarite. While drafting this paper, a synthetic route was reported that uses a hydrothermal route to produce jadarite from a Li2O–Na2O–B2O3–SiO2–NaCl–H2O system. This paper reported trialling temperatures of 180 to 230°C, pH values of 6 to 12, and over a period of 3 to 8 days (Xie et al., Reference Xie, Kuang, Wiens, Deevsalar, Tunc, Purdy, Zuin, Tse, Mi and Pan2024).
Simplified sketch summarising the adopted synthesis procedure. Solid blue circles and labels represent the state (sol, gel, xerogel and crystalline solid) of the precursor/product at each stage. A dried gel is synthesised by the sol-gel technique and suspended in a PTFE beaker in a hydrothermal vessel lined with H2O. The vessel is placed in an oven (+150°C, 12+ hrs) and a crystalline product is then formed by steam crystallisation (dry-gel conversion).

Here, we discuss the methods and materials we used to synthesise and characterise synthetic jadarite. Results are compared with data collected on a natural jadarite sample and with those in the literature (Stanley et al., Reference Stanley, Jones, Rumsey, Blake, Roberts, Stirling, Carpenter, Whitfield, Grice and Lepage2007; Whitfield et al., Reference Whitfield, Le Page, Grice, Stanley, Jones, Rumsey, Blake, Roberts, Stirling and Carpenter2007; Xie et al., Reference Xie, Kuang, Wiens, Deevsalar, Tunc, Purdy, Zuin, Tse, Mi and Pan2024).
Synthetic techniques and justification for the synthetic protocol
During our research and initial submission of this paper, there were no reported synthetic methods for this material. As previously mentioned, Xie et al. (Reference Xie, Kuang, Wiens, Deevsalar, Tunc, Purdy, Zuin, Tse, Mi and Pan2024), reported crystallisation of jadarite from a Li2O–Na2O–B2O3–SiO2–NaCl–H2O system using hydrothermal methods, T = 180 to 230°C and pH = 6 to 8, over 3 to 8 days. Their highest purity and most crystalline sample, which was used for all subsequent analyses, was produced using T = 230°C and pH = 8 over 3 days.
We adapted methods used to synthesise borosilicate zeolite materials, which have similar frameworks to jadarite. The sol-gel technique, the dry-gel conversion (DGC) technique (Fig. 1), and use of a structure-directing agent (SDA), such as tetraethylammonium hydroxide (TEAOH) (Rubin et al., Reference Rubin, Plank and Rosinski1977) were featured consistently in the literature as viable protocols for the synthesis of borosilicate zeolite materials (Xu et al., Reference Xu, Dong, Li, Li and Wu1990; Rao and Matsukata, Reference Rao and Matsukata1996; Bandyopadhyay et al., Reference Bandyopadhyay, Kubota, Sugimoto, Fukushima and Sugi1999).
Sol-gel technique
Due to the success of sol-gel syntheses of lithium aluminosilicate minerals using LiNO3 as a Li source (Kanti Naskar and Chatterjee, Reference Kanti Naskar and Chatterjee2005; Chatterjee and Naskar, Reference Chatterjee and Naskar2006; Xia et al., Reference Xia, Wen, Song and Wang2009), the dry-gel precursor to synthetic jadarite was synthesised by the sol-gel method using LiNO3 as a reagent. In sol-gel synthesis, reagents are added, one by one, to an aqueous, low pH (~3) solution under stirring. The solution is heated until a gel formed, which is then normally calcined at high temperature (e.g. 400–1000°C) to form the solid product.
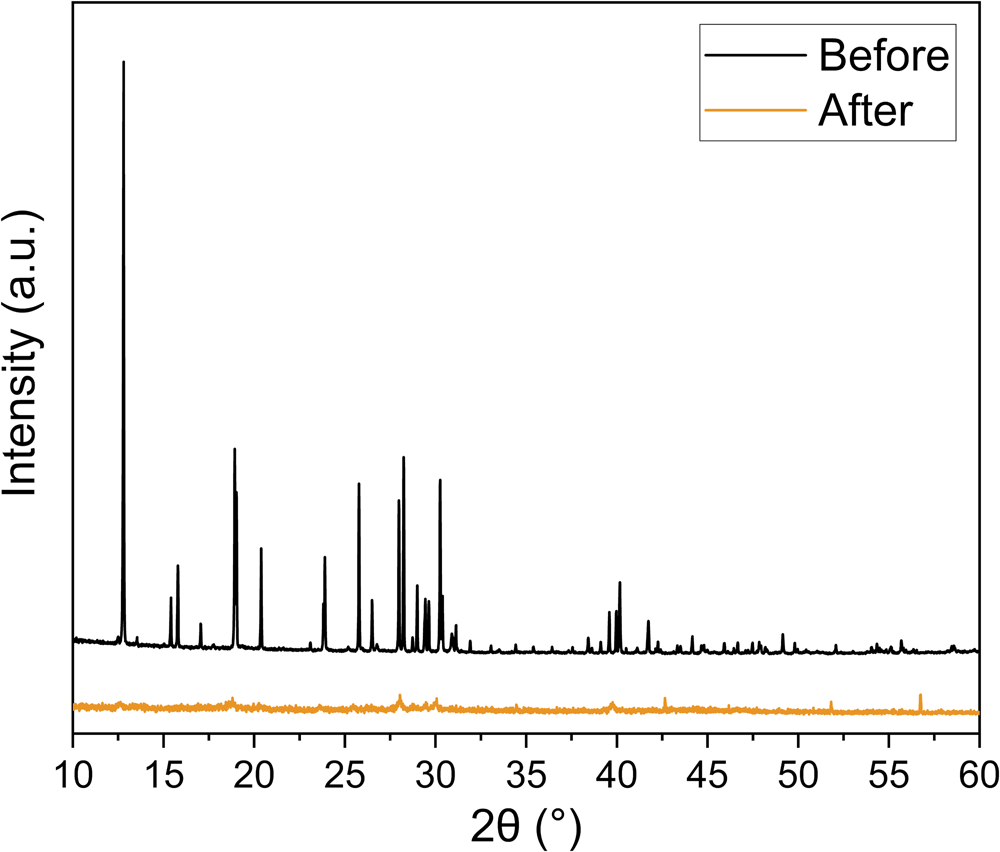
Our investigations into the temperature stability of jadarite found heating jadarite to 600°C caused an irreversible phase change from monoclinic crystalline jadarite to an amorphous glassy phase. This loss of crystallinity is shown by analysis of PXRD data collected on natural jadarite before and after being heated to 600°C for 4 hours (Fig. 2). All peaks in the crystalline sample disappear or are greatly reduced in intensity in the ‘after’ PXRD pattern. The temperatures required by gel calcination (400°C–1000°C) may result in an irreversible phase change of the precursor to an amorphous glassy phase and not result in the subsequent formation of jadarite, hence the dry-gel was not calcined. Sodium hydroxide solution was also included in the sol-gel synthesis to reflect the alkaline environment inferred for the formation of jadarite in the natural environment (Putzolu et al., Reference Putzolu, Armstrong, Garcia, Hawkes, Nebel, Boyce, Najorka and Herrington2022).
PXRD results of natural jadarite before (black) and after (orange) being heated to 600°C.
Dry-gel conversion technique
The DGC technique involves placement of a dry-gel in a hydrothermal vessel such as a stainless-steel autoclave such that it is not in direct contact with H2O. This differs from the hydrothermal method reported by Xie et al., which involved synthesis of a slurry containing lithium chloride, sodium borate, and fumed silica which was transferred directly into the PTFE liner of their stainless-steel autoclave. In both methods, when heat is applied to the vessel, the product crystallises – from the slurry in the hydrothermal synthesis, and from the dry-gel under steam in our method.
A specific procedure (Bandyopadhyay et al., Reference Bandyopadhyay, Kubota, Sugimoto, Fukushima and Sugi1999) detailing the synthesis of borosilicate zeolites was adapted for the synthetic route reported in this work. Replicating Bandyopadhyay et al., we included sodium tetraborate decahydrate (Na2B4O7.10H2O) and TEAOH; we suspended the dry-gel precursor in a PTFE beaker within a stainless-steel autoclave; and we heated the vessel to 175°C. it should be noted, our synthesis temperature, 175°C, is significantly lower than 230°C, used by Xie et al. to synthesise jadarite. We did not use temperatures higher than 175°C due to the constraints of our stainless-steel autoclaves, which could not be heated safely beyond 180°C. Our synthetic technique is detailed in Fig. 1, including the aforementioned steps adapted from Bandyopadhyay et al.
A method such as DGC, involving the reaction of solid material under hydrous, ‘low’ temperature conditions, was preferable to promote crystallisation of jadarite. The temperature used in our synthesis method (i.e. 175°C) exceeded those expected during diagenesis in an alkaline lake environment, yet it has to be considered that higher temperatures balance kinetic requirements and time restriction of a lab-based synthesis vs. a geological process. However, the successful synthesis of jadarite from a gel precursor better emulates the proposed geological environment for formation of natural jadarite (Putzolu et al., Reference Putzolu, Armstrong, Garcia, Hawkes, Nebel, Boyce, Najorka and Herrington2022).
Use of structure-directing agent
In dry-gel conversion synthesis of borosilicate zeolites, non-volatile structure-directing agents such as TEAOH are used to stabilise and aid formation of the borosilicate cages and rings that compose the zeolite frameworks. We employ TEAOH in our method for this reason. However, complete removal of TEAOH from zeolites requires heating to temperatures of 500–600°C (Rao and Matsukata, Reference Rao and Matsukata1996), which would result in an irreversible phase change of monoclinic jadarite to the previously mentioned glassy phase (Fig. 2). This is why complete removal of TEAOH by heating the sample was not attempted in this study. The advantage of Xie et al.'s method is TEAOH is not used to synthesise pure jadarite.
Experimental methods
Materials
Colloidal silica (SiO2, 30 wt.% in H2O), tetraethylammonium hydroxide solution (TEAOH, 35 wt.% in H2O) and sodium hydroxide pellets (NaOH, 98%≤) were purchased from Sigma-Aldrich. Anhydrous lithium nitrate (LiNO3, 99+%) and borax (Na2B4O7.10H2O, 99+%) were purchased from ThermoFisher Scientific. All chemicals were used as received with no further purification.
Natural jadarite was sourced from the Jadar Basin, Serbia and provided by the Natural History Museum, London, from sample batch OE-MIN-2015-2-ORE. The rock sample was crushed and ground to a fine powder, then stirred in boiling H2O for a minimum of 30 mins to separate the soluble primary impurity phase (probertite [NaCaB5O7(OH)4.3(H2O)] and insoluble jadarite (Stanley et al., Reference Stanley, Jones, Rumsey, Blake, Roberts, Stirling, Carpenter, Whitfield, Grice and Lepage2007). Jadarite was collected by vacuum filtration and washed with distilled water, then dried on a watch glass at 80°C.
Synthetic method
Sol-gel synthesis of dry gel precursor
All reagents were purchased from Sigma-Aldrich and ThermoFisher Scientific. Purity of solid reagents were confirmed using PXRD. The molar ratio of the gels were SiO2:0.50TEAOH:1.04LiNO3:0.57NaOH:0.75Na2B4O7.10H2O. Colloidal silica and TEAOH solutions were covered with a watch glass and stirred for 10 min. Solid lithium nitrate then sodium hydroxide solution (2M) were added to the mixture and stirred, covered, each for a minimum of 30 mins. Finally, borax was added under stirring and the solution was left to stir, covered, for at least 3 hrs. The solution was uncovered and heated to 80°C under stirring for a minimum of 1 hr until a gel had formed, which was homogenised by hand using a glass rod until it became more viscous. The gel was heated to 80°C for 2 hrs, ground to a powder with an agate pestle and mortar, and then heated again at 80°C for 1 hr to obtain a powdered dry gel.
Steam crystallisation of precursor
The dry gel powders were placed in PTFE beakers (7 mL) which were then placed in small volumes of deionised water (<5 mL) at the bottom of PTFE liners (30+ mL), such that the precursor and H2O were not in direct contact (Fig. 1). The PTFE liners were secured in steel autoclaves. Steam crystallisation occurred in an oven at 175°C for 1.5 days. The autoclaves were quenched with cold H2O and left to cool to room temperature. The solid products were isolated by vacuum filtration and washed thoroughly with distilled H2O.
Characterisation methods
Powder X-ray diffraction (PXRD) data were collected using a Rigaku SmartLab X-Ray Powder Diffractometer in reflection mode with a Johnansson monochromator (CuKα1 = 1.54060 Å) and a HyPix 3000 detector. Data were collected over the 2θ range 5–120°, with a step size of 0.01° for 120 mins. Sample preparation consisted of grinding to a fine powder, mixing with acetone to form a suspension, then deposition of a thin layer of the suspension on to a zero-background silicon substrate. The PXRD data were analysed using the software suite TOPAS-Academic (Coelho, Reference Coelho2018) to refine the unit cell parameters using the Pawley refinement method.
Fourier-transform infrared spectroscopy (FTIR) spectra were collected using a Perkin Elmer Spectrum Two FTIR Spectrometer. Samples were ground to fine powders prior to data collection. The spectra were collected over the range 4000 to 400 cm–1.
Scanning electron microscope (SEM) images were obtained using a Carl Zeiss SIGMA HD VP Field Emission Gun SEM with an accelerating voltage of 15 kV. A secondary electron (SE) detector was used for secondary electron imaging. Powdered samples were deposited on sample stubs using double-sided carbon tape and purged with a flow of nitrogen gas, then gold coated.
Inductively-coupled plasma-optical emission spectroscopy (ICP–OES) was carried out using a Perkin Elmer 8300 DV ICP–OES to determine relative quantities of Li, Na, Si and B in the samples. Samples were dissolved in citric acid (0.1 M) and left on a roller mixer for 3 days. The solutions obtained were diluted by a factor of 100 prior to measurement. Standard solutions of deionised water and 0.01, 0.1, 0, 1, 10 and 100 ppm of each of the elements of interest (Li, Na, Si and B) were made up and measured first, followed by the diluted sample solutions. O and H could not be quantified by the techniques available to us.
Thermogravimetric analysis (TGA) was carried out using a NETZSCH 449 F1 Jupiter Simultaneous Thermal Analyzer (STA). Samples were ground to fine powders and placed in alumina crucibles. Measurements were taken in air over the temperature range 25 to 1000°C with a ramp rate of 20°C/min.
Results
Powder X-ray diffraction
Powder X-ray diffraction data collected on the synthetic and natural jadarite powders are presented in Fig. 3. The data for both natural and synthetic jadarite were indexed with a Pawley fitting routine using a monoclinic unit cell in space group P21/c. The refined unit cell parameters for the synthetic sample were a = 6.824(3) Å, b = 13.882(5) Å, c = 7.735(3) Å and β = 124.37(1)° (Rwp = 9.22), which matched well with the published unit cell parameters; a = 6.7620 Å, b =13.8016 Å, c = 7.6878 Å and β = 124.09° (Whitfield et al., Reference Whitfield, Le Page, Grice, Stanley, Jones, Rumsey, Blake, Roberts, Stirling and Carpenter2007). Results from indexing the synthetic cell are shown and compared to the Whitfield cell (Table 1).
PXRD results of synthetic and natural samples are compared to the theoretical pattern produced by literature results (Whitfield et al., Reference Whitfield, Le Page, Grice, Stanley, Jones, Rumsey, Blake, Roberts, Stirling and Carpenter2007): (a) synthetic jadarite; (b) natural jadarite.

The refined unit cell parameters were a = 6.76537(4) Å, b = 13.80897(8) Å, c = 7.69197(5) Å and β = 124.0852(5)° for the natural jadarite sample (R wp = 9.76). Trace amounts of muscovite, KAl2(AlSi3O10)(OH)2, were identified to be present in the natural jadarite sample, therefore a secondary phase was included during the Pawley refinement using a published unit cell (ICSD-192679, Inorganic Crystal Structure Database, https://icsd.products.fiz-karlsruhe.de/) (Ishida and Hawthorne, Reference Ishida and Hawthorne2013).
Analysis of PXRD data suggests synthetic jadarite is less crystalline than natural jadarite due to broader diffraction peaks and thus greater estimated standard deviations of cell parameters. Discrepancies in peak intensity between the natural jadarite and synthetic PXRD data are observed, particularly noticeable for the peak at 12.7° corresponding to the 020 reflection, which is less intense in the PXRD pattern collected on the synthetic sample (Fig. 4). Xie et al. reported no peaks discrepancies, however most PXRD data presented in their paper (e.g. figures 3 and S1, with the exception of figure 2) has been presented on a log10 scale, which they justify with the statement to ‘make weak reflections more clear’. Therefore, it is difficult to conclude if these intensity discrepancies are observed in their data, particularly for the samples they synthesised at lower temperatures (150°C and 180°C) which would be comparable to our samples.
PXRD data calculated from the CIF (ICSD-249311) generated by Whitfield et al. (Reference Whitfield, Le Page, Grice, Stanley, Jones, Rumsey, Blake, Roberts, Stirling and Carpenter2007) (a) where the occupancy of the Si site has been fixed as 1 (black), 0.75 (yellow) and 0.25 (blue) to demonstrate the effect of Si deficiency on the intensity profiles of the PXRD pattern. (b) Experimental PXRD data of the synthetic product and pattern calculated from the Whitfield cif. The reflections corresponding to certain peaks affected by Si deficiency (020, $\bar{1}$ 01, $\bar{1}$
 21, 101, and 131) are indicated and labelled.

We propose differences in peak intensities between our observed data for the synthetic sample and the theoretical pattern may be due to Si deficiency in the synthetic product, as well as broader peak widths. PXRD patterns with different Si site occupancies were calculated using the crystallographic information file (CIF, ICSD-249311) by Whitfield et al. (Reference Whitfield, Le Page, Grice, Stanley, Jones, Rumsey, Blake, Roberts, Stirling and Carpenter2007) and fixing the Si occupancy to 1, 0.75 and 0.25 (Fig. 3). This demonstrates the effect of Si site occupancy on the relative peak intensities of the PXRD data. Other peaks affected by the variable Si site occupancy include those corresponding to the $\bar{1}$ 01, $\bar{1}$
 21, 101 and 131 reflections. A Si deficiency is also supported by ICP–OES data (see below).
To resolve why Si deficiency affects these reflections, more detailed structural analysis of high-resolution power or single-crystal X-ray or neutron diffraction data must be undertaken.
For example, upgrades at the European Synchrotron Radiation Facility (ESRF)- Extremely Bright Source (EBS) recently allowed high-pressure X-ray single-crystal diffraction studies of jadarite crystals to be carried out (Comboni et al., Reference Comboni, Battiston, Rumsey, Pagliaro, Lotti, Hanfland and Gatta2022; Poręba et al., Reference Poręba, Comboni, Mezouar, Garbarino and Hanfland2023). Using single-crystal diffraction, Comboni et al. (Reference Comboni, Battiston, Rumsey, Pagliaro, Lotti, Hanfland and Gatta2022) confirmed the structural model of jadarite, which was based on powder diffraction data reported by Whitfield et al. (Reference Whitfield, Le Page, Grice, Stanley, Jones, Rumsey, Blake, Roberts, Stirling and Carpenter2007). Similar data collected on our synthetic samples using such an instrument could further support our hypothesis.
Further to single-crystal diffraction studies, combining neutron powder diffraction (NPD) data with PXRD data is another approach to carrying out structural refinements. NPD is complementary to XRD, due to the different ways the X-ray and neutron beams interact with the sample. Carrying out combined structural refinements of PXRD and NPD data would allow a more robust refinement to be carried out and, in particular, refinement of the atomic positions occupied by the light elements such as H and Li.
The PXRD analysis of synthetic jadarite showed a high background in the 2θ range 20–35°. This is probably due to a secondary phase, which could be attributed to an amorphous species. Due to its amorphous nature, it is unclear whether this phase is due to unreacted reagents including colloidal silica or formation of secondary products during jadarite crystallisation. Full characterisation and identification of this secondary phase is beyond the scope of this work.
Infrared spectroscopy
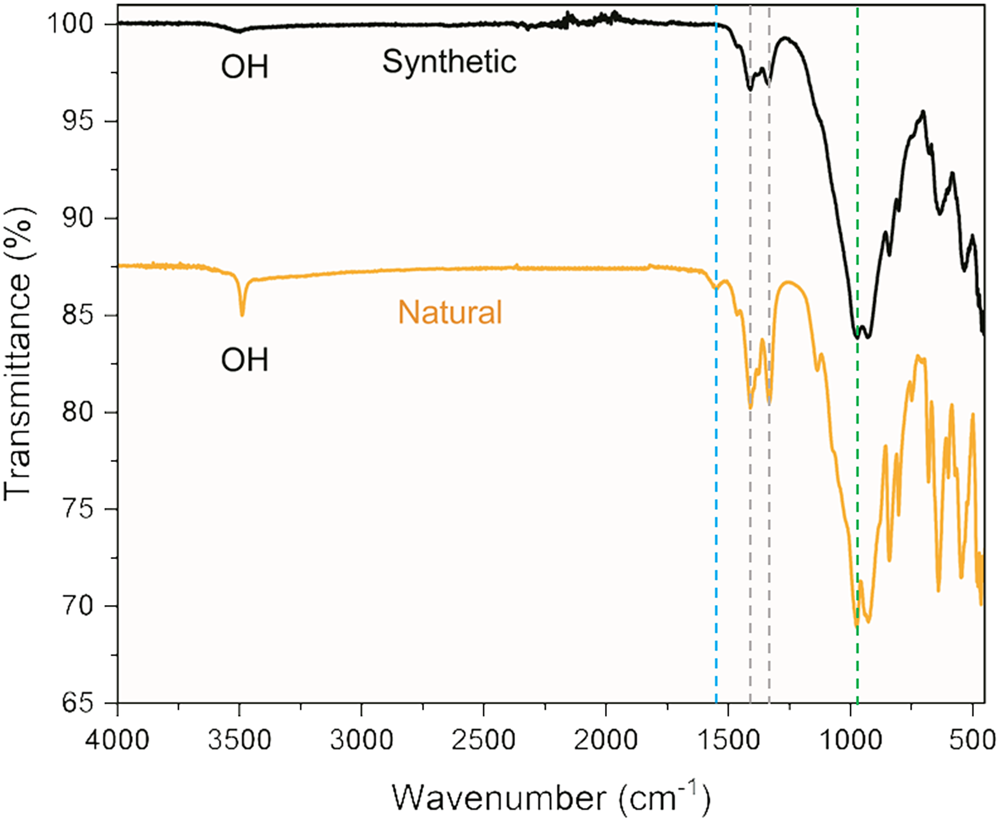
Fourier-transform infrared spectra are presented from (4000 to 400 cm–1 in Fig. 5. A sharp OH peak at 3489 cm–1 is observed for the natural sample, corresponding to an OH stretch in jadarite. For the synthetic sample a broad OH stretch at 3491 cm–1 is assigned to the presence of TEAOH (Bourgeat-Lami et al., Reference Bourgeat-Lami, Di Renzo, Fajula, Mutin and Des Courieres1992). The jadarite OH stretch therefore overlaps with the TEAOH OH stretch and is obscured in the spectra collected on the synthetic sample. Absorbance at 1545 cm–1 for the natural sample (Fig. 5) was assigned to OH bending in H2O molecules residing within structural cavities (Jun et al., Reference Jun, Shuping and Shiyang1995; Xiang and Zhong, Reference Xiang, Zhong, Klein, Aparicio and Jitianu2018). Bands at 1415 cm–1 and 1342 cm–1 indicated the presence of trigonal borate groups. The strongest absorbance around 1000 cm–1 was assigned to asymmetric stretching vibrations of Si–O–Si/Si–O–B chains (Yusufali et al., Reference Yusufali, Kshirsagar, Jagannath Mishra, Dutta and Dey2013). Our assignments are in line with assignments made by Xie et al. based on experimental data and theoretical calculations performed on their natural and synthetic jadarite samples.
FTIR spectra of synthetic and natural jadarite samples from 4000 to 400 cm–1. Dashed lines indicate peaks attributed to O–H bending (blue), trigonal borate B–O (grey), and vibrations of Si–O–Si/Si–O–B chains (green). Peaks below 900 cm–1 were attributed to stretches associated with both tetrahedral and trigonal borate groups. The presence of such peaks in the ‘fingerprint’ region of the IR spectra can be matched to those identified in natural jadarite (Stanley et al., Reference Stanley, Jones, Rumsey, Blake, Roberts, Stirling, Carpenter, Whitfield, Grice and Lepage2007).
Scanning electron microscopy
The texture of synthetic jadarite was studied using secondary-electron imaging and compared to SEM images collected on a natural jadarite sample. Stanley et al. (Reference Stanley, Jones, Rumsey, Blake, Roberts, Stirling, Carpenter, Whitfield, Grice and Lepage2007) reported the natural jadarite mineral exhibited discrete, tabular crystallites less than 5 μm in size. The SEM images of natural jadarite (Fig. 6a,b) revealed particles that are randomly clustered together to form large grains with a pitted texture. These aggregates (Fig. 6a) are ~40 μm long and 30 μm wide. The particles have variable size (Fig. 6b) ranging from <1 to 10+ μm across.
SEM images of natural (a,b) and synthetic (c,d) jadarite samples: (a) crystallites agglomerated to form large grains in natural jadarite; (b) natural crystallite size ranging from over 10 μm (orange) to less than 1 μm (blue); (c) agglomerates of crystallites were also observed in SEM images of synthetic jadarite; (d) amorphous structures displaying conchoidal fracturing were observed (green) alongside the grains (orange), with crystallites in the synthetic sample measuring less than 3 μm (blue).
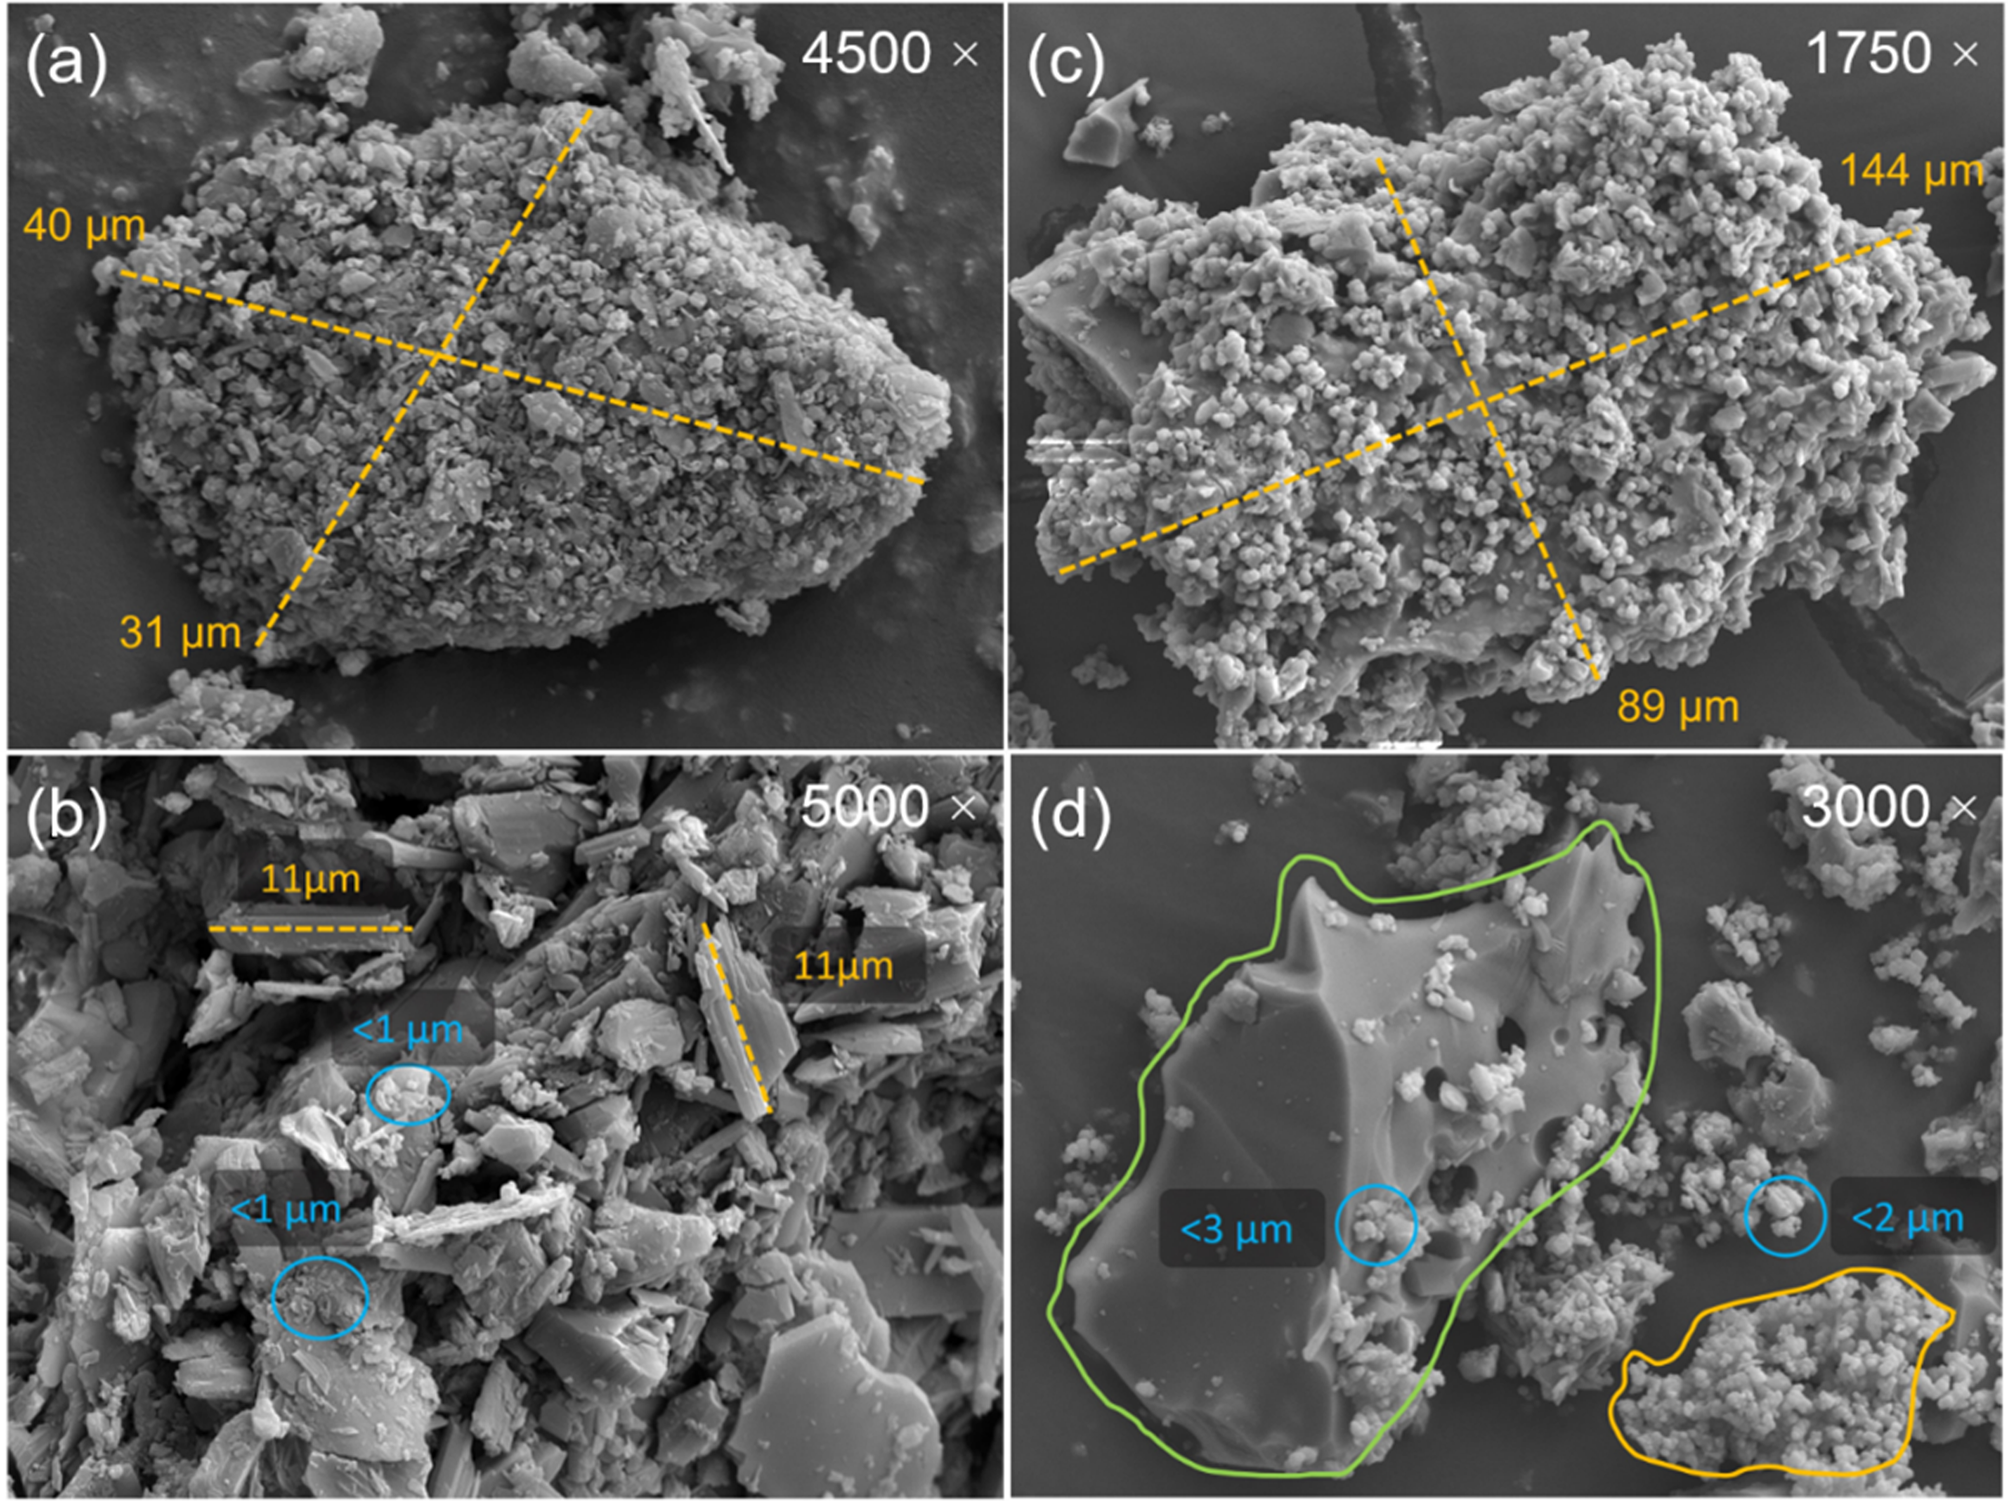
Our synthetic product consists of irregular clusters of tabular particles (Fig. 6c), similar to those observed for natural jadarite. Synthetic grains are larger (~150 μm by 90 μm) than those observed in the natural counterpart. Synthetic particles locally appear as spherical and less crystalline aggregates than natural jadarite (Fig. 6d) and are consistently <3 μm wide. Amorphous phases occur as large, glass-like particles exhibiting conchoidal fracturing (Fig. 6d). Energy dispersive spectroscopy (EDS) measurements showed these structures contained predominantly O and Si, with little Na and no B detected. This suggests that the amorphous phase is glassy/siliceous and potentially hydrous. This phase could cause the high background observed in PXRD data.
Composition
To determine relative quantities of Li, Na, Si and B in the samples, inductively-coupled plasma-optical emission spectroscopy (ICP–OES) was carried out. Analysis of the natural jadarite, based on three B atoms per formula unit (apfu), gave the following stoichiometric formula Li1.03Na1.01Si1.02B3O7.04(OH) (Table 1), which is in good agreement with the published formula of Li1.08Na1.07Si0.97B3O6.99(OH)1.06 (Stanley et al., Reference Stanley, Jones, Rumsey, Blake, Roberts, Stirling, Carpenter, Whitfield, Grice and Lepage2007). Chemical analysis of synthetic jadarite using ICP–OES (Table 2) gave a stoichiometric formula of Li1.07Na1.40Si0.79B3O7.32(OH) based on three B apfu. The obtained Li concentrations are in line with previously published data, however there is a notable Si deficiency, which is supported by PXRD results. SEM–EDS results showed that synthetic jadarite occurs alongside glassy high Si phases, which could have potentially fractionated part of the silica available during the experiment and are probably insoluble in citric acid. Higher Na levels could be explained by use of both NaOH and sodium tetraborate decahydrate in the synthetic procedure, which means Na is well in excess.

Comparison of ICP–OES data for natural and synthetic jadarite with literature (Stanley et al., Reference Stanley, Jones, Rumsey, Blake, Roberts, Stirling, Carpenter, Whitfield, Grice and Lepage2007) shows good agreement, with higher Na and lower Si levels noted for the synthetic analogue.

* = calculated; apfu = atoms per formula unit.
Thermogravimetric analysis
Comparison of TGA data collected on both the natural and synthetic jadarite samples are shown in Fig. 7. For both samples, a mass loss was observed between 25 and 620°C, which stabilises and plateaus after 620°C. This is probably due to loss of crystalline H2O from jadarite. Initial mass loss of the synthetic sample up to 120°C can be attributed to surface H2O.
TGA results of both natural and synthetic jadarite samples show mass loss due to H2O and dehydroxylation up to 620°C.

Analysis of the residues by PXRD found the presence of an amorphous solid in both cases. A more significant mass loss (16.34% vs 8.34%) is observed for the synthetic sample due to residual TEAOH (Bourgeat-Lami et al., Reference Bourgeat-Lami, Di Renzo, Fajula, Mutin and Des Courieres1992) and possibly the secondary amorphous phase identified with PXRD. The weight loss of the synthetic sample occurs over a larger temperature range, also indicating the poorer crystallinity of the synthetic sample in comparison to the natural jadarite mineral sample.
Discussion and conclusion
Pawley refinement of PXRD data collected on the synthetic product confirmed the data could be indexed and refined on a monoclinic unit cell in space group P21/c, with an R wp of 9.22, which matched well with the published values for jadarite (Whitfield et al., Reference Whitfield, Le Page, Grice, Stanley, Jones, Rumsey, Blake, Roberts, Stirling and Carpenter2007). Intensity discrepancies of hkl reflections such as 020, 101, $\bar{1}$ 21, 101, and 131 are due to possible partial occupancy of the Si site in the structure (Fig. 4), which is supported by ICP–OES results that show lower Si contents than expected from the ideal formula and when compared to analysis of the natural sample (Table 2). Analysis of FTIR spectra collected on the natural and synthetic jadarite samples confirmed the presence of trigonal and tetrahedral borate groups (Fig. 5) (Stanley et al., Reference Stanley, Jones, Rumsey, Blake, Roberts, Stirling, Carpenter, Whitfield, Grice and Lepage2007; Xie et al., Reference Xie, Kuang, Wiens, Deevsalar, Tunc, Purdy, Zuin, Tse, Mi and Pan2024). SEM images showed similarities in particle morphology between the synthetic sample and natural jadarite (Fig 5). In both samples the particles were found to be smaller than 11 μm in diameter and formed rough agglomerates. According to the ICP–OES data, the Li:B ratio in the synthetic sample is close to both the reported and ideal ratios from the chemical formulae, which confirms successful incorporation of Li in the synthetic product (Table 2).
Thermogravimetric analysis of both synthetic and natural jadarite showed significant mass loss occurring before 620°C (Fig. 7). Greater, more gradual mass loss was observed in the synthetic sample, which highlighted the presence of impurities and lack of crystallinity compared to natural jadarite. The presence of broad bands in the FTIR spectrum and the amorphous background and broader diffraction peaks in the PXRD patterns indicate that a secondary amorphous phase and residual TEAOH are present in the synthesis experiment. The larger weight losses observed in the TGA data collected on the synthetic jadarite sample, compared to the weight loss observed for the natural sample, also confirm the presence of a secondary phase and TEAOH.
The results we present here confirm the successful synthesis of a jadarite-type analogue using the DGC technique. The synthesis of a jadarite analogue represents a big step towards understanding the conditions aiding the natural formation of this unconventional Li ore mineral.
Future work will focus on the synthesis and full elemental and structural characterisation of phase-pure jadarite. Structural refinement of high-resolution diffraction data collected on synthetic jadarite is a critical next step to investigate similarities and differences that may exist between the structures of natural jadarite and its synthetic analogue.
Acknowledgements
The authors thank the University of Edinburgh and STFC, who supported this work. We would like to thank Dr Nicola Cayzer (School of Geosciences, University of Edinburgh) for use of SEM instruments and Dr Lorna Eades (School of Chemistry, University of Edinburgh) for use of the ICP–OES instrument. The authors also wish to acknowledge Stuart Mills for the editorial handling and two anonymous reviewers, whose comments greatly enhanced an initial version of this paper.
Competing interests
The authors declare none.


 Open access