


The influence of social groups on voters’ electoral behavior is a classic theme in both popular and scientific discourse on elections. In the scientific domain, the discussion has gone through several iterations and shifts in focus. Objective group memberships were the focal point in the early days of the Columbia school (eg Lazarsfeld, Berelson and Gaudet Reference Lazarsfeld, Berelson and Gaudet1944) and the cleavage model of Lipset and Rokkan (Reference Lipset, Rokkan, Lipset and Rokkan1967). More recently, we have seen a surge in analyses of the influence of voters’ subjective group memberships, or social identities (eg Achen and Bartels Reference Achen and Bartels2016; Jones Reference Jones2023; Mason and Wronski Reference Mason and Wronski2018; Zollinger Reference Zollinger2024), and related group consciousness (eg Cramer Reference Cramer2016; Walsh Reference Walsh2012).
A third, complementary type of group influence has been underexplored. Seminal studies by Converse (Reference Converse2006 [1964]) and the rest of the team behind The American Voter (Campbell, Converse, Miller et al. Reference Campbell, Converse, Miller and Stokes1960) noted that voters may also be influenced by groups to which they neither objectively nor subjectively belong. Accordingly, groups may serve as ‘reference points for the formation of attitudes and decisions about behavior’ (ibid., 296), shaping opinions and vote choices through perceptions of how parties and policies relate to groups that voters like or dislike to varying degrees. While some studies have picked up on this idea (Brady and Sniderman Reference Brady and Sniderman1985; Conover Reference Conover1988; Elder and O’Brian Reference Elder and O’Brian2022; Kane, Mason and Wronski Reference Kane, Mason and Wronski2021; Mason, Wronski and Kane Reference Mason, Wronski and Kane2021; Nelson and Kinder Reference Nelson and Kinder1996; Piston Reference Piston2018; Sirin, Valentino and Villalobos Reference Sirin, Valentino and Villalobos2016; Stubager Reference Stubager2025; Stubager and Dausgaard Reference Stubager, Dausgaard, Hansen and Stubager2024; Wlezien and Miller Reference Wlezien and Miller1997), this type of group influence has been assigned ‘an ancillary role, if considered at all’ (Kane, Mason and Wronski Reference Kane, Mason and Wronski2021, 1784).Footnote 1 Moreover, most prior work offers only single-country, cross-sectional snapshots (for the US in most cases) focused on a limited set of groups. Consequently, we know little about how the relationships have developed over time (although see Robison and Moskowitz Reference Robison and Moskowitz2019) and about the extent to which group sympathies also influence voters in political systems outside the US.
To explore the idea that voters’ attitudes to reference groups influence their vote choices, we take an observational approach relying on election study data from three countries. We begin by examining the cumulative file of the American National Election Study (ANES 2022), which has included group sympathy measures since 1964. This permits us to track the development in the group sympathy-vote choice relationship in the US across seven decades for a wide range of social groups. Interesting as it is, however, the US case with its polarized two-party presidential system and high economic inequality also makes it a rather unique case compared to most other democracies. To assess the generalizability of the mechanisms to other Western democracies, we compare results from the 2020 US election with recent elections in Denmark (2022) and Austria (2019). The two continental European countries are both multiparty systems characterized by weaker partisan identities and lower inequality.
Our analyses provide a range of observational evidence that voters’ evaluations of social groups are linked to their party choices. In the US, this relationship has a long history and has strengthened in the past decade, but we find comparable patterns in the distinct political contexts of Denmark and Austria. Substantially, our results nuance current interpretations of the evolution of electoral politics in Western countries (eg Bornschier, Häusermann, Zollinger et al. Reference Bornschier, Häusermann, Zollinger and Colombo2021; Bornschier, Haffert, Häusermann et al. Reference Bornschier, Haffert, Häusermann, Steenbergen and Zollinger2024). While group sympathies tied to the conflict over cultural issues, such as immigration, are strongly related to vote choice, we also find strong relationships for groups rooted in economic conflicts, contradicting claims that these cleavages have faded (eg Clark and Lipset Reference Clark and Martin Lipset1991; Franklin Reference Franklin, Franklin, Mackie and Valen1992). On this basis, we expect reference groups to matter politically in other democracies as well. In turn, this means that a full assessment of the influence of social groups on politics should pay attention to group sympathies in addition to objective group memberships and social identities.
(Reference) Groups and vote choice
Early studies of the relationship between social groups and vote choice focused on objectively defined groups characterized by their different locations in the social structure of society. Extant work has shown differences in voting patterns across gender, age, urban-rural residence, social class, race and ethnicity, and many other group categories (see, eg Bornschier, Häusermann, Zollinger et al. Reference Bornschier, Häusermann, Zollinger and Colombo2021; Bornschier, Haffert, Häusermann et al. Reference Bornschier, Haffert, Häusermann, Steenbergen and Zollinger2024; Evans and De Graaf Reference Evans, Dirk De Graaf, Evans and De Graaf2013; Evans and Langsæther Reference Evans, Egge Langsæther and Dalton2021; Jones Reference Jones2023; Zingher Reference Zingher2014; Reference Zingher2019). While some of these differences are weakening over time (eg those for class, see Evans and Langsæther Reference Evans, Egge Langsæther and Dalton2021), others are of increasing importance (eg for education, see Bovens and Wille Reference Bovens and Wille2017). This line of research is, in other words, still productive. The same applies to work on the role of subjective memberships – or social identities – where individuals feel a sense of belonging to a given social group. This aspect of groups has been subject to increased attention over the past decade (for broad approaches. see, eg Achen and Bartels Reference Achen and Bartels2016; Huddy Reference Huddy, Huddy, Sears and Levy2013) with studies investigating, eg rural identification and consciousness (Cramer Reference Cramer2016; Haffert, Palmtag and Schraff Reference Haffert, Palmtag and Schraff2024; Walsh Reference Walsh2012), religious, racial/ethnic, or gender identities (eg Fraga, Velez and West Reference Fraga, Velez and West2024; Jones Reference Jones2023; Turnbull-Dugarte and Ortega 2024; Zarate, Quezada-Llanes and Armenta Reference Zarate, Quezada-Llanes and Armenta2024; see also Bornschier, Häusermann, Zollinger et al. Reference Bornschier, Häusermann, Zollinger and Colombo2021; Bornschier, Haffert, Häusermann et al. Reference Bornschier, Haffert, Häusermann, Steenbergen and Zollinger2024; Donnelly Reference Donnelly2021).
Both research traditions focus on how group membership – whether objectively or subjectively defined – influences voters’ behavior. In doing so, they neglect the basic premise of reference group theory that people ‘frequently orient themselves to groups other than their own’ (Merton and Rossi Reference Merton, Rossi and Merton1968, 288). As noted by Campbell, Converse, Miller et al. (Reference Campbell, Converse, Miller and Stokes1960, 296), ‘even people who are not members of a group may be influenced by the position that a group takes in politics. Groups can become reference points for the formation of attitudes and decisions about behavior’ (see also Elder and O’Brian Reference Elder and O’Brian2022; Lewis-Beck, Jacoby, Norpoth et al. Reference Lewis-Beck, Jacoby, Norpoth and Weisberg2008, 306; Nelson and Kinder Reference Nelson and Kinder1996; Stubager Reference Stubager2025; Stubager and Dausgaard Reference Stubager, Dausgaard, Hansen and Stubager2024).
The basic idea as developed by Converse (Reference Converse2006 [1964]), Conover (Reference Conover1988), and Brady and Sniderman (Reference Brady and Sniderman1985; see also Sniderman, Brody and Tetlock Reference Sniderman, Brody and Tetlock1991) is straightforward: When a party, candidate, or policy is seen as positively linked to a particular group, attitudes about the group can be used as a reference or heuristic short-cut for the formation of policy attitudes and voting decisions. Liking the group tends to translate into favorable views of the associated party, candidate, or policy, while disliking the group has the opposite effect. The core variable in this framework is group sympathy (or group affect, see Conover Reference Conover1988).
Despite its simplicity, this third type of group influence has received far less scholarly attention than membership-based approaches. Only a few studies (Kinder and Dale-Riddle Reference Kinder and Dale-Riddle2012; Mason, Wronski and Kane Reference Mason, Wronski and Kane2021; Miller, Wlezien and Hildreth Reference Miller, Wlezien and Hildreth1991; Miller and Wlezien Reference Miller and Wlezien1993; Piston Reference Piston2018; Stubager Reference Stubager2025; Stubager and Dausgaard Reference Stubager, Dausgaard, Hansen and Stubager2024; Wlezien and Miller Reference Wlezien and Miller1997) – most of them using cross-sectional data for the US – investigate the proposition directly with vote choice as the dependent variable.Footnote 2 As a result, we know relatively little about the stability of these relationships over time, their operation in different political systems, or their strength relative to more established group-based explanations.
In- and out-groups
By presenting reference group processes as a third, complementary type of group influence on political behavior, we argue that this perspective offers insights over and above those provided by theories focused on objective group memberships and social identities. In particular, the central contribution of the reference group perspective concerns its ability to predict and explain out-group-oriented behavior.
Theories focusing on group membership or identity only account for the behavior of the in-group, ie those who belong (objectively or subjectively) to a given group. In-group members are generally expected to act in ways that advance their groups’ interests. Sometimes, this positions out-group members as adversaries of the in-group, as in Kinder and Kam’s (Reference Kinder and Kam2009) ethnocentrism framework. In other cases, relations between in- and out-groups may be less hostile (eg Brewer Reference Brewer1999; Reference Brewer, Sibley and Fiona2016; Herring, Jankowski and Brown Reference Herring, Jankowski and Brown1999). Still, according to social identity theory, individuals seek positive self-esteem from their group identification (see Huddy Reference Huddy, Huddy, Sears and Levy2013), meaning that the out-group should never be evaluated more positively than the in-group. Moreover, social identity theory is silent about out-groups that are neither adversaries nor positively related to the in-group.Footnote 3 The theory provides no predictions for reactions to such groups.
For reference group theory, in contrast, the differentiation between in- and out-groups plays no major role. The theory does not imply that in-groups will be evaluated more positively than out-groups. It is fully compatible with (objective or subjective) members of a given group having more positive evaluations of another group (ie an out-group) and acting on these evaluations. But it predicts that attitudes towards out-groups linked to a given party, candidate, or policy may influence behavior regardless of how such groups relate to the in-group (however defined). This is exactly the unique theoretical contribution of reference group theory: it can account for positive or negative reactions towards parties, candidates, or policies associated with any out-group.
This perspective is especially valuable for understanding why small or weak identity groups can be far more electorally important than membership-oriented theories would suggest. It is exactly because non-members of numerically small groups (eg an ethnic minority) have – sometimes strongly held – evaluations of these groups that discussions of their rights can command public attention to the extent that they do. For membership-focused theories, the small size of the groups implies that parties and the public at large should not care too much about the groups. Evidently, they do, and reference group theory can help explain why (Huber Reference Huber2022; Stuckelberger and Tresch Reference Stuckelberger and Tresch2024).
Group evaluations in the voter’s mind
Although we argue that group evaluations are separate from voters’ objective and subjective group memberships, the different concepts are, of course, related. People’s evaluations of social groups are often shaped by their own memberships, both directly – through shared experiences, interests, and socialization – and indirectly, through media portrayals or political discourse that associates their in-groups with certain out-groups. As noted above, we would therefore expect individuals who (objectively or subjectively) belong to a group to evaluate it more positively. As such, group evaluations form one part of voters’ general worldviews or belief systems (to the extent that such systems exist as per Converse Reference Converse2006 [1964]). Yet, we argue that group evaluations play their own important role in such worldviews – one that cannot be reduced to the other, more well-known components (see also the discussion in Conover Reference Conover1988).
Given the central role that groups have played and continue to play in political debates, it is unsurprising that group evaluations are related to policy preferences and ideology. Thus, group evaluations affect attitudes toward group-related policies and issues and provide ideological consistency (Elder and O’Brian Reference Elder and O’Brian2022; Sirin, Valentino and Villalobos Reference Sirin, Valentino and Villalobos2016). Importantly, these effects appear independently of policy attitudes and ideology (see also the discussion in Cramer Reference Cramer2020, 158),Footnote 4 underscoring the distinctiveness of group evaluations. At the same time, this relationship raises a methodological challenge for analyzing the link between group evaluations and vote choice – a point we return to below.
Finally, group evaluations can also help explain other types of attitudes, such as racism, antisemitism, or attitudes towards immigrants. Reference group theory offers at least two advantages over membership-oriented approaches. First, it provides a general theory for understanding this aspect of voter behavior that can be applied across groups without a priori privileging some groups over others. Second, the theory directs focus to the group dimension without conflating group evaluations with ideological positions and/or policy attitudes, thereby confounding the analysis of the group aspect, which is a common issue in research on racial groups as well as immigrants (see Cramer Reference Cramer2020, 158; Hainmueller and Hopkins Reference Hainmueller and Hopkins2014). Perhaps the literature on deservingness perceptions (eg Attewell Reference Attewell2021; Reference Attewell2022; van Oorschot Reference van Oorschot2000) is the one that comes closest to the argument of reference group theory, although its focus on welfare recipients and deservingness is much more restricted than the reference group argument.
Expectations
In sum, we do not argue that theories based on objective or subjective group membership are wrong; rather, we contend that such theories cannot stand alone because they are incomplete. We also need to take the independent role of group sympathies into account, as proposed by reference group theory. Our basic expectation, therefore, is that voters’ sympathies for a given social group are positively related to the probability that they will vote for parties seen as representing that group. Crucially, this relationship should persist even when objective group memberships and social identities have been accounted for.
Implicit in this expectation is that the relationship between group sympathies and political behavior is conditional on the perceived association between groups and parties, candidates, or policies. As Converse (Reference Converse2006 [1964], 41) notes, ‘the individual must be endowed with … some interstitial “linking” information indicating why a given party or policy is relevant for the group’ (see also Nelson and Kinder Reference Nelson and Kinder1996). In other words, for group sympathies to influence vote choices, voters must in some way link groups and parties/candidates (see also Kane, Mason and Wronski Reference Kane, Mason and Wronski2021). This leads to the following additional expectation: the group sympathy-vote choice relationship should be more positive when voters perceive a clear connection between the group and the party.
Importantly, while reference group theory predicts that evaluations of groups are important for vote choice, it is itself silent on the question of which groups are important in a given case. Answering this question calls for different types of theories focused on the substantive political and social context in which reference group theory is explored. We draw on such more substantively focused theories when discussing our cases below.
We test our expectations in several steps, probing their tenability longitudinally and comparatively. First, we investigate the evolution of the relationship between sympathy for a wide range of groups and vote choice in the US in a longitudinal perspective to probe the degree of stability of such relationships both descriptively and when controlling for the influence of group memberships and social identities. Second, we conduct a more detailed comparative analysis of the relationship between group sympathy and vote choice at recent elections in the US, Denmark, and Austria to assess the generalizability of the relationship. Finally, we examine the interaction hypothesis about the extent to which perceived group-party linkages condition the impact of group sympathies on vote choice to establish this important implication of the theory (thereby also lending support to our interpretation of the direct relationship).
Data and methods
Case selection
Most extant research on the reference group logic relies on US data, and the US is (as far as we are aware) the only country for which time-series measures of group sympathies and vote choice are available in the same datasets for a substantial time period. This makes the US a natural starting point for our study. However, given its history and political system, the US differs from many Western democracies on multiple dimensions. First, the country is among the most economically unequal (OECD 2015), thereby potentially reinforcing objective group conflicts. It also has a long history as an immigrant nation with a broad range of politically salient social groups, which should add to the general importance of groups. In contrast, the two-party system implies that parties have had to pursue the support of broader coalitions of social groups, which might weaken group effects. Finally, the US is characterized by comparatively high levels of party identification (eg Lewis-Beck, Jacoby, Norpoth et al. Reference Lewis-Beck, Jacoby, Norpoth and Weisberg2008, 116) and lately of strong partisan sorting that has made party coalitions more socially homogeneous, which may strengthen reference group processes (eg Mason and Wronski Reference Mason and Wronski2018; Claassen, Djupe, Lewis et al. Reference Claassen, Djupe, Lewis and Neiheisel2021). Therefore, and to show the generality of such processes, we also explore the theory’s performance in two multiparty systems that differ from the US on these counts: Denmark and Austria.
Denmark and Austria are among the most equal Western countries (OECD 2015). Both countries have a parliamentary system with a PR electoral system and lower levels of party identification than in the US. However, while Denmark is characterized by a high number of parties (with no less than 12 parties elected to parliament in the 2022 election), the number of parties in Austria is significantly smaller, with 5 parties represented in parliament after the 2019 election. Historically, the two countries represent variations of the cleavage structure characteristic of Western European countries (Lipset and Rokkan Reference Lipset, Rokkan, Lipset and Rokkan1967). While Danish politics was, for a large part of the 20th century, dominated by the class cleavage (and a weaker urban-rural cleavage), Austria also saw a salient religious-secular division. In recent years, however, both countries have been among the frontrunners in the development of the cultural cleavage, with the issue of immigration playing a key role (see also below). Overall, the three countries differ on a range of dimensions that may influence reference group processes, which permits us to investigate whether the theoretical expectations bear out in different contexts. While the countries are not necessarily ‘most different systems’, they represent different constellations of socio-political situations across Western democracies, thereby permitting an evaluation of the generalizability of reference group processes.
Group selection
We focus on social groups defined by features that are not explicitly political. In contrast to some extant studies (eg Kane, Mason and Wronski Reference Kane, Mason and Wronski2021; Robison and Moskowitz Reference Robison and Moskowitz2019), we therefore exclude groups such as liberals, conservatives, and feminists to subject our theory to a harder test. After all, these groups are defined by ideological commitments that they share with certain parties, and so it would be less surprising to find that vote choice is related to sympathies for such groups. What matters for the reference group theory to be substantively informative is whether sympathy for groups defined by features that are not, in themselves, political is related to voting.
We retain separate sympathy measures for each group rather than combining them into composite scores, as was done in a substantial number of prior studies (eg Kane, Mason and Wronski Reference Kane, Mason and Wronski2021; Mason, Wronski and Kane Reference Mason, Wronski and Kane2021; Miller, Wlezien and Hildreth Reference Miller, Wlezien and Hildreth1991; Miller and Wlezien Reference Miller and Wlezien1993; Robison and Moskowitz Reference Robison and Moskowitz2019; Wlezien and Miller Reference Wlezien and Miller1997). This permits a more transparent and detailed analysis, just as it allows for group sympathies to vary freely in their relationship with vote choice, thereby also providing information on which groups are relevant in the three contemporary contexts.
Besides the exclusion of explicitly political groups, however, we aim for the widest possible selection of groups to maximize the generalizability of the results. The groups available in the survey data have, of course, been included for a (presumably theoretical) reason. Thus, the selection of groups across the three countries allows us to test the reference group argument for groups related to both well-known and newer cleavages, thereby also providing substantive insights into the group dimension of current democratic politics.
In the US, we include all groups that have appeared in at least five rounds of the ANES in order to provide as comprehensive an overview as possible while still maintaining a reasonable time perspective in the longitudinal analysis. On this basis, the longitudinal analysis incudes 12 groups that represent the major conflict dimensions of US society and politics (see, eg Campbell, Converse, Miller et al. Reference Campbell, Converse, Miller and Stokes1960; Lewis-Beck, Jacoby, Norpoth et al. Reference Lewis-Beck, Jacoby, Norpoth and Weisberg2008; Manza and Brooks Reference Manza and Brooks1999):Footnote 5 the racial and ethnic cleavage (Blacks, Whites, Hispanics), the religious cleavage (Catholics, Protestants, Jews, Muslims, ChristiansFootnote 6), the economic/class cleavage (big business, labor unions, middle class people, poor people, people on welfare) and the more recent cultural cleavage (gays, lesbians, and rural Americans).Footnote 7
For Denmark, the DNESFootnote 8 provides data for seven groups that also represent both historical and more recent conflicts (see, eg Bornschier, Haffert, Häusermann et al. Reference Bornschier, Haffert, Häusermann, Steenbergen and Zollinger2024; Lipset and Rokkan Reference Lipset, Rokkan, Lipset and Rokkan1967; O’Grady Reference O’Grady2023): the class cleavage (the working and upper middle classes), growing generational divides (the young and the elderly), the urban-rural cleavage (city-dwellers and country-dwellers), as well as the cultural cleavage (Muslims).
Likewise, the eight groups available for Austria also relate to the two overall cleavages characteristic of Western European democracies (see also Oesch and Rennwald Reference Oesch and Rennwald2018): the class cleavage (rich people, low-income earners, self-employed, unemployed, and pensioners) and the cultural cleavage (women, homosexuals, and immigrants). See Table A1 in the online Appendix for an overview of the groups included in the analyses.
Operationalization
In the ANES, group sympathy is measured using the standard feeling thermometer ranging from 0 to 100 (see Table A1 for coding of all variables). The dependent variable, vote choice, is measured as the party of the presidential candidate the respondent voted for in the election. We only show results for the two main parties. In the multivariate models, we include controls for respondents’ objective group memberships as well as a range of social identities. Specifically, we control for gender, age, education, income, race/ethnicity, religion, class identification, place of residence, whether anyone in the respondent’s household is a union member or not, and whether the respondent is heterosexual or not.Footnote 9
In the 2022 DNES, group sympathy is measured using a 0–10 scale. Vote choice is measured by a question tapping which party the respondent voted for in the parliamentary election on November 1, 2022. The 12 partiesFootnote 10 that cleared the electoral threshold for parliamentary representation are included in the analysis; all other responses are excluded. As controls, we include gender, age, education, place of residence, occupation, household income, and class identification.
In the 2019 AUTNES,Footnote 11 group sympathy is measured similarly as in Denmark. Vote choice was assessed by asking which party the respondent voted for in the parliamentary election on September 29, 2019. We include all 5 partiesFootnote 12 represented in parliament after the election in the analysis. As controls, we include gender, age, education, employment status, migration background, sexual orientation, and household income. We thus aim to control for subjective and objective group membership as well as possible in all models across countries.Footnote 13
The DNES and AUTNES also include measures of how voters associate various social groups with political parties, thereby enabling an analysis of the interaction hypothesis. In both studies, respondents were asked which party they think ‘best represents’ the groups in question.Footnote 14 In the analyses, we dichotomize responses into whether a given party was mentioned as best representing a given group or not. We have not been able to locate similar measures in the ANES, although one question asks about respondents’ perceptions of the parties’ stances with respect to helping Blacks. We leverage this item in a supplementary analysis in the online Appendix.
Modeling
We conduct the longitudinal US analyses in two steps. First, we present the bivariate relationships using mean sympathy for the 12 groups among Republican and Democratic voters. Second, we show the relationships after controlling for the variables mentioned above. Specifically, based on multinomial logistic regression models with vote choice as the dependent variableFootnote 15, we calculate the difference in the predicted probability of voting for each party at the 25th and 75th percentiles of group sympathy and then subtract the Democratic score from the Republican. Positive scores indicate that higher levels of sympathy for a group are associated with a higher probability of voting Republican than Democrat, while negative scores indicate the opposite. The resulting scale runs from −1 to 1.
In the comparative analysis, we estimate multinomial logistic regression models separately for the three countries, controlling for objective group memberships and social identities.Footnote 16 Where multiple groups are linked to the same underlying cleavage, we include their sympathy scores jointly in the model to account for potential correlations. For the US, we include sympathy for the three racial/ethnic groups and the three religious groups together, as well as sympathy for labor unions and big business; sympathy for rural Americans and gays and lesbians appear alone in the models.Footnote 17 For Denmark, we have three pairs of groups (young/elderly, urban/rural, working class/upper middle class), while sympathy for Muslims appears alone in the model. For Austria, we group rich people/low-income earners together, as well as the self-employed/unemployed, women/pensioners, and immigrants/gays and lesbians.
Since we rely on a selection-on-observables approach in observational data, we are unable to fully causally identify the relationship between group sympathy and vote choice. This is a limitation of our design, the implications of which we return to below. That said, our study is the first that we know of to offer comparative and multi-decade longitudinal analyses of reference group theory. Thus, our main contribution lies in the examination of the stability of the relationships and of whether we can identify similar patterns across the three countries as a way of testing the generalizability of such relationships across different temporal, social, and political contexts. In particular, the fact that the level and strength of party identification vary between the US and the two other countries is useful. Strong partisanship might, thus, lead to effects flowing from party choice to group sympathies – ie reverse causality – because voters follow the party with which they identify. To the extent that we can document relationships of similar strength in all three countries across both strong and weak partisan contexts, it curbs fears that the group sympathy-vote choice relationship is (wholly) endogenous to party choice. Likewise, the interaction hypothesis is a very specific observable implication of the theory that – given support in the data – contributes to strengthening confidence in its veracity.
As discussed, there are theoretical reasons to believe that group sympathies are related to voters’ ideological and issue positions, although the causal order is disputed, with some seeing group evaluations as the more foundational aspect (eg Elder and O’Brian Reference Elder and O’Brian2022; Sirin, Valentino and Villalobos Reference Sirin, Valentino and Villalobos2016) while others argue for the reverse order (eg Clifford et al. Reference Clifford, Simas and Suh2025). With our data, we cannot resolve this question, but we have done two things to address it. First, we show in the Appendix how group sympathy correlates with (conservative-liberal or left-right) ideological position in the three countries.Footnote 18 As discussed in the Appendix, the correlations all fall below 0.5 – most of them even well below – which shows that although related, group sympathies and ideological positions are clearly separate constructs which lessens fears that ideology might be driving group sympathies.
Second, we have estimated models controlling for ideology. However, as we discuss further in the Appendix, by controlling for ideology, we risk introducing post-treatment bias if voters’ ideological positions are (wholly or partly) driven by group sympathies as suggested by the study of Elder and O’Brian (Reference Elder and O’Brian2022). For this reason, we have opted to present results from models controlled for ideology in the Appendix, while in the results section below, we rely on models without ideology combined with a discussion of the controlled results.
Presentation of results
To evaluate our expectations, we rely on the estimated coefficients to assess the statistical significance of group sympathies, but present predicted probabilities to illustrate the results to facilitate interpretation. Specifically, we calculate differences in predicted probabilities across the interquartile range of group sympathy variables. The underlying coefficients are provided in the Appendix. However, absolute differences in probabilities can be difficult to compare because parties vary in size both within and across countries. For example, a seemingly small difference in predicted probabilities may reflect a large relative relationship for a small party. Therefore, we cannot immediately compare the predicted (differences in) probabilities. To facilitate comparison, we construct a relative measure by dividing the differences in party support along the interquartile range by the size of the party (assessed on the basis of the estimation sample). To this end, we subtract the predicted probability at the 25th percentile of group sympathy from that at the 75th percentile and divide the resulting number by the party’s share of support.Footnote 19
The resulting measure theoretically ranges from negative to positive infinity, though in practice our observed values fall between −3.5 and 3. The sign of the score indicates the direction of the relationship (positive for higher sympathy associated with greater support, negative for the reverse), while the magnitude indicates how strongly sympathy for a given group is related to voting for a given party relative to party size. A score of 1 means that support for the party varies across the interquartile range of group sympathy by as much as the party’s total share of support. Given that the measure is on the same scale for all parties, it permits comparison of the strength of the relationship between group sympathy and vote choice across all parties (and the three countries). In addition to this exact interpretation of the measure, an intuitive sense of the results can be obtained by focusing on the strength and direction of the scores as presented in the figures below.Footnote 20
To test the interaction hypothesis, we rely on the representation variables in the Austrian and Danish datasets. These are measured at the party level and take the value 1 if a respondent perceives the party as ‘best representing’ a given group and 0 otherwise. We expanded the datasets so that each observation represents a respondent–party pair.Footnote 21 Using conditional logit models, the representation variables are interacted with the corresponding group sympathy measures, while also including both sympathy and representation perceptions for the other group in a pair in the model. This allows us to assess whether perceived group-party linkages condition the relationship between group sympathies and vote choice.
The wording of the representation questions (ie which party ‘best represents’ a given group) has implications for the relationships that we can expect. If a respondent names a party as best representing a group, that is likely to also entail a positive relationship between group sympathy and voting for the party. Negative relationships under these circumstances would be counterintuitive, because seeing a party as best at representing a group and then voting more for the party, the less you like the group, makes little sense. In contrast, if a respondent does not perceive a party as best at representing a group, both positive and negative relationships are possible, though positive relationships should be weaker than among those who perceive a link between a party and a group. See Table A1 for an overview of the models and analyses.
Results
Evolution of group sympathy and presidential vote in the US, 1964–2020
As a first step, we investigate whether we can find a bivariate relationship between group sympathies and vote choice and how this relationship has developed over time. Figure 1 shows mean sympathy scores for each group among Republican and Democratic voters. Overall, the results provide consistent support for reference group theory: For every group, there is at least one election with a statistically significant relationship between sympathy and vote choice. Bearing in mind the different scales on the y-axes (chosen to allow minor differences also to be visible), it becomes clear that the strength of the relationship varies across groups. We see strong relationships for Blacks, Hispanics, labor unions, big business, poor people, people on welfare, and gays and lesbians. Higher sympathy for these groups (except for big business) is linked to greater Democratic than Republican support. For these seven groups, the relationships with vote choice are, further, rather stable across time, thereby bearing witness to the strength of both the traditional divides over racial/ethnic and economic differences and the newer cultural conflict in US society and politics. While overall sympathy levels for specific groups (eg Hispanics or gays and lesbians) have changed over time, their relationship with vote choice has persisted or even strengthened. In comparison, sympathy for Whites, middle-class people, and the three religious groups shows weaker relationships with vote choice in most years. However, also for these groups, we do observe stronger relationships towards the end of the time series so that all relationships are significant for the last year in which a group appears.

These patterns come as little surprise to anyone familiar with US politics. The Democratic party has, for a long time, been seen as representing racial and ethnic minorities, sexual minorities as well as less well-off groups including those organizing in labor unions, while the Republican party is seen as more affiliated with business interests (eg Ahler and Sood Reference Ahler and Sood2018; Campbell, Converse, Miller et al. Reference Campbell, Converse, Miller and Stokes1960; Nicholson and Segura Reference Nicholson and Segura2012; Rothschild, Howat, Shafranek et al. Reference Rothschild, Howat, Shafranek and Busby2019).
Equally interesting, however, are the weak relationships for the religious groups in Figure 1. Even though Catholics and Jews are among the groups traditionally associated with the Democratic party (ibid.), this association does not translate into a relationship between sympathy for the groups and vote choice. For Catholics, there has even been a modest reversal of the relationship. The same applies to Protestants that – at least in the case of Evangelicals – have traditionally been seen as more affiliated with the Republican party (Claassen, Djupe, Lewis et al. Reference Claassen, Djupe, Lewis and Neiheisel2021; Lewis-Beck, Jacoby, Norpoth et al. Reference Lewis-Beck, Jacoby, Norpoth and Weisberg2008, 328–31). The lack of clear relationships between sympathy for these groups and party choice indicates that group sympathies’ political implications do not follow directly from how group members (in the aggregate) behave and that the religious conflict is not strongly manifested at the level of sympathy for the religious groups, although there are signs that gaps have widened slightly recently. Overall, however, sympathies for social groups are clearly related to vote choice, and that in ways that make sense from the perspective of extant knowledge of group members’ political behavior without overlapping completely with such behavior.
Figure 2 presents the results for the multivariate models. Here, we include the many indicators of respondents’ objective and subjective group memberships available in the data into the model to arrive at more unbiased estimates of the relationship between group sympathies and vote choice, ie to show the strength of the relationships over and above group memberships and social identities. The multivariate models generally corroborate the bivariate results. For 11 out of 12 groups (Protestants being the exception), we find significant relationships in at least one year, even after controlling for the wide selection of group memberships and identities. The directions of the bivariate relationships also hold, in that it is only sympathy for big business that is consistently associated with a higher propensity to vote Republican than Democratic (however, see also Catholics and Whites in later years).
Difference in the relationship between sympathy for 12 groups and the probability of voting Republican or Democrat, 1964–2020. Multivariate models.
Note: N = 488–5679 per group-year. Graphs show the difference (with 95% confidence intervals) between the two parties in the difference in the probability of voting for the party between those placed at the 25th and the 75th percentiles on group sympathy, controlling for objective and subjective group memberships. Positive numbers indicate a more positive relationship with voting for the Republicans than for the Democrats and vice versa. See coefficients in Tables A3.1–A14.2.

Furthermore, we find the same differentiation between Blacks, Hispanics, labor unions, big business, poor people, people on welfare, and gays and lesbians on the one hand, and Whites and the three religious groups on the other hand. For middle-class people, the relationship changes from weak to fairly strong over the years. This development fits the overall temporal impression also left by Figure 1 in that we see stronger relationships toward the end of the period, especially for groups associated with the racial/ethnic, economic, and cultural conflicts.
These findings underscore the relevance of reference group theory: Even when taking account of an extensive list of objective group memberships and social identities, we can observe a strong and/or strengthening relationship between group sympathies and vote choice over time for a broad selection of groups. In substantive terms, moreover, the relationship is rather strong, in some cases getting close to −0.6 (on the scale theoretically varying from −1 to 1). Reference group theory seems, in other words, to provide an increasingly relevant perspective on US electoral behavior reflecting underlying societal conflicts.
Comparing the group sympathy-vote choice relationship in the US, Denmark, and Austria
To probe the generalizability of reference group theory, we use data for recent national elections in the US, Denmark, and Austria. Figures 3, 4, and 5 present the results based on the relative measure of the group sympathy-vote choice relationship introduced above. In each of the figures, the groups are arranged according to the underlying conflicts and with markers showing the index scores for each party.
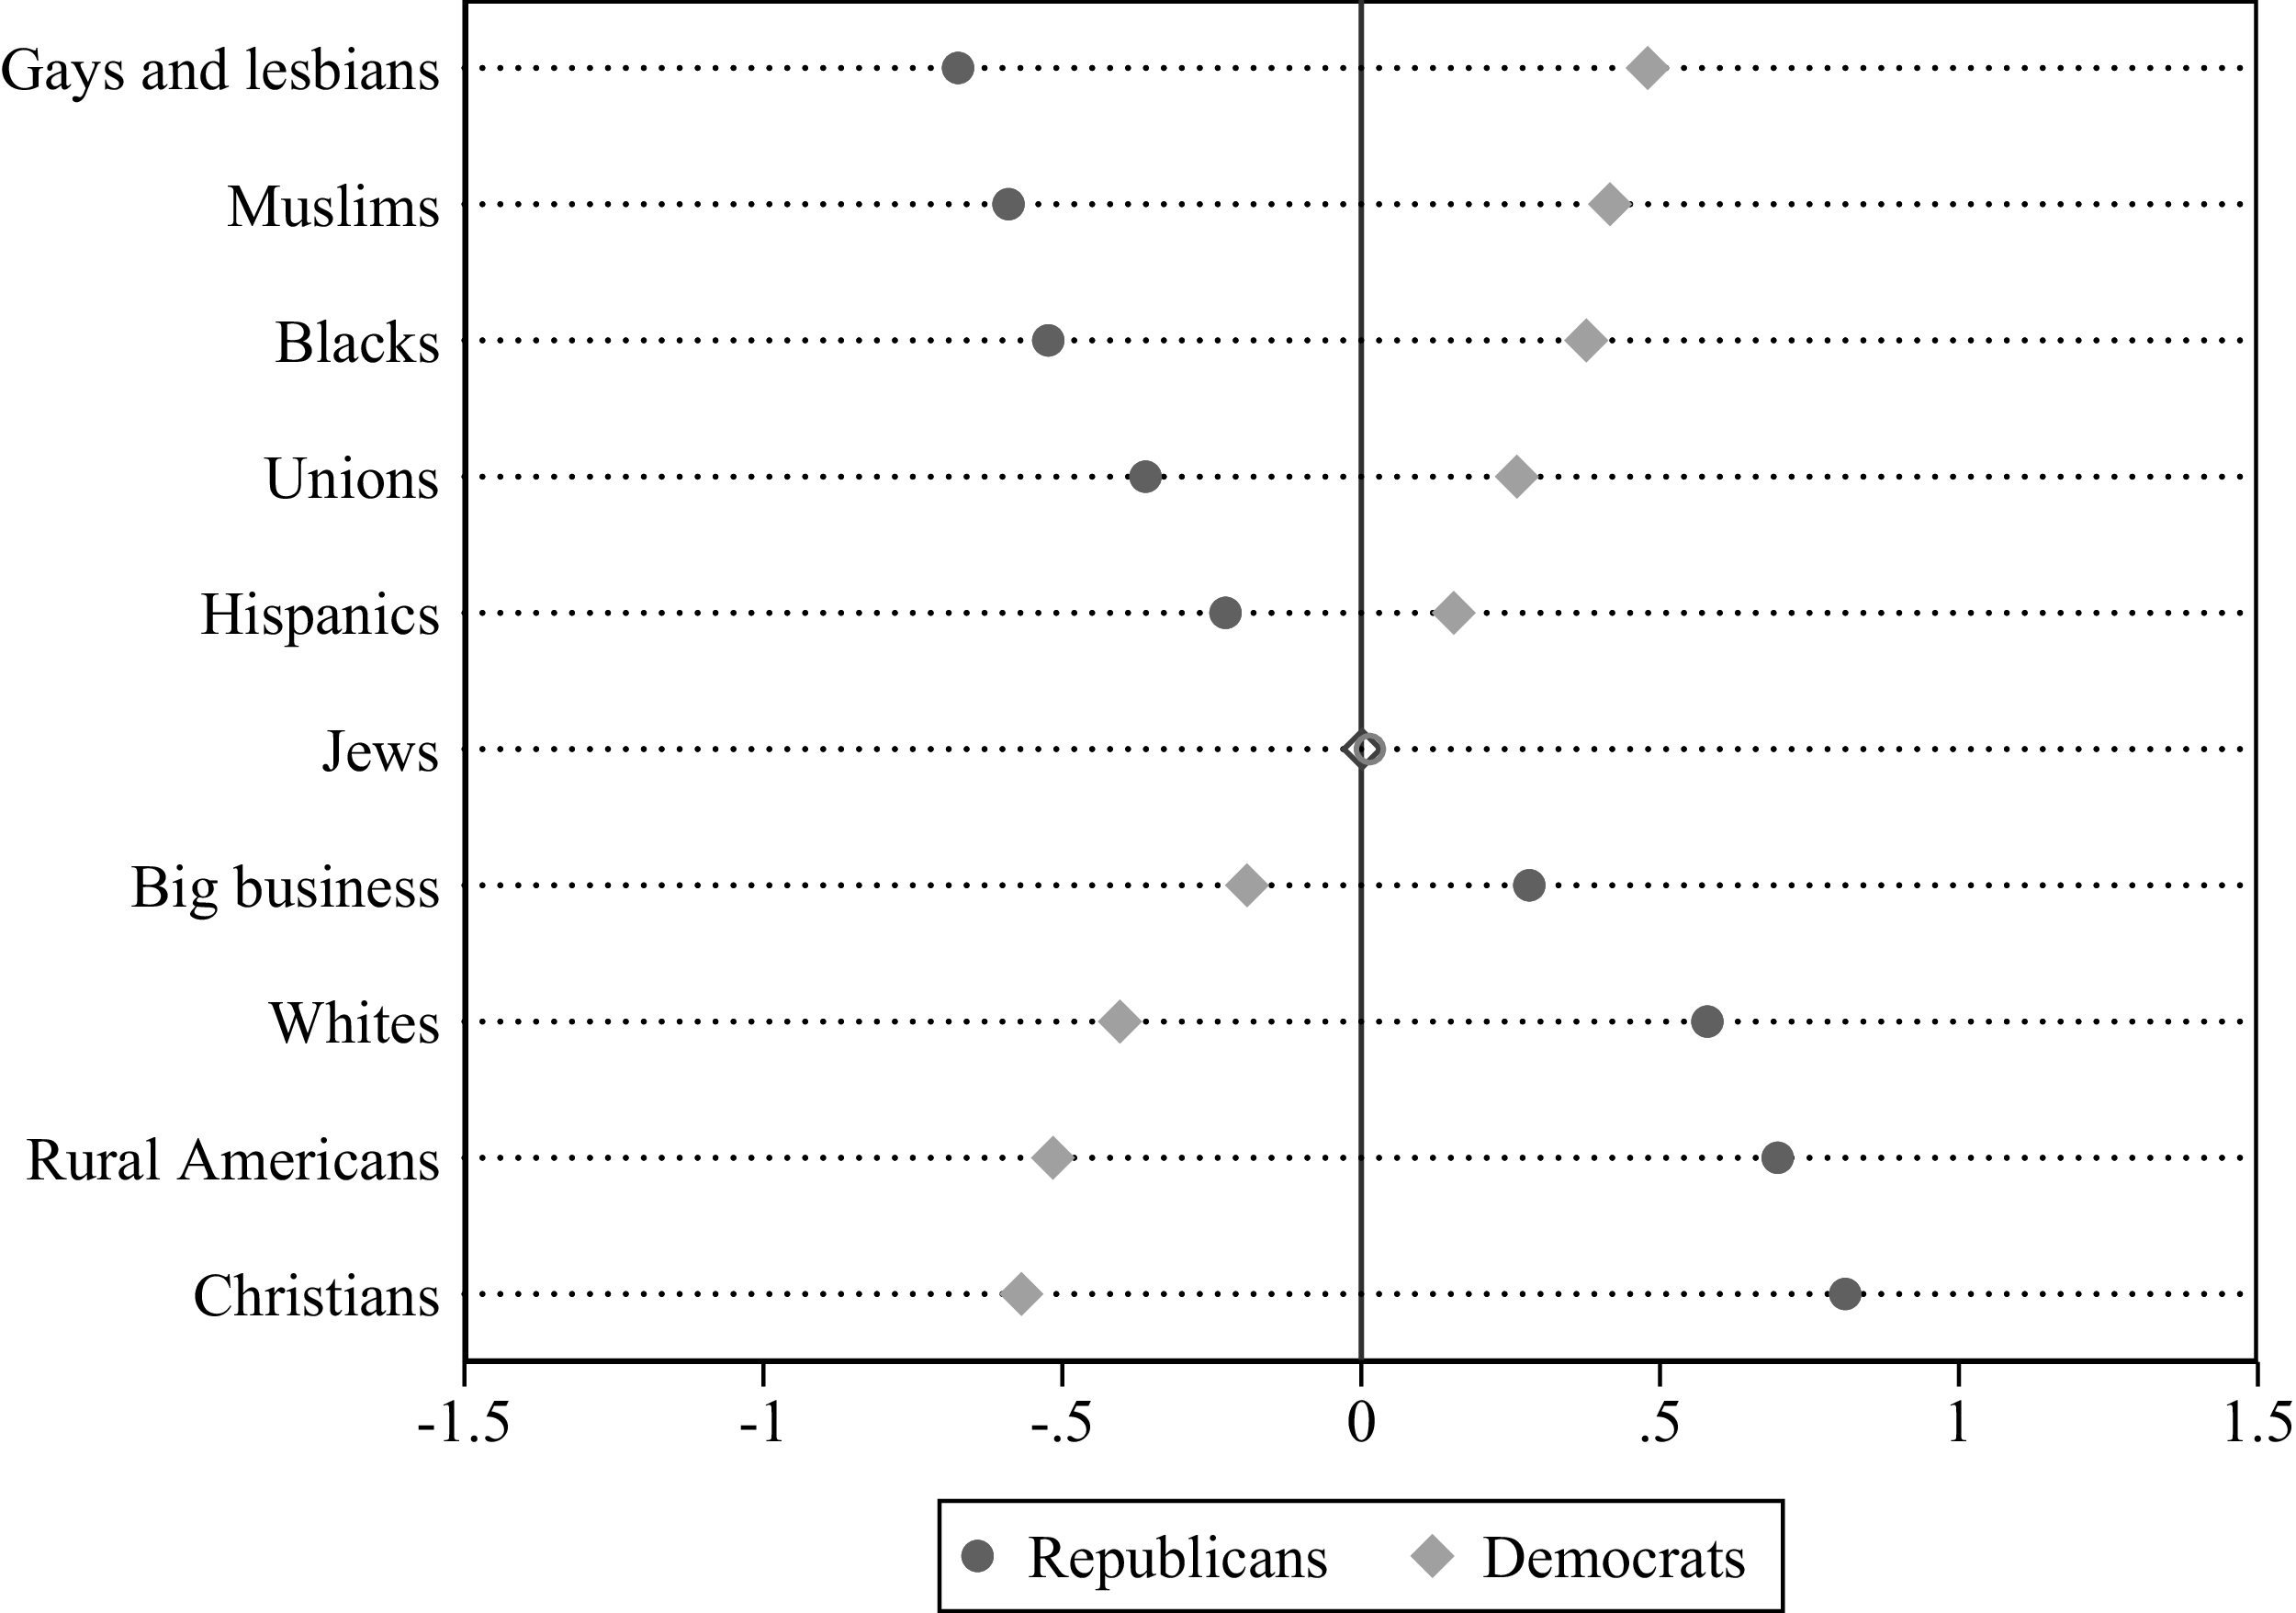
Group sympathy and presidential vote choice in the US, 2020.
Note: N = 5124–5673. For each group-party combination, markers show the difference in support for the party between those at the 25th and 75th percentiles on the group sympathy scale relative to the overall level of support for the party. Hollow markers show insignificant relationships. See coefficients in Table A15.

Group sympathy and party choice in Denmark, 2022.
Note: N = 1879–1962. For each group-party combination, markers show the difference in support for the party between those at the 25th and 75th percentiles on the group sympathy scale relative to the overall level of support for the party. Hollow markers show insignificant relationships. See coefficients in Table A16.

Group sympathy and party choice in Austria, 2019.
Note: N = 1184–1233. For each group-party combination, markers show the difference in support for the party between those at the 25th and 75th percentiles on the group sympathy scale relative to the overall level of support for the party. Hollow markers show insignificant relationships. See coefficients in Table A17.

Beginning with the US results in Figure 3, we see that sympathies for all but one group show significant relationships with vote choice, also when controlling for subjective and objective group membership variables. This confirms the overall result from Figures 1 and 2. The only major deviation is that sympathy for Jews comes out insignificant.Footnote 22 The magnitudes of the relationships are substantial with scores hovering between −0.8 and 0.8. This means, for example, that, between the 25th and 75th percentiles of sympathy for Christians, the predicted probability of voting for the Republican candidate (Donald Trump) varies by about 80% of the total support for the Republican party in the electorate. In other words, among the quarter of Americans who are most sympathetic towards Christians, support for Republicans (59%) is so much higher than Republican support among the quarter that are least sympathetic towards Christians (26%) that the difference amounts to 80% of overall Republican support (41%).Footnote 23 Such strong relationships are consonant with the general expectation that group sympathies have substantial influence on vote choice.
Importantly, the results in Figure 3 also hold when we control for liberal-conservative ideology (see Figure A1 in the Appendix). All relationships remain significant while their strength is – predictably – reduced to a level between (numerically) 0.07 and 0.24. As discussed in the Appendix, we consider the estimates from the controlled models as biased downward, but even in such biased models, group sympathies show sizeable relationships with vote choice.
How, then, about the Danes’ vote choices? Again, all group sympathy measures are significant overall in the underlying models. Thus, reference group theory also offers relevant insights in Denmark. As shown in Figure 4, the relationships are – at least for some group-party combinations – of a magnitude comparable to those found in the US (note that each line in the figures contains the index scores for the two groups indicated in the legend for the party indicated on the left). We do, however, also observe substantial variation across both parties and groups.
The strongest relationships appear for the working and upper middle classes as well as for Muslims, with substantially higher scores than in the US for some parties. For the classes, eg the Conservatives show scores around (absolute) 1, bearing testament to the party’s position as the traditional representative of the higher classes. For Muslims, the Red-Green Alliance scores close to 1.5 while the three immigration-skeptic parties, the Denmark Democrats, the Danish People’s Party, and the New Right, all score at or below −1. Since these parties take marked positions in the debate about immigration and the role of minorities in society, it comes as little surprise that we find high scores for these four parties in relation to Muslims, but even then, the high (absolute) scores are remarkable and show how sympathy for the most prominent minority group in Danish society has a clear and strong relation to vote choice. It is also noteworthy that we see far more insignificant relationships for the age- and place-based groups than for the two classes and Muslims. Even with growing discussions of age- and place-based conflicts in Danish society (see, eg., Nyholt, Hansen and Kjær Reference Nyholt, Hansen, Kjær, Hansen and Stubager2024; Seestedt and Andersen Reference Seestedt, Andersen, Hansen and Rune2024), it is still the groups associated with the traditional class conflict and the somewhat newer cultural conflict that dominate when it comes to the relationship with vote choice.
As is the case for the US, the strength of the relationships is reduced when controlling for (left-right) ideology (see Figure A2 in the Appendix). This is perhaps most pronounced for newer parties without a long tradition of being associated with particular groups (eg the Liberal Alliance or the Alternative with respect to classes). For age and place-based groups, only three or four group-party relationships remain significant (eg for the Denmark Democrats formed to represent rural interests), providing further evidence for the weakness of these conflicts in current Danish politics. For Muslims, in contrast, the estimates are least affected by the control; a reflection, most likely, of the importance of the cultural conflict over, eg the rights of Muslims in Danish society.
For Austria, we find significant relationships between group sympathy and vote choice for all groups except homosexuals. Figure 5 illustrates the relationships in the same way as for Denmark. In general, the magnitude of the relationships is comparable to the results for the US and Denmark, even though the scores for groups related to the economy (based on income and the labor market) are lower. The figure indicates that people with positive attitudes towards rich people show closer alignment with the right-wing ÖVP and the liberal NEOS, while they are less likely to vote for the Greens and the social democratic SPÖ. For low-income earners, we see the exact opposite patterns. Similarly, the ÖVP seems to attract more support from individuals with positive attitudes toward self-employed people, whereas they are less likely to vote for the Greens and the SPÖ. In contrast, higher sympathy towards the unemployed is associated with a higher probability of voting for the Greens and the SPÖ and a lower probability of casting a ballot for the right-wing populist FPÖ and ÖVP. For women, we only see a significant positive score for the Greens and a significant negative score for the FPÖ. Voting for the FPÖ is also associated with viewing pensioners positively, while we see negative scores for NEOS and Greens. Lastly, for immigrants, we see a large negative score for the FPÖ and a smaller negative score for the ÖVP, reflecting their restrictive position on immigration policies. Conversely, the three less restrictive parties (Greens, SPÖ, and NEOS) have substantial, positive scores for this group. Interestingly, we do not find significant effects for homosexuals.
The models controlling for (left-right) ideology generally show the same results as Figure 5, although, as in the US and Denmark, the strength of the relationships is reduced somewhat (see Figure A3 in the Appendix). These reductions are perhaps largest for the economic groups, but even for these, the traditional adversaries in the political version of the class conflict, the SPÖ and the ÖVP, retain significant relationships for all groups except low-income earners.
Overall, the comparative analysis finds group sympathy-vote choice relationships in all three countries, and that with about comparable strength. Given the logic of our comparative design, this is an important finding: Reference group processes operate in widely different political and social contexts. This testifies to the strength of such processes. In all three countries, we also find variation in the relationships across both parties and groups. Substantially, the results show the importance of groups related to both classic and newer socio-political cleavages. Thus, traditional cleavages are reflected in the finding that economic groups are relevant in all three countries, just as racial/ethnic groups are important in the US. Likewise, the importance of migrants in Austria and Muslims in Denmark (and probably also the USFootnote 24) testifies to the importance of the cultural cleavage (although the case of sexual minorities shows how conflicts may crystallize around different groups in different contexts).
Interaction of group sympathy with perceptions of group representation
As argued in the interaction hypothesis, the direct relationship between sympathies and vote choice should be conditioned by voters’ perceptions of whether parties are seen to represent the respective groups. We test this additional implication of reference group theory by including interactions between group sympathy and parties’ perceived group representation in the models for Denmark and Austria.Footnote 25 In Denmark, all interactions are positive and significant (see Table A18 in the Appendix). In Austria, seven out of the eight interactions are also positive, although none of them turn out significant (see Table A19). The weaker results in Austria are somewhat surprising but are most likely due to two factors. First, the sample available for the analysis in Austria is rather small (N = 578–642), resulting in low statistical power. This point is underlined by the fact that half of the Austrian interactions produce at least as large coefficients as the smallest interaction coefficient found in Denmark. Second, the slight differences in the labeling of the groups in the Austrian sympathy and representation questions introduce a larger element of uncertainty, since some respondents may not have had the exact same groups in mind when answering the two sets of questions. In this light, we consider the Austrian analysis as a preliminary, but underpowered, test of the expectations.
Figure 6 illustrates the results in more detail using two columns for each country: one for those who see a given party as representing a given group, and the other for those who do not (the parties are sorted according to the scores for the first group in each sub-plot in the left column). A common pattern manifests across (almost) all parties and groups. Positive relationships between sympathy for a given group and voting for a given party tend to be stronger among those who see the party as the best representative of the group, compared to those who do not see the party as the best representative of the group. This is entirely as expected. Those who link a group to a party exhibit a stronger positive relationship between their group sympathy and propensity to vote for the party. For negative relationships, we see the opposite pattern: these relationships almost only manifest significantly among those who do not see the party as the group’s best representative. This is also as expected. The pattern is clearer in Denmark, but also manifests in Austria. Thereby, the latter case is also consistent with our expectation, even though the overall tests are underpowered.
Group sympathy and party choice conditional on parties’ group representation in Denmark (left) and Austria (right).
Note: N DK = 1875–1950, N A = 447–503. For each group-party combination and conditional on parties’ perceived representation of the group, markers show the difference in support for the party between those at the 25th and 75th percentiles on the group sympathy scale relative to the overall level of support for the party. Hollow markers show insignificant relationships. See coefficients in Tables A18 and A19.

There are, however, a couple of exceptions to this pattern: For Denmark, we observe significant negative relationships for the Conservatives in relation to the working class and for the Danish People’s Party, the Denmark Democrats, and New Right for Muslims. These four cases are the ones for which we observe the strongest negative scores (<−1) in Figure 4, and so the unconditional relationships are rather strong. Furthermore, only around one percent of respondents point to the parties as the best representatives of the groups, a view that goes directly against standard perceptions of these parties. For Austria, we see a similar pattern with comparable negative scores regarding the FPÖ and ÖVP for unemployed people, or even higher scores for the NEOS and pensioners, as well as for migrants and women for the FPÖ. We treat these results as outliers to the general pattern, potentially reflecting highly partisan respondents’ tendency to point to their own party as best at everything. We should note that the existence of such tendencies biases our estimates against finding support for the expectations, thereby making for a more conservative test of them.
Overall our analyses show that, as predicted, those who see a party as the best representative of a given group exhibit a more positive relationship between sympathy for the group and support for the party. The corollary related to the measurement of the group-party linkages notwithstanding, the analysis provides overall support also for the interaction hypothesis, thereby further bolstering our confidence in reference group theory.
Conclusion
Within the constraints of our observational design, the analyses have provided support for reference group theory as an important contribution to understanding vote choice in Western democracies. Across a wide range of groups, we find that voters’ group sympathies are strongly related to their electoral choices in the US, with many of these relationships persisting or even strengthening over the seven decades that we analyze. Moreover, we observe comparable relationships in Denmark and Austria, demonstrating the relevance of the theoretical mechanism also in multiparty systems with lower inequality, less polarization, and weaker partisan identification.
Likewise, the breadth of groups for which we find relationships – spanning racial, ethnic, religious, economic categories as well as groups defined by sexual orientation – suggests a wide scope for the theory. In this light, we would expect to find the mechanisms at play throughout Western, potentially also non-Western, democracies – for groups with socio-political importance. It is noteworthy that our results both corroborate extant work about the cleavage structures of contemporary democracies and add the important nuance that economic groups retain substantial importance in all three countries. This suggests that the class conflict may not be as dead as some have argued.
The support found for the interaction hypothesis, moreover, provides confidence in the veracity of one of the core mechanisms of reference group theory – that the relationship between group sympathy and vote choice is conditioned by voters’ perceptions of the group-party relationship – thereby bolstering confidence in the general theory. Finally, as an illustration of the strength of the relationships, we compare the relationship with vote choice between group memberships and group sympathies for 23 combinations of groups and parties in the Appendix (see Figure A4). We find that the strength of group sympathies in predicting vote choice matches (and sometimes exceeds) that of group membership, even when holding voters’ objective and subjective group memberships constant. Overall we see our results as providing convincing, observational evidence that voters’ sympathies for social groups should – in accordance with reference group theory and alongside objective group memberships and social identities – be integrated into the study of vote choice to provide a full account of the electoral relevance of social groups.
Naturally, our results come with certain caveats. First, the test of the interaction hypothesis in Austria provided somewhat inconclusive evidence, most likely due to the small sample resulting in an underpowered test of the rather demanding analytical model. As noted, we are not overly worried by this result, but it would be relevant to explore whether results as clear as those for Denmark (and Blacks in the US) can be observed also in other countries. Second, while we observe many significant relationships between group sympathies and party support, we also observe some insignificant relationships. This highlights the need for further theoretical integration of reference group theory and cleavage theory to improve our understanding of when such relationships arise and when they do not. While our analysis draws on aspects of the cleavage framework, there is still substantial work to be done in this respect. In addition to newer formulations of cleavage theory itself (see, eg Bornschier, Haffert, Häusermann et al. Reference Bornschier, Haffert, Häusermann, Steenbergen and Zollinger2024), we would point to studies of parties’ appeals to different social groups as a promising line of research in this regard (eg Huber Reference Huber2022; Huber, Meyer and Wagner Reference Huber, Meyer and Wagner2024; Thau Reference Thau2019; Reference Thau2021; Reference Thau2024).
Finally, a pertinent question relates to the causal nature of the relationships. Given the observational nature of our design, we cannot claim that group sympathies causally affect vote choice. With our data, it is possible that the effect flows in the other direction, ie that voters’ sympathies for social groups are driven by their party choices (see the parallel argument regarding policy attitudes and group sympathies by Clifford et al. Reference Clifford, Simas and Suh2025). As we await experimental evidence on the matter (see Stubager Reference Stubager2025), we want to highlight four elements. First, Mason, Wronski and Kane (Reference Mason, Wronski and Kane2021) have provided more convincing evidence of an effect of group sympathies on the vote using US panel data, thereby clearly bolstering confidence in the mechanism. Second, our own test of the interaction hypothesis reveals support for this crucial conditional mechanism inherent to reference group theory, which serves to corroborate this observable implication of the theory. Third, for the relationships found to be driven by reverse causality, it would require high levels of party identification for in-party messages to have as strong an effect on group sympathies as our results imply. Since we have shown substantial relationships between group sympathies and vote choice in both the US, with its high level of (and polarization on) party identification, and Denmark and Austria, where partisanship is weaker, we are skeptical of this argument. Fourth, the results also hold up when controlling for ideology, thereby reducing another source of endogeneity. With this background, we place considerable confidence in the existence of a genuine causal reference group influence on vote choice, although we concede there may be some influence in the other direction.
Finally, we note that, as discussed, we have not been able to control equally well for social identities for all types of groups. However, the fact that we find strong results for economic groups in the US and Denmark, where we control for class identification in addition to objective class factors, suggests to us that this worry should not be overstated.
In anticipation of future research providing stronger causal evidence for the mechanisms, we want to end by highlighting how reference group theory opens new avenues for research into our understanding of the political relevance of social groups, not least smaller groups like some ethnic, sexual, or gender minorities that have only a few members but nevertheless attract intensive political attention. This attention and the concomitant political relevance cannot be understood on the basis of extant theories based on objective group memberships or social identities – the groups are simply so small that they shouldn’t matter politically according to these theories. Reference group theory, however, provides a theoretical basis for analyzing such instances by highlighting the importance of evaluations of both in- and out-groups. Likewise, our finding of substantial relationships for economic groups suggests a group component of the economic conflict overlooked by studies arguing for the pacification of this conflict. Thereby, the theory constitutes an important addition to our intellectual toolbox in a time where social groups and polarization between and over them is a prevalent feature of politics.
Supplementary material
To view supplementary material for this article, please visit https://doi.org/10.1017/S1475676526100760
Data availability statement
All data is available for direct access through the three countries’ election studies:
USA: https://electionstudies.org/data-center/;
Denmark: https://digidata.rigsarkivet.dk/aflevering/51035;
Austria: https://data.aussda.at/dataset.xhtml?persistentId=doi:10.11587/QDETRI.
Script files are available on the journal webpage.
Acknowledgements
A previous version of the paper was presented at the ECPR general conference in Cologne, 2024. We are grateful for the comments received on this occasion, as well as those from the anonymous reviewers. Rune Stubager thanks the Aarhus Institute of Advanced Studies, where he was a fellow while working on the paper, as well as the Carlsberg Foundation for generous support.
Funding statement
Work on the paper was supported by a grant from the Carlsberg Foundation (grant CF23-0813) to Rune Stubager.
Competing interests
The authors are not aware of any conflicting interests regarding the research contained in the paper.
Ethical standards
All analyses are conducted on publicly available data collected by the election studies in the respective countries. We refer to the original data collectors for the ethical considerations and procedures in connection with the respective studies (see information on the respective webpages listed above).


 Open access