
Introduction
The interaction of ownership and control of companies has absorbed the interests of many scholars including business historians, management and organizational theorists, economists, and legal scholars. Under the influence of the foundational work of Berle and Means nearly a century ago, it was long accepted that, from the late nineteenth century, ownership and control separated in many enterprises as part of the emergence of the modern corporation in the United States.Footnote 1 These firms were owned by a growing population of shareholders and operated by hierarchies of business-educated career managers. Different rates of growth of the corporation allegedly affected the performance of economies, epitomized by Chandler’s favorable comparison of the US with the UK.Footnote 2 The latter belatedly wallowed in owner-run family firms—personal capitalism—that lacked modern professional managers and broad share ownership until the middle years of the twentieth century.Footnote 3
However, it is now increasingly apparent that these conventional wisdoms are too simplistic or just incorrect. Shifting from owner-managed to “managerial” firms has not been a linear process. Diffuse ownership patterns among a growing body of shareholders in both the US and the UK date back to the mid-nineteenth or even eighteenth century, and, in some respects, this pattern unraveled in the late nineteenth to early twentieth century and again in more recent decades. In Brazil, Aldo Musacchio has shown that flourishing share ownership, at the end of the nineteenth century, reverted back to concentrated ownership by the interwar years.Footnote 4 Nor has the managerial firm been without drawbacks. Agency theory argues that the divorce of ownership from control can create conflicting interests between shareholders and managers.Footnote 5 This was especially significant for earlier historical phases of ownership dispersion where the legal and regulatory oversight of managerial authority had been in its early stages.Footnote 6
Research using large samples of companies has focused on the corporate Board as the principal locus of managerial control. Its results suggest that the UK, like the US, had experienced significant separation of ownership from control by the eve of World War I, confirming the intuitions of contemporary economist Alfred Marshall.Footnote 7 Several studies have also addressed how well key strategic managers, principally Chairmen and CEOs, handled the responsibilities cast upon them in terms of capabilities and honest behavior. Marshall had been disdainful of the new breed of managers in the UK, Foreman-Peck and Hannah have been more sympathetic, while Aldous et al measured the performance of Boards and concluded that the ownership–control nexus did not really matter.Footnote 8 German companies were more closely controlled by wealthy shareholders. Sybille Lehmann-Hasemeyer and Andreas Neumayer have argued that these firms were generally well governed and conclude, “arguably this was superior to the Anglo-Saxon model of more dispersed ownership with often badly informed and powerless investors.”Footnote 9
Management and legal theorists frequently distinguish between “outsider” and “insider” forms of corporate governance.Footnote 10 Outsider governance, typical of the UK and the US, is where effective control lies beyond the organization and is determined by external forces such as the share price and the market for corporate control (mergers and acquisitions). Insider governance regimes reflect controlling influences within the organization, including directors, founding families, creditors, and institutional investors. In the German case, bankers were strongly represented at company meetings.Footnote 11 The exercise of inside control is a complex question that requires reference to both capital ownership and voting systems. It takes into consideration the influence of board members, CEOs, and related parties such as family members, personal connections, and interlocking directorates.Footnote 12 The share of ownership that represents control is also debated and depends on factors such as the degree of fragmentation of the remaining stock of the company. Thus, minority control by the Board is still possible where shares are widely owned.
We address these questions of ownership and control for Australia in the 1930s. Australia was regarded as a late transitioner from an insider to an outsider corporate governance system following UK experience. A study of the 1950s found ownership and control had separated in many cases, although blockholders, that is holders of a large number of shares, have remained quite common.Footnote 13 Following the revisionist work on the UK, we provide a reassessment of Australian experience to see if ownership and control had also separated earlier in the century and what were the determinants of the pattern of ownership and control. As we explain below, this was a formative period for Australia, when the growth of share ownership expanded considerably but without a concomitant improvement in legal rights and business information to protect investors.
We follow approaches used by studies of other countries, mentioned above, in evaluating the ownership and control of large numbers of companies exercised by their Boards of Directors. Our sources enable us to add new methodological dimensions to the literature. We calculate a broader measure of Director ownership that includes shares controlled by directors through family ownership and related entities. Separately, we measure the ownership share of Chairmen and CEOs as a stricter measure of managerial control, and we take a closer look at the role of blockholders.
We deploy new data from a record of company shareholder lists that was published, we believe, only in 1938, from which we calculate the holdings of directors and other major shareholders. We find that board ownership was higher on average in Australia than in the US and the UK in the early twentieth century—especially when one takes into account shares controlled by directors through related entities—implying that Australia could be characterized as an insider system of corporate governance. Ownership was also more concentrated than in Australia in the 1950s.
Governance and Enterprise in Australia
We know little about ownership and control in Australian companies before the second half of the twentieth century. Many larger enterprises in colonial Australia were government-owned, such as the railways, or were branches of foreign multinationals such as Dalgety and the Union Bank of Australia. The domestic capital market was small and focused on mining companies, local banks, insurance companies, gas, urban railways, and several manufacturers including unlisted or rarely traded enterprises.Footnote 14 Most listed firms were relatively small with limited shareholder populations. Before World War I, “Separation of ownership from control was minimal. Firms bore family names and continued to draw their directors and managers from within the family circle.”Footnote 15 Colonial Sugar Refining Company and Broken Hill Proprietary Company were unusual in their scale and recourse to professional managers.Footnote 16
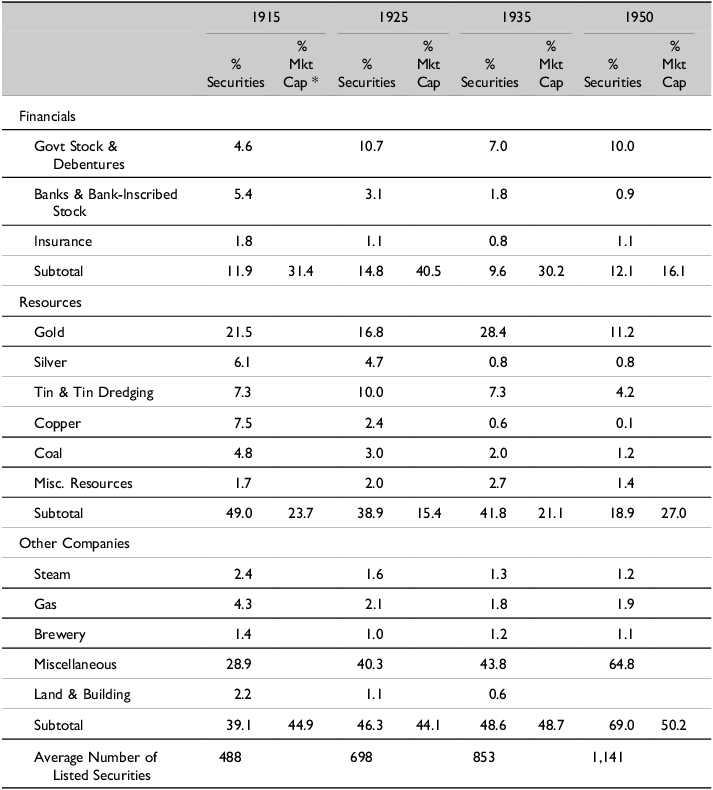
The interwar era was a watershed for the growth of stock markets and the corporate form in Australia as the nature and scale of enterprise began to change. Despite the interwar downturn, this was also an era of the growth of population, incomes, and consumerism with the expansion of new sectors.Footnote 17 The number of stocks listed on the two principal stock exchanges of Sydney and Melbourne doubled to 950, and their aggregate paid-up value tripled to £485 million.Footnote 18 The distribution of companies shifted with the relative contraction of finance and mining, and the expansion of manufacturing and trade (Table 1). Larger enterprises, some run by professional managers, began to emerge.Footnote 19
Sydney Stock Exchange: Distribution of Securities and Market Capitalization by Industry, 1915–1950

Source: Number and percent of securities from Grant Fleming, Zhangxin (Frank) Liu, David Merrett, and Simon Ville, “Media tone and trading activity on the Sydney Stock Exchange 1901–1950,” Financial History Review 31, no. 1 (2024): 42; market capitalization from Thomas Mathews, “A History of Australian Equities,” Reserve Bank of Australia Research Discussion Paper 04 (2019).
* Market capitalization for 1917 (first available year).
International funds, which had played a major role in the expansion of mining and banking in the colonial era, were disrupted by World War I and the growing caution of British investors after the collapse of many goldmining companies. There emerged a growing and diverse body of local investors, which included many women and other small shareholders.Footnote 20 Many investors may have been initially enticed by the success of the War and Peace Loans, but they increasingly invested in the widening range of financial instruments, including preference shares, that funded the growth of the new manufacturing and service industries. Companies saw a large increase in their shareholding population. Australian Gaslight Company, the dominant provider of gas in the Sydney area, had 1,599 investors in 1911, but 7,092 by 1931.Footnote 21 However, these firms were much smaller than many of their overseas counterparts; for example, the largest British companies each had over 40,000 shareholders and several American companies had over 100,000.Footnote 22
Several writers have identified the growing separation of ownership from control in the UK and US and the development of legal infrastructure, such as disclosure requirements and accounting standards, that would help to protect them from opportunistic behavior by large shareholders.Footnote 23 The protection of Australian shareholders was less advanced. It was not until 1925 that the Sydney Stock Exchange (SSX) required companies to provide an annual profit and loss account.Footnote 24 An audited balance sheet was only required of New South Wales companies in 1936.Footnote 25 The SSX listing rules contained some general safeguards for investors, including minimum size (normally £30,000 capital) and shareholder numbers (minimum 40) along with specific requirements in the articles of association and the prospectus.Footnote 26 However, unlike in the UK, there was no rule whereby a company could only be listed if two-thirds of its securities were subscribed by the public.Footnote 27 Therefore, companies could list with founders owning a substantial proportion, and there was a greater possibility that minority shareholders would be exploited by larger investors. Some advice was forthcoming from professional investment sources, such as underwriters, but their ranks were thin and their reputations often doubtful.Footnote 28
Investors could also look to the growing business media for information and advice, including Jobson’s Investment Digest (1920), the Wild Cat Monthly (1923), and Rydges Business Journal (1928). As we will see below, our data draws on a publication, listing the shareholders and directors of companies, the publisher of which expressed personal frustration at “insider dealing” by one such company. Therefore, the expansion in the population of Australian shareholders preceded the introduction of a range of modern measures designed to inform and protect them. It is important, thus, to investigate the extent to which interwar shareholders, many new to investing, were exposed to firms that were dominated by insider blockholders.
Cash flow and voting rights can differ in companies where graduated voting rights were adopted by firms to restrict the voting power of larger shareholders.Footnote 29 Companies listed on the SSX were encouraged to adopt a graduated voting scale to “give control of the company to the general body of shareholders,” although many companies did not comply with these provisions.Footnote 30 In our sample, we found Articles of Association for only five companies, of which four had graduated voting rules and one had one share one vote (OSOV). The four companies had a voting cap, limiting the largest shareholder to no more than 25 percent of the votes. Edward Wheelwright found in the 1950s that 42 percent of his companies established before 1939 had graduated voting rules, and 58 percent had OSOV rules.Footnote 31
While graduated voting rights normally favor separate ownership and control by strengthening the power of smaller owners, preference shares might have the opposite effect. Founding families listing their companies in the UK at the end of the nineteenth century often issued non-voting preference shares to help protect their control.Footnote 32 The SSX listing requirements stated that preference shares need not have voting rights, although Articles of Association could choose to do so.Footnote 33 It was often the case in Australia that preference shares held no voting rights except in situations where the board was proposing changes material to their position.Footnote 34 It was also rare for preference shareholders to have a representative on the board of directors and we found no instance of such in our sample. Fifty percent of our sample (forty-five companies) had preference shares as well as ordinary shares (Table 3). We ascertained the voting rights for ten companies with preference shares. In all but one case, they had no votes except under the conditions outlined above. Wheelwright found that only twelve out of fifty-six companies that had preference shares awarded them the same votes as ordinary shares.Footnote 35
Sample Representativeness
Source: SRA database as per text; Ville & Merrett, “Big Business in Australia.”
Descriptive Statistics
Source: SRA database.
No attempt has been made to measure the relationship between ownership and control of Australian firms in the first half of the twentieth century, in spite of the watershed nature of the interwar period. Wheelwright found lower levels of Director ownership in the 1950s. This might suggest the separation of ownership and control, but it was complicated by continued examples of blockholders.Footnote 36
So, a distinctive interwar picture emerges of Australian corporate governance of a rapidly expanding and diversifying corporate sector funded by a growing army of local shareholders. However, lacking the longer capital market traditions of Western Europe and North America, the regulation and disclosure requirements of companies and the sources of investment information, all designed to support shareholders, struggled to keep up with rapid change. In these circumstances, corporate governance was critical, particularly whether investors viewed a strong Board of Directors as a source of reassurance against large shareholders (blockholders) and external parties; or whether the Directors themselves, particularly the Chairman, were likely to exploit information asymmetries with shareholders to their own benefit. The Australian tradition of cooperation among corporate leaders—particularly through inter-firm collusion, family connections, and interlocking directorates—served to complicate matters.Footnote 37 Therefore, we seek to take account of these connections in estimating the ownership and control exercised by the Board.
Data and Methods
Our shareholder lists for ninety companies in 1938 come from The Share Register of Australia (SRA), a commercial publication owned by Archer Whitford, a Sydney businessman wishing to “bring daylight to dark places of the Australian financial world.” He sought to help investors understand who owns and controls Australian companies, especially, “the class of person who holds shares in your company … who the Directors are and the number of shares they hold and how long they have been Directors … [and] allow the small investor to know the movements of the big investor.”Footnote 38 It was intended that the SRA would record differences in shareholder lists and thus show investors who was selling and buying shares, including whether directors were trading.Footnote 39
Whitford’s staff collected shareholder information from company secretaries and registries in New South Wales. The lists contained the name, address (suburb or city), and number of ordinary and preference shares held.Footnote 40 They also provided a summary of each company that included a description of the business; equity capitalization (nominal and paid-up capital); the names of directors and number of ordinary shares held in their name; company financial information such as net profit, dividends yield, reserves; and summary statistics on shareholdings (total number of shareholders, average shareholding).
It is unclear how long the SRA existed, and a search of Australia’s newspapers via TROVE finds no mention of the publication after 1938.Footnote 41 Like many contemporary initiatives, it may have fallen victim to the drift toward wartime. The publication occurred weekly between January 5 and March 16, 1938, (with a few exceptions), then monthly for April and May. While its longevity is uncertain, it attracted attention from major financial institutions and institutional shareholders; the SRA customer list included banks (Commonwealth Bank of Australia, Rural Bank), institutional investors such as life insurers (National Mutual Life Association, A.M.P. Society), insurance companies (Prudential Insurance, Bankers and Traders Insurance), trustees (Union Trustee Company), stockbrokers (J. B. Were & Co, E. L. Baillieu & Co), the state stock exchanges of Australia, and the media (The Daily Telegraph, Truth Newspaper, The Advertiser).Footnote 42
The National Library of Australia holds ten issues from January 5 to May 1, 1938. The SRA contents index for May 1 listed 115 companies but since there are missing issues, we have complete shareholder lists for ninety companies, including company financial information for financial years ending 1934–37. We cross-checked all company financial information with two leading contemporary financial publications (Jobson’s Investment Digest and Australasian Insurance and Banking Record) and found no inconsistencies in the data. Since the first entries in the SRA were published on January 5, 1938, we have assumed that all shareholder lists are accurate as of December 31, 1937, as most companies only updated their shareholder lists with the company offices annually.
We can compare the SRA sample with the population of listed companies on the SSX. The aggregate market capitalization of the ninety SRA companies (£56,810,762) constituted 10.1 percent of the SSX in 1937 (£560,188,484).Footnote 43 Since there were very few finance or resource companies in the SRA sample, its net share of SSX market capitalization, ex-mining and finance, rises to 19.2 percent.Footnote 44 Similarly, comparing the number of companies in the SRA with the SSX produces a share of 24 percent. These figures compare with a sample share of c. 25 percent of listed companies in a UK study of 1,700 of the largest firms (Aldous et al 2023, p. 137). These UK firms, though, were larger than those found in SRA and with significantly more shareholders (1,685 versus 757).
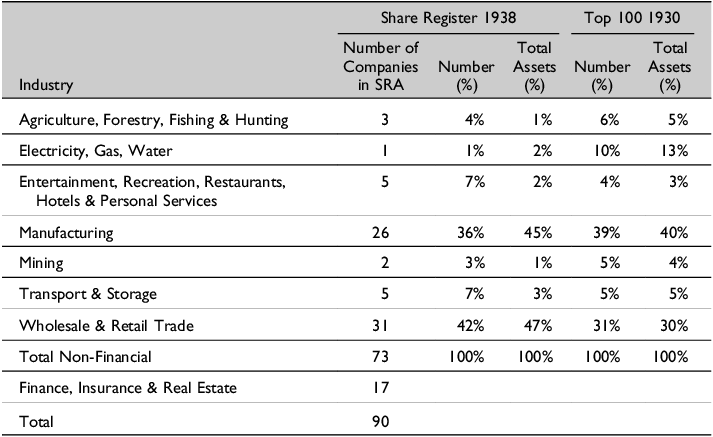
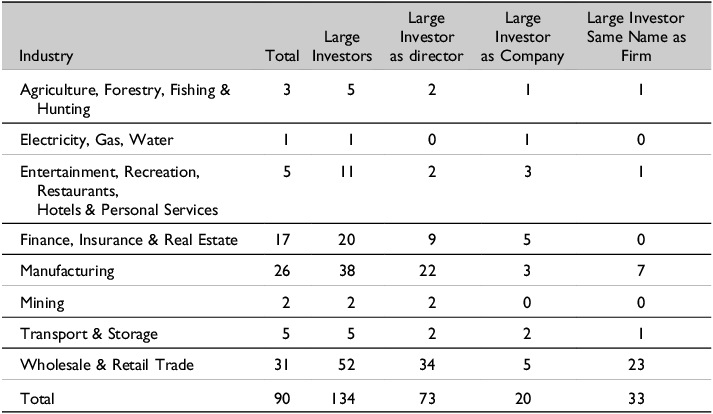
There is no indication how the SRA identified which companies to include, although it would “not give one word of advice regarding the buying or selling of shares” and in “making application to 143 secretaries we met with only five direct refusals, and there was mostly a reason at the back of them.”Footnote 45 We have assessed the representativeness of the SRA sample against the industry distribution of the top hundred non-financial companies by total assets for 1930, which is a benchmark year in a study of the growth of large-scale enterprise in Australia (Table 2).Footnote 46
The SRA provides details of seventy-three non-financial companies across a breadth of sectors, with wholesale and retail trade and manufacturing being the largest groups by industry as it was for the top hundred. The SRA has fewer electricity, gas, and water companies than the top hundred and slightly more wholesale and retail trade. The average total assets for the SRA non-financial companies is £667,788, compared with £2,748,511 for the top hundred.Footnote 47 Therefore, the SRA sample represents director ownership and shareholder bases for, on average, smaller-sized companies than in the top hundred as well as a greater variety of sizes as we will see below.Footnote 48
The SRA includes seventeen financial, insurance, and real estate companies, which were typically smaller real estate investment, personal credit, trustee, and insurance companies. One company (United Insurance) is on the list of the twenty-five largest financial companies in 1930.Footnote 49 Therefore, the sample is not representative of director ownership and shareholders of Australia’s trading banks (such as the Bank of New South Wales, Bank of Australasia). We also note that given the SRA started with companies registered in New South Wales, there are likely fewer Victorian registered companies. This probably did not present a problem, as the major Australian companies tended to be listed on both major exchanges, making the SRA useful for investors in all states.
A generation later in 1957, Wheelwright conducted a similar exercise looking at the ownership and control of Australian companies. He selected 102 larger companies, including banking, from data extracted from annual reports and miscellaneous documents for 1952–55. Below we will draw comparisons with his results.
We calculated director shareholding by the total number of shares held by the director in their name, jointly with other shareholders, by family members, and through holding companies. We believe this definition better captures director control than focusing on shares held by directors in their own name (either individually or jointly).Footnote 50 We collected the shareholding for each director from the SRA shareholder lists, cross-checking our total for each director against the SRA company summary. Then we added shareholdings held jointly with at least one other person. Next, we reviewed shareholder lists for companies that had the same surname as a director, defining these as holding companies, and counted those shares under the director’s control. Finally, we added shares held separately by a family member (same surname and address) where a connection could be found, based on the assumption that a director may have control over the way those shares were voted. For example, Sir Mark Sheldon (Chairman of Anthony Hordern & Sons) may have influenced how Lady Sheldon and other family members voted. It is possible that this approach resulted in false negatives, missing family connections that were not obvious, but we prefer to be conservative in estimating family connections.Footnote 51
We collected information on 417 director entries for 375 unique directors. Five directors held three or more directorships. There were thirty-one directors out of the 417 director positions where family and holding company shares added to their individual shareholdings (thus, 7.4 percent of director positions). The biggest increase in measuring director shareholdings came from including holding company shares. In seven of ninety companies, these shares greatly improved our understanding of ownership and control. For these seven companies, the chairman (for example) held on average 2.9 percent of shares individually or jointly with others. However, on average they held another 26.5 percent via a holding company, providing them with effective control. For example, David Robertson, the Chairman of Life Savers (confectionery) held 12.2 percent of shares individually and jointly with others, but a further 16.5 percent through another company he owned.
A family firm is identified if the board of the company has at least one director that is the founder, family member/s or heir of the founder/s. In other words, a family firm has at least one family member formally participating in the firm’s governance practices, which is similar to that used by Aldous et al. (2023 p.139) of a family firm as one that has a director who shares the same name as the firm. We also deployed a series of measures to look for controlling influences, or blockholders, that may have existed beyond the Board. These included the largest five shareholders and any shareholders who held 10 percent or more of a firm’s capital.Footnote 52 The concentration of shareholding of the top five shareholders is measured using a modified Herfindahl-Hirschmann index (HHI), calculated as the HHI for the top five shareholders divided by the square of the total shareholding held by the top five shareholders.
We also selected two variables to measure managerial control in the form of chairman shareholding and managing director shareholding. The chairman is a critical figure who provides direction to the firm and enhances its value by encouraging alignment between executive management and shareholder interests. The chairman counsels senior management in the formulation of strategy, in responding to competitive threats, and through communication skills that may assist in managing stakeholders and providing access to external resources through professional networks.Footnote 53 Adams et al. identify the first half of the twentieth century as one of transition in the UK from chairmen-led businesses to managing directors taking greater leadership roles. They note that in the 1920s and 1930s, the managing director rose to prominence and there emerged the dual chairman/managing director role as companies experimented “with the locus of power and nature of leadership roles.”Footnote 54 We know very little about the history of the role of chairmen and managing directors in Australian companies.
The chairman of each company is provided in the SRA, but rarely the managing director. We were able to identify sixty-one managing directors from Jobson’s Investment Digest and other sources, such as company histories. We then cross-checked this information against each shareholder list to identify the managing director and recorded their shareholding. If their name was known but not on the shareholder list, we assumed that they held no shares. We also collected the board size and specific members who held public roles—Knighthoods, Members of Parliament, and military officers—from the SRA and Jobson’s Investment Digest.Footnote 55 The number of shareholders is provided by the SRA. A full list of definitions can be found in Appendix Table A1.
Director Ownership
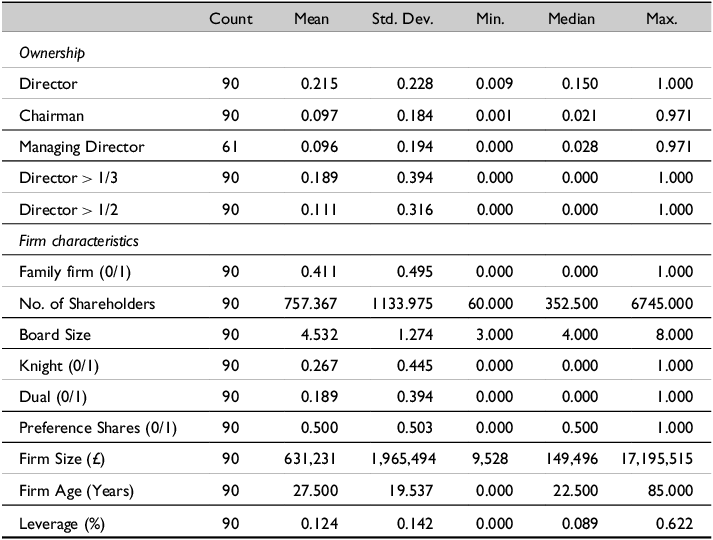
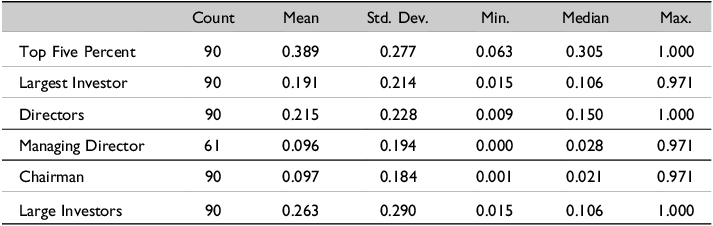
The descriptive statistics for the sample of ninety companies are provided in Table 3. There is a spread of companies by size and age, two factors often assessed with respect to ownership structure.Footnote 56 The largest company is Tooth & Co at £17,195,515 market capitalization and the smallest is Australian Investment & Discount Co Ltd at £9,528, with a median size for the sample of £149,496. The oldest firm is eighty-five years old, established in 1852, while the median company is 22.5 years old, which indicates that half the companies were established after 1900. Forty-one percent of our companies are family firms, higher than that reported for the UK (25 percent), most likely due to the fact that our sample has a smaller share of larger companies.Footnote 57 The median leverage ratio is relatively low at 8.9 percent (percentage of total assets).
Board size was a median four directors, while 26.7 percent of Boards included a Knight. These compared with six and 20 percent respectively in the UK in 1911 and Board size of eight in the US in 1935.Footnote 58 Only 9 percent of our companies had Members of Parliament on their Board and just 2 percent members of the military. Few companies had overseas operations or were subsidiaries of foreign multinationals that might have influenced director ownership or other corporate governance factors (such as board size or composition), in contrast to the UK share in 1911 of 32 percent.Footnote 59 All firms (except one) were listed on the SSX, although several also traded on the Melbourne Stock Exchange (MSX). Given the similarities in listing rules between the exchanges, we do not expect the location of the stock exchange to influence ownership structure.
There are different opinions in the finance and historical literatures as to what level of ownership begets control, ranging from 5 percent to 20 percent.Footnote 60 Directors of SRA companies owned a median 15 percent (average 21.5 percent) of ordinary shares, suggesting that ownership was not separated from control. Furthermore, in 18.9 percent of companies, directors’ shareholding was greater than one-third, and in 11.1 percent it was more than half of all shares.
These figures are significantly higher than in Wheelwright’s 1957 study, where directors owned a median 3 percent of ordinary shares (average 11.7 percent) individually and through holding companies.Footnote 61 Our 1937 director ownership is also higher than in Aldous et. al., which reported median and average director ownership of 8.9 percent and 17.2 percent respectively for Britain’s largest companies in 1911.Footnote 62 Foreman-Peck and Hannah’s calculations for 337 large UK companies in the same year (2.8, 10.1 percent), Florence for fifty-eight British manufacturing companies in 1936 (1.9, 8.5 percent), and Holderness et al. for large US companies in 1935 (6.5, 12.9 percent by market value of stock) also produced higher degrees of ownership-control separation.Footnote 63
A breakdown of the SRA sample by family and non-family firms and by size of company shows a more nuanced story. Director ownership for family firms averaged 36.1 percent compared with 11.4 percent for non-family firms.Footnote 64 Similarly, Aldous et. al. reported average family firm director ownership of 29.6 percent and 12.8 percent for non-family firms. The top 10 percent of companies (as measured by market capitalization) in the SRA sample had an average director ownership of 14.1 percent, but 4.8 percent if we focused solely on the largest non-family firms. So overall, the difference between our results and those of studies for the US and the UK is due partly to our sample covering a wider distribution by company size, not being restricted to the largest companies, and being in an economy where average company size was smaller. Comparing the median and average director ownership of the largest companies in our sample (6.2 percent and 14.1 percent) to the Wheelwright’s 102 largest Australian companies approximately fifteen years later (3.0 percent and 11.7 percent) indicates a gradual separation of ownership from control for those largest companies, perhaps accelerated by the rise in share ownership in Australia in the immediate post-war period. We will return to the question of the role of firm size in ownership structure in the following section.
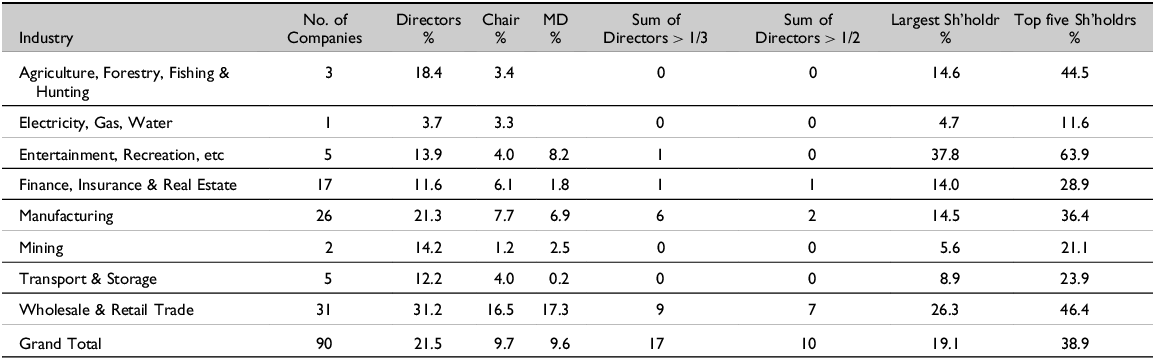
Ownership and control also varied by industry (Table 4), with director ownership being highest in wholesale and retail trade (31.2 percent) and manufacturing (21.3 percent) and lowest in utilities (3.7 percent), although the latter involves only a single company. The pattern is largely explained by the higher proportion of family firms in these industries and is generally consistent with the pattern of ownership variation by industry in the United States in 1935.Footnote 65
Director & Managerial Ownership by Industry (Average)
Notes: Entertainment, Recreation, etc. = Entertainment, Recreation, Restaurants, Hotels & Personal Services.
Source: SRA database.
Director > 1/3 and Director > 1/2 are calculated as the percentage of companies with director ownership greater than one-third and greater than one-half of all ordinary shares.
Managerial Ownership: Chairmen and Managing Directors
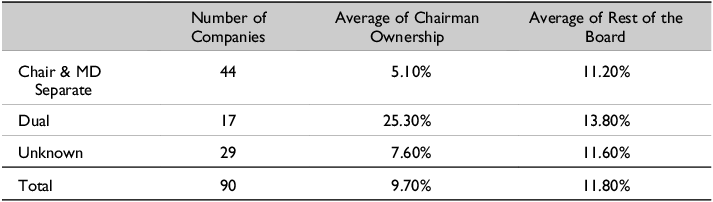
There were various structures of senior management, as defined by the chairman and managing director. We have information on the shareholding of managing directors for sixty-one companies and of chairmen for ninety. Three companies had joint managing directors, and in seventeen, the position of chairman and managing director was held by the same person, reflecting a concentration of decision-making power. While our sample size is small, the proportion of “CEO duality,” in modern parlance, at 27 percent is similar to Adams et. al.’s examination of UK corporate leaders, where approximately 20 percent of companies had a dual chairman and managing director.Footnote 66 In forty-three out of sixty-one companies (70.5 percent) the managing director was on the Board.
Managerial ownership, as measured by shares held by a chairman or managing director (MD), was relatively modest with a median of 2.1 percent and 2.8 percent respectively (average 9.7 percent and 9.6 percent respectively). The shareholding, however, differed significantly among the different “types” of managing directors. Dual chairman/managing directors held an average 25.3 percent, much higher than the 5.1 percent of shares for other managing directors who were board members only.
The share held by Chairmen and MDs differed from other Board members in several respects (Table 5). Average chairman ownership was 9.7 percent compared with the average of 11.8 percent for the remainder of the Board in aggregate. A much greater gap existed when we focus on the dual category where the chairman/MD owned almost twice as many shares as the rest of the Board. These powerful roles are especially associated with family firms. By contrast, chairman ownership averaged 5.1 percent in companies where the role of chairman and MD was separated, about one half of the ownership for the remaining board members.
A Comparison of Managerial and Board Control
Source: SRA database.
Blockholders and Other Insider Control Influences
While our focus has been on corporate control exercised within the Board, other possible sources of influence exist within a firm.Footnote 67 Not all large investors were Board members, which has led some scholars to estimate other measures of control or concentration by “insiders,” including the percentage of shares owned by the largest investors, often 10 percent, or the share of the leading five investors.Footnote 68 For Australian companies, median share of capital owned by the leading five investors was 30.5 percent, well in advance of the 15 percent for directors (Table 6). Significant variation existed in the top five share from 6.3 to 100 percent. There was also variation among industries with entertainment, recreation, restaurants, hotels, and personal services (57 percent) and agriculture, forestry, fishing, and hunting (38 percent) being the highest although both are small samples. Older firms had lower capital concentration by this measure. Some of these top five owners were part of the original founding family or members of an existing family firm but were not serving on the Board. In Morts Dock & Engineering, the Mort family included three of the top five shareholders but with no board seats; and in ETC Industries, three out of four Meyer family members were blockholders but with no board seat; CB Meyer was on the board but not as chairman.
Ownership Concentration: Summary Statistics

Note: We calculate “large investors” as the largest investor in each firm plus any other shareholders with 10 percent or more ownership.
Source: SRA database.
Australian Boards, as we saw above, were quite small and therefore another approach has been to focus on the largest shareholder plus any others who owned 10 percent or more of the company’s stock, who might be considered influential “blockholders.” In most cases, this was a single major shareholder—134 largest investors for ninety companies (or 1.5 large investors per company)—and on average (mean), large investors owned 26.3 percent of the firm’s capital, which was similar to the 21.5 percent of directors, reflecting the significant overlap between the two measures. However, there were still sixty-one (46 percent) of these largest investors who were not on the Board, of whom thirty-three shared a name with the company, typically a first- or second-generation founder.
Institutional blockholding was also evident. Twenty large shareholders were companies that owned equity in another company. In most instances, the company was a trustee company—Permanent Trustee or Perpetual Trustee—that held the shares in their name, not on behalf of any shareholder, and invested across a range of sectors including finance, shipping, manufacturing, utilities, and retail.Footnote 69 While these institutional investors may merit further examination, their activity was not on a scale with the financial capitalism experience of many American and German firms and less commonly had institutional blockholders on the Board.Footnote 70 However, overall there appears to have been a greater propensity for large owners to be actively involved in management than was the experience of nineteenth-century British firms (using the 10-percent-or-more definition) where 62 percent were not on the board and most were viewed as “wealthy gentlemen capitalists rather than entrepreneurs.”Footnote 71
Several researchers have described Australian corporate governance in the later twentieth century as a “blockholder” system, with at least half of listed companies having a controlling (majority or substantial minority) non-institutional shareholder.Footnote 72 Our interwar sample confirms that such a description aptly describes corporate governance prior to World War II. That Wheelwright alternatively found greater separation of ownership and control in the 1950s suggests Australia has long sat on the continuum between outsider and insider systems of corporate governance. How do we interpret what this meant for agency within the Australian firm? Our results also point to the diversity of influences on control including by directors, founders, other individual blockholders, and other investing companies. The extent to which they cooperated with one another in a self-serving manner or, alternatively, mutually monitored opportunism is more difficult to evaluate.
Characteristics of Ownership and Control Structures
A range of characteristics have been associated with the ownership structure of firms. These include size, the operating environment, industry structure, voting rights, company listing and in which stock market, trust, proximity to company head office, share denomination, Board size, and company age.Footnote 73 Therefore, we examine the covariates of director and managerial ownership and ownership concentration with those governance variables and firm demographics available to us and relevant to Australian companies. We regress the firm characteristics in Table 3 on the percentage of ordinary shares owned by directors, the chairman, and the managing director.Footnote 74 Since controlling influences could also be exercised by the largest investors, irrespective of whether they served in a governance or management position, we have added measurements of this to our set of dependent variables. Our model employs industry-fixed effects but, given the possibility of endogeneity between director and managerial ownership and firm characteristics, we first estimated our regressions on a univariate basis and in a version allowing for industry differences (the results were qualitatively similar and are not reported).Footnote 75
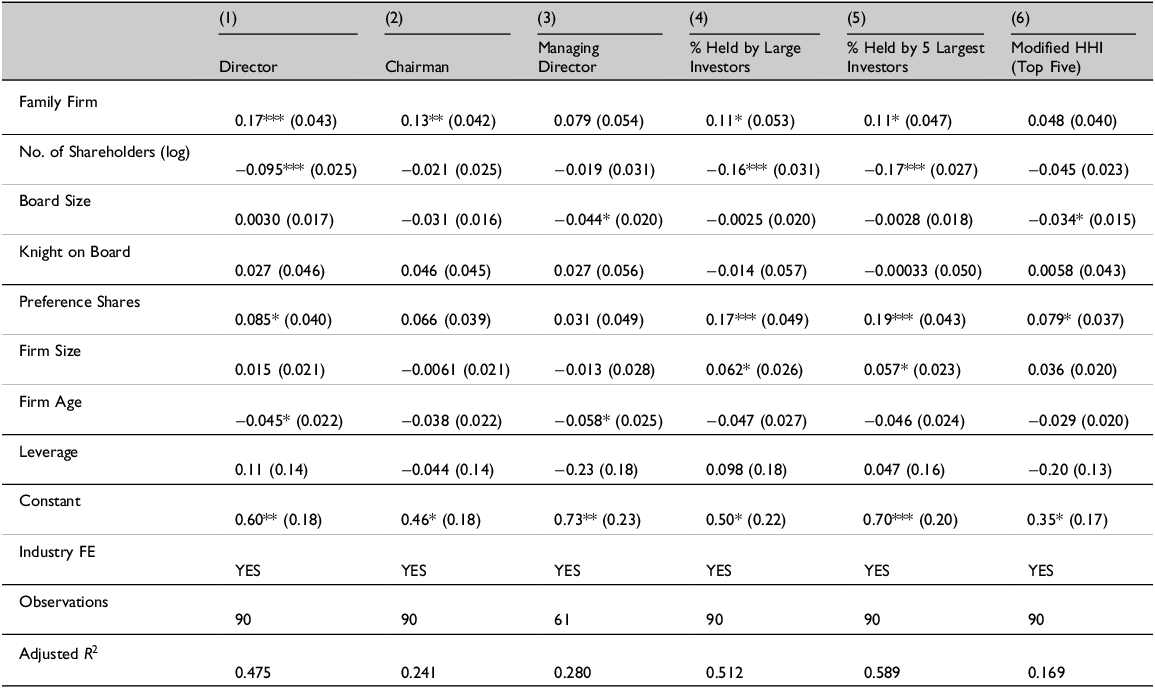
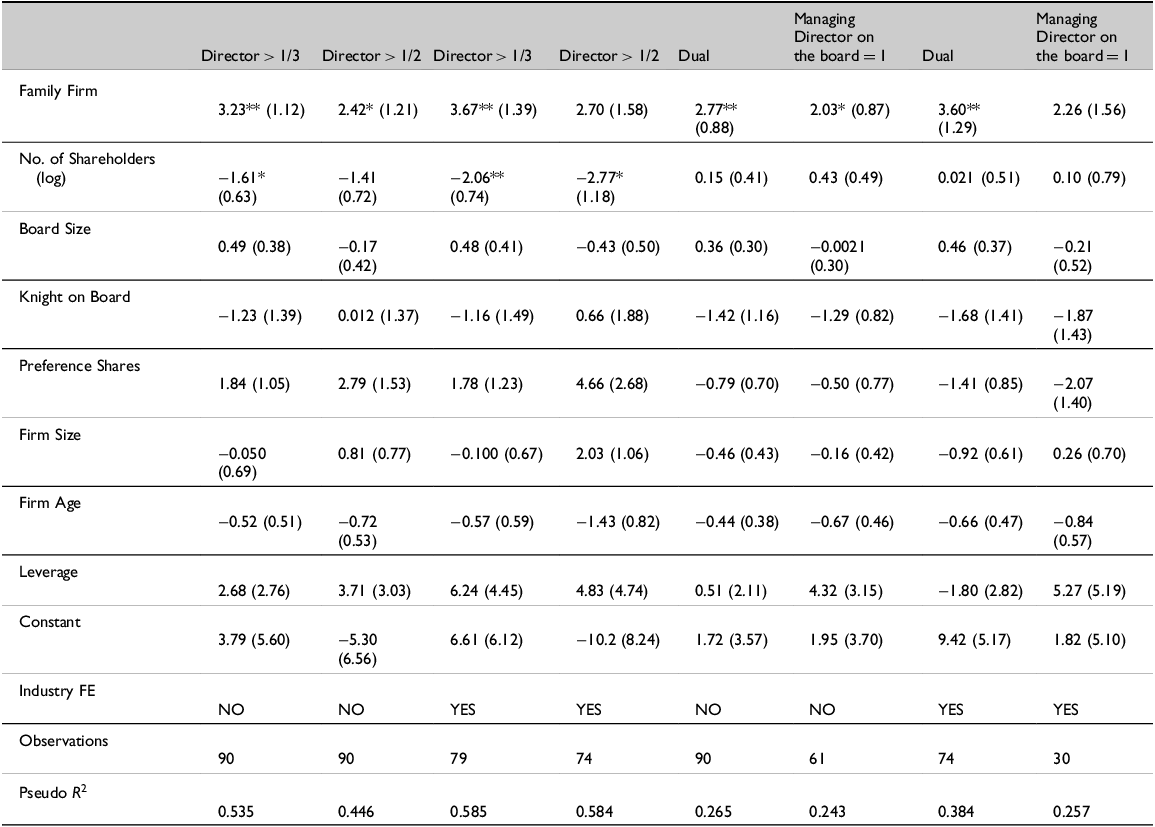
Our main result is that Director and Chairman ownership is higher in family firms compared with non-family firms, once we control for firm governance and financial characteristics, the existence of preference shares, and industry (Table 8). This is likely due to the higher concentration of board ownership and the existence of family blockholders. To check this, we estimated logistic regressions with dependent variables of director ownership with at least one-third and one-half of all ordinary shares (blockholders) (Appendix Table A2), and a dummy variable for family firms. These regressions show that family firms were more likely to have directors owning more than one-third of all shares (effective control), even after differences associated with industry (column 3). Family firms were also more likely to have a dual chairman/managing director (column 7). Family firm was also found to be the principal explanatory factor in levels of ownership of British firms in 1911.Footnote 76
Large Shareholders in Australian Companies
Source: SRA database.
Regressions for Share Ownership

Notes: Standard errors in parentheses. *P < 0.05, **P < 0.01, ***P < 0.001. All regressions estimated using ordinary least squares.
Source: SRA database.
We might expect larger firms to have a greater separation of ownership from control as they seek to raise capital from a greater pool of shareholders. This was a major finding in the original study of the US by Berle and Means, but it is not borne out in Australia (measured by market capitalization), which shows no significant negative coefficients and is consistent with the findings of other writers.Footnote 77 Indeed, there is a positive relationship between firm size and percent held by large investors and the top five shareholders, although not ownership concentration (modified HHI (top five)). Older firms have more dispersed share ownership, although the results are not consistent across all definitions of director ownership. There is a negative association between the number of shareholders and ownership concentration, with more shareholders related to more diverse ownership. Similar to Aldous et al., we think that this result is likely to be a mechanical relationship.Footnote 78
The voting rights of ordinary and preference shares are related to director ownership, consistent with the voting rights literature.Footnote 79 Director ownership covaries positively with the use of preference shares. This is also the case for the percent held by large shareholders and the top five shareholders, and our variable for ownership concentration. It is possible that firms with blockholder directors favored the issuance of non-voting preference shares as a means of financing growth opportunities while maintaining control. Aldous et al. find that voting preference shares were negatively associated with non-family firms, suggesting that one manner in which families maintained control was by issuing non-voting preference shares.Footnote 80
Board size and composition do not covary with director or managerial ownership. The small sizes of Boards in Australia may however point to the ability of directors to coordinate their behavior, build consensus, and thus exercise closer control over the firm, although this is difficult to measure.Footnote 81 The presence of a Knight on the board is not related to ownership, discounting the possibility that they provided reassurance to small investors about the bona fide nature of the company. However, larger boards covary negatively with managing director ownership and ownership concentration.
Discussion and Conclusions
Interwar corporate Australia can be characterized as an insider corporate governance structure where Australian Boards held sizable blocks of shares. This contrasts with studies of the separation of ownership from control for UK companies in 1911 and US companies in 1935. We also found significant blockholders who were not on the Board. Whether, on balance, control was diluted by graduated voting schemes or concentrated by non-voting preference shares we do not know for sure. Either way, ownership was more concentrated than Wheelwright found for Australia’s largest companies in the mid-1950s, and our results resonate with the extensive blockholders, though more institutional, that have characterized more recent corporate Australia.Footnote 82 We also measured the ownership of the CEOs and managing directors of these firms as a more focused definition of strategic management. Their shares were smaller, although that of dual CEOs, possibly a growing breed in this era worthy of further research, was more notable.
Several distinctive results emerged from trying to discern the drivers of these ownership and control patterns. Ownership varied significantly by whether the firm was owned and managed by the founder, their family, or heirs. Increased size related positively to control and preference shares were a device for maintaining control. Our research motivates several possible directions for future work. The inclusion of shares held by directors through holding companies added to our understanding of control for Australian family firms. Undertaking similar exercises for the UK and the US may provide grounds for reassessing their outsider governance regime moniker. Within Australia, further research is required on non-institutional blockholders—particularly on company Boards—since it is clear that they were a key feature of the governance regime. Analysing the impact of ownership and control patterns on the performance of these Australian companies would also be a valuable extension of our results.
Finally, Australia makes for an interesting study in the field of corporate governance. While it held (residual) colonial and common law associations with the UK, it has been much less of an outsider system of corporate governance than the latter. Why these similarities and differences coexisted is not easy to discern. The later development of capital market institutions and regulations in Australia may have motivated alternative responses through the greater role of directors and blockholders. Additionally, smaller company sizes in the evolving Australian economy after Federation and the tradition of cooperative behavior—partly in response to the continuing challenges of distance—may also have shaped the pattern of ownership and control among Australian firms in the 1930s.
Appendix
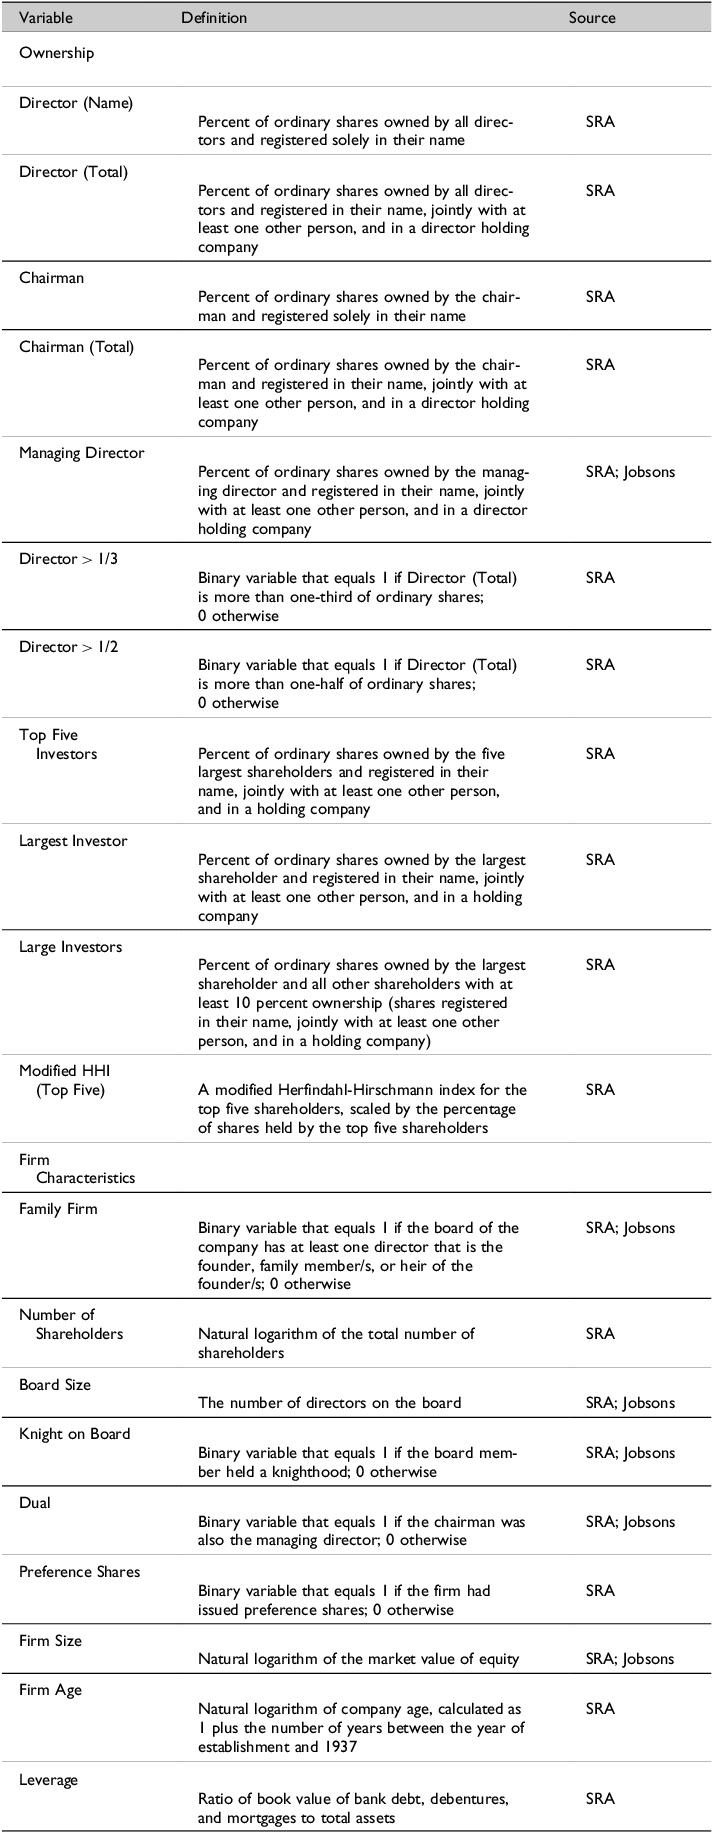
Variable Definitions

Notes: SRA = The Share Register of Australia; Jobsons = Jobson’s Investment Digest, various years. All variables relate to 1937 financial and share price information, unless otherwise stated.
Logit Regressions. Director Ownership & Family Firms

Note: Standard errors in parentheses *P < 0.05, **P < 0.01, ***P < 0.001
Source: SRA database
Author biography
Grant Fleming is a partner at Continuity Capital Partners, a private markets investment firm. Prior to co-founding the firm, he held investment positions at Wilshire Associates Inc. and academic positions at the Australian National University and the University of Auckland. His research interests include funds management, private equity, private credit and business history.
Zhangxin (Frank) Liu is Associate Professor of Finance at the University of Western Australia. He works in the areas of asset pricing, economic history, corporate governance, and fintech.
David Merrett is Emeritus Professor at the University of Melbourne. He has published extensively and over a long period in the fields of Australian economic, financial and business history, which includes a history of the ANZ Bank.
Simon Ville is Emeritus Professor of Economic and Business History at the University of Wollongong. He was elected a Fellow of the Academy of Social Sciences in Australia, was a member of the College of Experts at the Australian Research Council, and served as Whitlam-Fraser Professor of Australian Studies at Harvard University. He has written extensively on big business, foreign investment, innovation, the rural and resource industries, natural history trading, transport history, and the Vietnam War.


 Open access