


1. Introduction
The IUGS classification of igneous rocks defines carbonatites as being composed of >50 modal % primary (magmatic) carbonate and containing <20 wt % SiO2 (Le Maitre, Reference Le Maitre2002), although a rock containing 50 modal % carbonate can contain up to 20 wt % SiO2, depending on the mineralogy of the non-carbonate phases (Gittins et al. Reference Gittins, Harmer and Barker2005; Mitchell, Reference Mitchell2005). Carbonatites can be produced through: (1) partial melting of a metasomatized mantle source; (2) immiscible separation at high or low pressures from a carbonated silicate melt; and (3) crystal fractionation of a carbonated alkali silicate melt (Bell & Tilton, Reference Bell and Tilton2001; Tappe et al. Reference Tappe, Romer, Stracke, Steenfelt, Smart, Muehlenbachs and Torsvik2017; Nabyl et al. Reference Nabyl, Massuyeau, Gaillard, Tuduri, Iaocono-Marziano, Rogerie, Le Trong, Di Carlo, Melleton and Bailly2020). Regardless of their origin, the geochemical, textural and petrological features of carbonatites can be subject to a complex interplay of magmatic and hydrothermal processes that can make it difficult to relate the composition of carbonatites to their petrogenesis. In addition, carbonatites show large modal variations at a metre scale due to the low viscosity of the magmas that enhances mineral settling and results in complex differential movement of consanguineous crystals and melts (Gittins et al. Reference Gittins, Harmer and Barker2005).
These processes also complicate models of the economic geology of carbonatites, which are currently the major source of rare earth elements (REEs) (Chakhmouradian & Wall, Reference Chakhmouradian and Wall2012). There are three main processes by which REEs are enriched to economic levels within carbonatites: (1) primary magmatism; (2) sub-solidus hydrothermal; and (3) supergene enrichment. Some deposits (most notably Mountain Pass, California) are considered to largely derive their economic REE mineralization from igneous crystallization (Castor, Reference Castor2008; Mariano & Mariano, Reference Mariano and Mariano2012), whereas others (e.g. Wicheeda, Canada) appear to be dominated by REE enrichment during sub-solidus hydrothermal processes that result in remobilization and precipitation of a variety of REE minerals (e.g. fluorcarbonates, such as bastnäsite, parisite and synchysite) (e.g. Trofanenko et al. Reference Trofanenko, Williams-Jones, Simandl and Migdisov2016). In most cases, there is likely a continuum between magmatic and hydrothermal REE enrichment, with early magmatic phases being largely replaced by later hydrothermal mineralization (Anenburg et al. Reference Anenburg, Broom-Fendley and Chen2022). Supergene REE-rich ore deposits can also form by concentration of pre-existing carbonatite minerals during weathering (Andersen, Reference Andersen1987) and formation of secondary REE-rich minerals (Lottermoser, Reference Lottermoser1990).
Here, we present a preliminary study of the Twyfelskupje carbonatite complex (TCC), located in the Sperrgebiet, southern Namibia (Fig. 1), where it is associated with other carbonatites, including the Kieshöehe and Dicker Willem carbonatite complexes (Verwoerd, Reference Verwoerd1993). The young age of this group of carbonatites (49 ± 1 Ma; Reid et al. Reference Reid, Cooper, Rex and Harmes1990), arid conditions and sparse vegetation in the region results in extensive carbonatite exposures. Thus, the TCC provides an excellent opportunity to study the origin of carbonatites, together with their geochemical and structural evolution, and how these processes are related to the REE mineralization of the carbonatite. To this end, we present the results of a field study and geochemical analyses of whole rocks and minerals to develop initial hypotheses to describe these processes within the TCC and that may be tested by future, more detailed, studies.
Southern Namibia carbonatite localities.

2. Geological setting
The TCC intrudes the Namaqua metamorphic upper crustal basement. Detailed geological mapping outside the immediate area of the carbonatite is tightly regulated within the Sperrgebiet (‘restricted area’); hence, it is only possible to present an overview of the regional geological setting. In this area, the Namaqua Province comprises pre-tectonic migmatitic granulite-facies metasediments and metabasites of the Garub Group (Jackson, Reference Jackson1976), syn- to late-tectonic granitic gneisses (with subordinate aluminous metasediments, metapsammites, mafic granulite and calc-silicate) and post-tectonic leucogranites and pegmatites at 1004 ± 6 Ma (Diener et al. Reference Diener, White, Link, Dreyer and Moodley2013).
Following a period of comparative quiescence, a number of alkaline to highly alkaline intrusive bodies of Late Cretaceous to early Tertiary age were emplaced in southern Namibia (Miller, Reference Miller2008), including the TCC and spatially associated Dicker Willem, Keishöehe and Kaukasib carbonatite complexes (Fig. 1). The large Dicker Willem complex is interpreted as a high-level, sub-volcanic carbonatite (Cooper & Reid, Reference Cooper and Reid1991, Reference Cooper and Reid2000). It has a K–Ar mica and Rb–Sr mica-calcite isotopic age of 49 ± 1 Ma (Reid et al. Reference Reid, Cooper, Rex and Harmes1990), and the spatial relationship between the four carbonatites is taken to imply a common age (Verwoerd, Reference Verwoerd1993).
The closest alkaline complex to the TCC is the recently described Tsirub nephelinite intrusions, ∼20 km south of Dicker Willem and ∼35 km ENE of the TCC (Nakashole et al. Reference Nakashole, le Roex and Reid2020). The extent to which the carbonatites and alkaline complexes lie on a structural lineament (the NE-striking Luderitz lineament), possibly created during a period of Gondwanaland rifting and crustal extension, is uncertain (Reid et al. Reference Reid, Cooper, Rex and Harmes1990; Woolley, Reference Woolley2001; Alfonso et al. Reference Alfonso, Ben Masour, O’Reilly, Griffin, Salajeghegh, Foley, Begg, Selway, Macdonald, Januszczak, Fomin, Nyblade and Yang2022). Nevertheless, other anorogenic alkaline provinces aligned along ENE-striking zones in Namibia are suggested to be related to pre-existing crustal zones of weakness (Reid, Reference Reid1991; Smithies & Marsh, Reference Smithies and Marsh1996; Homrighausen et al. Reference Homrighausen, Hoernle, Geldmacher, Wartho, Hauf, Portnyagin, Werner, van den Bogaard and Garbe-Schönberg2018). It has been suggested that emplacement of carbonatites and kimberlites in southern Africa is related to melting of the sub-continental lithospheric mantle initiated by passage of the African plate over a mantle plume (Hartnady & le Roex, Reference Hartnady and le Roex1985). In this context, formation of the southern Namibian carbonatites appears to be related to the passage of the Vesma hot-spot track that first emerged in Late Jurassic/Early Cretaceous times beneath the East African rift, tracked SW, before passing beneath the TCC ∼40–50 Ma, and now lies beneath the South Atlantic (Alfonso et al. Reference Alfonso, Ben Masour, O’Reilly, Griffin, Salajeghegh, Foley, Begg, Selway, Macdonald, Januszczak, Fomin, Nyblade and Yang2022).
3. Local geology and structure
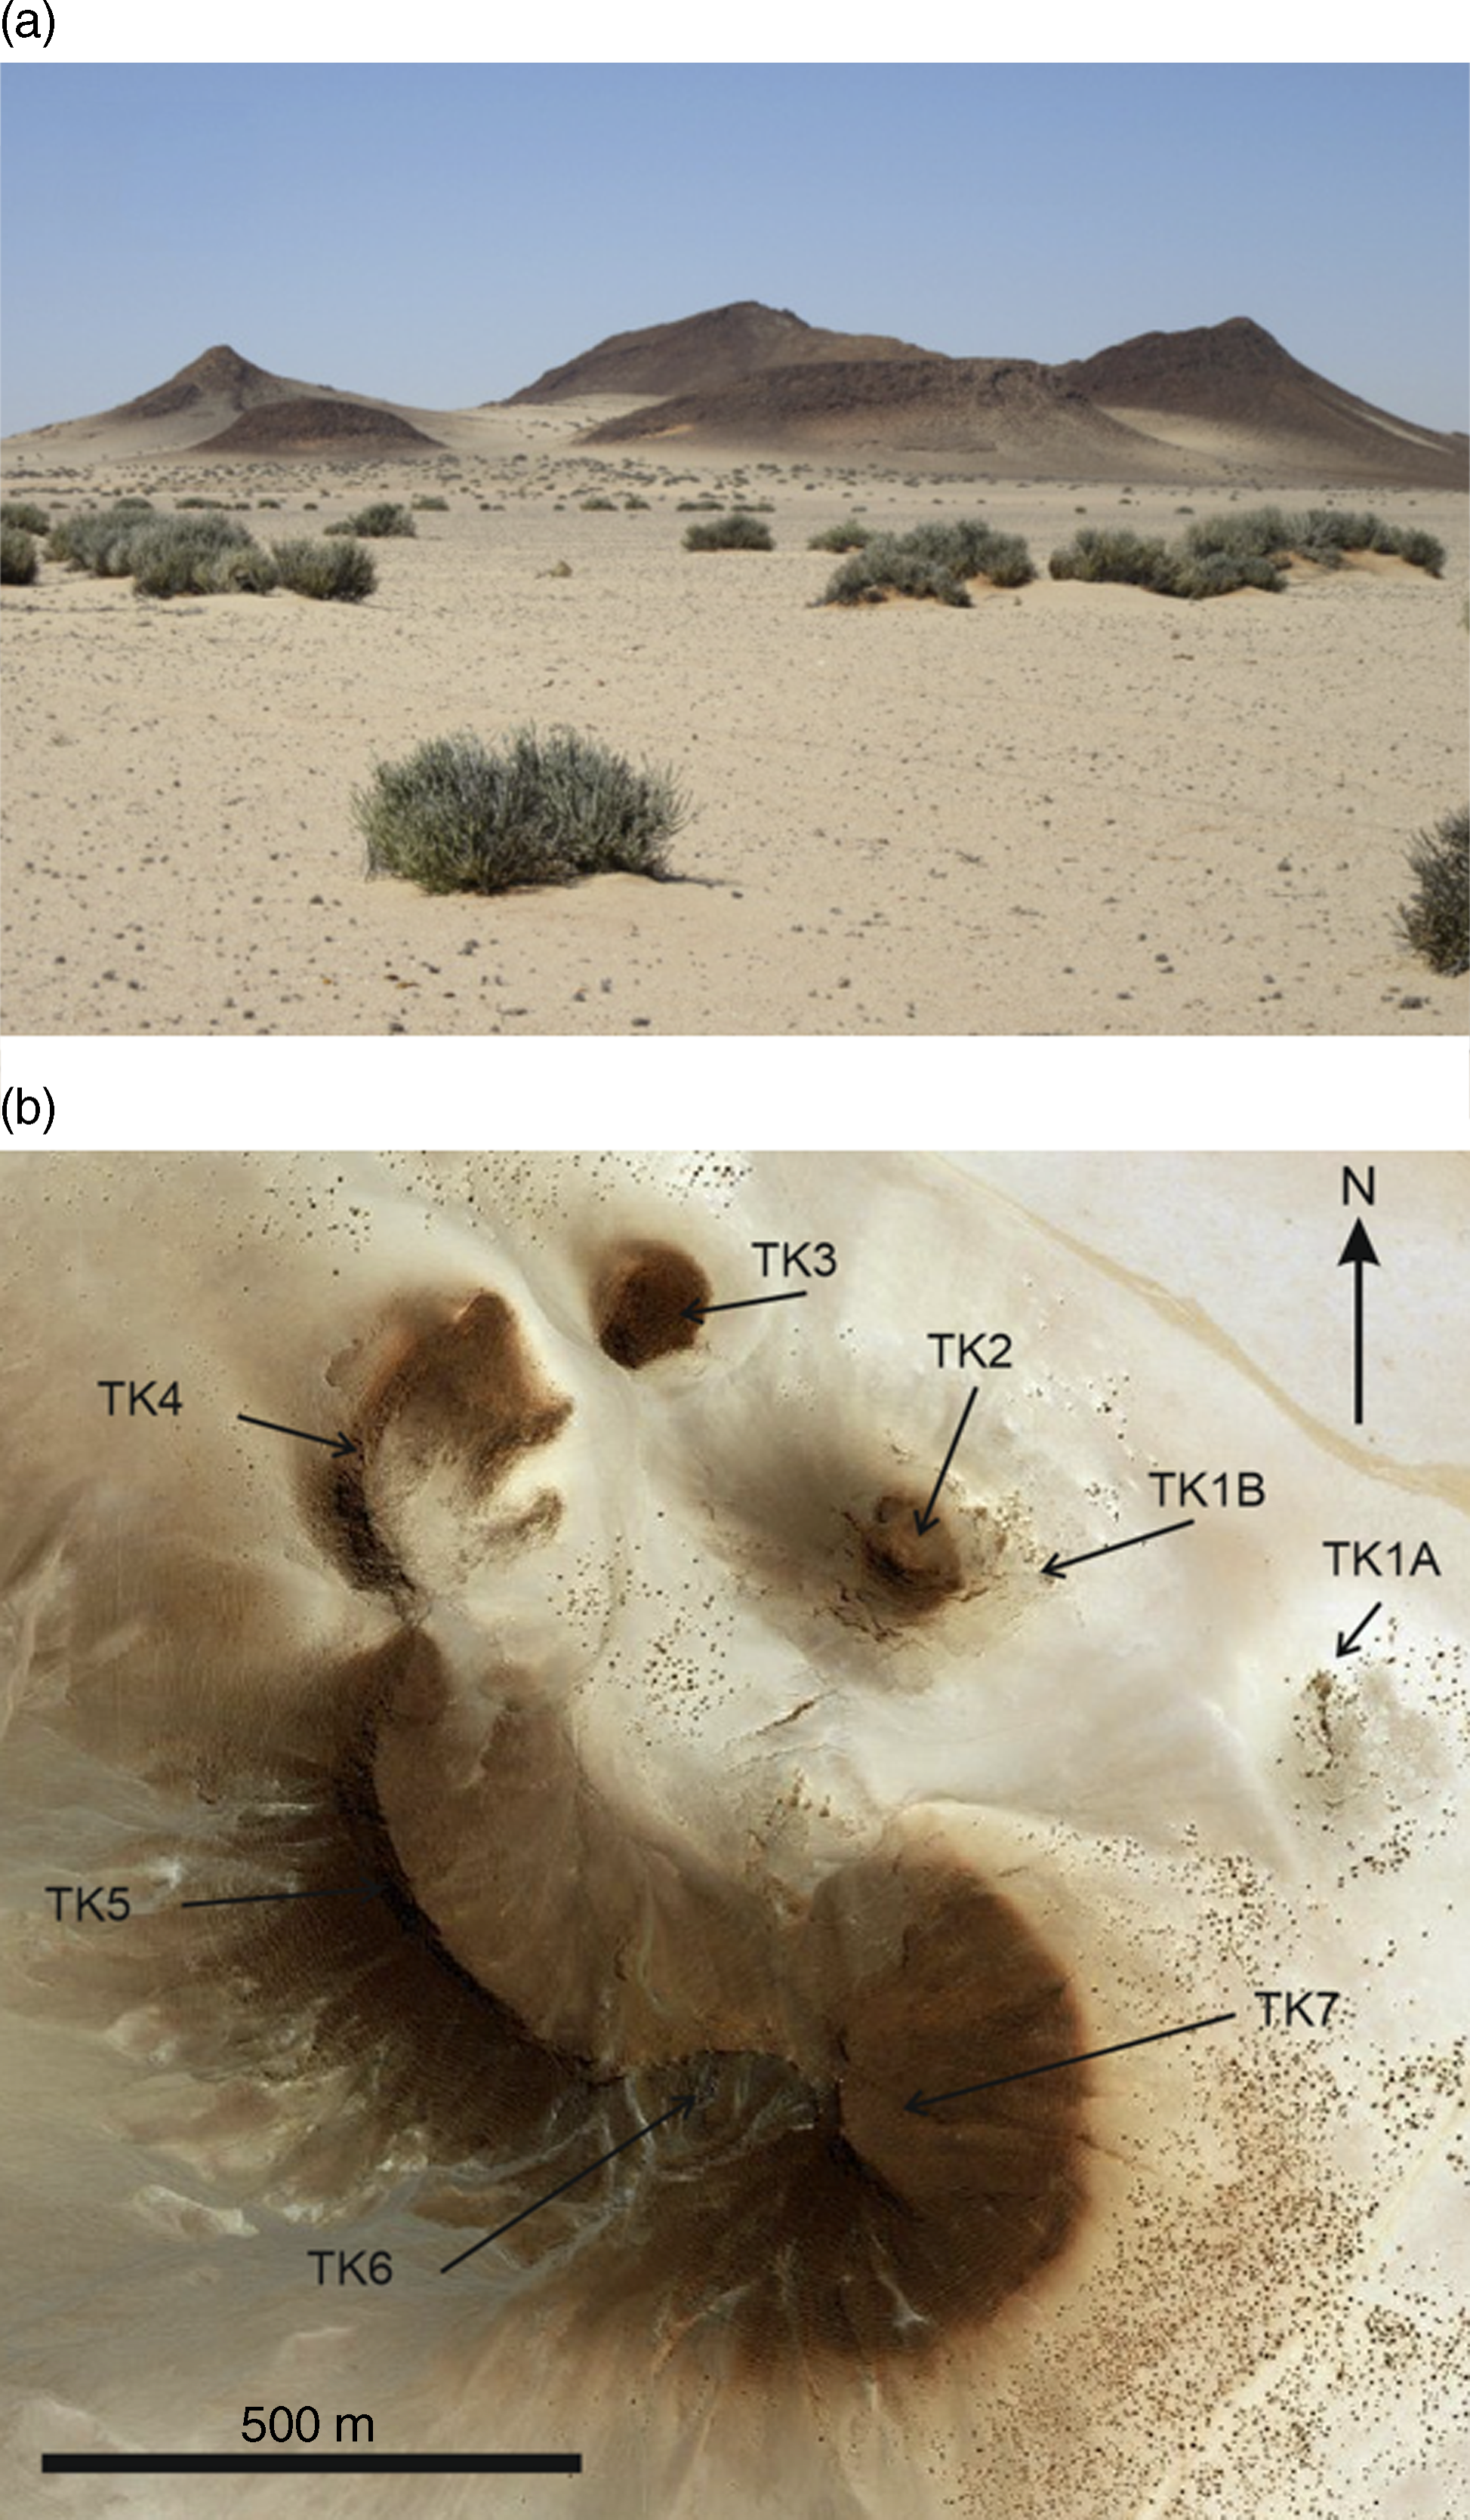
The exposed portions of the TCC stand ∼120 m above the surrounding sand and calcrete covered plains (Fig. 2a). The basement rocks of the Namaqua Metamorphic Province are exposed in gullies radiating from the carbonatite complex. The basement consists predominantly of strongly foliated, biotite-quartz-feldspar gneiss, with subordinate pegmatite, quartz schist, quartzite and amphibolite present throughout the wider area.
Twyfelskupje carbonatite complex (TCC). (a) The direction of view is approximately SSE. The outcrops extend to ∼120 m above the desert plain. (b) Aerial view of the TCC (scale bar is 500 m).
Dicker Willem contains small exposures (0.12 % by area) of ijolite, but no other occurrences of genetically linked silicate magmatic rocks (Cooper & Reid, Reference Cooper and Reid2000). However, the TCC (as well as Keishöehe and Kaukasib) is a member of the ∼20 % of carbonatite complexes worldwide (Woolley & Kjarsgaard, Reference Woolley and Kjarsgaard2008) that do not have any exposures of associated volcanic or plutonic alumino-silicate rocks within or surrounding the complex.
The TCC forms a tectonically undeformed circular group of hills with a diameter of ∼1 km. Eight areas of the complex that crop out are recognized and designated TK1A and B, and TK2 through to TK7 (Fig. 2b). The outcrops form a central zone (TK1A and B, and TK2) and a peripheral zone occupied by TK3 through to TK7.
The TCC geology is summarized in Figure 3. The central zone consists of two distinct structural units: (1) sub-vertically banded, pale coloured, linear (TK1A) and arcuate (TK1B) carbonatite plugs; and (2) sub-vertical to steeply dipping, commonly darker coloured, irregularly oriented, and sometimes intersecting, carbonatite dykes (TK2). The dykes form a stockwork surrounding the TK1B outcrop area. Structurally, the peripheral zone is represented by shallow-dipping, darker coloured, banded, carbonatite cone sheets (TK3–TK7). In the outlying areas of the TK2 dyke stockwork, several ∼1 m thick, vertical, SE-trending dykes cut the shallow-dipping TK6 cone sheet. The absence of cone sheet outcrops on the NE side of the central zone suggests the complex plunges to the NE, and that any cone sheets on this side of the complex may have been removed by erosion.
Simplified geological map of the Twyfelskupje carbonatite complex.

The sub-vertically banded, pale grey carbonatites form a linear plug at TK1A and an arcuate plug at TK1B, adjacent to the NE edge of TK2. The dyke stockwork extends for ∼450 m in an E–W direction, and ∼380 m N–S, with the density of the TK2 dykes within the stockwork increasing in the area of the elevated TK2 outcrop.
The peripheral zone occupied by the TK3 through to TK7 outcrops forms a third, distinct structural unit. Each outcrop area represents an individual cone sheet of varying thickness and orientation, which together form part of the overall peripheral cone sheet system. The structurally lower TK6 cone sheet has a thickness of a few metres, and forms an arched structure plunging ∼10° to the north. However, the base of the cone sheet undulates and locally displays dips of up to 30°. Units of Namaqua basement up to ∼1 m thick are intercalated between individual layers of the TK6 cone sheet, and increase in thickness towards the top of the cone sheet. The TK6 cone sheet is overlain by the TK5 cone sheet to the west and the TK7 cone sheet to the east. The TK5 sheet resembles an asymmetric synclinal structure and plunges ∼10° to the north. The western limb of the syncline is ∼30 m thick, while the eastern limb is only a few metres thick. The thinner eastern limb of the TK5 synclinal cone sheet overlies the western limb of the TK6 arch. The TK6 and TK5 cone sheets are separated by a unit of Namaqua basement a few metres thick. The TK5 cone sheet extends to outcrop TK4, and structural continuity of individual layers of carbonatite between the two cone sheets is seen in the lowest point of the ridge between them. Intercalations of Namaqua basement up to 2 m thick occur near the base of the TK5 cone sheet. The cone sheet exposed over TK3 is separated from, and appears slightly structurally higher than, the TK4 cone sheet. The footwall contacts of the TK3 and TK4 cone sheets have a shallow to sub-horizontal dip. Cone sheet TK7 is ∼30 m thick, dips ∼25° to the NE and forms the most prominent hill within the TCC. The TK7 cone sheet is also structurally higher than the TK6 cone sheet, and they are separated by a few metres of Namaqua basement. The TK5 and TK7 cone sheets may have been structurally continuous prior to denudation, which resulted in the structurally lower TK6 cone sheet being exposed over the N-plunging arch between TK5 and TK7. The TK3, TK4 and TK7 cone sheets dip in a radial direction and define a common apex plunging NE (Fig. 3). The dip of the banding within the carbonatites parallels the footwall contact, and progressively increases upwards through the cone sheets to peak at ∼35° near the hanging wall, implying that the cone sheets steepen and thin down-dip towards a central common apex. The carbonatite layers at the base of both the TK5 and TK7 cone sheets transgress to higher structural levels within the basement gneisses, with vertical transgressions of a few metres taking place over a lateral distance of <10 m.
The basement is not well exposed around the TCC; hence, it is difficult to assess the extent of alteration by fluids derived from the carbonatite. In addition, throughout southern Namibia the Namaqua basement underwent at least three phases of deformation under high-grade metamorphism prior to emplacement of the TCC (Jackson, Reference Jackson1976). Hence, it is also difficult to differentiate regional structural deformation from that associated with emplacement of the carbonatite. Basement rocks in direct contact with the carbonatite, especially in the footwall of the cone sheets, are brecciated and display drag folds and small faults and shears with <1 m displacements. Small apophyses of carbonatite extend from the footwall contact for a few tens of centimetres into the basement, where fenitization is marked by the presence of riebeckite (Fig. 4a).
Field photographs of the TCC (see text for details). (a) Basement contact at the base of the TK6 cone sheet, showing apophyses of carbonatite extending into the basement. Diameter of lens cap for scale is 6 cm. (b) Block of layered fluorcarbonate mineralization in carbonatite matrix in TK1A. (c) Intensely folded fluorcarbonate layers in TK1B. (d) Brittle and ductile deformation in fluorcarbonate layers in TK1A. Length of hammer for scale is 33 cm. (e) Euhedral fluorcarbonate grains (3–4 mm) and fine-grained magnetite in carbonatite matrix in TK1A. Horizontal field of view ∼2 cm. (f) Fine-scale banding in TK5 parallel to basement contact.

The geological (and other) features of the different outcrops are summarized in Table 1.
Characteristic features of TK structural components

3.a. Central zone pale grey carbonatites (TK1)
The carbonatites display variable textures including spotted, porphyritic, mottled, sheared, slumped and weakly to strongly, or finely to coarsely banded. The variable colours and textures of carbonatites reflect varying degrees of fractionation as well as differing styles and intensities of alteration (Verwoerd, Reference Verwoerd1993). The pale grey, sub-vertically banded carbonatites in the central zone consist of multiple phases of fine- and coarse-grained, well-banded, grey to pale brown carbonatite. Contacts between individual carbonatite units may be sharp, gradational or sheared. The scale of banding varies from a few millimetres to 1 m, and is defined by variations in the concentration of yellow REE fluorcarbonate minerals, or by alternations of calcic and slightly dolomitic carbonatite. The fluorcarbonate mineralization is well developed and locally composes up to 40 modal % of the carbonatite. Individual fluorcarbonate-rich layers can be traced for several tens of metres along strike, but more commonly form banded metre-sized blocks within a carbonatite matrix (Fig. 4b), which can be folded (Fig. 4c), and some fluorcarbonate-rich outcrops show both ductile and brittle deformation (Fig. 4d). There are also small areas of larger (3–4 mm) euhedral fluorcarbonate grains, together with finer-grained magnetite (partially altered to martite) (Fig. 4e).
3.b. Peripheral cone sheet carbonatites (TK3–TK7)
All the cone sheets commonly show centimetre-scale banding that parallels the lower footwall contact with the basement rocks and appears to be an emplacement fabric (Fig. 4f). Other than TK6, the cone sheets are composed of dark brown, typically banded, carbonatite. The TK6 cone sheet is composed of yellow ankerite carbonatite consisting of a fine-grained groundmass of calcite and ankerite, and typically contains abundant subhedral magnetite. The magnetite is partially altered to martite, and occurs as disseminations or well-developed rhythmic bands.
3.c. Central zone dyke stockwork carbonatites (TK2)
The central dyke stockwork in and around the TK2 area consists of one main, sub-vertical to steep NE-dipping dyke, surrounded by a stockwork of smaller, mainly sub-vertical, irregularly oriented and occasionally intersecting dykes intruding into Namaqua basement. The main dyke is weakly banded and consists mainly of massive dark grey carbonatite and subordinate massive dark brown carbonatite. This dyke thins to the SE, where it becomes sub-vertical. Prominent dykes in the southern part of TK2 are typically banded, dark grey to dark brown carbonatites, containing REE fluorcarbonates. The darker brown carbonatites contain inclusions of fine-grained, pale grey carbonatite. In the western part of the TK2 area, a darker brown carbonatite dyke passes gradually into a yellow ankerite carbonatite over a front a few metres wide.
3.d. Late-stage, yellow ankerite carbonatite and black Mn-rich carbonatite veining
Minor late-stage, yellow, magnetite-bearing, ankerite carbonatite veining and black, Mn-rich, siliceous, ferric carbonatite veining occurs locally throughout the TCC. The ankerite carbonatite veins are best developed within the dark brown carbonatite dykes of the central dyke stockwork, whereas the Mn-rich, siliceous carbonatite veins are best developed within the dark brown carbonates of the TK3 cone sheet. Minor, thin ankerite carbonatite veins also cut the grey calcio-carbonatites of the central zone. The yellow ankerite carbonatite veins are typically irregular, discordant, 1–10 cm thick, and commonly contain martite after magnetite. The ankerite carbonatite veins are similar in appearance to the yellow ankerite carbonatites of the TK6 cone sheet. The black Mn-rich veins and segregations are typically only a few millimetres to 30 cm in thickness, but locally constitute up to ∼10 vol. % of the rock. The veins are typically sub-parallel to the banding in the host brown carbonatites. The last stage of veining is marked by millimetre-scale quartz veins that cut the black Mn-rich veins and late-stage segregations.
4. Mineralogical methods and results
4.a. Optical and SEM microscopy
A Carl Zeiss LEO1450VP scanning electron microscope (SEM) (School of Ocean and Earth Science, University of Southampton) was used to capture high-resolution backscattered electron (BSE) images (Fig. 5). Elemental maps were also produced to assist mineral identification in advance of semi-quantitative microanalysis. Elemental analyses were calculated using oxygen stoichiometry, and all data normalized to 100 % to allow for easier comparison of the data. Elemental mapping and semi-quantitative microanalyses were undertaken using energy dispersive spectrometry (EDS), with an Oxford Instruments X-Act 10 mm2 area Silicon Drift Detector, coupled with Aztec Energy software. The SEM operated at 20 kV, with a focal length of 20 mm.
Backscattered electron images of TCC samples. (a) Fibro-radial aggregates of fluorcarbonate (from TK1). (b) Radiating rhythmic alternations of barite with calcite and Fe–Mn-oxide (from TK3). (c) Bladed aggregates of apatite intergrown with carbonate and Fe- and Fe–Mn-oxides (from TK2). (d) Monazite overgrowing and including apatite and carbonate (from TK2). (e) Colloform banded, concentric assemblages of fluorite and Mn-oxide (from TK3). (f) Celestine overgrowing barite and fluorcarbonate (from TK1).

Optical microscopy of the carbonatites reveals a fine-grained (50–200 μm) allotriomorphic-textured groundmass of calcite or dolomite grains overgrown by irregular-shaped aggregates of equally fine-grained yellow to brown REE fluorcarbonate, and Fe-oxide. The carbonate groundmass may pseudomorph earlier coarser-grained rhombic primary calcite (up to 1 mm grain size), or it may occur as very fine-grained recrystallized carbonate, intergrown with mainly iron oxides, barite and fluorcarbonates. The carbonate groundmass may also be replaced by rhythmically zoned and colloform banded intergrowths of fine-grained calcite and haematite, or calcite and barite, with the haematite displaying topotactic replacements along the calcite cleavage. Matrix-supported carbonatite micro-breccias containing rounded, milled quartz and perthite basement clasts, as well as carbonatite and carbonatite breccia, also occur as inclusions in the central zone calcio-carbonatites.
The fine-grained fluorcarbonate aggregates are composed of masses of acicular needles, which typically occur as plumose to fibro-radial aggregates that vary in size from a few micrometres to a few millimetres. Narrow sub-millimetre-scale veinlets containing quartz and carbonate cut the carbonate–haematite–fluorcarbonate mineral assemblage, whereas the strongly silica altered carbonatites contain quartz veins and segregations up to a few millimetres in size. The quartz occurs as coarse, strained grains, or crystalline grains rimmed by radial overgrowths of microcrystalline quartz.
Plumose to fibro-radial aggregates of fluorcarbonate minerals are most abundant in the central zone carbonatite (TK1) and are prominent in BSE images (Fig. 5a), with individual fluorcarbonate needles varying from <1 µm to a few micrometres wide, and 20 to 60 µm long. Typical plumose, fibro-radial aggregates of fluorcarbonate minerals are 50 to 300 µm in diameter, and individual needles may be curvilinear.
The carbonatites contain calcite, ankerite, REE fluorcarbonates, barite, apatite, monazite, fluorite, celestine, pyrochlore, magnetite and Fe–Mg silicates. The barite is present in the central zone and cone sheets, where the morphology varies from coarse grained (up to 1.5 mm) within the fine-grained carbonate groundmass, to finer-grained barite rimming the coarse-grained variety, or alternatively radiating rhythmic alternations with calcite and Fe–Mn-oxide (Fig. 5b). Barite also occurs as fine grains intimately associated with the fluorcarbonate segregations.
Apatite is most abundant in the central zone dyke stockwork (TK2), and where present it may constitute up to 10 modal % in the form of irregular-shaped masses, or as bladed aggregates up to 300 μm across, intergrown with carbonate (Fig. 5c). Monazite is also most abundant in TK2, where it typically occurs as irregular-shaped masses up to a few hundred micrometres across, which overgrow and include apatite and carbonate (Fig. 5d). The monazite also forms rims to the plumose aggregates of fluorcarbonate, or more rarely as 5–10 μm sub-rounded grains that overgrow the carbonate groundmass and the plumose fluorcarbonate aggregates. Fluorite forms early euhedral to anhedral grains up to 500 μm across in the carbonate groundmass, and is overgrown by barite and fluorcarbonate. Late-stage, colloform banded, concentric assemblages of fluorite and Mn-oxide (up to 200 μm) overgrow early fluorite (Fig. 5e) and are most prominent in the cone sheets (TK3 to TK7). Celestine occurs throughout the TCC as anhedral grains (up to 50 μm) which overgrow barite and fluorcarbonate (Fig. 5f).
Orthomagmatic constituents of the carbonatite include pyrochlore, various Fe–Mg silicates and magnetite. Pyrochlore is an accessory constituent, which occurs in the TK1A central zone calcio-carbonatite plug as interstitial, euhedral grains typically up to 20 μm (Fig. 5a). The presence of Fe–Mg silicate phases is typical of carbonatites and can account for >10 wt % SiO2 in magnesio-carbonatites elsewhere (Gittins et al. Reference Gittins, Harmer and Barker2005), but the silicates at the TCC are rare accessory constituents with a grain size typically <10 μm. Indeed, most of the bulk-rock silica within the carbonatites results from quartz veining and vug filling associated with late-stage hydrothermal silica alteration.
Magnetite forms euhedral to anhedral grains (typically 0.5 to 1 mm). Colloform and banded textures identified in BSE images result from variations in abundance of Fe and Mn, and reflect late-stage alteration of early (magmatic) magnetite. The magnetite may be rimmed by barite, or exist as alternations of barite and magnetite. The magnetite also contains Cr, Zn, Pb and Cu (with the latter having concentrations of up to 4 wt %), and most base metals reported in the bulk whole-rock geochemistry are sequestered within magnetite, martite and other Fe- and Mn-oxides.
Metasomatic alteration of the Namaqua basement associated with fenitization is mainly restricted within and adjacent to veins, and pervasive alteration is limited. Biotite-bearing quartz feldspar gneisses are altered to sodic syenite fenites.
5. Geochemical methodology
Continuous channel samples (∼10 cm deep, ∼5 cm wide) across the TCC normal to the banding provided a representative sample suite.
Samples were prepared at the ALS laboratory in Swakopmund by ALS method PREP-31 (crush sample until at least 70 % is less than 2 mm, then riffle split off 250 g, and finally pulverize the 250 g split until at least 85 % is less than 75 microns). REE and trace-element analysis of lithium-borate flux of the pulps was undertaken at the ALS laboratory in Vancouver by inductively coupled plasma mass spectrometry (ICP-MS), with a precision of ±5 % (ALS method ME-MS85). High REE concentrations (Ce >10 000 ppm, La >10 000 ppm, Nd >10 000 ppm, Pr >1000 ppm and Sm >1000 ppm) were reanalysed at higher dilution by ICP atomic emission spectrometry (ICP-AES; ALS method ME-OGREE). Major oxides were analysed by ICP-AES on the same fusion products (ALS method ME-ICP06).
Thirteen field duplicates were included in the 295 channel samples collected at the TCC, and 40 Certified Reference Material (CRM) samples, supplied by Ore Research & Exploration in Melbourne, were included in the submission (20 OREAS 22d blanks and 20 OREAS 463 REE standards). The OREAS 463 REE standard is a supergene carbonatite REE–Nb ore with a total rare earth oxide (REO) content of 2.08 % that is a matrix-matched reference material prepared and certified by Ore Research & Exploration (https://www.oreas.com/crm/oreas-463). The values obtained for the submitted standard agreed with the certified values of CeO2, La2O3, Nd2O3 and Pr6O11 (0.810 wt %, 5824 ppm, 4295 ppm and 1212 ppm, respectively) within analytical uncertainty.
Laser-ablation ICP-MS was used to determine REE and trace-element concentrations in REE-rich minerals and carbonates. The analyses were performed on 200 μm thick polished sections with a Thermo Scientific Element XR high-resolution ICP-MS attached to a New Wave Research 193 nm ArF laser ablation system with a standard ∼30 cm3 cell and 100 % He (mixed with Ar and N2 after the cell) at the University of Southampton. The instrument was calibrated with the NIST-610 glass standard. The BCR-2 and BHVO-1 standards were analysed at the start and end of the run, and the REE concentrations were consistently within 10 % of the certified values (Kent et al. Reference Kent, Jacobsen, Peate, Waight and Baker2004). The laser was focused to a 25 mm spot with a fluence of ∼5 J cm−2 and a 4 Hz repetition rate.
All radiogenic isotope analyses were also carried out at the University of Southampton. Sr isotopes were measured by thermal ionization mass spectrometry (TIMS), and Nd and Pb isotope ratios were measured by multi-collector ICP-MS using the methods of Ishizuka et al. (Reference Ishizuka, Taylor, Yuasa, Milton, Nesbitt, Uto and Sakamoto2007). 87Sr/86Sr data were normalized to 86Sr/88Sr of 0.1194. During the course of the study, Sr standard NIST SRM 987 was measured as 0.710247 ± 10. 143Nd/144Nd data were normalized to 146Nd/144Nd of 0.7219. Measurement of the La Jolla Nd standard gave a value of 0.511846 ± 5. Pb standard NBS 981 gave results of 16.9403 ± 27 for 206Pb/204Pb, 15.4973 ± 21 for 207Pb/204Pb and 36.7169 ± 66 for 208Pb/204Pb.
6. Results
6.a. Whole-rock major elements
Summaries of the whole-rock major-element, REE and trace-element data are presented in Tables 2–4, and the complete dataset (n = 295 samples) is available in online Supplementary Material Tables S1–S3. According to the classification scheme of Woolley & Kempe (Reference Woolley, Kempe and Bell1989), the carbonatite samples largely range in composition from calcio-carbonatites (i.e. sövites) to magnesio-carbonatites (i.e. beforsites), with <5 % falling in the ferro-carbonatite field (Fig. 6a).
Average major-element concentrations (wt %) of TCC outcrop areas
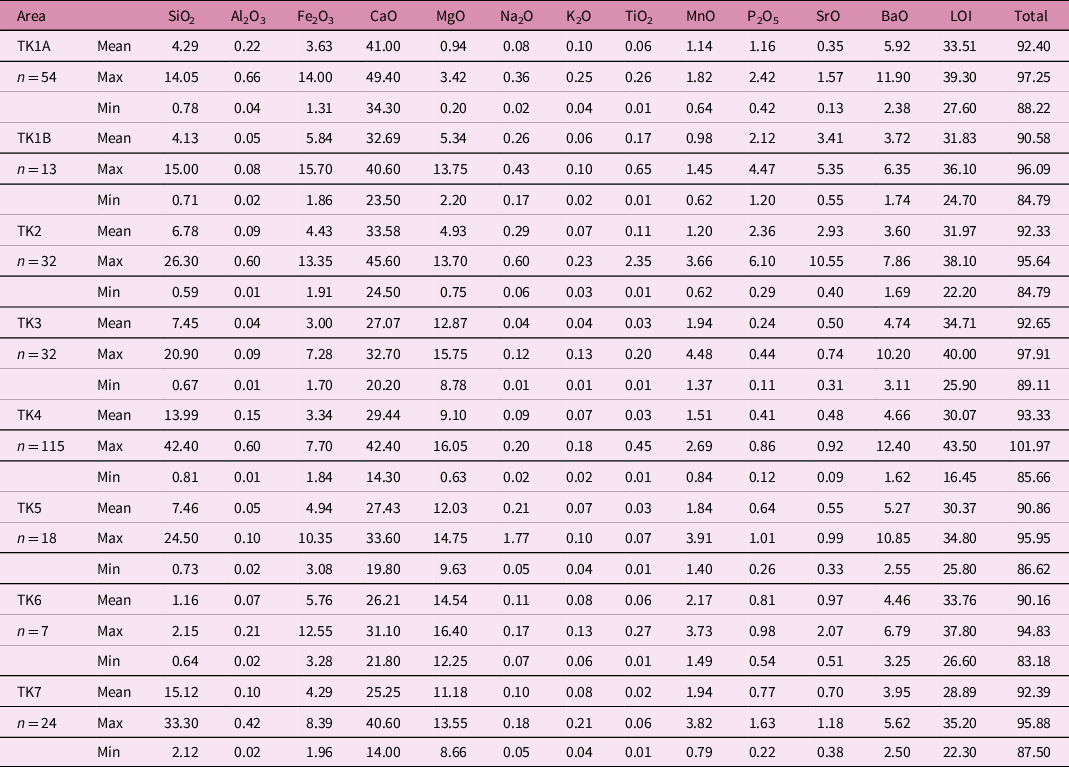
LOI – loss on ignition.
Rare earth element concentrations (ppm) of TCC outcrop areas

Trace-element concentrations (ppm) of TCC outcrop areas

Major-element ternary plots for the TCC. Symbols: TK1 – circles; TK2 – squares; TK3 and 5 – triangles; TK4 – +; TK6 and 7 – ×. The hydrothermal alteration trends are those expected for fluids consisting predominantly of Fe, Mn and Si. (a) Carbonatite classification diagram (Woolley & Kempe, Reference Woolley, Kempe and Bell1989). (b) MgO–CaO–SiO2 plot.
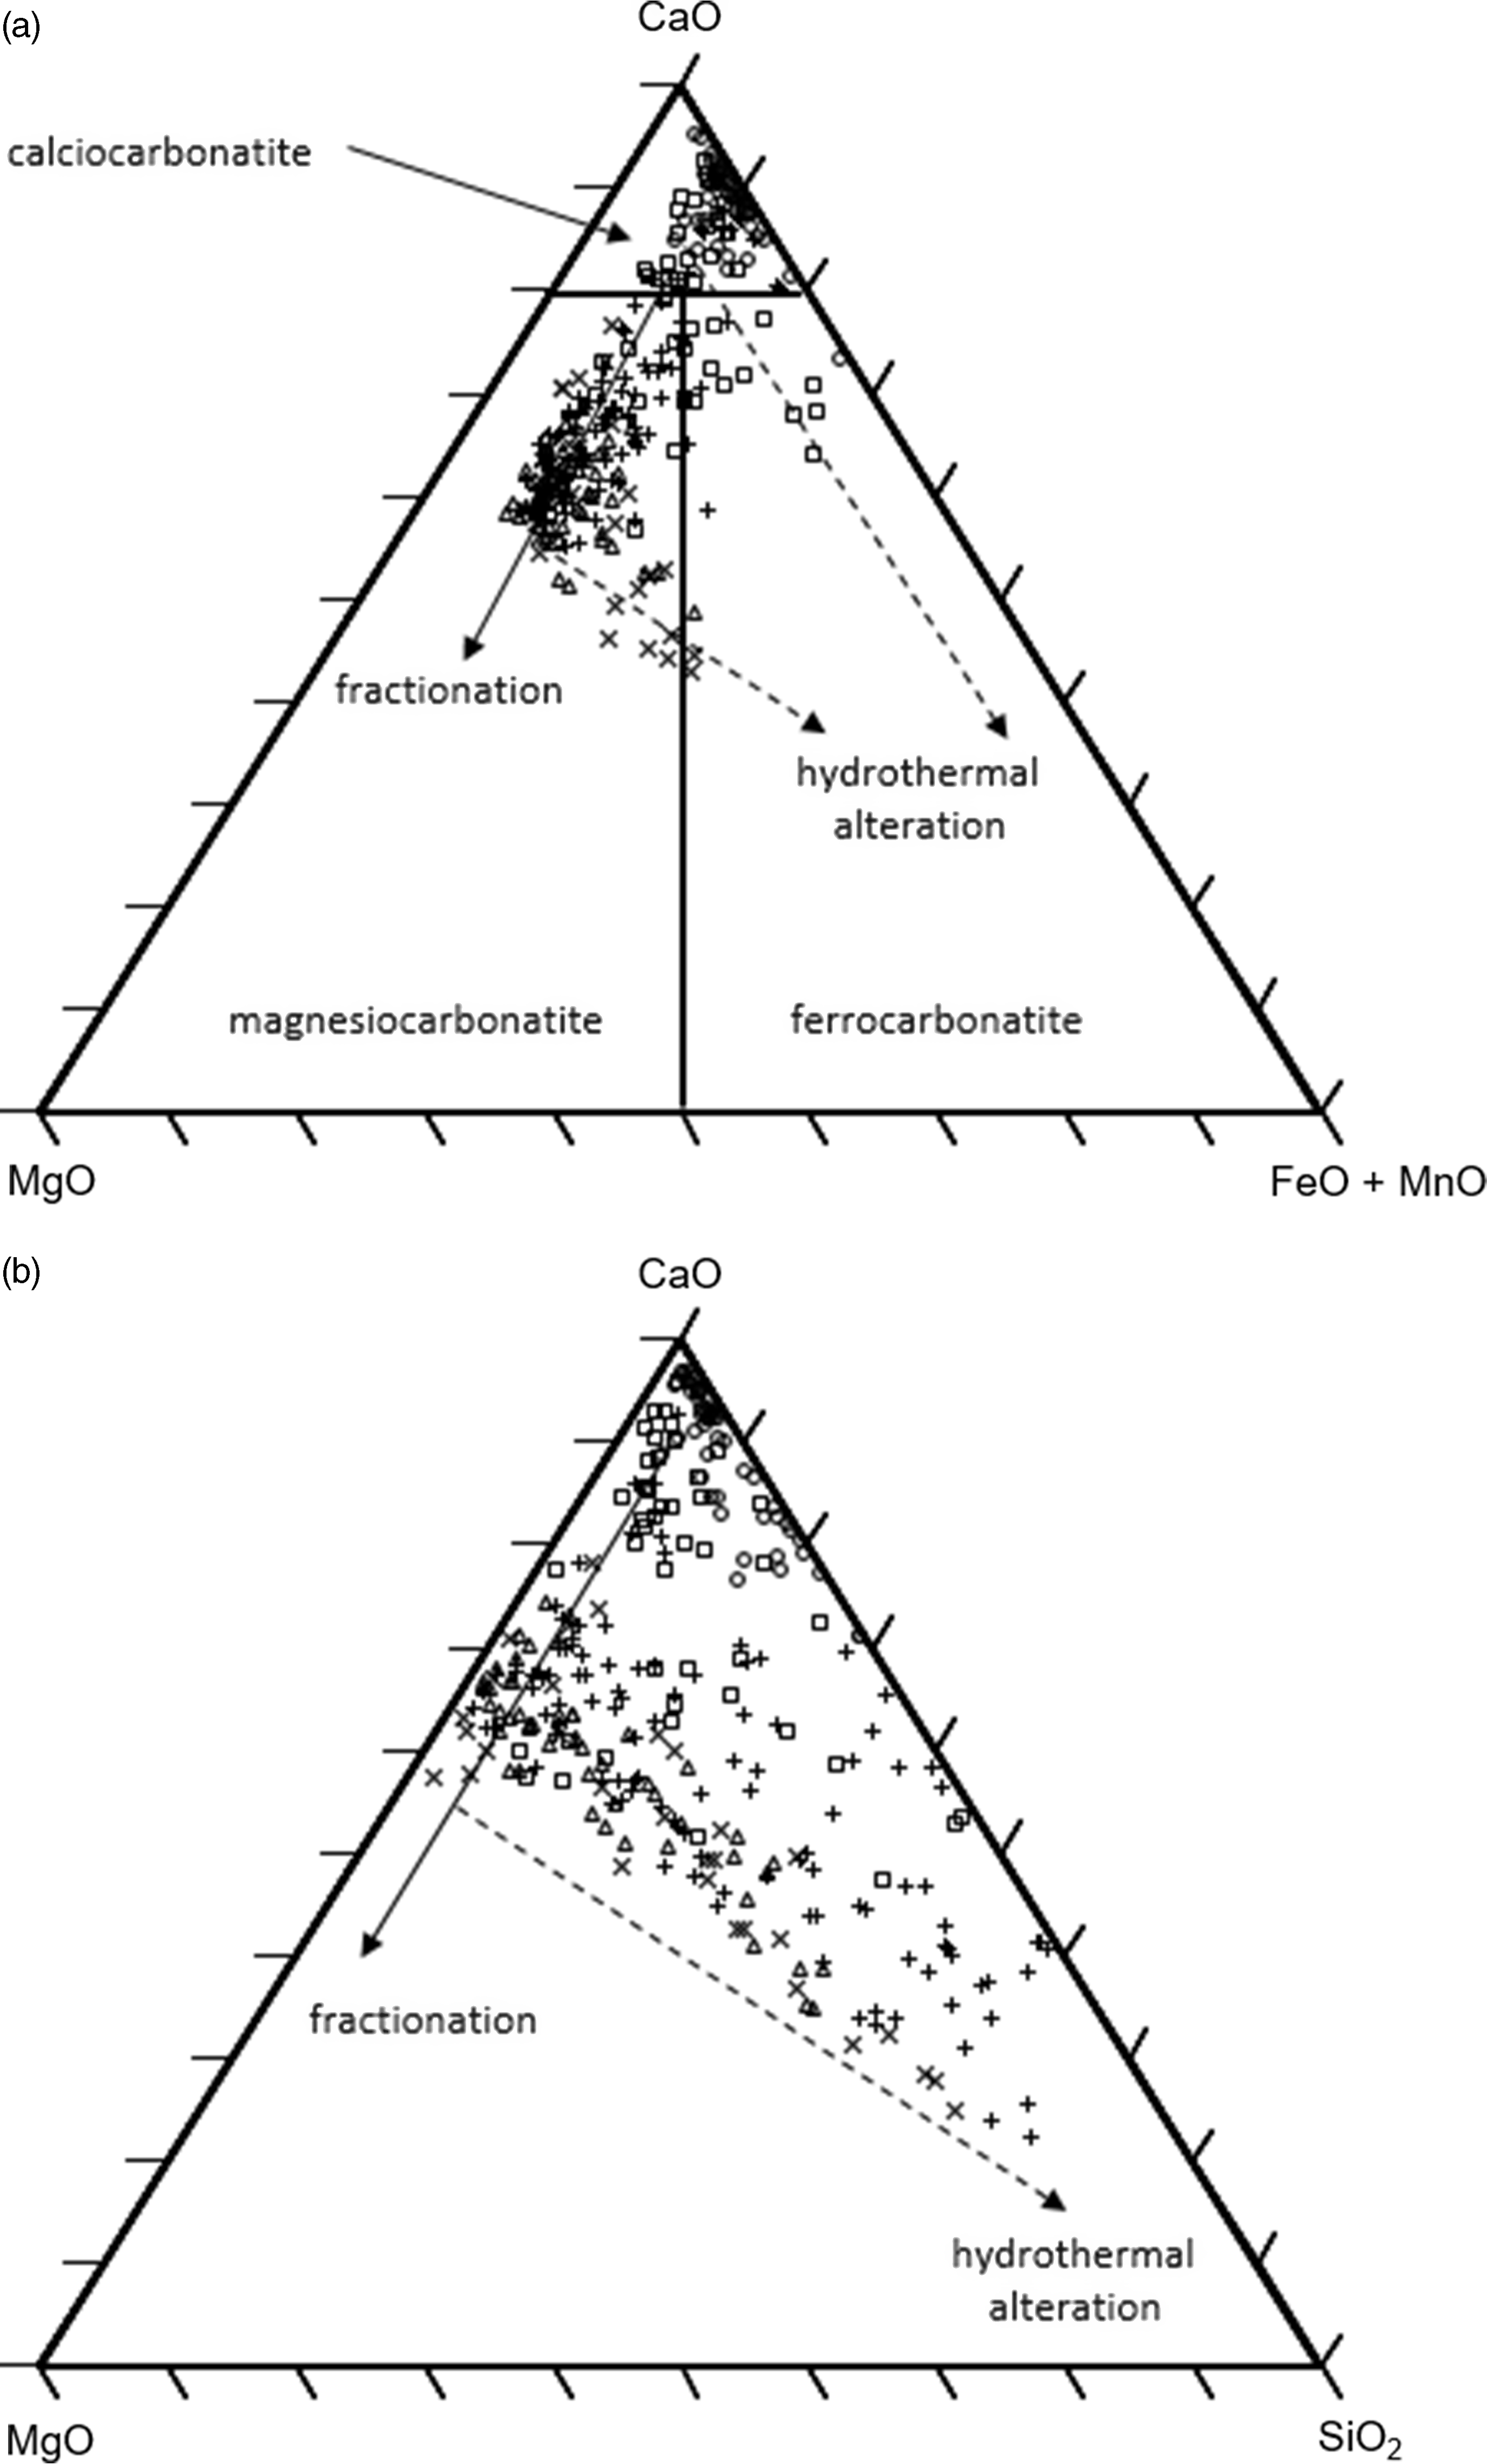
The pale grey carbonatites of the central zone plug (TK1A and TK1B; n = 67) form a tightly clustered field of calcio-carbonatites. By contrast, the dark brown carbonatites of the TK4 (n = 115) peripheral cone sheet display a continuous trend from the calcio-carbonatite field to the magnesio-carbonatite field, and the carbonatite dykes in the central stockwork (TK2; n = 32) display a distinct trend towards ferro-carbonatites. The trend from calcio-carbonatite to magnesio-carbonatite may reflect a fractionation trend from more primitive to more evolved carbonatite (Chakhmouradian et al. Reference Chakhmouradian, Reguir and Zaitsev2016). In which case, the TK3 (n = 32), TK5 (n = 18), TK6 (n = 7) and TK7 (n = 24) cone sheets form an extended fractionation trend, with the TK6 and TK7 cone sheets containing the most Mg-rich carbonatites.
Deviations to higher FeO + MnO from points along the fractionation trend likely reflects hydrothermal alteration (Anderson, Reference Andersen1987), with these fractionation and hydrothermal alteration trends being common to many carbonatites (e.g. Broom-Fendley et al. Reference Broom-Fendley, Brady, Wall, Gunn and Dawes2017). Overall, the mean CaO/MgO ratios for the central zone calcio-carbonatites, the peripheral cone sheets and the TK2 dykes are 71.7, 4.4 and 12.1, respectively (Table 1).
The large range of SiO2 contents (<1 to >40 wt %) in samples from the TCC (Fig. 6b) most likely derives from hydrothermal silica alteration. All structural components of the TCC show some silica enrichment, but it is most pronounced in the cone sheets, such that the mean CaO/SiO2 ratio falls from ∼17 in the central zone calcio-carbonatites to <8 in the peripheral cone sheets (Table 1). There is, however, no correlation between silica and iron. Indeed, the most iron-enriched carbonatites are depleted in silica, which suggests there were at least two stages of hydrothermal alteration, consistent with field and mineralogical observations showing quartz veins cross-cutting the ankerite carbonatites.
An alternative explanation for the trend towards high SiO2 contents is that they reflect assimilation of basement rocks. We consider this to be unlikely because Namaqua metapelites, metapsammites and mafic granulites typically contain Al2O3 contents of 22.3, 11.0 and 13.7 wt %, respectively (Diener et al. Reference Diener, White, Link, Dreyer and Moodley2013). In comparison, none of the whole-rock TCC samples contain >0.66 wt % Al2O3, and the sample containing the highest SiO2 concentration (42.40 wt %) contains only 0.06 wt % Al2O3.
Carbonatites typically contain ∼0.45 wt % BaO with increasing BaO during magmatic differentiation (Le Bas, Reference Le Bas, Fitton and Upton1987; Jones et al. Reference Jones, Genge and Carmody2013). The wide range of BaO (2–12 wt %) within the TCC carbonatites reflects variable, and locally high, modal barite, but there is no clear relationship between BaO contents and CaO/MgO ratios either within or between the different TK units. In addition, there is no statistically significant correlation between BaO concentrations and typical geochemical indices of differentiation (e.g. Zr) either across the whole dataset or within the individual units. Hence, it is likely that the distribution of BaO reflects hydrothermal reworking of the carbonatites that also led to formation of the REE fluorcarbonates, as commonly observed in carbonatites elsewhere (Doroshkevich et al. Reference Doroshkevich, Viladkar, Ripp and Burtseva2009; Moore et al. Reference Moore, Chakhmouradian, Mariano and Sidhu2015). There is, however, no clear relationship between REE, BaO or SiO2 contents either within or between the different TK units, which suggests there were several stages of hydrothermal mineralization. This is similar to the picture seen within the Tundulu carbonatite complex (Malawi) where the fractionation/hydrothermal sequence appears to start with synchysite, is followed by barite and terminates with quartz (Ngwenya, Reference Ngwenya1994).
Globally, carbonatites average 1.73 wt % P2O5 (Le Bas, Reference Le Bas, Fitton and Upton1987), but individual carbonatites can incorporate as much as 20 wt % P2O5 (Chakhmouradian et al. Reference Chakhmouradian, Reguir and Zaitsev2016). This range is reflected in the TCC data, with carbonatite samples from the TK2 dykes averaging 2.36 wt % P2O5 (up to 6.10 wt %), whereas the peripheral cone sheets generally contain <1 wt % P2O5 and the central zone calcio-carbonatites contain 1–2 wt % P2O5 (Table 1). Throughout the TCC, the phosphate minerals are predominantly present as apatite and monazite.
6.b. Whole-rock rare earth elements
The chondrite-normalized REE patterns of the TCC outcrop areas all display steep light rare earth element (LREE)-enriched patterns (Fig. 7a) that are similar to those observed in examples of other major REE-mineralized carbonatites (Fig. 7b), and closely resemble those from Bear Lodge (Moore et al. Reference Moore, Chakhmouradian, Mariano and Sidhu2015). The mean REO abundance for all 295 whole-rock samples is 3.12 wt %. Overall, all the TCC carbonatite samples contain >1.0 wt % REOs, with <10 % of samples having <2 wt % REOs, and 50 % having >2.8 wt % REOs. There is no statistically significant correlation between the CaO/MgO ratios and REO contents of individual samples, but we note that the calcio-carbonatites from the central zone show the highest average REO abundances (mean of 4.47 wt %, n = 54), although the TK2 dyke stockwork also has a high mean abundance (4.18 wt %, n = 45). In comparison, the magnesio-carbonatites from the peripheral cone sheets have a lower average abundance (2.51 wt %, n = 196) (Table 1). As noted above, the evolution from calcic to magnesian compositions in carbonatites worldwide has been interpreted as a fractionation trend (Chakhmouradian et al. Reference Chakhmouradian, Reguir and Zaitsev2016) and, in the case of the TCC, this trend is accompanied by progressive depletion in REOs.
REE plots. (a) Average chondrite-normalized REE patterns for TCC outcrops (symbols as in Fig. 6). (b) Selected carbonatites from elsewhere. Symbols: TCC – circles; Bear Lodge – squares; Kalkfeld – crosses; Mountain Pass – diamonds; Wicheeda – triangles. Data from Haxel (Reference Haxel and Theodore2007), Bühn (Reference Bühn2008), Moore et al. (Reference Moore, Chakhmouradian, Mariano and Sidhu2015) and Trofanenko et al. (Reference Trofanenko, Williams-Jones, Simandl and Migdisov2016). (c) Comparison between REE patterns of REE-enriched minerals determined by LA-ICP-MS (dashed line), REE-enriched minerals determined by EDS (dotted line), carbonate minerals (dash-dot line) and average TCC whole rock (solid line).

6.c. Mineral rare earth elements
The similarity between the whole-rock REE contents of the TCC and Bear Lodge deposit (Moore et al. Reference Moore, Chakhmouradian, Mariano and Sidhu2015) is also reflected in the LREE contents of parisite, synchysite and monazite in each of the two deposits (as determined by EDS), although the TCC REE minerals have slightly higher (La/Ce)N and (La/Nd)N ratios than the equivalent minerals from Bear Lodge (Fig. 8). The LREE compositions of the major REE-rich minerals from the TCC are listed in online Supplementary Material Table S2. It is also noteworthy that the whole-rock carbonatite (La/Ce)N and (La/Nd)N ratios from both deposits are lower than those of the REE-rich phases. This likely reflects dilution of the parisite/synchysite/monazite signature by carbonate minerals, which have much lower REE contents (typically <1000 ppm total REE) and (La/Ce)N and (La/Nd)N ratios that are close to unity (Moore et al. Reference Moore, Chakhmouradian, Mariano and Sidhu2015).
Chondrite-normalized La/Nd versus La/Ce ratios for samples from the TCC and Bear Lodge (Moore et al. Reference Moore, Chakhmouradian, Mariano and Sidhu2015). Symbols: TCC parisite – squares; synchysite – diamonds; monazite – triangles; whole-rock carbonatite from difference centres – open circles. Bear Lodge parisite – ×; synchysite – +; monazite – asterisks; whole-rock carbonatites – filled circles.

There is good agreement between the average REE patterns of the REE-rich minerals determined by LA-ICP-MS (n = 30) and the LREEs that could be measured by EDS (n = 31) (Fig. 7c). The average carbonates (n = 101) have much lower total REE contents and are less LREE enriched. Also shown on Figure 7c is the average REE pattern of all the whole-rock TCC samples. A simple mixing calculation assuming that the whole-rock REE concentrations are derived from carbonate plus REE-rich minerals (fluorcarbonates and monazite) suggests that ∼95 % of the total REEs within the whole rock derive from the REE-rich minerals.
6.d. Trace elements
The average trace-element contents of the TCC outcrops are compared in primitive-mantle-normalized plots in Figure 9a and to other major REE-mineralized carbonatites in Figure 9b. The TK4, TK6 and TK7 cone sheets display more elevated Th than the REE-rich central zone calcio-carbonatites, and stockwork dykes, whereas the central zone and stockwork dykes tend to have more elevated Nb contents than the peripheral cone sheets. This likely reflects the presence of more accessory pyrochlore in the central zone as this is the principal Nb-bearing mineral in carbonatites (Le Bas, Reference Le Bas, Fitton and Upton1987). All the REE-enriched carbonatites shown display similar features on the primitive-mantle-normalized plots, i.e. they are all depleted in the alkali elements K and Rb and the high-field-strength elements Zr and Ti, which suggests that they share common origins and/or formation processes. A notable feature of the TCC carbonatites is that the U concentrations are relatively low (0.5 to 8.2 ppm, mean 2.6 ppm) in the TCC compared to many other carbonatites (e.g. Trofanenko et al. Reference Trofanenko, Williams-Jones, Simandl and Migdisov2016; Broom-Fendley et al. Reference Broom-Fendley, Brady, Wall, Gunn and Dawes2017). The average trace-element pattern of the TCC is similar to that of the Bear Lodge carbonatites, although the TCC tends to have higher Ba and lower Sr contents.

6.e. Isotopes
The Sr, Nd and Pb isotope ratios were measured on seven samples, and the data are listed in Table 5. The εNd(t) values are also given, assuming that the TCC was emplaced at the same time (∼50 Ma) as the Dicker Willem carbonatite (Reid et al. Reference Reid, Cooper, Rex and Harmes1990) and the Tsirub nephelinite intrusions (Nakashole et al. Reference Nakashole, le Roex and Reid2020).
TCC radiogenic isotope data

7. Discussion
7.a. Geochemical evolution
Worldwide, carbonatites show evidence of hydrothermal alteration during and immediately after their formation. In addition, even though the TCC is located in a very arid environment, drill cores from the nearby Kieshöehe carbonatite show evidence of weathering to a depth of up to ∼70 m below the present land surface. Hence, any discussion of the geochemical evolution of the TCC must consider the potential impacts of these processes. While there is clear evidence of the effects of hydrothermal alteration of the TCC (e.g. Fig. 6), the distinct geochemical identity of the TCC outcrops (Table 1) and the presence of sharp boundaries between distinct lithologies (e.g. Fig. 4b) suggests that post-magmatic processes (hydrothermal and/or weathering) have not obscured all the original geochemical features of the deposit.
While radiogenic isotope mantle end-members were originally defined from mid-ocean ridge basalt (MORB) and oceanic island basalt compositions, Bell & Tilton (Reference Bell and Tilton2001) demonstrated that Sr, Nd and Pb isotope ratios can also be applied to studying the mantle origin of African carbonatites, with only minimal evidence of lithospheric contamination. They showed that binary plots between 87Sr/86Sr–143Nd/144Nd–206Pb/204Pb ratios of carbonatites from East Africa (Fig. 10) reveal that much of the variation in their isotope compositions can be described by mixing between the high-μ (HIMU) and enriched mantle 1 (EM1) mantle end-members, but that at least one more component (depleted MORB mantle; DMM) is required to describe the composition of a significant proportion of the data. The question as to whether the enriched mantle isotope signatures arise from asthenospheric mantle sources or derive from sub-continental lithospheric mantle that has experienced subduction-related contamination (e.g. Fitzpaine et al. Reference Fitzpaine, Giuliani, Maas, Hergt, Janney and Phillips2019) has important implications for the origins of both carbonatites and kimberlites. However, novel insights into this problem lie beyond the scope of this study, and we are most concerned with comparing the data from southern Namibia with other African carbonatites. Hence, we apply the same approach as Bell & Tilton (Reference Bell and Tilton2001) to the study of the TCC radiogenic isotope data.
Initial Sr–Nd–Pb isotope systematics of TK units (+; this study), Dicker Willem (×; Cooper & Reid, Reference Cooper and Reid2000), East African carbonatites (open circles; Bell & Tilton, Reference Bell and Tilton2001) and Walvis Ridge, South Atlantic (filled circles; Homrighausen et al. Reference Homrighausen, Hoernle, Geldmacher, Wartho, Hauf, Portnyagin, Werner, van den Bogaard and Garbe-Schönberg2018). In all cases, the analytical uncertainties of the data obtained for the TCC samples are smaller than the data symbols. The Namibian data are initial ratios based on the 49 ± 1 Ma age for Dicker Willem (Reid et al. Reference Reid, Cooper, Rex and Harmes1990). (a) 143Nd/144Nd versus 87Sr/86Sr. (b) 207Pb/204Pb versus 206Pb/204Pb. (c) 208Pb/204Pb versus 206Pb/204Pb. (d) 87Sr/86Sr versus 206Pb/204Pb. DMM – depleted mid-ocean ridge basalt mantle; EM1 – enriched mantle 1; HIMU – high-μ. Initial Sr–Nd–Pb isotope systematics of TK units (+; this study), Dicker Willem (×; Cooper & Reid, Reference Cooper and Reid2000), East African carbonatites (open circles; Bell & Tilton, Reference Bell and Tilton2001) and Walvis Ridge, South Atlantic (filled circles; Homrighausen et al. Reference Homrighausen, Hoernle, Geldmacher, Wartho, Hauf, Portnyagin, Werner, van den Bogaard and Garbe-Schönberg2018). In all cases, the analytical uncertainties of the data obtained for the TCC samples are smaller than the data symbols. The Namibian data are initial ratios based on the 49 ± 1 Ma age for Dicker Willem (Reid et al. Reference Reid, Cooper, Rex and Harmes1990). (e) 143Nd/144Nd versus 206Pb/204Pb. (f) 87Sr/86Sr versus 208Pb/204Pb. (g) 143Nd/144Nd versus 208Pb/204Pb. (h) f(Nd, Pb) versus 87Sr/86Sr, where f(Nd, Pb) = ((143Nd/144Nd)2 + (206Pb/204Pb)2)0.5.(sin(arctan(143Nd/144Nd/206Pb/204Pb) + 0.000064)) (Zindler et al. Reference Zindler, Jagoutz and Goldstein1982; Bell & Tilton, Reference Bell and Tilton2001). DMM – depleted mid-ocean ridge basalt mantle; EM1 – enriched mantle 1; HIMU – high-μ.

Homrighausen et al. (Reference Homrighausen, Hoernle, Geldmacher, Wartho, Hauf, Portnyagin, Werner, van den Bogaard and Garbe-Schönberg2018) also compared the mantle sources of the Dicker Willem carbonatites with those of the Walvis Ridge alkali basalts in the nearby South Atlantic, and also suggested that the Sr–Nd–Pb isotope compositions of both groups lie on similar trends that largely represent mixing between HIMU and EM1 sources. They proposed that the EM1 source derives from upwelling of a deep source along a hot-spot track, and that the HIMU material may either derive from upwelling of mantle plume that then flows westward along the base of the sub-continental lithospheric mantle, or may arise from discrete diapirs of HIMU material rising from the deep mantle. As noted, Alfonso et al. (Reference Alfonso, Ben Masour, O’Reilly, Griffin, Salajeghegh, Foley, Begg, Selway, Macdonald, Januszczak, Fomin, Nyblade and Yang2022) recently proposed that Walvis Ridge (South Atlantic) and the southern Namibia carbonatites lie along a hot-spot track that youngs from the NE to SW, thus supporting the plume model for the HIMU source.
The position of the TCC samples in the Sr–Nd–Pb binary plots also suggests that they are predominantly derived from mixing between HIMU and EM1 sources. Nevertheless, the multi-dimensional space occupied by Sr–Nd–Pb isotopes means that the distribution of samples are best examined on a three-dimensional mantle plane (cf. Zindler et al. Reference Zindler, Jagoutz and Goldstein1982). Using this approach (Fig. 10h), it can be seen that the vast majority of the carbonatite data (including the TCC) plot along the mantle plane described by the DMM, HIMU and EM1 mantle end-members. The residual deviation to more radiogenic Sr and Pb isotope ratios may either reflect small degrees of high-level crustal assimilation and/or post magmatic alteration by hydrothermal/weathering processes, but we concur with Bell & Tilton (Reference Bell and Tilton2001) that the carbonatite isotope data predominantly reflect their mantle source, whether that be from asthenospheric sources and/or also from the sub-continental lithospheric mantle.
Following mantle melting, the initial emplacement of the calcio-carbonatites in the TCC was rapidly followed by sub-solidus formation of the REE fluorcarbonate minerals in distinct layers by circulation of endogenous fluids just below solidus temperatures. Deformation then occurred as the layered calcio-carbonatite cooled through the ductile–brittle transition to yield the textures observed in Figure 5c, d. Chakhmouradian et al. (Reference Chakhmouradian, Reguir and Zaitsev2016) envisaged that analogous textures in carbonatites could arise during collision zone deformation, but successive intrusion of cone sheets into resistant basement would also create compressive stresses during emplacement.
All the cone sheets have more dolomitic compositions (mean CaO/MgO = 4.4) and may have formed during fractionation of the same magma (Chakhmouradian et al. Reference Chakhmouradian, Reguir and Zaitsev2016) that formed the original calcio-carbonatites (mean CaO/MgO = 71.7) (Table 1). However, by this stage in its evolution, the primary magma may have been depleted in its original volatile content, such that the cone sheets did not display dominant sub-solidus REE mineralization.
The final magmatic event may have involved fresh injection of melt to yield the calcic carbonatite dykes (mean CaO/MgO = 12.1) in the centre of the TCC. This fresh batch of melt came with sufficient volatile concentrations to allow further formation of REE fluorcarbonates in some of the dykes. Note, however, that it is important to distinguish between the high-temperature sub-solidus hydrothermal processes (>400 °C, Trofanenko et al. Reference Trofanenko, Williams-Jones, Simandl and Migdisov2016) that led to formation of the REE fluorcarbonates from the later, relatively low-temperature (possibly hydrostatically limited; cf. Smith et al. Reference Smith, Moore, Kavecsánszki, Finch, Kynicky and Wall2016), hydrothermal silica and Fe–Mn hydrothermal activity that is pervasive throughout the TCC (Fig. 6).
7.b. Structural evolution
The geochemical and structural evolution of the TCC was a staged process involving separate magma pulses, a series of emplacement structures, fractional crystallization and low-temperature silica and Fe–Mn hydrothermal alteration (Fig. 11). The distribution of the shallow-dipping peripheral cone sheets surrounding the central zone of the TCC implies the cone sheets were emplaced within a ring fracture system, which developed in response to the emplacement of the calcio-carbonatites. The change from emplacement of magma in a sub-vertical conduit to its emplacement in shallow-dipping cone sheets within a ring structure, and finally to emplacement in a sub-vertical dyke stockwork, suggests modification of the stress fields, and possibly changes in melt viscosity. The ubiquitous, sub-vertically hinged flow folds in the central zone plugs likely resulted from frictional plug–wall shear during plug intrusion, as well as shear stress modification during successive intrusions of the cone sheets into resistant basement peripheral to the plugs.
Schematic evolution of the TCC. Stage 1: Initial emplacement of REE-enriched calcio-carbonatites to form linear plugs at the top of a volcanic neck, at least 400 m in diameter, above a shallow magma chamber. Crystallization of REE-enriched melt resulted in abundant REE fluorcarbonates and REE-rich monazite within the plugs. Shear stress associated with frictional plug–wall shear (photo 1). Stage 2: A change in the dominant shear stress direction and dilation associated with the emplacement of cone sheets peripheral to the plugs resulted in deformation of the REE fluorcarbonate layers formed during crystal settling within the plugs. Deformation produced flow fold fabrics in the plugs (photo 2). Subsequent fractionation of the melt and emplacement of magnesio-carbonatite cone sheets from REE-depleted melt, within a ring fracture peripheral to the volcanic neck, resulted in a lower abundance of REE minerals within the cone sheets. Stage 3: Stockwork of dominant calcio-carbonatite and subordinate magnesio-carbonatite dykes (photo 3) emplaced around the central plugs. The dykes were emplaced from additional influx of melt enriched in REE, P2O5 and SrO to the original magma chamber following the intrusion of the cone sheets. The final stage in the evolution was characterized by pervasive low-temperature SiO2–FeO–MnO hydrothermal alteration throughout the complex.

From analogy with the modification of the regional stress field by magma intrusion and formation of tabular granitic plutons (Vigneresse et al. Reference Vigneresse, Tikoff and Améglio1999), we suggest that the initial pulse of magma associated with the central zone plugs was preferentially emplaced in a vertical plane perpendicular to the least principal stress component. Following this analogy, dilation would have caused local reorganization of the stress field by increasing the minor and intermediate principal stress components, and when these overcame the lithostatic load, a change in the orientation of the opening plane would have led to a switch from vertical plugs to sub-horizontal cone sheets. The topographic prominence of the TCC can be explained by vertical upheaval of the surrounding basement host rocks and dilation associated with emplacement of the carbonatite. The synclinal shape of the TK4 and TK7 cone sheets, and the arched structure of the TK6 cone sheet, may thus have resulted from cone sheet emplacement during basement doming. Further evidence of structural upheaval and deformation during emplacement is provided by the relationship between the prominent TK2 dyke outcrop and the TK1B central zone plug outcrop. Here, the (originally linear?) TK1B plug wraps around the TK2 dyke that forms the prominent topographic hill directly SW of the plug. The contact zone between the TK2 dyke and the TK1B plug can be compared with the high strain zone that develops at the contact of a ballooning granitoid (Castro, Reference Castro1987). High strain in a ductile environment resulted in the flow fold fabrics seen in the calcio-carbonatites at TK1B. Experimental studies of the dynamics of dykes and cone sheets in volcanic systems indicate that cone sheets form preferentially when the magma influx velocity (or viscosity) is high, and dykes form when the magma influx rate (or viscosity) is low (Galland et al. Reference Galland, Burchardt, Hallot, Mourgues and Bulois2014).
The TCC is composed of a complex series of intrusions, which likely acted as magma transport conduits between one or more sub-volcanic magma chambers to higher structural levels. The TK3, TK4 and TK7 cone sheets form a uniform radial system, defining a cone with a central apex located at a depth of at least a few hundred metres, below a point a few hundred metres NE of the TK1A plug outcrop. Radial-dipping cone sheets generally form by magma flow radiating upwards and outwards from a magma chamber situated at the common apex. This flow may either occur throughout the cone sheets, or it may be restricted to an ascent zone from which it then propagates laterally (Magee et al. Reference Magee, Stevenson, O’Driscoll, Schofield and McDermott2012; Andersson et al. Reference Andersson, Almqvist, Burchardt, Troll, Malehmir, Snowball and Kübler2016). Both lateral and vertical flow are evident in the carbonatite layers at the base of the TK5 and TK7 cone sheets where transgressing and closing structures are observed. Carbonatite cone sheet thinning at the TCC is associated with dominantly lateral flow in basement arch environments, while carbonatite cone sheet thickening is associated with dominantly vertical flow in basement environments lacking upheaval. Thus, the transgressing and closing structures observed at the TCC reflect a change in the dominant flow regime during cone sheet emplacement. The final shape of the cone sheets reflects both the attitude of the initial ring fracture and basement deformation associated with ballooning and dilation, as well as the relative extent of lateral versus vertical magma flow.
7.c. REE economic potential
The data presented here indicate the dominant REE-rich minerals within the TCC belong to the REE fluorcarbonate group of minerals characterized by variable Ca, high F and LREEs. Chondrite-normalized REE profiles of the REE fluorcarbonates and monazite show a similar degree of LREE enrichment as the whole rocks, confirming that these minerals collectively define the REE abundance of the overall deposit. By contrast, apatite and fluorite do not contain significant quantities of REEs. Phosphate minerals in carbonatites commonly include both apatite and monazite, and significant quantities of REEs may be present within apatite (e.g. Songwe carbonatite, Malawi; Broom-Fendley et al. Reference Broom-Fendley, Brady, Wall, Gunn and Dawes2017). However, monazite is the only important REE-rich phosphate phase at the TCC.
8. Conclusions
We have undertaken a geological and geochemical study of the Twyfelskupje carbonatite complex (TCC), Southern Namibia.
Radiogenic isotope studies (Sr, Nd and Pb) show that the TCC lies on the same mantle array defined by East African carbonatites between a HIMU-rich plume rising and an enriched EM1-type source that may reside in the lower mantle or sub-continental lithospheric mantle.
The geochemical and structural evolution proposed for the TCC is a staged process involving separate magma pulses, a series of emplacement structures, fractional crystallization and low-temperature hydrothermal alteration.
The initial stage involved emplacement of REE-enriched calcio-carbonatites to form linear plugs. Sub-solidus crystallization of REE-enriched melt/fluids resulted in abundant REE fluorcarbonates and REE-rich monazite within the plugs. This was followed by emplacement of cone sheets peripheral to the plugs and resulted in deformation of REE fluorcarbonate layers formed within the plugs. Subsequent fractionation of the melt and emplacement of magnesio-carbonatite cone sheets from REE-depleted melt, within a ring fracture peripheral to the volcanic neck, resulted in a lower abundance of REE minerals within the cone sheets. A stockwork of dominant calcio-carbonatite and subordinate magnesio-carbonatite dykes was then emplaced around the central plugs as a result of an additional influx of melt to the original magma chamber. The final stage in the evolution of the TCC was characterized by pervasive low-temperature SiO2–FeO–MnO hydrothermal alteration throughout the complex.
Supplementary material
To view supplementary material for this article, please visit https://doi.org/10.1017/S0016756822000917
Acknowledgements
Thanks to Shali for funding the logistical support for the mapping and channel sampling programmes and the bulk lithochemistry undertaken by ALS. The isotope analyses were funded by the University of Southampton. Thanks are due to Shali Group geologists Emmanuel Shilongo, Vengesai Verengerav, Andreas Stiehler and Jack Palmer for assistance with mapping and channel sampling. Thanks to Andy Milton, Richard Pearce, Dominic Browne, Matt Ball and George Martin-Johnson for analytical assistance at Southampton. We are also grateful to Sam Broom-Fendley, Charles Beard and two anonymous reviewers, whose detailed and constructive comments greatly improved this paper.
Conflict of interest
The authors declare the following financial interests/personal relationships which may be considered as potential competing interests: A. G. Marlow is a shareholder of Bonya Exploration (Pty) Ltd, which holds EPL6691 over the Twyfelskupje carbonatite.


 Open access