

Introduction
Conditions at the glacier bed are of fundamental concern to glaciologists. The motion of temperate glaciers is strongly influenced by basal sliding and by deformation of ice near the bed. In temperate glaciers, there is a basal ice layer, typically decimeters in thickness, that is visually distinct from ice higher in the glacier due to its higher sediment content. The formation of this layer, and its influence on glacier dynamics are poorly understood (cf. reviews by Reference Hubbard and SharpHubbard and Sharp, 1989; Reference Souchez and LorrainSouchez and Lorrain, 1991; Reference KnightKnight, 1997). In particular, its rheology is not well constrained, owing to its potentially anomalous water content, texture, fabric and bubble content. Despite the influence of basal ice rheology on sliding, there are only a few relevant field measurements, mostly from borehole studies and observations at the margins of glaciers. Simultaneous measurements of sliding speed and shear and normal stresses on the bed, key quantities needed to evaluate ice rheology and sliding, are rare, in part, because they are so difficult to obtain.
In contrast, there has been a great deal of theoretical study of the coupling between clean temperate ice and a hard bed (e.g. Reference WeertmanWeertman, 1957; Reference LliboutryLliboutry, 1968; Reference KambKamb, 1970; Reference NyeNye, 1970; Reference MorlandMorland, 1976a; Reference FowlerFowler, 1981). Early analytical work considered steady flow of clean, dry ice sliding without interfacial friction over periodic bedrock undulations by regelation and viscous creep. Since then, some authors have included the effect of bed separation (e.g. Reference FowlerFowler, 1987; Reference LliboutryLliboutry, 1987), ice–bed friction (Reference MorlandMorland, 1976b) and friction between sediment in ice and the bed (Reference HalletHallet, 1981; Reference Schweizer and IkenSchweizer and Iken, 1992). More recently, finite-element models have been used to study the effects of non-linear ice rheology and large bed undulations (e.g. Reference GudmundssonGudmundsson, 1997). Despite these advances, basic assumptions are largely untested, and the effect of a rheologically distinct basal ice layer on sliding is not well known.
Reference Engelhardt, Harrison and KambEngelhardt and others (1978), in their landmark field study of basal sliding using borehole photography, pointed out major discrepancies between sliding theory and observations. The sliding speed was lower than expected, and they attributed this to a subsole drift layer with high surface roughness, to friction between sediment in ice and the bed, and to a lack of ice/bed separation. They emphasized that debris in the ice and in the subglacial drift contributed to significant drag on the bed and to a large reduction in the sliding velocity. Engelhardt and others also argued that high sliding speeds recorded elsewhere were probably due to extensive ice/ bed separation that was not typical of the thicker parts of glaciers. Unfortunately, borehole studies do not provide measurements of local stresses, so the interplay between rheology and sliding cannot be studied quantitatively.
In a few cases, access to glacier beds through tunnels in subglacial bedrock has made possible simultaneous measurements of sliding speed and stresses. Reference Boulton, Morris, Armstrong and ThomasBoulton and others (1979) measured sliding speed and normal and shear stresses on sensors embedded in bedrock beneath Glacier d’Argentiére, French Alps, under 100 m of ice. Their measurements, however, were made near extensive areas of ice/bed separation near the terminus of the glacier. Reference Hagen, Wold, Liestøl, Østrem and SollidHagen and others (1983) measured sliding speed and normal stresses on the surfaces of obstacles bolted to the bed of Bondhusbreen, Norway, under 160 m of ice but did not measure basal shear stress. More recently, A. Zryd (unpublished information) measured sliding speed and normal and shear stresses on an obstacle near the margin of Findelengletscher, Switzerland. The ice thickness, however, was only 30 m.
Herein, we report field measurements carried out at Engabreen, an outlet glacier of the Svartisen ice cap, Norway, where access to the bed is made possible through tunnels in the subglacial bedrock. An instrumented panel containing a conical obstacle was mounted flush with the bed surface beneath 210 m of ice. Sliding speed, normal and shear stresses, and temperature were measured simultaneously over a period of several days in April 1996, and again in November 1997, in order to estimate the rheology of the basal ice layer. In the present paper, we describe the methods and the instruments used in the experiments, and we compare the measurements with expectations based on sliding theories. In the companion paper (Reference CohenCohen, 2000), a numerical model of ice flow past the obstacle is used to estimate the rheology of the basal ice layer.
Field Setting
Engabreen (66°16′ N, 13°85′ E) (Fig. 1) is a temperate valley glacier that drains ice from the Svartisen ice cap at 1575 m a.s.l. down to a terminus at 20 m a.s.l. The bedrock beneath the glacier is primarily schist and gneiss. At the site of the experiments, the glacier is approximately 1.5 km wide and flows westward in a narrowing channel. The surface speed above the site of the experiment was approximately 0.8 m d−1 in summer during the period 1990–95 (Reference KohlerKohler, 1998). Surface slope is about 10°.
Topographic map of Engabreen with surface contours (thin black lines) and bed topography (light grey lines). Main tunnel is shown in bold grey lines, with site of experiment indicated with a black square.

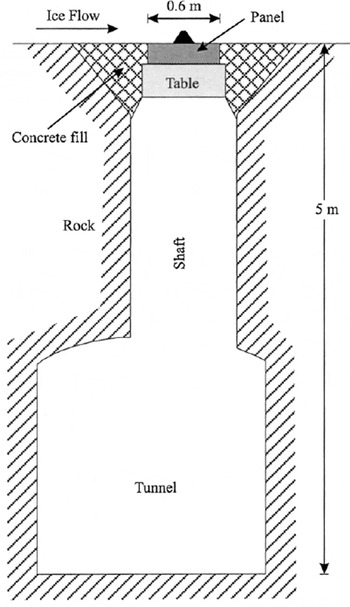
A tunnel system and associated subglacial intakes, excavated in the bedrock beneath Engabreen for hydroelectric power, provide unique access to the glacier bed. The Norwegian Water Resources and Energy Administration (NVE) maintains a research facility, the Svartisen Glaciological Observatory, which includes a hot-water drilling system, a cold room and other laboratories and living quarters in the tunnel system beneath the glacier. A small tunnel connected to the main tunnel system is used for the sole purpose of research. This tunnel ends at the bed near the center of the glacier at 630 m a.s.l., beneath 210 m of ice. The bed can be accessed in two places: a horizontal tunnel (HRT, Fig. 2), accessible through a door made of removable I-beams slipped in slots in the tunnel wall, and a vertical shaft (VRS, Fig. 2; Fig. 3), 5 m high, that opens onto a relatively planar section of the glacier bed that slopes about 10° down-glacier. At the top, the shaft is fitted with a table supported by four steel legs (not shown in Fig. 3) that extend to the tunnel floor. The legs can be disassembled and the table lowered with the use of a cable and a winch. Instruments can be set on the table and hoisted back up to the bed of the glacier.
Map of tunnel system and access to glacier bed with contour map of bed elevation in meters. Vertical shaft (VRS) and horizontal entrance are shown in light grey. Horizontal door (HRT) is shown in grey. FS2 is the location of the borehole used to measure sliding speed (see text). Crossing contours in upper-left part of map are due to overhanging rock.

Schematic of shaft showing instrumented panel in place.
From the horizontal tunnel, the basal environment can be observed from tunnels melted through the ice along the bed with the use of hot water. The bedrock topography near the door is irregular, with transverse meter-scale undulations 1–10 m in wavelength and with incised grooves trending in the direction of flow. There is a steep wall, about 4 m high, 11 m north of the door. This wall is almost parallel to the flow direction (Fig. 2). Ice appears to be in contact with the bed everywhere. In many lee-side locations, however, the rock is lighter in colour, perhaps indicating chemical deposition of solutes in water-filled cavities, probably during summer. For safety reasons, access to the bed is restricted to (winter) months when subglacial water flows are minimal.
In 1996 and 1997, the basal ice sequence near the horizontal door consisted of three layers: two layers of debris-laden ice with a clean ice layer in between them. The same sequence was also observed in 1994 by Reference Jansson and PohjolaJansson and others (1996). There was blue ice above this sequence. The lowermost layer in contact with the bed was 0.3–0.6 m thick and contained up to 17% sediment by volume. Sediment content varied widely near the bed. Although most of the basal ice rested on bedrock, in some places there was a thin layer of sediment between the ice and the rock. In 1997, after a hemispherical opening was made above the shaft, a wet layer of till, 5–10 mm thick, oozed out between the bed and the basal ice. An analysis of the particle-size distribution of a debris-rich ice layer, collected during an earlier field effort in a tunnel from the horizontal entrance, can be found in Reference Hooke and IversonHooke and Iverson (1995).
Apparatus
The instrumented panel which we installed at the top of the shaft was a block, 0.6 × 0.6 m and 0.2 m high, with a flat-topped concrete cone in its center (Fig. 4). Initially, the cone was 0.15 m high, 0.25 m in diameter at its base and 0.05 m in diameter at its top. Figure 5a–c show various cross-sections through the panel. The panel was built on an internally braced square frame consisting of stainless-steel plates 6.3 and 12.6 mm thick. Five stainless-steel tubes were welded to the frame, one in the center and four others positioned in a circle around the cone perimeter. These tubes were designed to strengthen the cone and to illuminate the basal ice, as each tube contained, near the top, a halogen lamp mounted on a rigid wire. The tubes were sealed on top by quartz-glass windows with O-rings. Two stainless-steel enclosures for video cameras, one on either side of the cone structure, were welded to the frame. The video enclosures were also sealed by thick quartz-glass windows with O-rings, and were accessible from the bottom for positioning and adjusting the cameras. Halogen lamps, one on either side of each camera, provided illumination. The enclosures protruded 55 mm above the base of the panel so that the field of view included the top of the conical obstacle (see Fig. 5c). To pour the concrete, a fiber-glass mold, shaped to the cone’s dimensions with two ridges for the video enclosures, was fit on top of the frame, which was then flipped upside down and filled with concrete. The cone, ridges and upper surface of the panel in contact with the bed were made of a heavy concrete with abrasion-resistant basalt aggregate. The remainder of the frame was filled with a lightweight concrete. Epoxy thickened with colloidal silica was used to coat the top surface of the panel for a smooth finish and to harden the surface of contact with the ice.
Panel on polished stainless-steel plate (ssp) resting on hoisting table (tbl). Upper segments of removable legs are visible beneath the table. ch is a camera housing, lc points to the load cell on the down-glacier side of the panel, and lb points to two lubricated flat-head bolts on the side of the panel.

(a) Top view of panel showing inside components. (b) Cross-section of panel and shaft along axis of symmetry. (c) Cross-section perpendicular to axis of symmetry. Diagonal hatching indicates stainless steel. Double-headed arrows indicate lubricated surfaces.

To install the panel, a cavity was first made in the basal ice above the shaft. The panel was then positioned on a polished stainless-steel plate on top of the table (Fig. 4) and was hoisted to the top of the shaft. The narrow 6 mm gap between the shaft and the panel was covered with a steel plate and rubber gasket.
Normal stress
Two calibrated vibrating-wire pressure transducers attached to the tube in the center of the panel (Fig. 5b) were used to measure normal stresses on the stoss and lee sides of the cone. These pressure transducers have a fluid-filled platen that extends from their body. Under an applied load, the pressure increase in the fluid is transmitted to the vibrating wire inside the body of the instrument. The platens were embedded in the abrasion-resistant concrete and were no more than 5 mm beneath the cone surface. As the concrete cured, it was kept moist to prevent shrinkage. This insured a good contact between the platens and the concrete. After complete curing, the pressure transducers were tested with dead weights. The concrete is sufficiently thin above the platens that an accurate normal force is recorded regardless of the angle of the loading force on the cone. Thus, given the high resolution (6 kPa) and accuracy (±17 kPa), the error for these measurements should be <10%.
Bed-parallel force
A calibrated load cell with three vibrating wires was mounted horizontally on the down-glacier side of the panel (Fig. 5a and b). Once the panel was in place in the shaft, and ice moved over the panel, this load cell was pressed against the wall of the surrounding shaft and recorded the bed-parallel force exerted by the ice on the panel along its axis of symmetry. This force is the sum of the integrated normal stress distribution on the obstacle (the cone and the camera housings) and friction between the ice and the panel.
To reduce friction between the panel and the polished stainless-steel plate, the base of the panel was fitted with polished stainless-steel pads (Fig. 5b and c) lubricated with an 80/20% by weight stearic acid/glycerine mixture. Flathead stainless-steel bolts with heads lubricated with the same mixture (Figs 4 and 5a and b) extended about 2 mm out from the vertical sides of the panel to reduce friction between the panel and the frame. The stearic acid/glycerine mixture was used because of its low friction coefficient at high loads (Reference Labuz and BridellLabuz and Bridell, 1993). Experiments done in a laboratory cold room indicated that, at the expected load and temperature, the coefficient of friction between the pads and the panel was 0.04 ± 0.02 for uncontaminated lubricant, and 0.10 ± 0.05 for lubricant that was contaminated with a small amount of grit. The latter value is used in subsequent calculations because, during the field experiments, water containing fine sediment melted from the basal ice above the shaft and dripped onto the polished plate. The static coefficient of friction is used rather than the usually smaller dynamic one. Experimental observations by Reference Scholz and EngelderScholz and Engelder (1976) have indicated that the static friction coefficient increases with the logarithm of time as asperities are pressed into their substrate. It is likely, therefore, that the grit was pressed into the metal pads during essentially stationary contact, resulting in increased static friction.
Temperatures
Sixteen miniature bead thermistors, calibrated to ±0.02°C were used to record temperatures. Temperature gradients, heat fluxes and melt rates were calculated from these measurements. Each thermistor was attached with epoxy to a small hollow Teflon tube that was glued to the stainless-steel frame (Fig. 5a–c). Eight of these thermistors were located in the cone and arranged in such a way that heat fluxes normal to the cone surface could be calculated at four equally spaced locations around the cone perimeter, at about two-thirds the vertical distance up from the base of the cone. The thermistors closest to the surface of the cone were separated from the ice by about 2 mm of concrete, while the others were 33 mm deeper. The remaining eight thermistors were divided into two sets of four. Each set was attached to one side of the camera housing and embedded in the concrete at various depths within the panel to estimate the vertical heat flux.
Ice speed at the bed
The video system was initially designed to measure the velocity of markers inserted in the basal ice. Because of large amounts of debris, however, it was impossible to see more than a few millimeters into the ice. Therefore, the two video cameras recorded ice speed above the quartz-glass plates only. During the experiments, the cameras recorded for 3 s every 10 min to minimize heat input from the halogen lamps to the panel and basal ice. Images were recorded on videotape and then digitized using a single frame from each 3 s sequence. From this compilation of images the motion of about 20 small debris particles in the ice could be observed. According to Reference HalletHallet’s (1979) theory, small particles should move at nearly the same speed as the surrounding ice because they exert very small contact forces on the bed with commensurately low friction. Hence, the average speed of these particles should essentially equal the ice speed at the bed. Owing to low image resolution, however, the uncertainty is ±20%.
Sliding speed
To estimate the ice speed higher above the bed, we inserted a wooden dowel, 70 mm long, into the basal ice through a borehole in the bedrock between the tunnel and the glacier bed. The intersection of the borehole with the ice/bedrock interface was about 2 m upstream from the shaft. We drilled a hole in the ice 0.5 ± 0.1 m above the bed and inserted the dowel attached to a cable so that the center of the dowel was about 0.45 ± 0.1 m above the bed. As the dowel and cable were pulled by the moving ice, we recorded the upward motion of the cable from the tunnel into the borehole as a function of time. This provided an indirect measurement of the ice speed above the bed. Inspection of the bed near the shaft revealed that our obstacle, protruding 0.15 m above the bed, was the largest roughness element. Hence, we call this measurement the sliding speed, although this may differ from the sliding speed associated with larger-scale perturbations in bedrock topography. This small-scale sliding speed is needed in the numerical model used to estimate the basal ice rheology (see Reference CohenCohen, 2000).
Measurements
We performed three experiments over two field seasons. During the periods 25–30 April 1996 (experiment 1) and 9–18 November 1997 (experiment 2), the conical obstacle was 150 mm high. The panel was removed after each of these experiments. During the period 19–24 November 1997 (experiment 3), the cone height was cut to 100 mm in an attempt to change the flow field around the obstacle. The panel was not removed after this last experiment, so no post-experimental observations could be made. In all experiments, temperatures and the output from the load cell and pressure transducers were recorded by two Campbell CR10 loggers every second and averaged over 1 min. Measurements for all experiments are shown in Figure 6.
(a) Normal stresses on cone surface, N1 (stoss) and N2 (lee), (b) Bed-parallel force measured by load cell on down-glacier side of panel. (c) Temperature on cone surface, T1 (stoss) and T2 (lee), (d) Ice velocity. Arrows and square brackets in (a) indicate period of hot-water drilling in horizontal tunnel. In (d) ice speed at the bed measured by video camera is shown by the dotted line. Data points for sliding velocity calculated from dowel position and a linear curve fit are indicated with black triangles and bold line for the uniform velocity model, and by white squares and a thin line for the linear velocity model.

It was originally intended that the sides of the square shaft would be parallel to the direction of ice flow. The plane of symmetry of the panel (the vertical plane dividing the cone in half with camera housing on each side) was oriented accordingly. However, striations on the panel in 1996, and a small narrow cavity on the downstream side of the cone in 1997, indicated that the angle between the axis of symmetry of the panel and the ice-flow direction, ϕ, was 30 ± 10° in April 1996 and 20 ± 5° in November 1997.
Normal stress
Figure 6a shows the stoss (N 1) and lee (N 2) normal stresses. N 1 increased quickly as ice established contact with the panel (this part of the record is missing in experiment 3). In the first experiment, the rapid increase to 1.84 MPa is followed by a gradual decrease to 1.69 MPa, and then a slow but steady increase to a maximum of 1.93 MPa at the end of the experiment. Small variations (up to 5%) are attributed to clasts in the ice impacting on or near the sensor. The values of the mean and standard deviation of N 1 after the initial maximum were 1.82 ± 0.07 MPa. The initial maximum could be attributed to the closure of the small (approximately 0.4 m) hemispherical hole made in the ice above the panel prior to raising the panel into place. This cavity traveled downstream and ice advancing over the stoss pressure transducer may have caused stresses to be higher momentarily. Other measurements at Engabreen, by Reference KohlerKohler (1993), of approximately cylindrical tunnels closing and advancing over load cells mounted in the bedrock, usually also recorded an initial increase in normal load on the bed that was higher than steady-state values.
In experiment 2, after a rapid increase, N 1 was relatively steady until 12 November. The mean value was 2.90 ± 0.03 MPa. Thereafter, ice tunnels melted from the horizontal entrance for an independent experiment by another group disturbed the stress field. Two melting events (indicated in Fig. 6a) caused N 1 to decrease 38% to about 1.8 MPa. By the end of the melting period, several large (about 10 m long and 3 m in radius) tunnels had been opened in the ice. After 15 November, these ice tunnels were kept open at a smaller size (about 2 m high), and N 1 remained relatively steady at about 2.4 MPa. During experiment 3, the tunnels had closed, and N 1 was steady around a mean of 2.41 ± 0.09 MPa. At the end of experiment 3, ice tunnels were again opened. This caused N 1 to drop rapidly.
Normal stresses on the lee side of the cone (N 2) were small (0.1–0.45 MPa) relative to the stoss side, an indication of the dynamic effect of the ice moving over the cone. Lee-side normal stresses showed more relative variation (up to 75%) than stoss measurements, particularly during tunnel opening.
Bed-parallel force
As with the normal stress on the cone’s stoss side, the bed-parallel force increased rapidly as the ice established contact with the panel (Fig. 6b). The mean values after the transient increase were 36.6 ± 1.2 kN, 60.2 ± 1.4 kN and 50.0 ± 2.6 kN for experiments 1–3, respectively.
There was no decrease in the bed-parallel force when the stoss normal stress decreased in experiments 2 and 3. Pre sumably this is because static friction between the panel and the plate beneath prevented the elastic relaxation of the load cell. Hence, the value of the bed-parallel force for that portion of the curve is inaccurate. For the remaining time, however, the error in the mean values is less than ±5%. Owing to friction between the panel and the plate and the oblique ice-flow direction over the obstacle, the estimates of drag on the cone caused by ice flow will have much larger errors.
Temperatures
The temperatures measured by the stoss (T 1) and lee (T 2) thermistors closest to the surface of the cone are shown in Figure 6c. Both temperatures decreased rapidly as ice established contact with the panel. In experiment 1, after the initial drop, both T 1 and T 2 were relatively steady, except for an increase that coincided with a small increase in both normal stresses. The mean and standard deviation for T 1 and T 2 were −0.29 ± 0.01°C and −0.15 ± 0.02°C, respectively. Since these two thermistors are close to the surface of the panel, the temperature there should reflect the equilibrium temperature between ice and water, which is depressed by pressure (normal stress in the case of the cone surface) and solute concentration. Our measurements indicate that stoss-side temperatures were lower than lee-side, consistent with higher normal stress there.
Ice speed at the bed
In 1996, the average speed at the bed recorded by the cameras was about 70 mm d−1 (Fig. 6d). The 1.5 day record shows some variability and a decreasing trend, although these changes may not be significant as they are smaller than the precision of the measurements (±20%).
In 1997, a thin layer of ice-free sediment covered the windows shortly after the beginning of experiment 2. The speed of sediment particles in this layer was constant at about 25 mm d−1. During that experiment, temperatures recorded in the shaft were higher than in 1996 (because of hot-water drilling) and this may have increased the rate of ice melting above the panel and caused the formation of the sediment layer. The panel, however, was not entirely covered by this sediment layer, as was revealed by observations after it was lowered. We presume that the low speed of the sediment particles was not representative of the average ice speed at the bed. During experiment 3, increased temperature and humidity in the tunnel caused water to condense on the quartz-glass plates. The resulting poor quality of the video recordings made it impossible to calculate an ice velocity.
Sliding speed
In 1997, we recorded the motion of the cable attached to the wooden dowel. In order to calculate the sliding speed from the motion of the wire, a velocity profile in the ice had to be assumed. Two possible end-member profiles are: (A) a uniform plug flow and (B) a linear velocity profile with zero speed at the bed. We neglect regelation past the wire, as tension in the wire due to friction at the borehole lip should be negligible. Hence, the wire behaved as a passive marker. Figure 7 shows the position of the dowel for these two cases after a fixed amount of wire was pulled up in the borehole. The distance traveled by the dowel is greater for B than for A. The absence of small-scale bed roughness, small ice–bed friction at the bed (discussed below) and a measured non-zero velocity at the bed suggest that the velocity profile is likely to be closer to A than to B, except at the very beginning of the experiment when the wire is still hanging loose in the hole in the ice.
Diagram showing initial position of dowel and wire after insertion in the hole and two possible configurations after a fixed time. In both configurations, the wire has moved the same distance. (A) Uniform ice velocity. (B) Linear velocity profile.

Figure 6d shows the sliding velocity calculated using both velocity models. The dowel was inserted during experiment 2 at 0000 h on 11 November. Initially, the sliding speed, better approximated with model B, was about 140 mm d−1. It then decreased rapidly to about 30 mm d−1 (regardless of the velocity model used), probably because of the tunneling that began that same night. This decrease in sliding speed also coincided with the decrease of N 1. The higher initial sliding speed is assumed to be the steady-state value associated with conditions prior to the aforementioned tunnel opening.
During experiment 3, the sliding speeds calculated with the two velocity models do not differ significantly. For model A, the sliding speed was 120 ± 18 mm d−1, while for model B it was 138 ± 55 mm d−1. The higher error for model B is due to the poorly constrained initial height of the dowel above the bed (0.45 ± 0.1 m), which is not a parameter needed to calculate the sliding speed using model A. These sliding speeds are much less than the surface velocity of 800 mm d−1. The speed measured at the ice/bed interface in experiment 1 was even smaller (70 mm d−1), owing to the presence of the obstacle.
Discussion
Variations in normal stress and ice velocity, 1996–97
In April 1996, the stoss normal stress, Ni, was 1.82 MPa, which is substantially smaller than in November 1997 (2.90 and 2.41 MPa in experiments 2 and 3, respectively). Two factors could be responsible for this: in 1997 the sliding speed was apparently faster, and the ice-flow direction was less oblique to the panel’s axis of symmetry. The thickness of the basal, sediment-laden ice layer was apparently not a factor, because, although the layer was twice as thick in 1997 as in 1996, in both cases the cone was immersed fully in it.
Assuming the ice flowing past the obstacle is in steady creep and behaves as a viscous power-law fluid with a flow law
![]() , where
, where
![]() is the effective strain rate and
is the effective strain rate and
![]() is the effective stress (D and S are the strain-rate and deviatoric-stress tensors), then, from dimensional analysis, the normal stress difference, ΔN = N
1 − N
2, for steady flow past the obstacle scales with
is the effective stress (D and S are the strain-rate and deviatoric-stress tensors), then, from dimensional analysis, the normal stress difference, ΔN = N
1 − N
2, for steady flow past the obstacle scales with

where v 0 is the sliding speed and h 0 is the height of the obstacle. We assume steady creep, since, owing to high stresses on the obstacle, the transient creep phase should last only a few hours (Reference JackaJacka, 1984), whereas ice takes >1 day to pass the obstacle. Since n > 0, an increase in sliding speed always causes an increase in normal stress difference. This agrees with our observations in 1996 and 1997. Furthermore, as the ice-flow direction approaches the axis of symmetry of the panel, the stoss pressure transducer should record higher stresses. Again, this is consistent with our observations. Despite these effects, it is possible that the combined effect of the different flow direction and increase in sliding speed was not sufficient to account for the higher normal stress recorded in 1997. The higher stress may have been caused by a higher value in the pre-exponential factor B. The increase in B can be estimated from the measurements (to estimate absolute values of B, however, requires a numerical model of ice flow past the obstacle (see Reference CohenCohen, 2000)). For two measurements ΔN (1) (1996) and ΔN (2) (1997, experiment 2), the relation between B (1) and B (2) is

For ΔN (1) = 1.8 − 0.10 = 1.7 MPa, ΔN (2)= 2.9 − 0.3 = 2.6 MPa, v 0 (1) = 70 mm d−1, v 0 (2) = 144 mm d−1, h 0 (1) = h 0 (2), and assuming n = 3 we obtain B (2) = 1.2 B (1).
This 20% increase in B can easily be attributed to changes in debris concentration or water content in the basal ice. Reference DuvalDuval’s (1977) experiments show that a 1% increase in water content could decrease the value of B by 30%. The effect of sediment concentration on B is not as well known, but laboratory experiments on artificial ice and natural glacier ice (Reference Hooke, Dahlin and KauperHooke and others, 1972; Reference Baker and GerberichBaker and Gerberich, 1979; Reference Nickling and BennettNickling and Bennett, 1984; Reference LawsonLawson, 1996) demonstrate a dependence. At Engabreen, debris concentration fluctuated widely over several decimeters along a flow path. Sometimes the changes were quite abrupt. (These observations disagree with those of Reference Jansson and PohjolaJansson and others (1996)) These fluctuations could have caused a change in effective viscosity large enough to be detected by our measurements.
Average normal stress
For slow viscous flows (Stokes flow) past symmetrical objects, the increase in pressure (or normal stress) on the upstream side is equal and opposite to the decrease in pressure on the downstream side because the flow is completely symmetric and reversible with respect to the axis of symmetry of the object (cf. Reference BatchelorBatchelor, 1967, p. 230). Hence, the average of the upstream and downstream normal stresses at equal distances from the axis of symmetry should equal the far-field (hydrostatic) pressure. This should apply to our experiments, since the obstacle was almost symmetrical (neglecting the camera housings). However, the average measured normal stress
![]() was about 1.0, 1.6 and 1.4 MPa during experiments 1–3, respectively. These values are smaller than the hydrostatic pressure expected beneath 210 m of ice (1.9 MPa). Other measurements nearby (Reference KohlerKohler, 1993) have recorded normal stresses of 1.4–2.2 MPa near the shaft. This wide range of values, all within several meters of the shaft, is attributed to disturbances of the local ice flow by large-scale irregularities in the bed surface. In fact, the panel is on a surface that slopes about 10° down-glacier. Hence, it is not surprising that the average normal stresses there were so low. Finite-element calculations (Reference CohenCohen, 2000) indicate that the asymmetry caused by the camera housings cannot be responsible for such a discrepancy.
was about 1.0, 1.6 and 1.4 MPa during experiments 1–3, respectively. These values are smaller than the hydrostatic pressure expected beneath 210 m of ice (1.9 MPa). Other measurements nearby (Reference KohlerKohler, 1993) have recorded normal stresses of 1.4–2.2 MPa near the shaft. This wide range of values, all within several meters of the shaft, is attributed to disturbances of the local ice flow by large-scale irregularities in the bed surface. In fact, the panel is on a surface that slopes about 10° down-glacier. Hence, it is not surprising that the average normal stresses there were so low. Finite-element calculations (Reference CohenCohen, 2000) indicate that the asymmetry caused by the camera housings cannot be responsible for such a discrepancy.
Disturbances caused by opening of tunnels
In 1997, as noted, hot-water tunneling was needed several times for an independent experiment. During experiment 2, the tunnel closest to the shaft was about 3 m in radius and extended 10 m out from the horizontal entrance. It was about 8 m east-southeast from the shaft. N 1 and the ice speed recorded by the dowel decreased as this tunnel was melted. At the end of experiment 3, another tunnel reached a point about 5 m south of the panel and caused N 1 to decrease rapidly. No record of sliding speed was available from that time period.
We can analyze the changes in N 1 and sliding speed using Reference NyeNye’s (1953) theory for the closure of hemispherical holes (tunnels) in a viscous medium. As a new tunnel is created, both stresses and sliding speed near the obstacle are perturbed because of the proximity of the free surface. Sliding speed should change because of the component of flow toward the tunnel due to closure. For a tunnel upstream of the panel, the apparent sliding speed over the panel should decrease, and conversely for a tunnel downstream. For a tunnel to the side of the panel (as in experiment 2), the component of flow along the axis of symmetry of the panel should decrease due to redirection of ice laterally. A decrease in this component of sliding would cause N 1 to decrease and vice versa. Complicating the situation further, the presence of tunnels can either increase or decrease the circumferential normal stress depending on the value of n. According to Nye’s theory, this normal stress should decrease for n > 1.5, neglecting stresses other than those due to tunnel closure. The radial normal stress near the tunnel, however, always decreases regardless of the value of n and is zero at the free surface. Since N 1 is measured at about 45° from the horizontal, fluctuations in N 1 due to tunnel opening should vary with the average of the circumferential and radial normal stresses.
These expectations agree qualitatively with our observations if we assume n > 1.5. During experiment 3, the tunnel was obliquely downstream of the panel, and the sliding speed over the panel should have increased, thereby increasing N 1. However, N 1 was observed to decrease by about 13%. This is possible if the decrease of N 1 due to n > 1.5 overwhelmed the increase in N 1 due to faster sliding speed. Assuming n = 3, the drop in N 1 due to the presence of the tunnel is about 30%. The increase in sliding speed due to tunnel closure is about 15%, which results in an increase in N 1 of about 5%. The net effect is a decrease in N 1, which is consistent with our observations. During experiment 2, the tunnel was to the side of the panel: measured sliding speed parallel to the axis of symmetry of the panel decreased and presumably caused N 1 to decrease. In addition, N 1 could have also decreased because n was >1.5. Our measurements indicate that N 1 dropped 38%. Again assuming n = 3, the decrease in N 1 due to the tunnel is about 30%. The component of velocity toward the tunnel is about 26 mm d1, at an angle of about 120° from the undisturbed flow direction, causing the ice speed to drop from 140 mm d−1 to about 130 mmd−1 (this is still much higher than the recorded low speed of 30 mm d−1 by the dowel). This drop in sliding speed would cause a drop in N 1 of only a few additional percent. Again, all these calculations are consistent with the observed drop in N 1. These calculations are, however, subject to large uncertainties, particularly the speed due to tunnel closure, which is proportional to (for n = 3) the cube of the distance from the center of the tunnel to the panel, and inversely proportional to the square of the tunnel radius, both of which are not well constrained. Further, the values of these exponents depend on tunnel geometry. Therefore, a compete (analytical) explanation of the effect of tunnel closure and an attempt to estimate the value of n from the measurements would be purely speculative.
Coupling between temperature and normal stress
At static equilibrium, the temperature T in temperate ice is given by (neglecting effects of vein curvature)
where p is the pressure, m
s is the solute molality, and T
0 and p
0 are the temperature and pressure at the triple point.
![]() for air-free ice and 0.098 K MPa−1 for air-saturated ice, and
for air-free ice and 0.098 K MPa−1 for air-saturated ice, and
![]() . Thus, an increase in pressure or in solute concentration causes a decrease in temperature. For moving ice, the pressure p should be replaced by the maximum compressive normal stress (Reference LliboutryLliboutry, 1993). At the surface of the cone, assuming no interfacial friction between the ice and the cone, this is the normal stress measured by the pressure transducers (N
1 or N
2).
. Thus, an increase in pressure or in solute concentration causes a decrease in temperature. For moving ice, the pressure p should be replaced by the maximum compressive normal stress (Reference LliboutryLliboutry, 1993). At the surface of the cone, assuming no interfacial friction between the ice and the cone, this is the normal stress measured by the pressure transducers (N
1 or N
2).
Details of the temperature T 1 (the thermistor closest to the cone surface) and normal stress N 1 on the stoss side of the cone during experiments 1–3 are shown in Figure 8. In 1997 (Fig. 8a and b), increases in temperature coincide with decreases in normal stress, on both short and long time-scales, as predicted by Equation (3). In 1996, however, on two occasions (1700 h on 26 April, and 2200 h on 27 April), both pressure and temperature increased, and on a third occasion (1100 h on 28 April), both decreased, contrary to expectation. One possible explanation for the first two events is that the asperity of a large clast came into contact with the obstacle near the stoss pressure transducer, suddenly increasing the normal stress there but releasing the stress on adjacent areas. The temperature above the pressure transducer would then increase.
Temperature, T1, and stoss normal stress, N1, in (a, b) 1997 and in (c) 1996. Arrows in (c) indicate event when both normal stress and temperature either increased or decreased.

It is tempting to try to estimate solute molality, m s, from the measurements of T and N on both sides of the cone. However, results from such calculations are difficult to interpret because the temperature and the normal stress were not recorded at exactly the same location on the cone surface. Finite-element calculations (Reference CohenCohen, 2000) indicate that normal stress increases rapidly near the tip of the cone. Hence, the normal stress above the stoss thermistor may have been much higher than the normal stress recorded by the stoss pressure transducer.
Melt rates
Figure 9 shows melt rates on the stoss and lee sides of the cone and the vertical melt rate. Melt rates on the cone are calculated using the temperature gradient between the surface thermistors and the ones immediately below (Fig. 5c). Vertical heat fluxes are calculated using the temperatures measured by thermistors positioned in vertical strings in the concrete panel. The thermal conductivity of the basalt aggregate concrete is 2 J m−1 s−1 K−1, whereas that of the lightweight concrete is 0.85 J m−1 s−1 K−1 (Reference NevilleNeville, 1996, table 8.1).
Melt rates on the stoss and lee sides of the cone, and vertical melt rate in the panel.

In 1996, during the unperturbed 2 day record of 26–28 April, melt rates were about 1.5 and 0.4 mm d−1 on the stoss and lee sides of the cone, respectively. These values are point measurements and are not averages over the cone surface. The fact that they both indicate melting should not be surprising, as heat from the tunnel overwhelms heat flow through the cone associated with regelation. Thermistors in the panel suggest a slightly higher vertical melt rate of, at most, 3 mm d−1 during the same period.
Only vertical melt rates were obtained in 1997 owing to the failure of several thermistors in the cone. During experiment 3, the average vertical melt rate was about 4 mm d−1. Although higher than in 1996, this is still < 5% of the sliding speed. During experiment 2, higher temperatures were recorded in the panel because the hot water being used nearby raised temperatures in the tunnel system. As a result, vertical melt rates occasionally reached 15–20% of the sliding speed.
In the panel, heat flow should be concentrated in the stainless-steel members because of their high thermal conductivity. There are, however, no steel members that go directly from one side of the cone to the other, and only the outside frame, the tubes in the cone and the camera housings connect the bottom of the panel to its top. This represents 10% of the surface area of the panel in contact with the ice. The heat flux through the portion of the frame made of steel can be estimated by assuming that the temperature distribution in the steel is linear, from about 1.5°C at the bottom of the panel (temperature measured in the tunnel in 1996) to 0°C at the top. Then, the rate of melting of ice is about 90 mm d−1. We can recalculate the average vertical melt rate over the panel by multiplying the melt rates over the steel and concrete portions of the panel by their respective surface areas. Except during experiment 2, we obtain about 13 mm d−1. This is only about 10% of the sliding speed.
A small cavity formed in the lee side of the cone in experiment 2, presumably because of the higher melt rate in that experiment. This cavity was about 2 mm deep and 10 mm wide and extended from the top of the cone to near the base. This indicated that the rate of melting exceeded that of closure. When melt rates were lower, as in 1996, no cavity was observed. Thus, this cavity was not related to the dynamics of ice flow past the obstacle: finite-element calculations (Reference CohenCohen, 2000) indicate that no cavity should form on the lee side of the obstacle.
These results show that vertical melt rates and melt rates across the cone were small relative to the sliding speed. Hence, both regelation and flow due to vertical melting were negligible in comparison with viscous deformation past the obstacle. This agrees with present sliding theories in which regelation is shown to be negligible for obstacles larger than the transition size (the size at which regelation and viscous flow are both equally important). For our obstacle size and sliding speed, sliding theories indicate that the transition size should be about 50 mm (Reference LliboutryLliboutry, 1979).
Bed-parallel force
The bed-parallel force measured by the load cell on the down-glacier side of the panel represents combined contributions from the integrated normal stress over the obstacle and friction between the ice and the panel. In order to obtain the true bed-parallel force on the panel, the measured force must first be corrected for friction between the panel and the polished plate upon which it rests, for friction between the panel and the frame of the shaft and for the misalignment of the load cell with respect to the flow direction. Figure 10 shows the forces acting on the panel. A force balance yields

where ϕ is the angle between the axis of symmetry of the panel and the ice-flow direction, ψ is the angle between the ice-flow direction and the bed-parallel force (ψ ≠ 0 because ϕ ≠ 0), and μ is the friction coefficient between the panel and the plate, taken to be 0.1 as noted. Fz
is assumed to be
![]() , where A = 0.36 m2 is the horizontal projection of the surface area of the panel. Table 1 gives the values of F
// for the three experiments. The friction between the panel and the frame of the shaft, which appears in Equation (4) as a correction to the numerator (l − μ
2) and to the denominator (−μ sin(ϕ + ψ)) is negligible since μ = 0.1 and ϕ + ψ < 45°. Unfortunately, friction between the panel and the stainless-steel plate (the term μFz
) is not negligible, and accounts for up to 45% of F
//. Owing to the uncertainty in μ, the uncertainty in F
// is about 25%.
, where A = 0.36 m2 is the horizontal projection of the surface area of the panel. Table 1 gives the values of F
// for the three experiments. The friction between the panel and the frame of the shaft, which appears in Equation (4) as a correction to the numerator (l − μ
2) and to the denominator (−μ sin(ϕ + ψ)) is negligible since μ = 0.1 and ϕ + ψ < 45°. Unfortunately, friction between the panel and the stainless-steel plate (the term μFz
) is not negligible, and accounts for up to 45% of F
//. Owing to the uncertainty in μ, the uncertainty in F
// is about 25%.
Angle between axis of symmetry of panel and ice-flow direction, ϕ, angle between axis of symmetry of panel and bed-parallel force,ψ, bed-parallel force measured on panel, F m , estimated frictional force between panel and polished plate, μ> Fz, true bed-parallel force on panel, F//, and basal shear stress on panel, τb

Top view of forces on panel. Bold font indicates a vector; light font indicates a force magnitude.
F
// is the bed-parallel force exerted by the ice on the panel.
F
m
is the measured force on the load cell on the down-glacier side of the panel.
f
r
is the reaction force on the other contact points between the panel and the surrounding frame.
f
μ is the frictional force between the panel and the underlying table (assumed to be parallel to
F
// and proportional to the vertical load, fμ = μFz).
![]() and
and
![]() are the frictional forces at the contact points between the panel and the frame.
are the frictional forces at the contact points between the panel and the frame.

The basal shear stress on the panel (τ b = F ///A) is also shown in Table 1. It ranged from 220 to 350 kPa. Although these are very local measurements, it is interesting to compare them with the driving stress, τ d = ρgH sin α, where ρ is the ice density, g is the acceleration of gravity, H is the glacier thickness and α is the surface slope of the glacier. With ρ = 917 m kg−3, H = 210 m and α = 10°, τ d = 330 kPa. That τ b ≈ τ d is fortuitous: our measurements reflect processes at the scale of the panel (1 m), while τ d is a quantity that has meaning at the scale of several glacier thicknesses (1 km).
Ice-panel friction
As mentioned, the calculated bed-parallel force on the panel is the sum of the integrated normal stresses on the obstacle and friction between the basal ice and the panel. It would be of interest to calculate the contribution from each of these. The measurements of normal stresses on the stoss and lee sides of the cone could be used to estimate the drag due to ice flow. However, because these measurements are local and are not centered on the axis of flow, they are not sufficient to completely describe the normal stress distribution on the cone. Instead, we estimate friction indirectly from Hallet’s (1979) abrasion model. In this model, the frictional force f p between the bed and a particle in the ice is proportional to the drag on the particle due to creep and regelation of ice around it as ice moves toward the bed due to basal melting and bed-parallel extension. Neglecting the buoyant weight of particles, which should be small for the small grains considered, and assuming basal melting accounts for all of the ice velocity normal to the bed, this force is

where μ is the friction coefficient between the sediment particle and the panel, η is the effective ice viscosity, R is the radius of the particle, R ⋆ is the transition particle size, v n is the basal melt rate and f accounts for the bed as a heat source and rigid boundary (Reference HalletHallet, 1981). Experiments (Reference IversonIverson, 1990) as well as numerical models (see references in Reference HalletHallet, 1981) indicate that f is about 2. The non-linear flow relation of ice can be accounted for (personal communication from B. Hallet, 1992), approximately, with the theory of Reference Lliboutry and RitzLliboutry and Ritz (1978). For n = 3, we have

where k is the average thermal conductivity of ice and rock, and L is the latent heat per unit volume of ice.
![]() (
(
![]() was defined in Equation (3)). By summing the contribution from all the particles on the panel, one can obtain the total frictional force on the panel. We use the size distribution of the sediment layer between the ice and the bed measured by J. Bogen (Reference Hooke and IversonHooke and Iverson, 1995) as an estimate of the size distribution of particles in the ice and in contact with the bed. We also assume that the areal debris concentration on the bed is 30% (the upper limit of Hallet’s model), a reasonable value for a sediment concentration of 15% by volume. This areal debris concentration is the fractional area of the bed obtained by projecting onto the bed the cross-sectional areas of the particles in contact with the bed. Using μ = 0.6 for the coefficient of friction for gneiss (Reference Jaeger and CookJaeger and Cook, 1979, table 3.3.1), B = 3.0 × 10⁷ Pa s1/3 (Reference CohenCohen, 2000) and the average melt rate of 13 mm d−1 calculated earlier, the frictional force on the panel was 4 kN. This is < 5% of the total bed-parallel force on the panel. Although Hallet’s model is a simplification of the interactions between particles and the bed, this calculation suggests that friction is small between the ice and the bed, in accordance with present sliding theories. Furthermore, this calculation does not use many parameters that are specific to Engabreen, and those that are, are still reasonable estimates for other glaciers. Hence this observation may have more global application. This observation, however, diverges from observations by Reference Engelhardt, Harrison and KambEngelhardt and others (1978) and Reference Boulton, Morris, Armstrong and ThomasBoulton and others (1979).
was defined in Equation (3)). By summing the contribution from all the particles on the panel, one can obtain the total frictional force on the panel. We use the size distribution of the sediment layer between the ice and the bed measured by J. Bogen (Reference Hooke and IversonHooke and Iverson, 1995) as an estimate of the size distribution of particles in the ice and in contact with the bed. We also assume that the areal debris concentration on the bed is 30% (the upper limit of Hallet’s model), a reasonable value for a sediment concentration of 15% by volume. This areal debris concentration is the fractional area of the bed obtained by projecting onto the bed the cross-sectional areas of the particles in contact with the bed. Using μ = 0.6 for the coefficient of friction for gneiss (Reference Jaeger and CookJaeger and Cook, 1979, table 3.3.1), B = 3.0 × 10⁷ Pa s1/3 (Reference CohenCohen, 2000) and the average melt rate of 13 mm d−1 calculated earlier, the frictional force on the panel was 4 kN. This is < 5% of the total bed-parallel force on the panel. Although Hallet’s model is a simplification of the interactions between particles and the bed, this calculation suggests that friction is small between the ice and the bed, in accordance with present sliding theories. Furthermore, this calculation does not use many parameters that are specific to Engabreen, and those that are, are still reasonable estimates for other glaciers. Hence this observation may have more global application. This observation, however, diverges from observations by Reference Engelhardt, Harrison and KambEngelhardt and others (1978) and Reference Boulton, Morris, Armstrong and ThomasBoulton and others (1979).
Conclusions
Simultaneous measurements of sliding speed, normal and shear stresses and temperature were obtained as dirty basal ice flowed past an instrumented obstacle installed flush with the bed beneath 210 m of ice at Engabreen. These measurements indicate that:
-
(1) Sliding speed measured 0.45 m above the bed was 130 mm d−1 during periods of steady ice flow. This is 16% of the surface velocity of 800 mm d−1. The ice speed at the ice/bed interface measured with video cameras was 70 mm d−1. This is smaller than the sliding speed recorded higher in the ice, because of the presence of the conical obstacle, which effectively slowed the ice approaching it. Despite debris concentrations of up to 17% in the basal ice, the ice speed at the bed is non-zero, suggesting that the bed is well lubricated.
-
(2) Stoss normal stresses were 1.8–2.9 MPa, and lee normal stresses were < 0.5 MPa. Average normal stresses were 1.0–1.6 MPa, which is less than the ice overburden pressure of 1.9 MPa. This is probably due to local bed topography: the panel was installed in an area of the bed that sloped gently downstream.
-
(3) Normal stresses and temperatures were generally correlated: stresses were higher and temperatures were lower on the stoss side of the cone, consistent with flow dynamics and thermodynamics of ice in equilibrium with water. Decreases in normal stresses usually coincided with increases in temperature, except when clasts presumably came close to or made contact with the panel.
-
(4) Our measurements indicate interannual variations in conditions at the bed. Normal stresses, sliding speed and direction changed significantly. A possible explanation for this is that changes in debris concentration or water content in the basal ice caused local variations in effective ice viscosity.
-
(5) Despite the high sliding speed, no significant bed separation was observed in the lee of the conical obstacle. No separation was observed in the lee of most of the natural bedrock undulations either, although lighter coloration of the rock there indicates that separation may occur sometimes, perhaps during summer.
-
(6) Temperature measurements indicate that regelation was negligible. This is consistent with expectation, as the cone is substantially larger than the controlling obstacle size. Furthermore, vertical melting was only 10% of the sliding speed.
-
(7) Friction between sediment particles in the ice and the panel, estimated from Hallet’s (1979) abrasion model, was about 5% of the bed-parallel force measured on the obstacle. This value, however, is uncertain, as friction theories are largely untested.
-
(8) Disturbances caused by hot-water melting of tunnels in the ice near the site of the experiment caused stoss normal stresses to decrease and, in one case, sliding speed to decrease. These changes are qualitatively consistent with Reference NyeNye’s (1953) theory of tunnel closure in a viscous medium.
Acknowledgements
This project was funded by U.S. National Science Foundation grants OPP-9423422 and OPP-9713383, the Norwegian Water Resources and Energy Administration (NVE) and the Norwegian Research Council. D. Cohen was also supported by a Gibson Fellowship and a Doctoral Dissertation Fellowship while at the University of Minnesota. The instrumented panel was constructed by J. Marquetti and J. Ljungkull from the University of Minnesota electrical engineering machine shop. The design of the panel greatly benefited from their suggestions and from comments by J. Labuz and M. Snyder. We thank M. Snyder for preparing the concrete mixtures, and A. Koubaa for helping cast the concrete. We thank H. Elvehøy, N. Haakensen and D. Nelsen for their help in the field. Comments by J. Meyssonnier, J. Walder and an anonymous referee significantly improved the paper.


