


1. INTRODUCTION
Since the early 1990s, the rate of ice loss from the Greenland ice sheet (GrIS) has accelerated in synchrony with both elevated air temperatures (e.g. Hanna and others, Reference Hanna2008, Reference Hanna, Mernild, Cappelen and Steffen2012b, Reference Hanna2013; Fettweis and others, Reference Fettweis2013) and warmer ocean waters reaching marine margins (e.g. Murray and others, Reference Murray2010; Straneo and others, Reference Straneo2012, Reference Straneo, Hamilton, Stearns and Sutherland2016; Sutherland and Straneo, Reference Sutherland and Straneo2012). The average annual mass loss from the GrIS between 1991 and 2015 was 0.47 ± 0.23 mm SLE (Van den Broeke and others, Reference Van den Broeke2016) and was driven by negative surface mass balance (primarily the result of increased air temperatures, leading to enhanced surface melt) and increasing ice discharge from outlet glaciers (channels of fast flowing ice draining the ice sheet and terminating at a marine margin) (Meier and Post, Reference Meier and Post1987; van den Broeke and others, Reference van den Broeke2009; Post and others, Reference Post, O'Neel, Motyka and Streveler2011). These glaciers contribute to ice loss through enhanced retreat of the calving front (Meier and Post, Reference Meier and Post1987; Pfeffer, Reference Pfeffer2007; Post and others, Reference Post, O'Neel, Motyka and Streveler2011) and associated thinning and accelerated ice motion that further enhances retreat (Van der Veen, Reference Van der Veen2002; Pritchard and others, Reference Pritchard, Arthern, Vaughan and Edwards2009; van den Broeke and others, Reference van den Broeke2009; Enderlin and others, Reference Enderlin2014).
Understanding the patterns of retreat in the northwest and southeast regions of the GrIS is especially important because together, these regions currently contribute over 80% of the ice sheets total annual dynamic discharge (Enderlin and others, Reference Enderlin2014) and are therefore important contributors to ice loss and overall ice-sheet mass balance. Outlet glaciers here have undergone rapid and variable changes in frontal position over the last ~25 years (e.g. Howat and others, Reference Howat, Smith, Joughin and Scambos2008b; Moon and Joughin, Reference Moon and Joughin2008; Howat and Eddy, Reference Howat and Eddy2011; McFadden and others, Reference McFadden, Howat, Joughin, Smith and Ahn2011; Carr and others, Reference Carr, Stokes and Vieli2013; Murray and others, Reference Murray2015). For example, in the southeast, accelerated retreat was detected between the mid-1990s (Rignot and others, Reference Rignot, Braaten, Gogineni, Krabill and McConnell2004) and early 2000s (Howat and others, Reference Howat, Joughin, Fahnestock, Smith and Scambos2008a, Reference Howat, Smith, Joughin and Scambosb; Joughin and others, Reference Joughin2008a; Moon and Joughin, Reference Moon and Joughin2008). Retreat rates in the northwest did not accelerate until after 2005 (Moon and Joughin, Reference Moon and Joughin2008; Howat and Eddy, Reference Howat and Eddy2011; McFadden and others, Reference McFadden, Howat, Joughin, Smith and Ahn2011; Carr and others, Reference Carr, Stokes and Vieli2013; Moon and others, Reference Moon, Joughin and Smith2015; Murray and others, Reference Murray2015), which coincided with a slowdown in retreat rates in the southeast (Moon and Joughin, Reference Moon and Joughin2008; Howat and Eddy, Reference Howat and Eddy2011; Murray and others, Reference Murray2015). Due to the variable nature of the timing and pattern of frontal change in these regions, it has proven to be difficult to isolate the principal controls on retreat. There have been many high spatial resolution studies of glacier terminus behaviour across the northwest and southeast and indeed, the entire GrIS (e.g. Moon and Joughin, Reference Moon and Joughin2008; Howat and Eddy, Reference Howat and Eddy2011; McFadden and others, Reference McFadden, Howat, Joughin, Smith and Ahn2011; Murray and others, Reference Murray2015). However, while large numbers of glaciers have been analysed, no studies have included all glaciers. Furthermore, while Moon and others (Reference Moon, Joughin and Smith2015) analysed the behaviour of a small sample of glaciers in the northwest beyond 2010, other observations of glacier retreat after this year are limited.
Glacier frontal position is controlled by a number of factors. External climatic and oceanic controls (e.g. air temperatures, ocean temperatures and sea-ice concentrations) can enhance retreat (Hanna and others, Reference Hanna2012a). For example, increasing air temperatures promote surface melt, leading to enhanced basal lubrication and accelerated ice velocities (e.g. Zwally and others, Reference Zwally2002; Hanna and others, Reference Hanna2008; Sole and others, Reference Sole2011). Warmer ocean waters in contact with calving margins enhance submarine melting and terminus undercutting, thus enhancing calving and subsequent retreat (e.g. Rignot and others, Reference Rignot, Koppes and Velicogna2010; Straeno and others, Reference Straeno2010; Seale and others, Reference Seale, Christofferssen, Mugford and O'Leary2011; O'Leary and Christoffersen, Reference O'Leary and Christoffersen2013; Luckman and others, Reference Luckman2015; Rignot and others, Reference Rignot2016b; Slater and others, Reference Slater, Nienow, Goldberg, Cowton and Sole2017). The presence of sea ice by contrast can inhibit retreat by suppressing calving activity at the terminus (e.g. Sohn and others, Reference Sohn, Jezek and van der Veen1998; Joughin and others, Reference Joughin2008b; Amundsen and others, Reference Amundsen2010; Carr and others, Reference Carr, Stokes and Vieli2013). Alongside these external controls, large variations in outlet glacier behaviour may also result from glacier-specific factors such as fjord and bed geometry (Pfeffer, Reference Pfeffer2007; Schoof, Reference Schoof2007; Gudmundsson and others, Reference Gudmundsson, Krug, Durand, Favier and Gagliardini2012; Jamieson and others, Reference Jamieson2012; Enderlin and others, Reference Enderlin, Howat and Vieli2013).
Fjord geometry can promote or inhibit retreat (O'Neel and others, Reference O'Neel, Pfeffer, Krimmel and Meier2005; Carr and others, Reference Carr, Stokes and Vieli2013, Reference Carr, Stokes and Vieli2014). A widening fjord causes a glacier to thin; due to the principal of mass conservation, ice thickness reduces to maintain the same ice flux, subsequently weakening the terminus and promoting calving (Jamieson and others, Reference Jamieson2012; Carr and others, Reference Carr, Stokes and Vieli2013, Reference Carr, Stokes and Vieli2014). A widening fjord also reduces lateral stresses between the glacier and fjord wall (Raymond, Reference Raymond1996). This reduces resistance to flow and leads to increasing ice velocities, once again promoting thinning and further calving. Bed geometry can also cause large variations in glacier retreat due to the processes considered by the marine ice-sheet instability hypothesis (Weertman, Reference Weertman1974; Schoof, Reference Schoof2007; Gudmundsson and others, Reference Gudmundsson, Krug, Durand, Favier and Gagliardini2012; Jamieson and others, Reference Jamieson2012). Ice flux is strongly dependent on ice thickness at the grounding line, with increasing ice thickness leading to a higher discharge of ice across the grounding line (Gudmundsson and others, Reference Gudmundsson, Krug, Durand, Favier and Gagliardini2012). If a glacier retreats across a reverse bedrock slope, ice thickness at the grounding line will increase, leading to higher ice discharge. Thickening of the ice also increases the surface area of the terminus that is directly in contact with the ocean (Gudmundsson and others, Reference Gudmundsson, Krug, Durand, Favier and Gagliardini2012; Pętlicki and others, Reference Pętlicki, Cieply, Jania, Prominska and Kinnard2015) enhancing submarine melting at the ice–ocean interface, generating a higher calving flux and accelerated ice discharge (Schoof, Reference Schoof2007; Gudmundsson and others, Reference Gudmundsson, Krug, Durand, Favier and Gagliardini2012). Both processes initiate a negative feedback mechanism that will only stop, theoretically, when a glacier has retreated back to a point where the terminus is no longer in a geometry that promotes retreat. These considerations highlight the potential sensitivity of outlet glaciers to changes in bed geometry and the importance therefore of understanding the variant bed topography across the northwest and southeast GrIS.
While the impacts of glacier-specific controls have been analysed in detail for a few well-mapped fjords (e.g. Porter and others, Reference Porter2014; Rignot and others, Reference Rignot2016a), we do not have an overview or understanding of the role these internal controls play on terminus behaviour on an ice-sheet wide scale. Furthermore, while models of outlet glacier dynamics can reproduce individual glacier behaviour as observed in the field and by satellite remote sensing (e.g. Todd and Christoffersen, Reference Todd and Christoffersen2013; Chapuis and Tetzlaff, Reference Chapuis and Tetzlaff2014; Bondzio and others, Reference Bondzio2016; Slater and others, Reference Slater, Nienow, Goldberg, Cowton and Sole2017), there are still outstanding questions when considering glacier behaviour across greater spatial scales (Goelzer and others, Reference Goelzer, Robinson, Seroussi and van de Wal2017). For example, modelling glacier behaviour requires a knowledge of bed geometry that varies considerably across the ice sheet (Morlighem and others, Reference Morlighem, Rignot, Mouginot, Seroussi and Larour2014, Reference Morlighem, Rignot and Willis2016; Rignot and others, Reference Rignot2016a) and we only have a detailed understanding of a few Greenlandic fjord systems (e.g. Porter and others, Reference Porter2014; Carr and others, Reference Carr2015; Morlighem and others, Reference Morlighem, Rignot and Willis2016; Rignot and others, Reference Rignot2016a). By using these limited observations to scale-up models, it is possible to wrongly assume the principal mechanisms of retreat for outlet glaciers on a regional scale. This uncertainty means that it is difficult to assess the primary controls on retreat over large spatial scales and likely limits our capacity to assess future contributions of outlet glaciers to global sea-level rise and ice-sheet mass balance.
Here, we investigate the timing and magnitude of marine-terminating glacier retreat in northwest and southeast Greenland between 2000 and 2015, using remotely sensed data. We extend the spatial and temporal extent of previous work within these regions to enable a high-resolution analysis of annual frontal position change of all outlet glaciers. We then analyse the impact of fjord and bed geometry on outlet glacier behaviour.
2. DATA AND METHODS
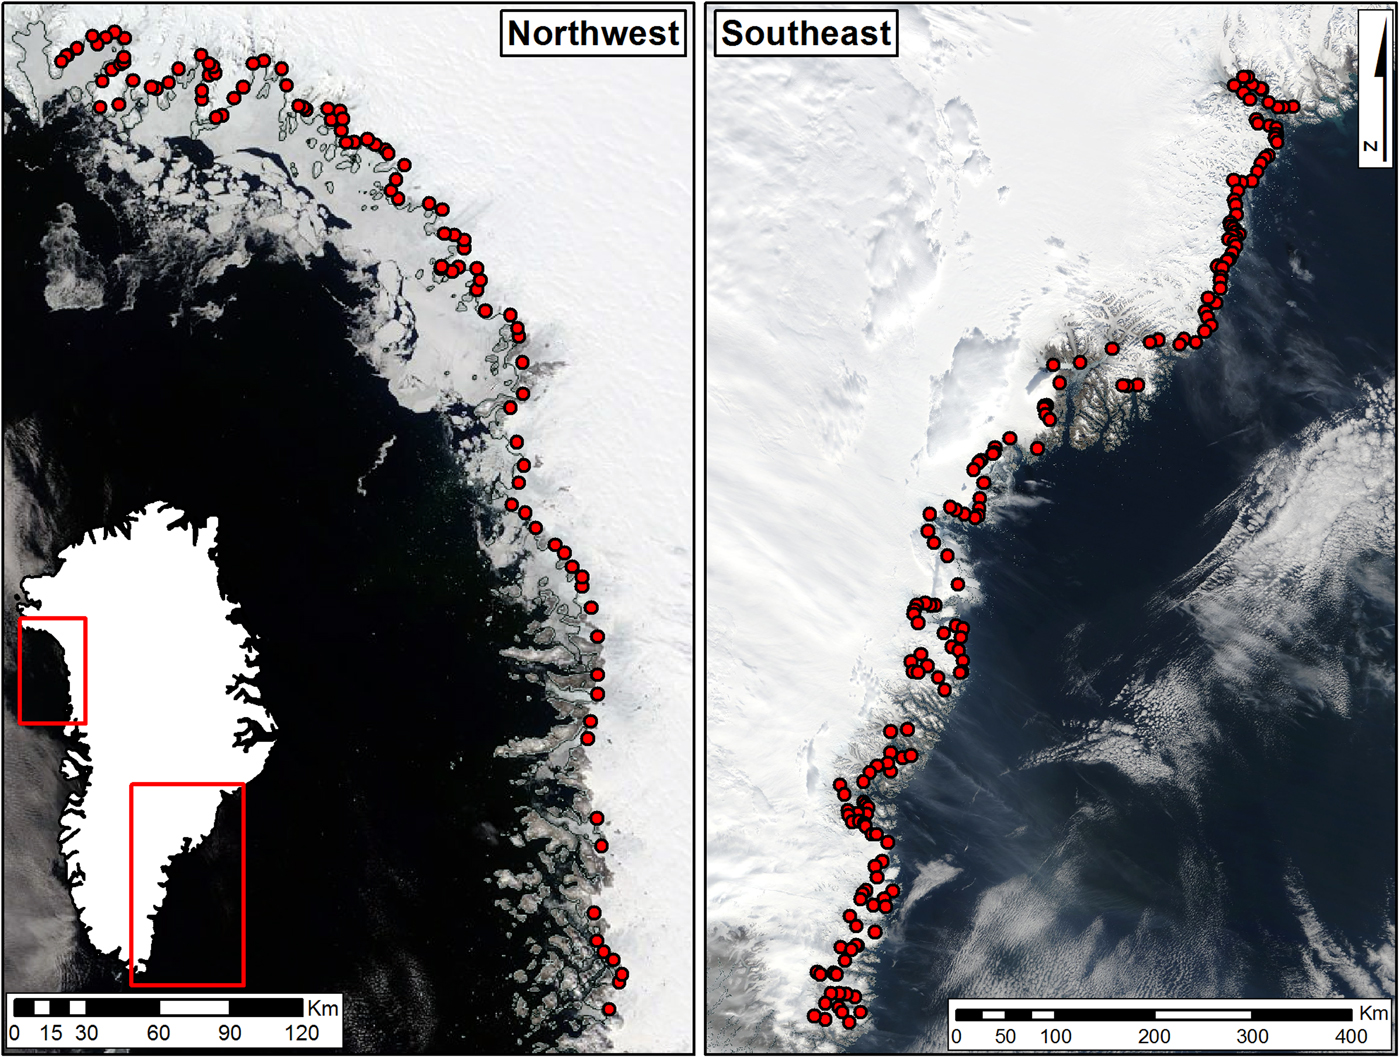
We examined 276 marine-terminating outlet glaciers in the northwest (100) and southeast (176) regions of the ice sheet, at an annual resolution between 2000 and 2015 (Fig. 1). To maintain a high temporal resolution, glaciers were excluded from the analysis if terminus position data were not available for more than 2 consecutive years. This excluded 20 glaciers, 7% of the total dataset and likely has a limited impact on results. After removing these glaciers, we included all outlet glaciers regardless of terminus width, with the exception of two surge-type glaciers (Harald Moltke Brae and Courtaulds Glacier) as these can undergo dynamic changes independent of forcing factors (Murray and others, Reference Murray2015). We analysed individual glacier retreat rates to assess intra-regional variability. We also categorised the glaciers based on bed geometry and fjord planform geometry to determine broad relationships between different common glacier properties and observed retreat behaviour.
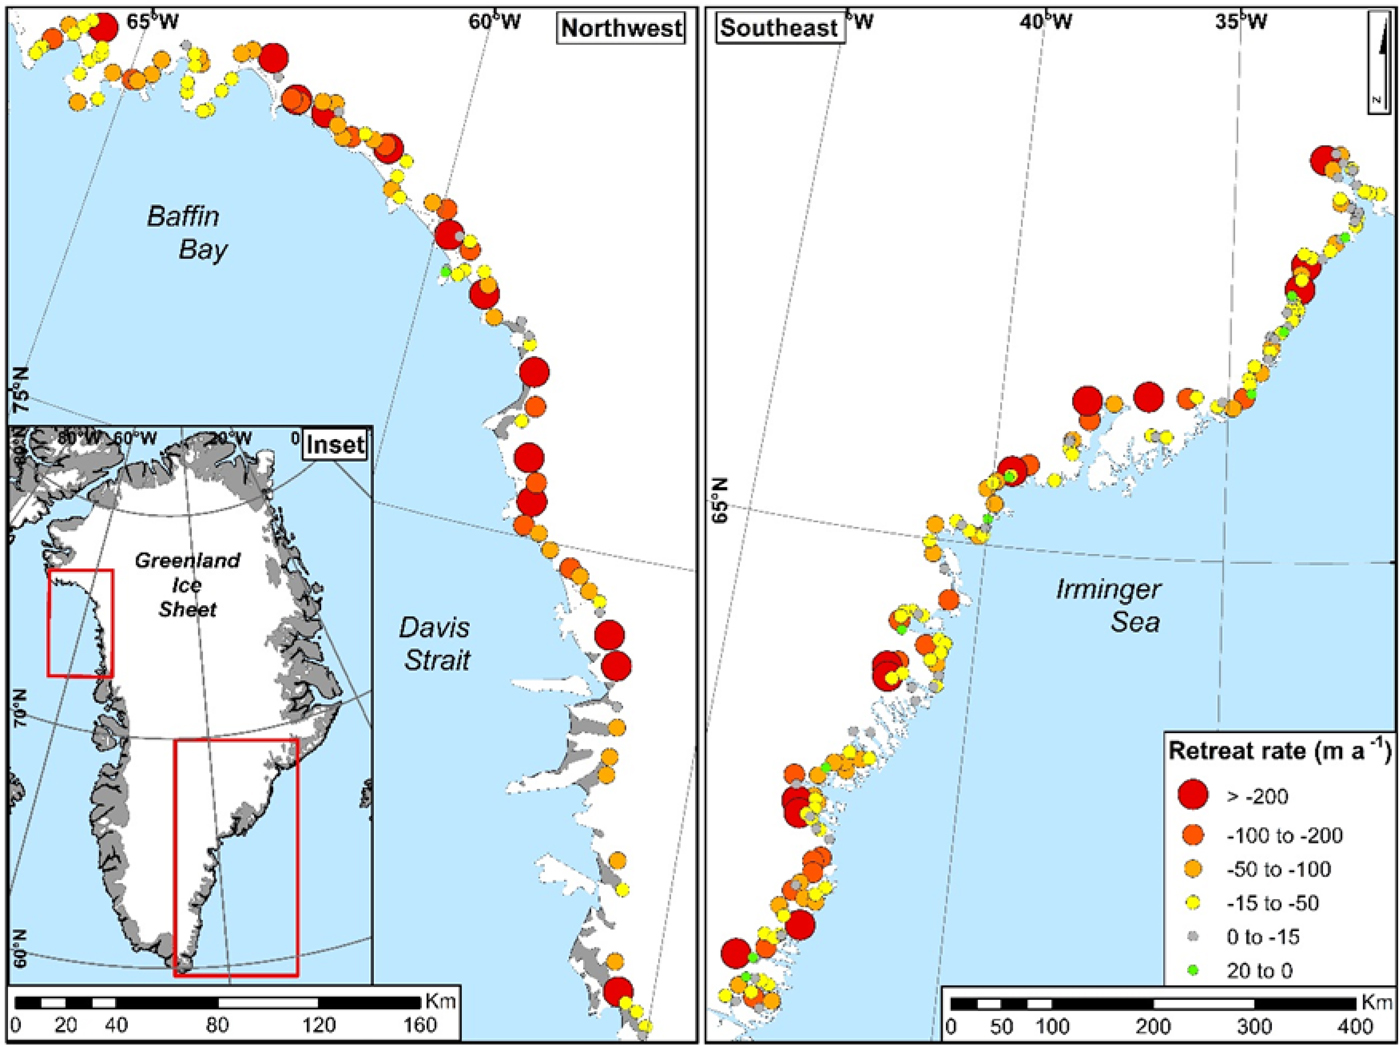
Overview map of the northwest and southeast study areas. Base images are MODIS (Terra) corrected reflectance images available from EOSDIS NASA Worldview (https://worldview.earthdata.nasa.gov/).
2.1. Glacier frontal position
We obtained Landsat 4–5 TM, 7 ETM+ and 8 satellite imagery from the USGS Global Visualisation Viewer (http://glovis.usgs.gov/) and the USGS Earth Explorer (http://earthexplorer.usgs.gov/). Images were acquired annually at 30 m resolution (visible bands 1, 2 and 3), and as close to 31 July as possible. While this may be considered early for a minimum terminus position, this date was also selected based on the image availability criteria; later in the melt season, there was greater cloud cover meaning that more glaciers would have been excluded, thereby decreasing the impact of our results.
Terminus positions were digitised from sequential satellite images, using a fixed-width reference box oriented approximately parallel to ice flow, and joined with an arbitrary reference line up-glacier (e.g. Moon and Joughin, Reference Moon and Joughin2008; Carr and others, Reference Carr, Stokes and Vieli2013). Change in frontal position was calculated by dividing the change in area of the reference box by the width, giving a relative change in annual frontal position and overall mean retreat. This method therefore accounts for the irregularity in the shape of calving margins (Moon and Joughin, Reference Moon and Joughin2008). The largest potential source of error results from manual digitisation of terminus positions and was estimated by repeatedly digitizing sections of rock coastline in both study regions (following Carr and others (Reference Carr, Stokes and Vieli2014)), producing errors of ±9.4 m for the northwest and ±15.3 m for the southeast.
To manage the large dataset and to represent and discuss results, we selected the following categories of retreat rates for glaciers within both regions, based on the overall mean retreat rates that each glacier experiences for the 15-year time period: >−200, −200 to −100, −100 to −50, −50 to −15, −15 to 0 m a−1 and an advancing category of 0–20 m a−1. We analyse the categories within the generated error values with caution and therefore consider glaciers within these margins as exhibiting ‘no discernible change’ (i.e. the 0 to −15 and 0 to 20 m a−1 categories). These categories were selected to ensure that there were over ten glaciers in each category, with the single exception of the advancing category in the northwest as only one glacier advanced in this region during our study period.
2.2. Fjord geometry
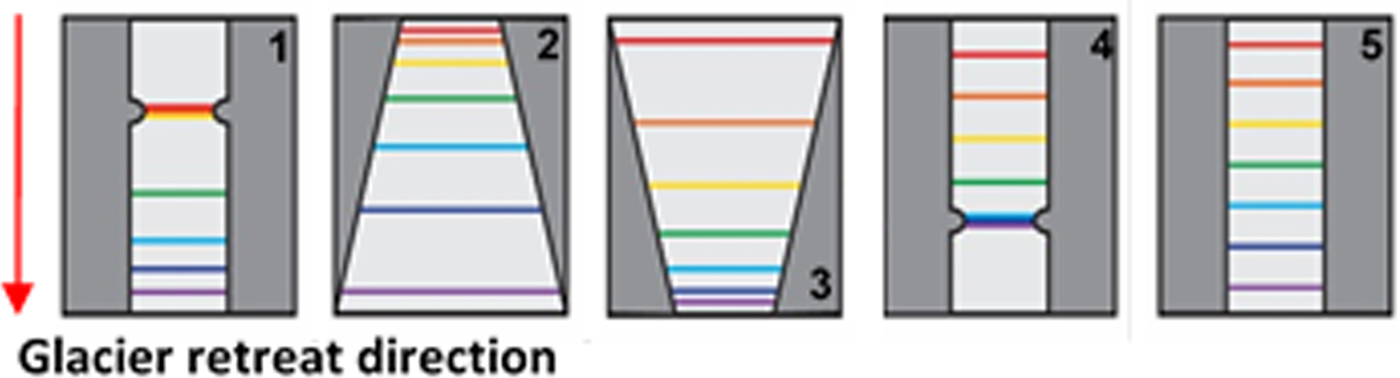
We carried out a qualitative assessment of fjord geometry for all glaciers in the study, following the classification of fjord shape by Carr and others (Reference Carr, Stokes and Vieli2014) (Fig. 2). We characterised the planform geometry of the fjord, as exhibited between the most advanced and most retreated glacier front position during our 15-year period of observation, to isolate the influence of fjord geometry over the length of the fjord that the glacier occupied during the study period. We use this method to gain an understanding of the broad patterns of fjord geometry for glaciers in the northwest and southeast region and therefore record the dominating geometry for each glacier and its potential impact on retreat behaviour. Categories of fjord geometry included the presence of lateral pinning points, widening and narrowing fjords and minimal change in fjord width (Fig. 2). While this approach is simple, it allows for the categorisation of fjord geometry for a large sample of glaciers without needing to account for the additional complexity of asynchronous terminus retreat. This method was also used effectively to characterise fjord morphology for a large sample size of glaciers in Novaya Zemlya (see Carr and others, Reference Carr, Stokes and Vieli2014).
Illustration of categories used for the analysis of fjord geometry. Geometries include (1) retreat from a lateral pinning point; (2) retreat into a widening fjord; (3) retreat into a narrowing fjord; (4) retreat onto a lateral pinning point and (5) parallel retreat.
2.3. Bed geometry
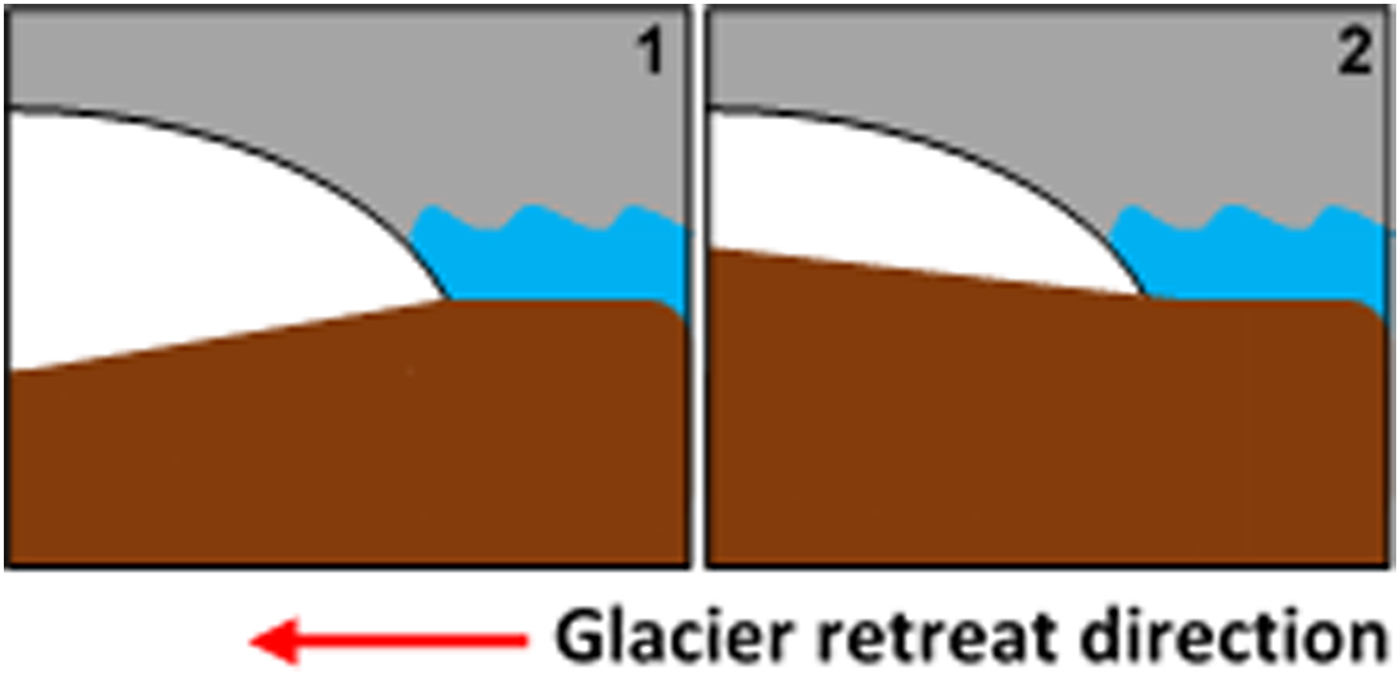
Bed geometry data were acquired from the IceBridge BedMachine (v2) dataset, which is derived from ice velocities at 400 m spatial resolution and are available from https://nsidc.org/data/IDBMG4/versions/2 (Morlighem and others, Reference Morlighem, Rignot, Mouginot, Seroussi and Larour2014). We tested the difference between Version 2 of IceBridge BedMachine and the recently released Version 3 (Morlighem and others, Reference Morlighem2017) and found that for 20 glaciers from each region representing a range of retreat characteristics, there was no difference in geometric interpretation using either Version 2 or 3. Bed geometry was then analysed by producing an elevation profile of topography underlying the centreline of each outlet glacier. Centreline elevation profiles were generated between the 2007 and 2015 terminus positions, which cover the years when the IceBridge BedMachine (v2) data are available. The dominating geometry for each glacier was categorised as either a (1) reverse bedrock slope (bedrock sloping downwards, up-glacier away from the grounding line) or (2) normal bedrock slope (bedrock sloping upwards, up-glacier away from the grounding line) (Figs. 2 and 3). While we recognise that a centreline profile excludes lateral across-fjord variations that could influence retreat rates, our aim is to provide a general overview of the geometry experienced by each glacier. Although we found small-scale lateral variations in bed depth at some glaciers, the general shape of the bed along flow did not change considerably. Furthermore, the spatial resolution of the BedMachine (v2) dataset is unlikely to resolve small-scale features such as topographic pinning points or sills, and while we recognise the importance of these features in determining frontal position, we do not include these in our analysis of bed geometry. Furthermore, recent studies of well-mapped fjords (e.g. Rignot and others, Reference Rignot2016a) indicate that bed geometry varies by considerably more than current bathymetric maps show; it is therefore important that we continue these detailed surveys (particularly near glacier fronts) to observe the small spatial scale variations, as these likely have considerable impact on frontal position change.
Illustration of the categories used for the analysis of bed geometry: (1) reverse bedrock slope and (2) normal bedrock slope.
2.4. Statistical analysis
We carried out statistical tests to analyse whether the observed spatial and temporal variations in retreat rates were significant. To initially assess whether glacier retreat was different between the northwest and southeast, we used a Kruskal–Wallis test to analyse the statistical difference in overall mean retreat rate (2000–2015) between each region. The Kruskal–Wallis test returns a p-value for the null hypothesis that two or more samples within the data come from the same population. This test is a non-parametric version of the one-way analysis of variance test and does not assume normal distribution within the data. This is the case for glacier retreat rates in our study, and was determined using the Kolmogorov–Smirnov test, to test for the normal distribution. Following convention, a significance level of 0.05 is used. This means that a p-value of ≤0.05 indicates that it is unlikely that the samples come from the same population, and in the case of our results, retreat rates of outlet glaciers in the northwest and southeast would be significantly different. This method of statistical analysis has been used effectively in a range of other studies of outlet glacier retreat behaviour (e.g. Miles and others, Reference Miles, Stokes, Vieli and Cox2013; Carr and others, Reference Carr, Stokes and Vieli2014; Carr and others, Reference Carr, Stokes and Vieli2017).
We then used a changepoint detection method (Killick and others, Reference Killick, Fearnhead and Eckley2012, Reference Killick, Beaulieu and Taylor2016; Killick and Eckley, Reference Killick and Eckley2014) to further analyse time series of individual glacier retreat rates. This method allowed for the objective determination of distinct periods of retreat rate behaviour exhibited by individual glaciers, which were then used to investigate intra-regional patterns of temporal variability. To determine if or when glaciers advanced and retreated, we need to determine when they have shifted from one mode to another. In order to automatically determine when this occurs, we use changepoint analysis (see Eckley and others (Reference Eckley, Fearnhead, Killick, Barber, Cemgil and Chiappa2011) for an introduction). Formally, a changepoint is a point in time where the statistical properties of prior data are different from the statistical properties of subsequent data; the data between two changepoints are a segment. There are various ways that one can determine when a changepoint should occur, but the best fit for our data is to consider changes in both the mean and time trend of our estimates. To automate this, we use the cpt.reg function in the R changepoint package available from CRAN (Killick and Eckley, Reference Killick and Eckley2014). This function uses the PELT algorithm (Killick and others, Reference Killick, Fearnhead and Eckley2012) for fast and exact detection of multiple changes in a time series. The function returns changepoint locations and estimates of the mean, time trend and variance between changes. We use the default MBIC penalty value (Zhang and Siegmund, Reference Zhang and Siegmund2007) with a minimum segment length of 4. For given data y 1…y n the PELT algorithm balances the trade-off between fit and complexity through optimizing
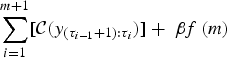 $$\mathop \sum \limits_{i = 1}^{m + 1} [{\rm {\cal C}}{\rm (}y_{(\tau _{i - 1} + 1):\tau _i} {\rm )}] + \; \beta f\,(m)$$
over m (number of changepoints), τ i=1:m (the changepoint locations) and the parameters within the cost function  ${\rm {\cal C}}$. Following convention, τ 0 = 0 and τ m+1 = n. The cost function we use is the likelihood of the model y t = α + βt + ε where $\varepsilon \sim N(0,\,\sigma ^2 )$, thus we have parameters α, β and σ for each segment. The cost function is optimised using maximum likelihood estimates of the parameters.
We also conducted a preliminary linear regression analysis to investigate potential causal links between glacier front position and annual records of air temperature (obtained from Danish Meteorological Stations, available from http://www.dmi.dk/en/vejr/), ocean temperature (acquired from TOPAZ data, available from http://topaz.nersc.no) and sea-ice concentration (extracted from US National Ice Centre charts, available from http://www.natice.noaa.gov/). Our results however showed no statistically significant correlations between these controls and the timing or magnitude of glacier retreat in either study region. The spatial and temporal coverage of these data meant however that their limitations prevented a more in-depth analysis, as has been adopted by previous observational and modelling studies that have, at least in part, attributed retreat to the impact of climate and ocean (e.g. Howat and others, Reference Howat, Smith, Joughin and Scambos2008b; Moon and Joughin, Reference Moon and Joughin2008; Straneo and others, Reference Straneo2012; Hanna and others, Reference Hanna2013). We therefore chose not to include any analysis of climate and oceanic data within this study.
After the qualitative analysis of fjord and bed geometry, we carried out a Wilcoxon test (Miles and others, Reference Miles, Stokes, Vieli and Cox2013) to investigate whether retreat rates were significantly different between glaciers situated on reverse and normal bedrock slopes. The Wilcoxon test is a non-parametric version of a paired t-test and does not assume normal distribution of the data. This is required as glacier retreat rates within our study are not normally distributed. The test is used to determine whether samples from the same population are significantly different that would be indicated by a p-value of >0.05. In the case of our study, this would indicate whether glaciers with different bed geometries had significantly different retreat rates.
3. RESULTS
3.1. Spatial and temporal patterns of glacier retreat
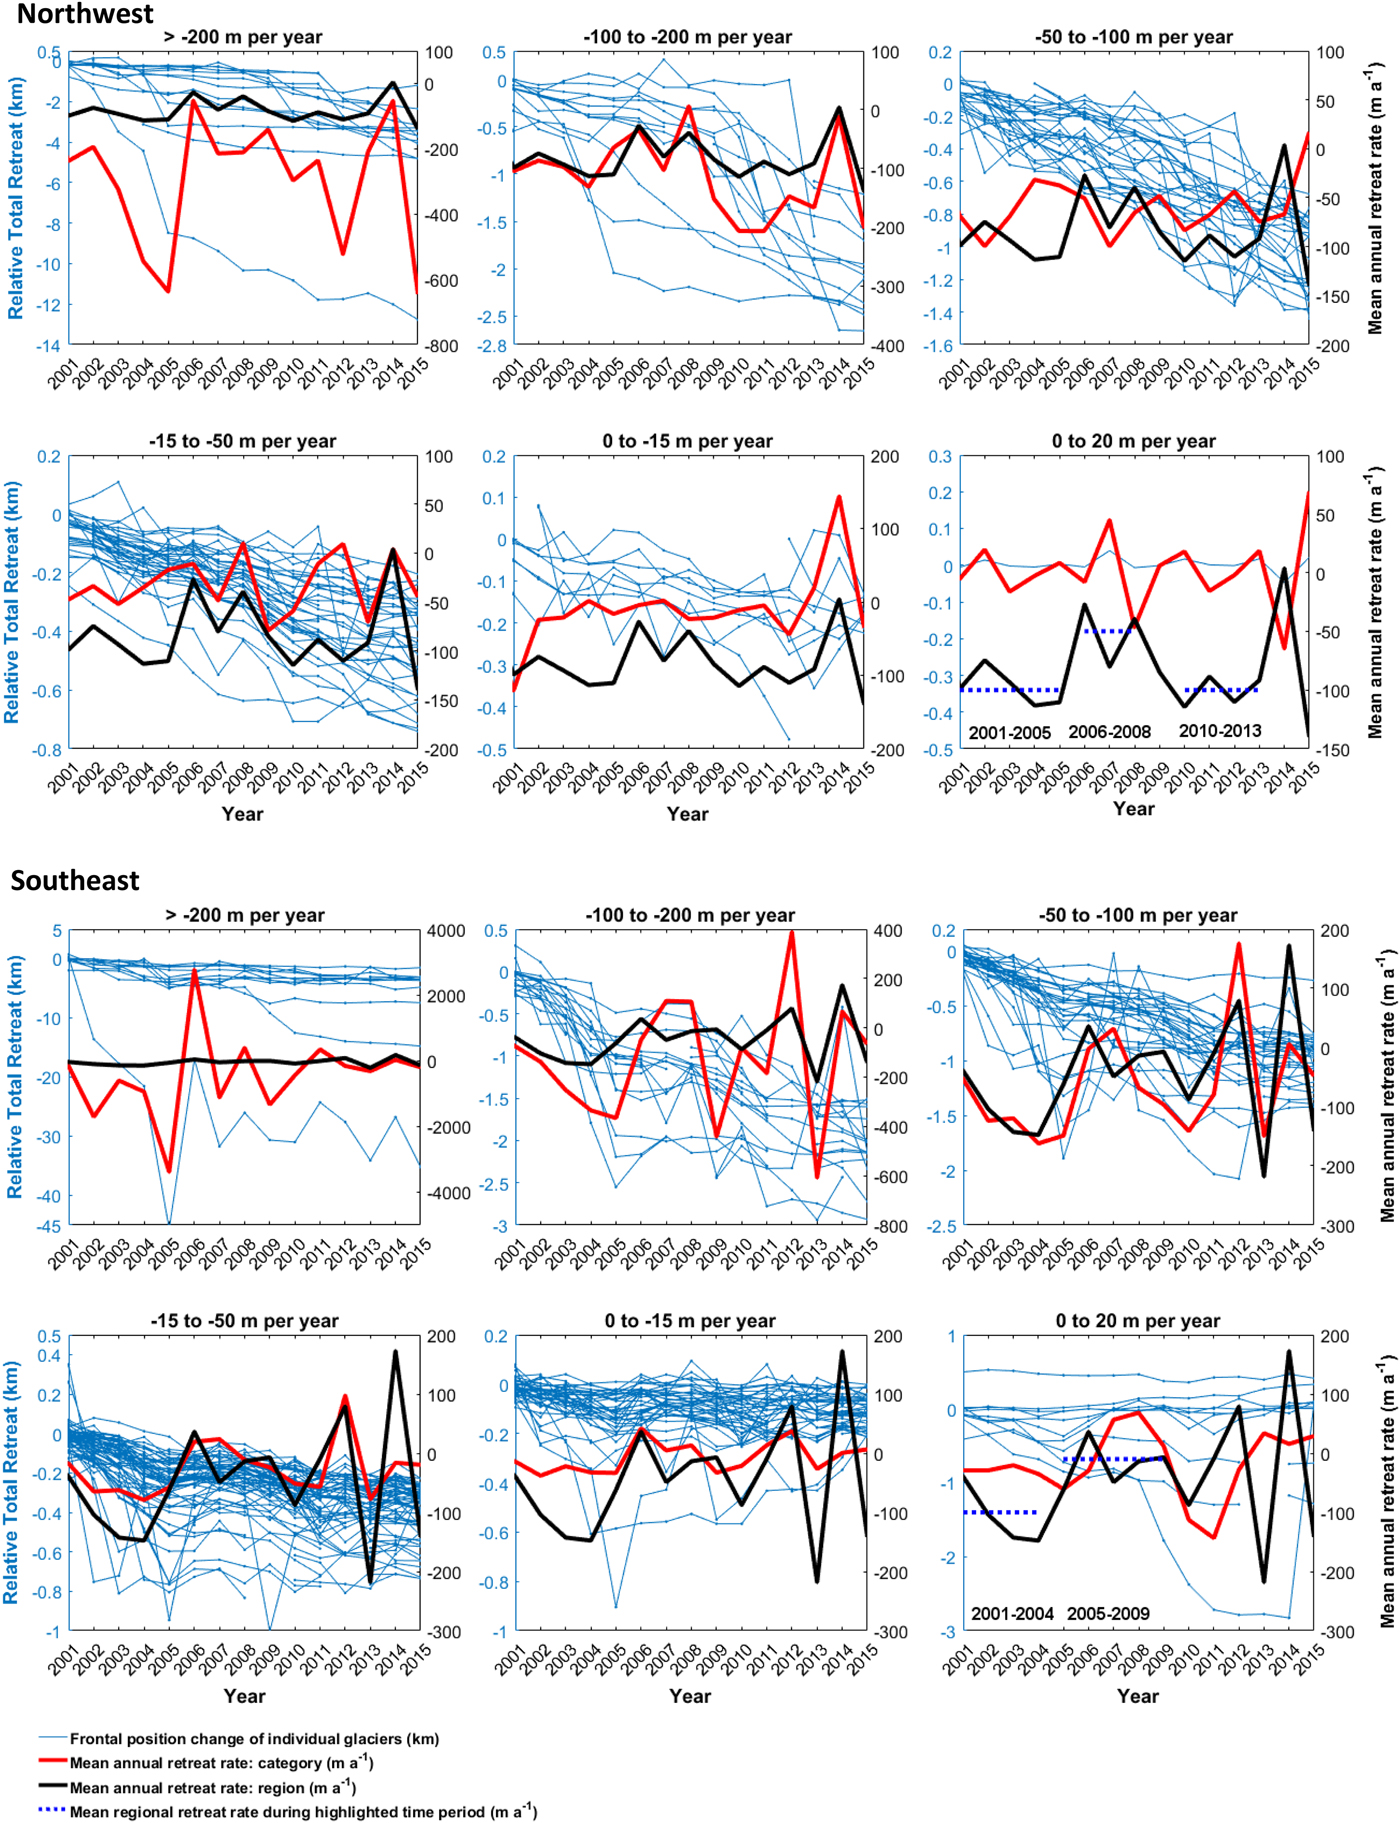
Our results showed that in northwest Greenland, 99% of glaciers retreated and 1% advanced between 2000 and 2015; in the southeast, 96% retreated and 4% advanced (Fig. 4). Results from the Kruskal–Wallis test indicated that retreat rates were significantly different between the two regions (p = <0.01). Mean regional annual retreat rates were higher in the northwest (−90 m a−1, SD = 110 m) compared with the southeast (−70 m a−1, SD = 190 m), and this was also reflected in the proportion of glaciers that experienced retreat rates of >−200 m a−1 (13% in the northwest and 7% in the southeast) (Fig. 4). Although when averaged, glaciers in the northwest retreated persistently throughout the study period, retreat rates were substantially higher during 2001–2004 and 2010–2013 (when mean retreat rates were −100 m a−1), and reached their maximum in 2015 (−140 m a−1) (Fig. 5). The lowest retreat rates were recorded in 2014, when retreat rates were within the margins of ‘no discernible change’. In the southeast, retreat was not sustained over the entire study period (Fig. 5). Retreat rates were an order of magnitude greater during 2001–2004 (mean = −98 m a−1), compared with 2005–2009 (−10 m a−1/no discernible change) (Fig. 5). After 2009, mean regional annual retreat rates showed much larger inter-annual variations: in 2010, 2013 and 2015 retreat rates reached between −80 and >−200 m a−1, whereas in 2011, 2012 and 2014, there was net annual advance in glacier frontal position (Fig. 5).
Mean annual retreat rates of outlet glaciers in the northwest and southeast. Size and colour of circles represent mean annual retreat rate of each glacier for the period 2000–2015.
Temporal patterns of outlet glacier retreat in the northwest and southeast between 2000 and 2015. Left axis: relative total retreat (km) for all glaciers included in the study (blue lines). Right axis: mean annual retreat rate (m a−1) for the glaciers within each category/plot (red line). Each plot also shows mean annual retreat rate (m a−1) of the entire region (right axis, black line). Note the different vertical scales in each plot to account for the differing mean annual retreat rates in each region. Figure also shows mean regional retreat rate for specific time periods: 2001–2005, 2006–2008 and 2010–2013 in the northwest, and 2001–2004 and 2005–2009 in the southeast (right axis, blue dotted lines) to demonstrate considerable differences in retreat rates between this time periods.
The timing and pattern of retreat also varied within the two regions (Figs 4, 5). There were no consistent spatial patterns in terms of glaciers within the same region retreating at similar rates (Fig. 4). For example, the one advancing glacier in the northwest (NW34) (Fig. 4) was surrounded by glaciers with retreat rates between −15 and >−200 m a−1 (Fig. 4). This variability in retreat rate for neighbouring glaciers was also observed in the southeast (Fig. 4). For example, while the mean retreat rate of Kangerdlugssuaq was >−200 m a−1, other glaciers within the same fjord system retreated at lower rates (ranging between −15 and −200 m a−1) or even experienced no discernible change. This intra-regional variability in retreat rates is also apparent in the timing of retreat with many glaciers not following the mean trends in regional retreat rate (Fig. 5).
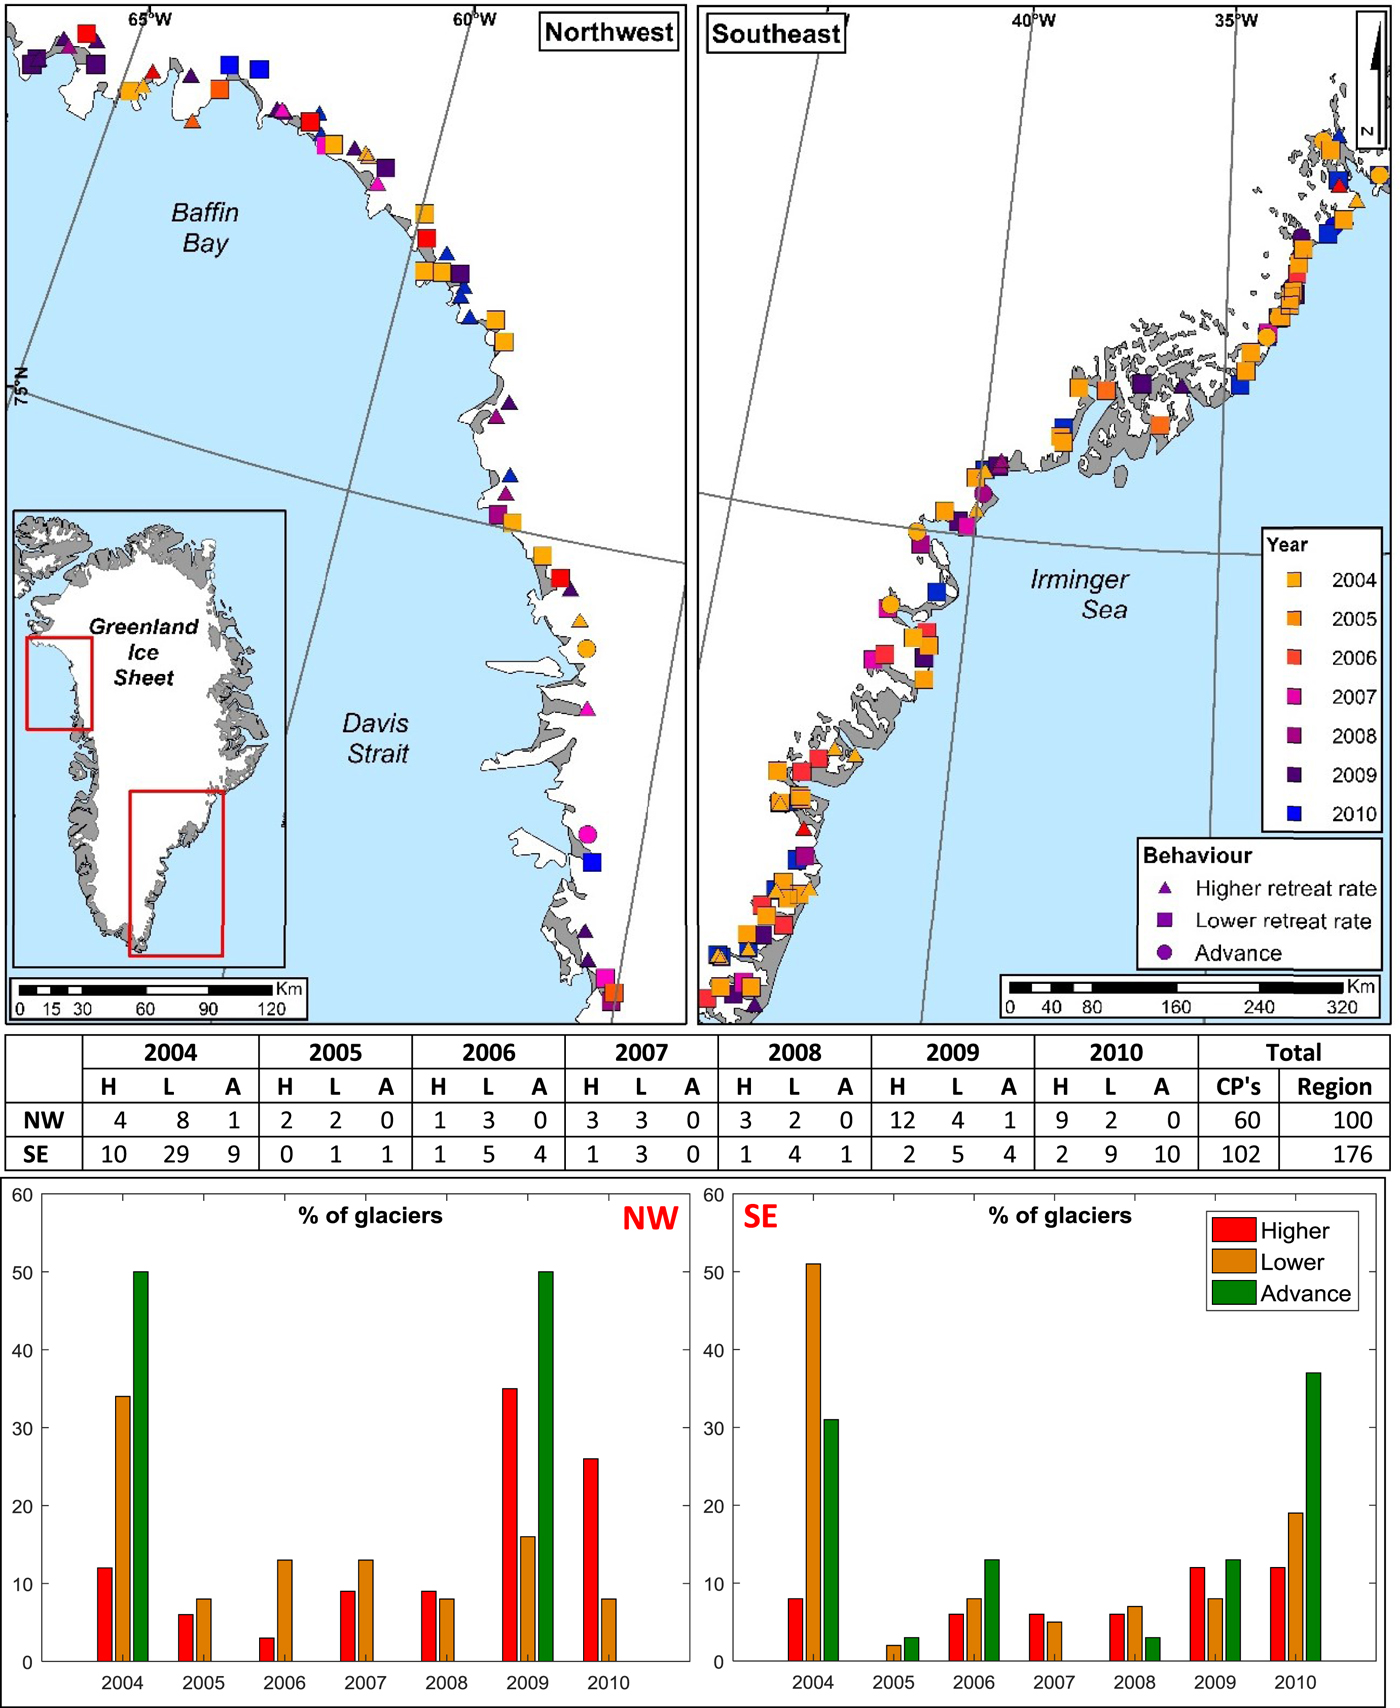
Due to the variable timing and magnitude of frontal position change we observed in our results, we used changepoint analysis to determine whether changes in glacier retreat rates occurred at similar times, both within and between our study regions. Changepoints were detected for 60 glaciers in the northwest (60% of total) and 102 glaciers in the southeast (58% of total). In the northwest, 50% of the changepoints (30 glaciers) were detected in either 2004 or 2009. The majority of the 2004 changepoints marked a reduction in retreat rates, compared with previous years, while retreat rates generally increased after 2009 (Fig. 6). In the southeast, 68% of the changepoints (69 glaciers) were detected in either 2004 or 2010 (Fig. 6). In both of these years, the majority of changepoints indicated lower retreat rates than in previous years, although this pattern was not as pronounced as in the northwest (Fig. 6). Twelve of the glaciers in the southeast had two changepoints. In all but two instances, the first changepoint was detected in 2004 and indicated enhanced retreat after 2004, while the second changepoint was detected in 2010, and indicated a switch from retreat to advance from 2010 onwards (Fig. 6). There were no glaciers in the northwest for which multiple changepoints were detected. These results show that glaciers that experienced a changepoint changed at common times (2004 and 2009 in the northwest and 2004 and 2010 in the southeast). However, many glaciers in both regions (60 glaciers in the northwest and 108 in the southeast) did not experience a changepoint in these years. Consequently, there was no common timing of change for the entire population of study glaciers (Fig. 6).
Changepoints detected between 2000 and 2015 for glaciers in the northwest and southeast. Top panels show maps of the spatial distribution of changepoints. Symbols indicate the type of changepoint (e.g. higher retreat rate, lower retreat rate or advance after the changepoint year). Colour indicates the year in which the changepoint was detected. The table displays the number of changepoints for each region, the type of these changepoints and the year in which they were detected. The table also indicates the total number of changepoints detected for each region and the total number of glaciers. Note that 12 of the glaciers in the southeast had two changepoints: one in 2004 and one in 2010. The histogram panels show these numbers as a percentage of the type of changepoints that were detected for each year.
3.2. Fjord and bed geometry
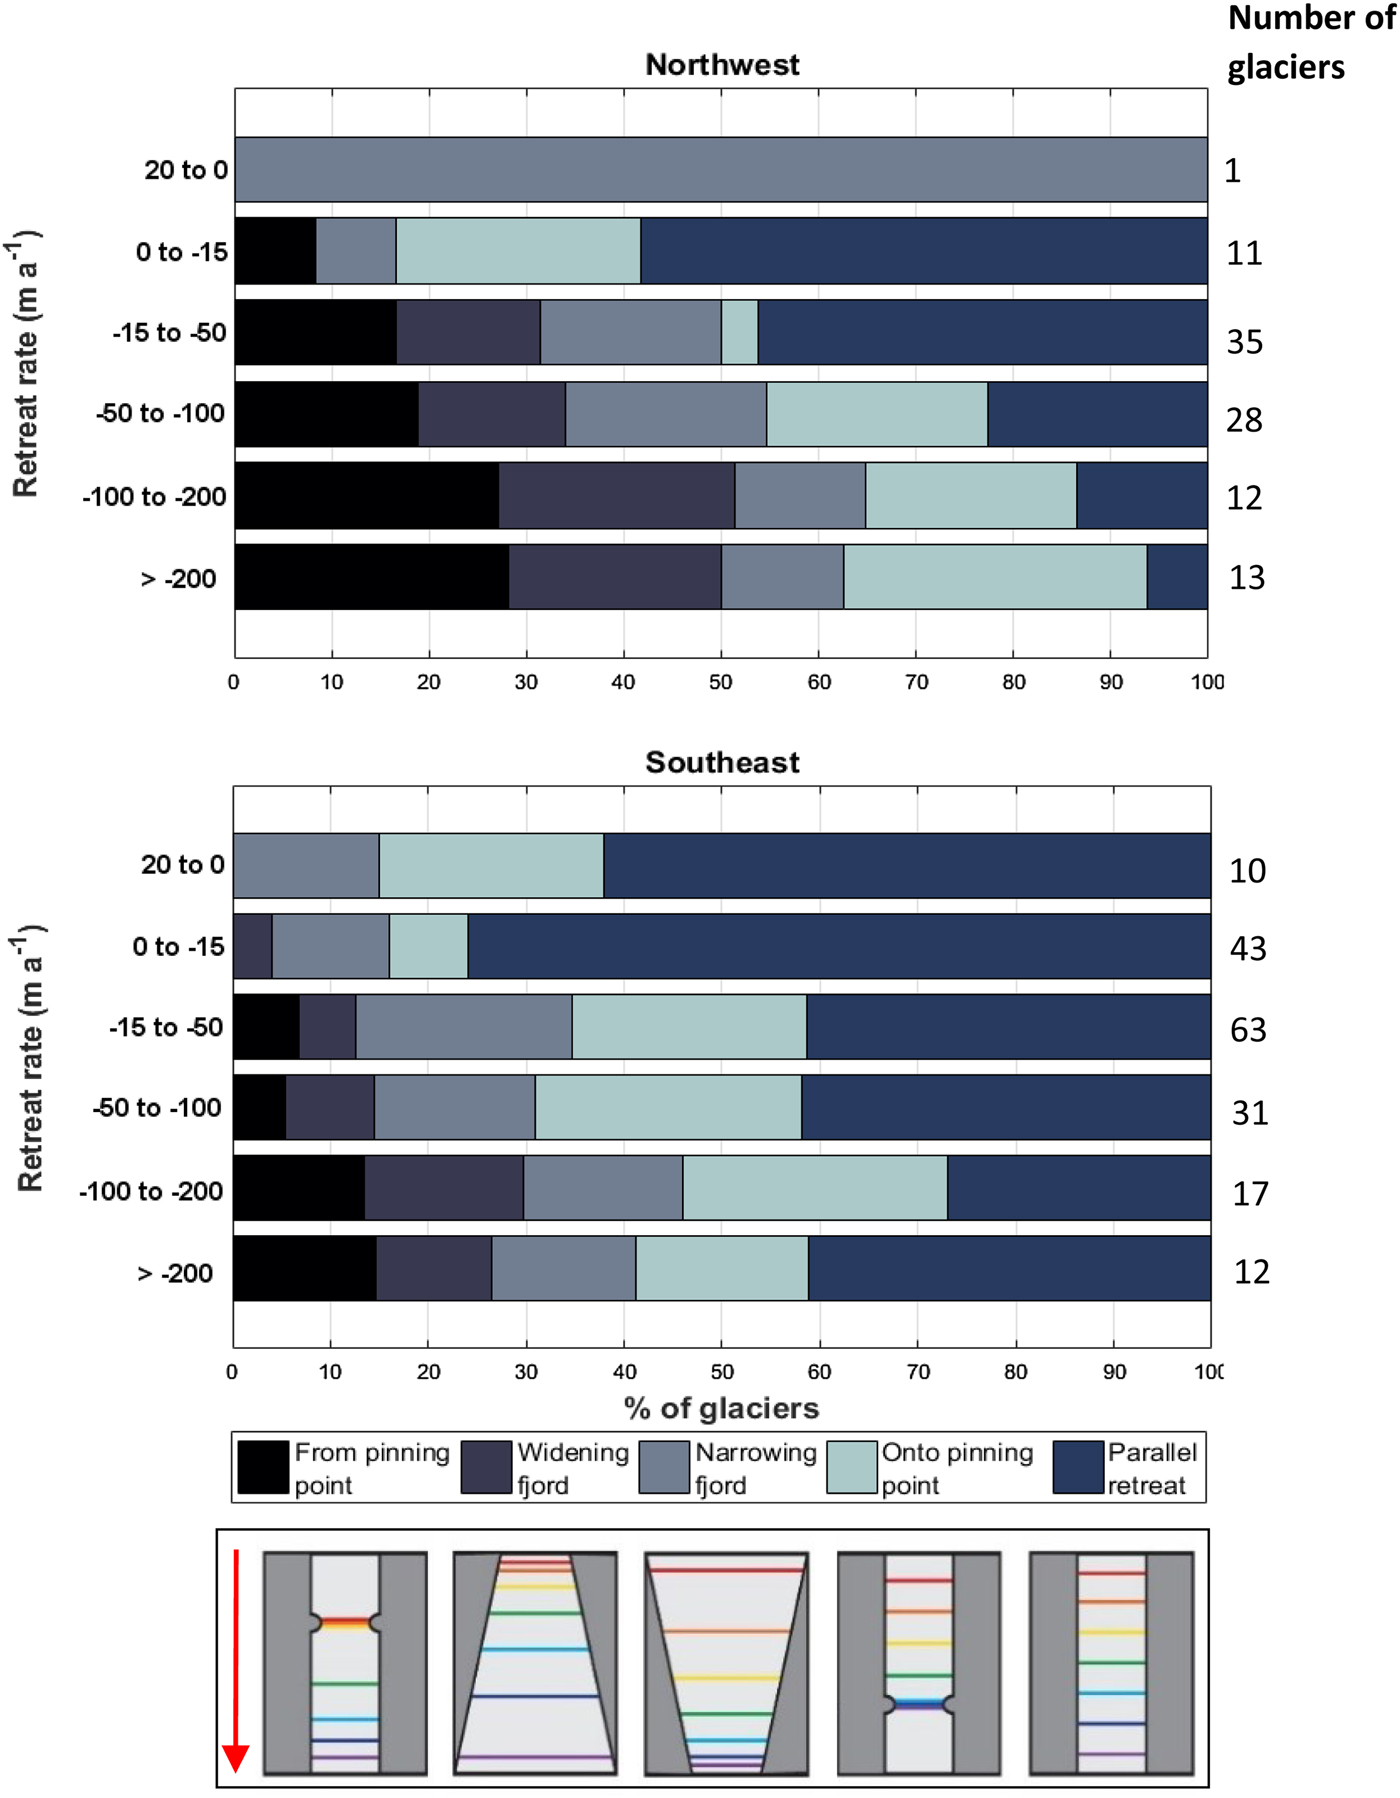
Our results showed that while almost all glaciers retreated (99% in the northwest and 96% in the southeast), regardless of glacier-specific characteristics, there was also evidence of geometric control on retreat patterns. In both regions, a high percentage of glaciers that retreated >200 m a−1 (90% in the northwest; 84% in the southeast) and between 100 and 200 m a−1 (78% in the northwest; 59% in the southeast) retreated from lateral pinning points or into widening fjords. (Fig. 7). The majority of glaciers with lower retreat rates were located in narrowing fjords or those with minimal geometric change; the percentage of glaciers experiencing these fjord geometries increased as retreat rate decreased in both the northwest and the southeast (Fig. 7).
Observed fjord plan geometry for glaciers exhibiting different retreat rates in the northwest and southeast. Stacked horizontal bars indicate percentages of glaciers within the specified retreat rate categories. Colours indicate fjord geometries specified in the key. The total number of glaciers within each category is provided in the right-hand column.
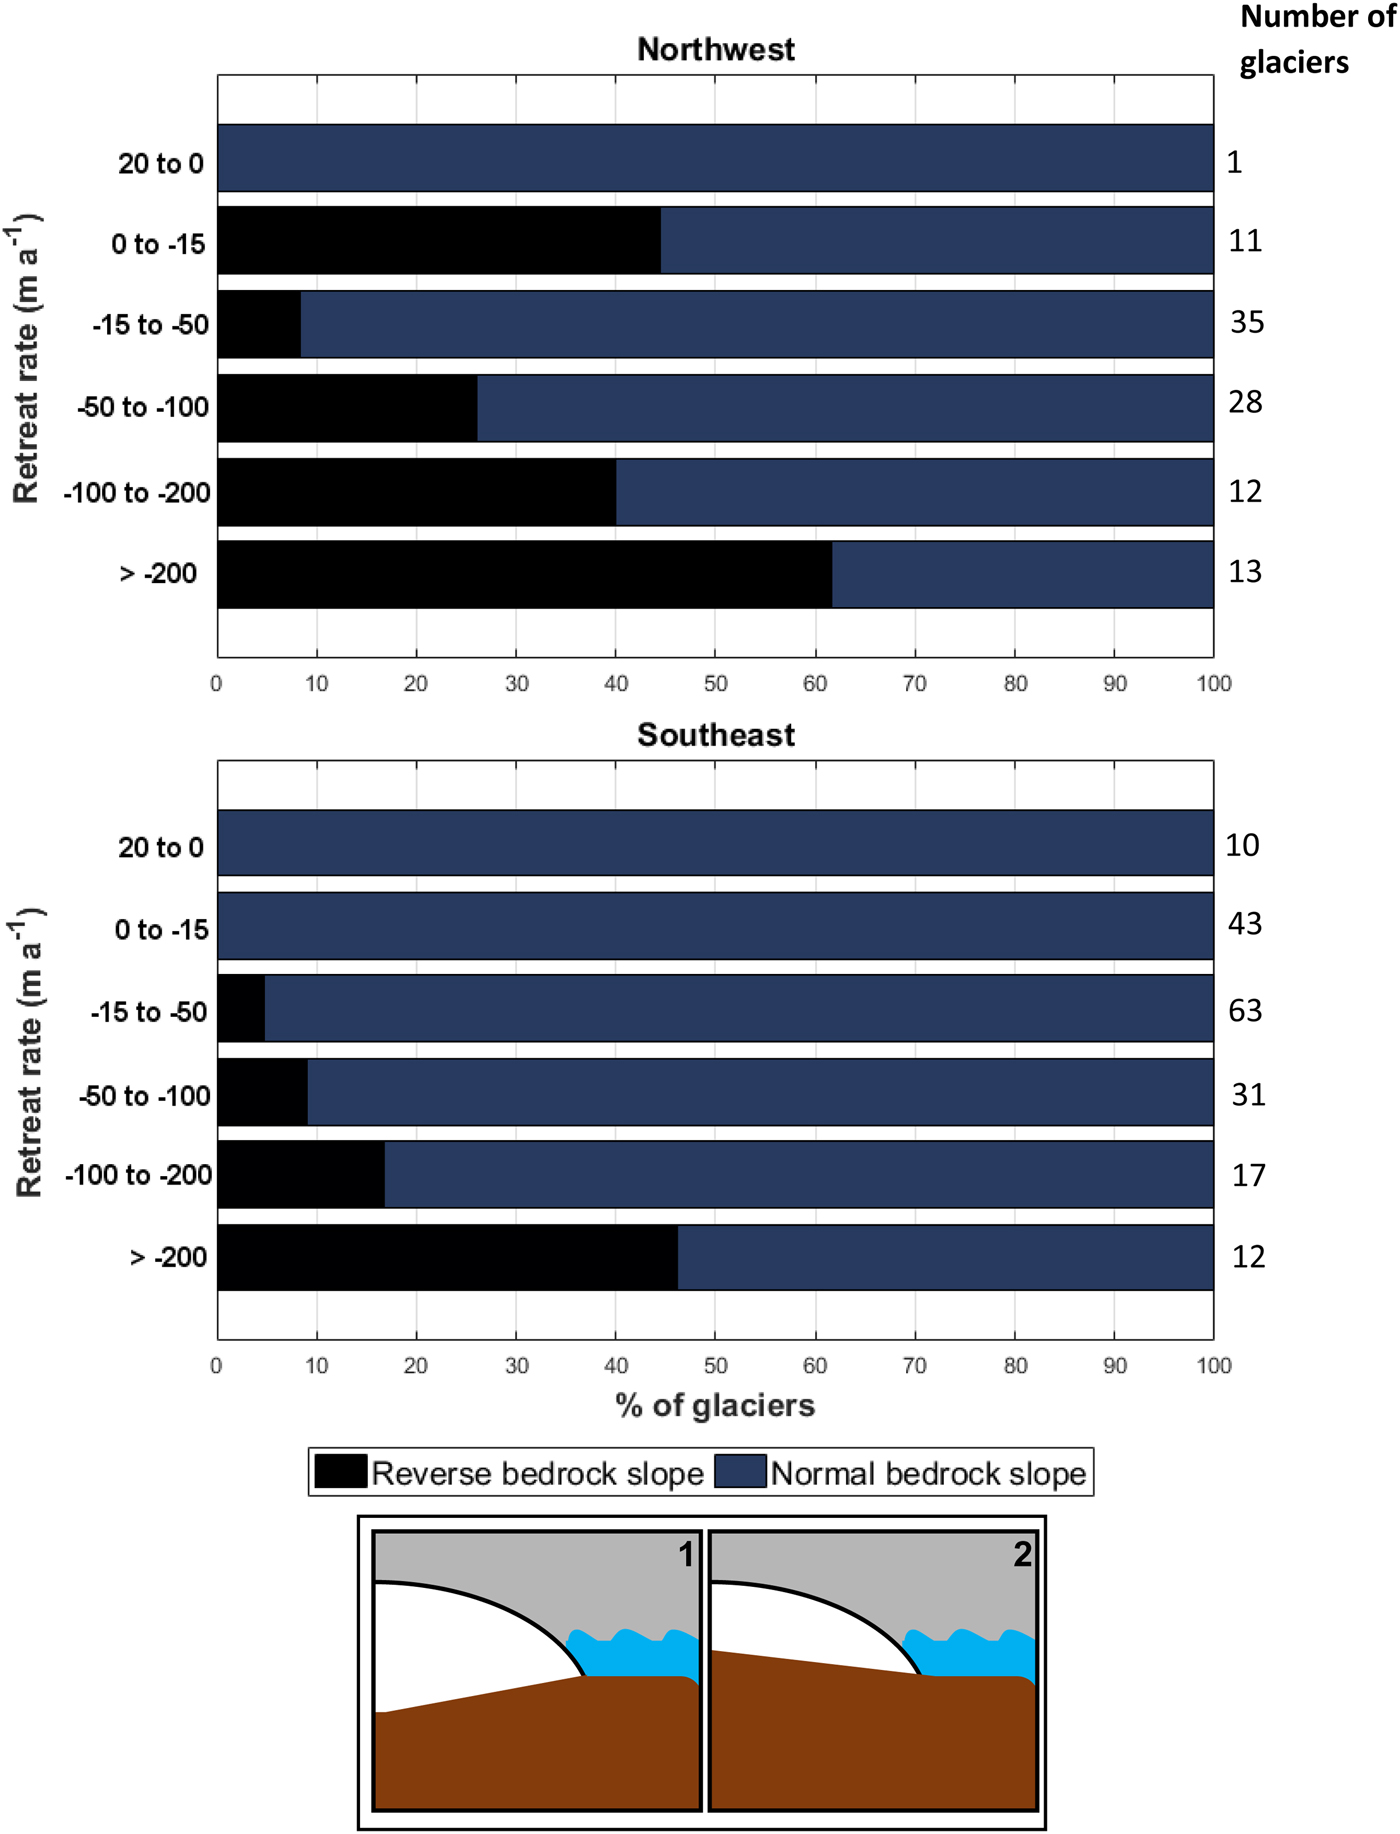
Our results also show that variations in retreat rates were associated with different centreline bed slopes (Fig. 8). The percentage of glaciers situated on reverse bedrock slopes increased with increasing retreat rates in both the northwest and the southeast (Fig. 8). In both regions, no advancing glaciers were situated on reverse bedrock slopes, whereas glaciers that retreated >200 m a−1 had the highest percentage associated with reverse slopes (50% in the northwest and 40% in the southeast) (Fig. 8). The exception to this is the −15 to −50 m a−1 category in the northwest, which had a much higher percentage of glaciers on reverse slopes compared with those with higher retreat rates. It must be noted that here the higher percentage is due to a smaller sample size of glaciers for this category, compared with those in the subsequent two categories in the northwest (Fig. 8). The Wilcoxon test, which we used to assess the statistical significance of the retreat rates of glaciers with different bed geometries, suggested there was a significant difference between the retreat rates of glaciers retreating across a normal slope compared with those that retreated across a reverse bedrock slope (p-value = <0.05 in the northwest and <0.01 in the southeast). Glaciers situated on reverse bedrock slopes therefore experienced higher retreat rates.
Observed bed geometries for glaciers at certain retreat rates for the northwest and southeast. Stacked horizontal bars indicate percentages of glaciers within the specified retreat rate categories. Colours indicate bed geometries specified in the key. The total number of glaciers within each category is provided in the right-hand column.
4. DISCUSSION
Our study demonstrates a near-ubiquitous retreat of marine-terminating outlet glaciers in the northwest and southeast Greenland between 2000 and 2015 (Figs 4, 5). However, frontal position change varied spatially and temporally both within and between these regions. These findings are consistent with many studies which report on both the retreat and complex behaviour of outlet glaciers across Greenland (e.g. Moon and Joughin, Reference Moon and Joughin2008; Howat and Eddy, Reference Howat and Eddy2011; McFadden and others, Reference McFadden, Howat, Joughin, Smith and Ahn2011; Carr and others, Reference Carr, Stokes and Vieli2013; Murray and others, Reference Murray2015).
4.1. Retreat in the northwest
Retreat in the northwest was sustained during 2000–2015 (Fig. 5). However, two periods of retreat were substantially faster (−98 m a−1 during 2001–2004 and −101 m a−1 during 2010–2013) than the regional mean rates across the entire study period (Fig 5). These two periods of rapid retreat were separated by a period of much slower mean regional retreat (−48 m a−1, during 2005–2009), consistent with the results from other studies within the region (Moon and Joughin, Reference Moon and Joughin2008; McFadden and others, Reference McFadden, Howat, Joughin, Smith and Ahn2011; Carr and others, Reference Carr, Stokes and Vieli2013; Murray and others, Reference Murray2015). This period of slower retreat was also highlighted by our changepoint analysis, which showed that for glaciers with changepoints (60 glaciers), 50% (30 glaciers) showed a reduction in retreat rate after 2004 (Fig. 6). The work by Carr and others (Reference Carr, Stokes and Vieli2013), on a sub-sample of 13 glaciers surrounding Alison Glacier in the northwest, reported considerably higher retreat rates between 2001 and 2005 than between 2005 and 2010. Murray and others (Reference Murray2015) analysing a larger sample of glaciers (n = 91) showed ubiquitous retreat for all glaciers in the northwest during 2001–2005, followed by a slowdown in retreat including a net advance in 2006 for many of the smaller glaciers in the region (Murray and others, Reference Murray2015).
The previous studies in conjunction with our results therefore suggest that following a period of rapid retreat during 2001–2004, retreat rates in the northwest slowed after 2005, a pattern that was also observed in the southeast (e.g. Howat and others, Reference Howat, Joughin, Fahnestock, Smith and Scambos2008a; Joughin and others, Reference Joughin2008a; Howat and Eddy, Reference Howat and Eddy2011). Our extended time series now reveal that these lower retreat rates have not been sustained after 2010, and instead, the mean regional retreat rates for the period 2010–2015 (−101 m a−1) were higher than during the previous decade (Fig. 5). This behaviour was also highlighted by our changepoint analysis; for glaciers that showed changepoints indicating a shift to higher retreat rates, 61% were detected in either 2009 or 2010 (Fig. 6) demonstrating an acceleration in retreat rate after these years. These observations of accelerated retreat rates after 2010 correlate with increased ice velocities from observations of a sub-sample of 16 glaciers in the northwest region after 2010 (Moon and others, Reference Moon, Joughin and Smith2015).
4.2. Retreat in the southeast
Between 2000 and 2010, retreat in the southeast followed a similar pattern to the northwest (Fig. 5). A period of rapid retreat, during 2001–2004 (−98 m a−1), was followed by retreat rates an order of magnitude slower during 2005–2009 (−10 m a−1) (Fig. 5). This behaviour was also detected by the changepoint analysis: changepoints were detected for 108 glaciers and 68% of these glaciers showed a reduction in retreat rate after 2004 (Fig. 6). These results are consistent with other studies in the southeast that detect rapid retreat before 2005, followed by a considerable slowdown (e.g. Rignot and others, Reference Rignot, Braaten, Gogineni, Krabill and McConnell2004; Howat and others, Reference Howat, Joughin, Fahnestock, Smith and Scambos2008a, Reference Howat, Smith, Joughin and Scambosb; Joughin and others, Reference Joughin2008a; Moon and Joughin, Reference Moon and Joughin2008; Howat and Eddy, Reference Howat and Eddy2011). Our most recent observations since 2010 reveal large inter-annual variations with mean regional frontal positions alternating between net annual retreat and advance (Fig. 5). Mean annual retreat rates in 2013 and 2015 exceeded those during 2001–2004, while in 2012 and 2014, there was net advance (Fig. 5). As a result, the overall mean retreat rate for 2010–2015 was −40 m a−1, compared with −98 m a−1 during 2001–2004 and −10 m a−1 during 2005–2009. This demonstrates that while mean retreat rates have accelerated since 2010, recent frontal change has been characterised by much greater variability than over the previous decade and in comparison to the northwest. The changepoint analysis reflects these observations; 38% of the glaciers that switched from retreat to advance switched in 2010 but a high percentage of glaciers also switched to lower retreat rates after 2010. Ongoing monitoring of frontal position change will be necessary to place the recent patterns of dynamic change into a longer term context and to determine what factors are responsible for driving this variability.
4.3. Influence of fjord and bed geometry
The overall broad patterns of retreat that have occurred over the 15-year observational period suggest that wider climatic and oceanic controls are exerting some level of influence on outlet glacier behaviour. However, the complex spatial variability in both the timing and magnitude of glacier retreat between and within each region (Fig. 4), including neighbouring glaciers experiencing contrasting behaviour, implies that frontal position is at least partly controlled by local variation in glacier-specific factors, such as fjord and bed geometry.
Our results showed that higher retreat rates were associated with glaciers retreating into widening fjords and/or from lateral pinning points, while lower retreat rates were associated with fjords that were either narrowing or showed minimal variation in width (Fig. 7). These findings support a previous work in Greenland (Warren and Glasser, Reference Warren and Glasser1992) and more recently from Novaya Zemlya (Carr and others, Reference Carr, Stokes and Vieli2014) where years of rapid retreat corresponded to sections of widening fjord and retreat from lateral pinning points, demonstrating that fjord geometry exerts a major influence on outlet glacier retreat. At Midgaard Glacier in the southeast (Sermilik Fjord), retreat occurs during 2007–2013 and this also corresponds to the glacier retreating into a wider section of the fjord. This is followed by minimal change in frontal position in the last two years of the study period, when the fjord narrows considerably. This behaviour is also observed at Alison Glacier in the northwest, where retreat during 2001–2005 correlated with a widening fjord. This period of rapid frontal position change is followed by lower and more consistent retreat rates after 2005, coincident with a lateral pinning point in the fjord. This matches the earlier relationship with fjord geometry during 1976–2001, when progressive but consistent retreat was observed alongside minimal variation in fjord width, followed by rapid retreat into a widening fjord during 2001–2004 (Carr and others, Reference Carr, Stokes and Vieli2013).
The importance of topographic control on retreat rates is manifest in the bed shape as well as the fjord planform geometry with higher retreat rates associated with reverse bedrock slopes, and lower retreat rates associated with normal bedrock slopes (Fig. 8), findings consistent with the previous work in well-mapped fjords (e.g. Rignot and others, Reference Rignot2016b). We observed rapid retreat at a number of glaciers, which far exceeded rates on neighbouring glaciers, which we attribute to variation in bed geometry. For example, the only glacier that experienced net advance (during 2000–2015) in the northwest (NW34) is situated on a normal bedrock slope, while nearby Kong Oscar (just 20 km north, with a retreat rate of >−200 m a−1) is situated on a reverse bedrock slope. Further north, NW92 also retreated at a mean annual rate of >−200 m a−1 across a reverse bedrock slope, while the adjacent three glaciers north and five glaciers south of NW92, all located on normal bedrock slopes, retreated at the rates of −15 to −50 m a−1. The close spatial proximity of these glaciers would appear to exclude the effect of climatic and oceanic controls on changes in frontal position, thereby suggesting bed geometry as a major control on retreat rate. Despite their close spatial proximity in the same fjord system, Tracy and Heilprin Glaciers experience considerably different patterns of retreat that are attributed to differences in bed depth (Porter and others, Reference Porter2014). Asynchronous terminus retreat at Humboldt Glacier, northwest Greenland, has also been linked to differences in bed geometry between the northern and southern sections of the terminus (Carr and others, Reference Carr2015). These differences in geometry at Tracy and Heilprin and also at Humboldt may be acting as a catalyst, allowing other processes to enhance calving and retreat. For example, the deeper grounding line at Tracy Glacier allowed access for warmer waters to reach the terminus, enhancing submarine melt leading to three times as much retreat than at Heilprin (Porter and others, Reference Porter2014).
This contrasting behaviour can also be observed in the southeast, where three neighbouring glaciers in close proximity (<20 km) in 2000 have retreated at considerably different rates. SE78 experienced net advance during the study period, SE77 experienced low mean annual retreat (−15 to −50 m a−1), while SE76 retreated at a substantially higher rate (>−200 m a−1). All three glaciers are situated in fjords with little to no fjord width variation but considerable variation in bed geometry, with the SE76 (retreating at much higher rates) situated on a reverse bedrock slope, while the two that experienced little frontal position change situated on normal bedrock slopes.
Our detailed results in combination with the work of others (e.g. Porter and others, Reference Porter2014, Carr and others, Reference Carr2015; Rignot and others, Reference Rignot2016b) therefore confirm that localised glacier behaviour, as evidenced by changes in terminus position, can vary considerably as a result of varying fjord and bed topography. It is therefore clear that as glaciers experience different fjord geometry as they retreat, their behaviour may change with enhanced retreat as a fjord widens and/or deepens and suppressed retreat with a narrowing and/or shallowing fjord, even where the glacier is subjected to the same climatic forcing. Detailed studies of glacier-specific conditions including accurate bathymetric data are therefore essential to inform ice-sheet models, particularly models of submarine melt, and enable them to better predict and quantify future patterns of frontal position change, and thus ice loss.
5. CONCLUSIONS
We present a 15-year record of annual frontal position change for 276 outlet glaciers in the northwest and southeast GrIS. Outlet glacier retreat is near-ubiquitous during 2000–2015. There is however considerable inter-annual variability in the timing and magnitude of ice front retreat both within and between the regions. Both regions experienced sustained and rapid retreat (~−100 m a−1) during 2001–2004 followed by a subsequent slowdown. In the northwest, following slowdown, mean retreat rates for the period 2010–2015 were the highest for the whole period of observation confirming substantial recent acceleration. In the southeast by contrast, retreat patterns during 2010–2015 were characterised by considerable inter-annual variability, hence while retreat during 2015 was the highest of any year (>−200 m a−1), the mean retreat rate (−40 m a−1) was less than half that observed during 2001–2004. While the near-ubiquitous retreat observed implies a broad climatic and/or oceanic driver, our work also suggests that the asynchronous patterns of annual frontal position change are, at least in part, controlled by the fjord and bed geometry. Differences in the timing and magnitude of local retreat reflects variation in glacier-specific factors and demonstrates the potential of these characteristics to modulate glacier behaviour and contribute considerably to the patterns of ice loss. Given the importance of fjord and bed geometry in modulating patterns of retreat, it is clear that there is an ongoing need for improved observations of bed geometry. Without detailed bathymetry of fjord systems and glacier trunk beds, particularly close to the ice fronts of outlet glaciers, it will not be possible to constrain and quantify accurately the impact of small-scale topographic features that are known to have considerable influence on frontal position change.
ACKNOWLEDGEMENTS
This work was supported by an M.Phil. research scholarship awarded to C. Bunce by the School of Geography, Politics and Sociology at Newcastle University and a Ph.D. studentship awarded to C. Bunce through the E3 Natural Environmental Research Council Doctoral Training Partnership (NE/L002558/1). We acknowledge the availability of several datasets used within the study. A variety of Landsat 4+5, 7 and 8 satellite images were obtained from the USGS Earth Explorer and GLOVIS platforms. Version 2 of the IceBridge BedMachine dataset was acquired from the National Snow and Ice Data Center (as produced by Morlighem and others (2015)). Atmospheric and oceanic data were also acquired from several sources: air temperature data were downloaded from the Danish Meteorological Institute (http://www.dmi.dk/en/vejr/); ocean temperature data were freely available from the TOPAZ dataset (http://topaz.nersc.no); and sea-ice concentration data were available from the US National Ice Centre (http://www.natice.noaa.gov/). We are grateful to Stuart Dunning and Stewart Jamieson for helpful comments during M.Phil. submission.
AUTHOR CONTRIBUTIONS
CB designed the study, with input from RC, and led the writing of the manuscript. RC, NR and PN provided input on both the manuscript and the figures. RK carried out the change point analysis and provided input on the statistical analysis.


 Open access