


Introduction
Stereotactic radiosurgery (SRS) and volumetric-modulated arc therapy (VMAT) for brain metastases and spinal oligometastatic disease have been recognised as effective treatment methods that improve survival and quality of life. Reference Harikar, Venkataram and Palmisciano1–Reference Christ, Thiel and Heesen4 SRT for brain metastases and spinal oligometastatic disease delivers high radiation doses in a few fractions; therefore, even slight positional deviations during irradiation pose significant risks, such as underdosing of the target or overdosing of adjacent organs at risk. Reference Tanabe and Tanaka5–Reference Sanli, Jiang and Darko7 The radiotherapy process and equipment involved in the delivery dose are controlled by stringent safety standards, procedures and quality assurance (QA) measures. Reference Silvis-Cividjian, Verbakel and Admiraal8
In high-precision radiotherapy such as SRT, quality control and QA are crucial to ensuring the geometric and dose-delivery accuracy of radiation therapy devices, as well as the calculation accuracy of complex and small radiation fields in treatment planning systems and the matching accuracy of image-guided radiotherapy (IGRT). Reference Osei, Graves and Darko9,Reference Nishioka, Kunii and Tanabe10 The irradiation centre accuracy for SRT must remain within a tolerance of <1 mm at the isocentre to ensure treatment precision. Reference James, Al-Basheer and Elder11 IGRT mitigates mechanical and geometric uncertainties, and QA of IGRT imaging isocentres plays a critical role in achieving high irradiation accuracy. Reference McCullough, Alkhatib and Antes12,Reference Fernandez, Grills and Ye13
IGRT is particularly advantageous in SRT as it enhances both positioning and irradiation accuracy. Reference Rojas-López, Chesta and Venencia14 During IGRT QA, it is essential to assess the accuracy of the geometric and imaging centres. Geometric calibration maps and the alignment of imaging equipment are recommended to adhere to a tolerance of <1 mm. Reference Bissonnette, Balter and Dong15
The linear accelerator gantry is subject to gravitational sagging caused by the weight of the jaws, multileaf collimator and shielding components, leading to minor deviations from its circular rotation path. Reference Milan, Grogan and Ebert16,Reference Yamazawa, Osaka and Fujii17 IGRT systems correct sagging through physical geometric adjustments and software-based corrections, while QA ensures consistency in imaging and treatment coordinates, scaling and spatial resolution. Reference Chojnowski, Warr and Sykes18
The Elekta linear accelerator corrects sagging of the electronic portal imaging device (EPID) using a two-dimensional table flex map (FM). Reference Hanley, Dresser and Simon19 FM calibration acquires eight megavoltage images of a ball bearing (BB) placed near the isocentre and calculates the shifts required to align the BB with the radiation isocentre. Reference Bissonnette, Balter and Dong15,Reference Chojnowski, Warr and Sykes18 The BB is positioned at the isocentre by manual adjustment using a dial gauge, and an FM is created from the resulting BB images. Reference Yamazawa, Osaka and Fujii17,Reference Chojnowski, Warr and Sykes18 Previous studies have reported systematic errors in image-matching coordinates due to inaccuracies in BB placement or software analysis. Reference Yamazawa, Osaka and Fujii17,Reference Chojnowski, Warr and Sykes18
Sharing uncertainties in the registration process is essential for evaluating and improving radiotherapy accuracy among multidisciplinary teams. Reference Brock, Mutic and McNutt20 However, the complexity of specialised QA methods and technologies can hinder effective communication with non-specialist staff. Reference Huq, Fraass and Dunscombe21,Reference Tanabe and Eto22 Image analysis offers a more accessible approach for presenting QA results, making it easier to convey complex results and methodologies. It is widely recognised for improving QA efficiency and for facilitating clear communication of intricate findings and processes. Reference Tanabe and Ishida23
Recent advances in radiotherapy, such as VMAT for treating multiple brain metastases, demand enhanced off-axis central accuracy and IGRT positioning precision. Reference Antoine, Ralite and Soustiel24 Achieving these objectives requires ongoing improvement in the IGRT image quality and geometric accuracy. Reference Niyas, Abdullah and Noufal25
While systematic errors in coordinates caused by sagging corrections during device matching have been investigated previously Reference Bissonnette, Balter and Dong15 , detailed reports on off-axis beam axis accuracy and image quality in relation to sagging correction errors are lacking. Moreover, no studies have examined the effects of MV X-rays on sagging correction errors.
This study aims to evaluate the relationship between image quality and geometric coordinate deviations resulting from sagging correction errors in an image-matching system. Additionally, the use of image analysis to address sagging correction errors could simplify information sharing and enhance comprehension among radiotherapy staff.
Materials and Methods
Equipment and measurement methods
The radiotherapy equipment used in this study was the Synergy linear accelerator (Elekta AB) equipped with X-ray volume imaging (XVI) and kV cone-beam CT systems (CBCT) for IGRT. Sagging correction using an FM was performed with a BB and a dial gauge capable of 0.01 mm adjustments. The Catphan phantom module (Phantom Laboratory) was utilised to analyse image quality and geometric coordinates for CBCT. Specifically, the sensitometry module (CTP404) and high-resolution module (CTP528) of the Catphan phantom module were employed for detailed evaluations. Image analysis was conducted using the XVI software (Elekta AB), ImageJ (Wayne Rasband, the National Institute for Health) and radiotherapy QA software RIT113 (Radiological Imaging Technology, Inc.). The off-axis beam accuracy was assessed using the MultiMet-WL QA phantom (Sun Nuclear) and the MultiMet-WL QA software (version 2.1.0, Sun Nuclear). The MultiMet-WL QA phantom, a rectangular parallelepiped with dimensions of 8.5 cm × 8.5 cm × 1.275 cm, contains six tungsten carbide spheres with a diameter of 5.0 ± 0.025 mm arranged within its structure. Figure 1 provides a visual representation of the study workflow.
Research flow: I. Creation of an FM with sagging correction offset. II. Image analysis using RIT113. III. Image analysis using ImageJ.

Acquisition of 10 different FMs
The FM is created from the image of BB positioned at the isocentre to correct for sagging of EPID. The BB was positioned based on a laser pointer, and the Winston–Lutz (W-L) test was conducted using eight MV images at gantry angles (0°, 90°, 180° and 270°) with two opposite collimator angles (90° and 270°), 6 MV and 12.5 monitor units. The W-L test results were analysed with Elekta XVI software to determine displacement relative to the image isocentre. The BB was then precisely repositioned to within 0.05 mm in all directions using a dial gauge to establish the reference FM. To generate FMs with known positional shifts, the BB was moved by 0.2, 0.4 and 0.6 mm in the left, table and up directions using the dial gauge, producing nine additional FMs with single-direction shifts.
Evaluation of the Catphan phantom images using 10 different FMs
CBCT images of the Catphan phantom were scanned using two module position configurations: (1) centre: CT404 and off-axis: CT528 and (2) centre: CT528 and off-axis: CT404. These scans were performed using all 10 types of FMs without altering the phantom’s position.
Image quality analysis of the centre and off-axis of each module using RIT113
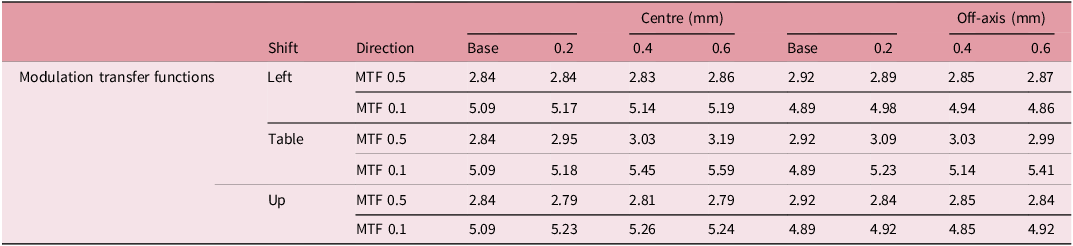
To assess image distortion and deformation caused by FMs with sagging correction errors, the distances between image inserts in the anterior–posterior and left–right directions of the CTP404 module were measured using RIT113. For both module configurations, the modulation transfer function (MTF) was calculated from the CTP528 image results to evaluate image blurring caused by sagging correction errors. Additionally, the MTF0.5 and MTF0.1 values were computed to obtain quantitative metrics of image resolution.
Evaluation of the geometric coordinates of the centre and off-axis of each module using ImageJ
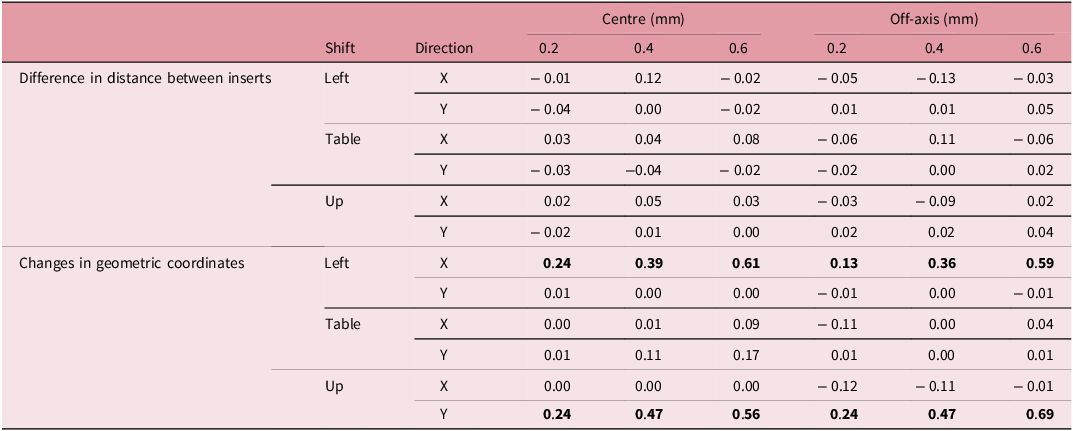
To evaluate geometric coordinate changes due to sagging correction errors, CBCT images of the CT404 module were binarised, and edge-extraction processing was performed using ImageJ. The centre of gravity of two image inserts was measured (Figure 1). Differences in the centre-of-gravity coordinates with and without sagging correction errors were calculated for both inserts, and the averaged results across all FMs were recorded. To further facilitate QA data sharing related to sagging corrections, binarised and edge-extracted CBCT images with and without sagging correction errors were subtracted using ImageJ to visualise differences.
Evaluation for off-axis of sagging correction error using the MultiMet-WL QA phantom and couch shift
To evaluate the effects of sagging correction errors on the centre and off-axis image coordinates, the W-L test of the MultiMet-WL QA phantom was conducted with no shifts and with shifts of 0.3 mm in the left, table and up directions using 15 different combinations of gantry angles and collimator positions. The MultiMet-WL QA phantom was irradiated with 6 MV X-rays using a field size of 2 cm × 2 cm for the off-axis target with a single isocentre. The W-L test results were analysed using the MultiMet-WL QA software.
Statistical analysis
Correlation coefficients (r) between sagging correction errors and changes in the centre-of-gravity coordinates were calculated using the SPSS statistical software (IBM).
Results
The distances between the inserts of the CT528 CBCT images across the 10 types of FMs showed minimal variation, with changes of <0.15 mm observed in both the X and Y directions. Figure 2 presents the MTF results at the centre, while Figure 3 displays the MTF results off-axis. When the sagging compensation offset was ≤0.6 mm, no remarkable change was observed in the MTF. A slight variation in MTF0.1 was noted in the table direction; however, for other directions, negligible changes were observed in both MTF0.5 and MTF0.1 (Table 1).
MTF of sagging correction error along centre position: (a) left, (b) table, (c) up, and along off-axis: (d) left, (e) table and (f) up.

Subtraction images obtained without and with sagging correction errors.

Relationship between errors during sagging correction and MTF0.5 and MTF0.1

The geometric coordinates of the images exhibited changes corresponding to sagging correction errors in the left and upward directions, with a strong correlation observed between the centre and off-axis positions (left: centre; r = 0.994, off-axis; r = 1.000, up: centre; r = 0.974 and off-axis; r = 1.000) (Table 2). In the table direction, the sagging correction error did not result in any shifts for either the centre or off-axis positions, as axial images could not evaluate the shifts. Consequently, no notable changes were noted in either the centre or off-axis positions.
Changes in distance and geometric coordinates of inserts relative to the reference image

Figure 3 shows a subtraction image highlighting the emphasised sagging correction error. The results from the inserts revealed a crescent-shaped shadow in the direction of the geometric shift for the high-contrast insert, while the shadow appeared in the opposite direction for the low-contrast insert. However, in the axial image, no geometric changes in the table direction were observed (Figure 3 (d)–(f)).
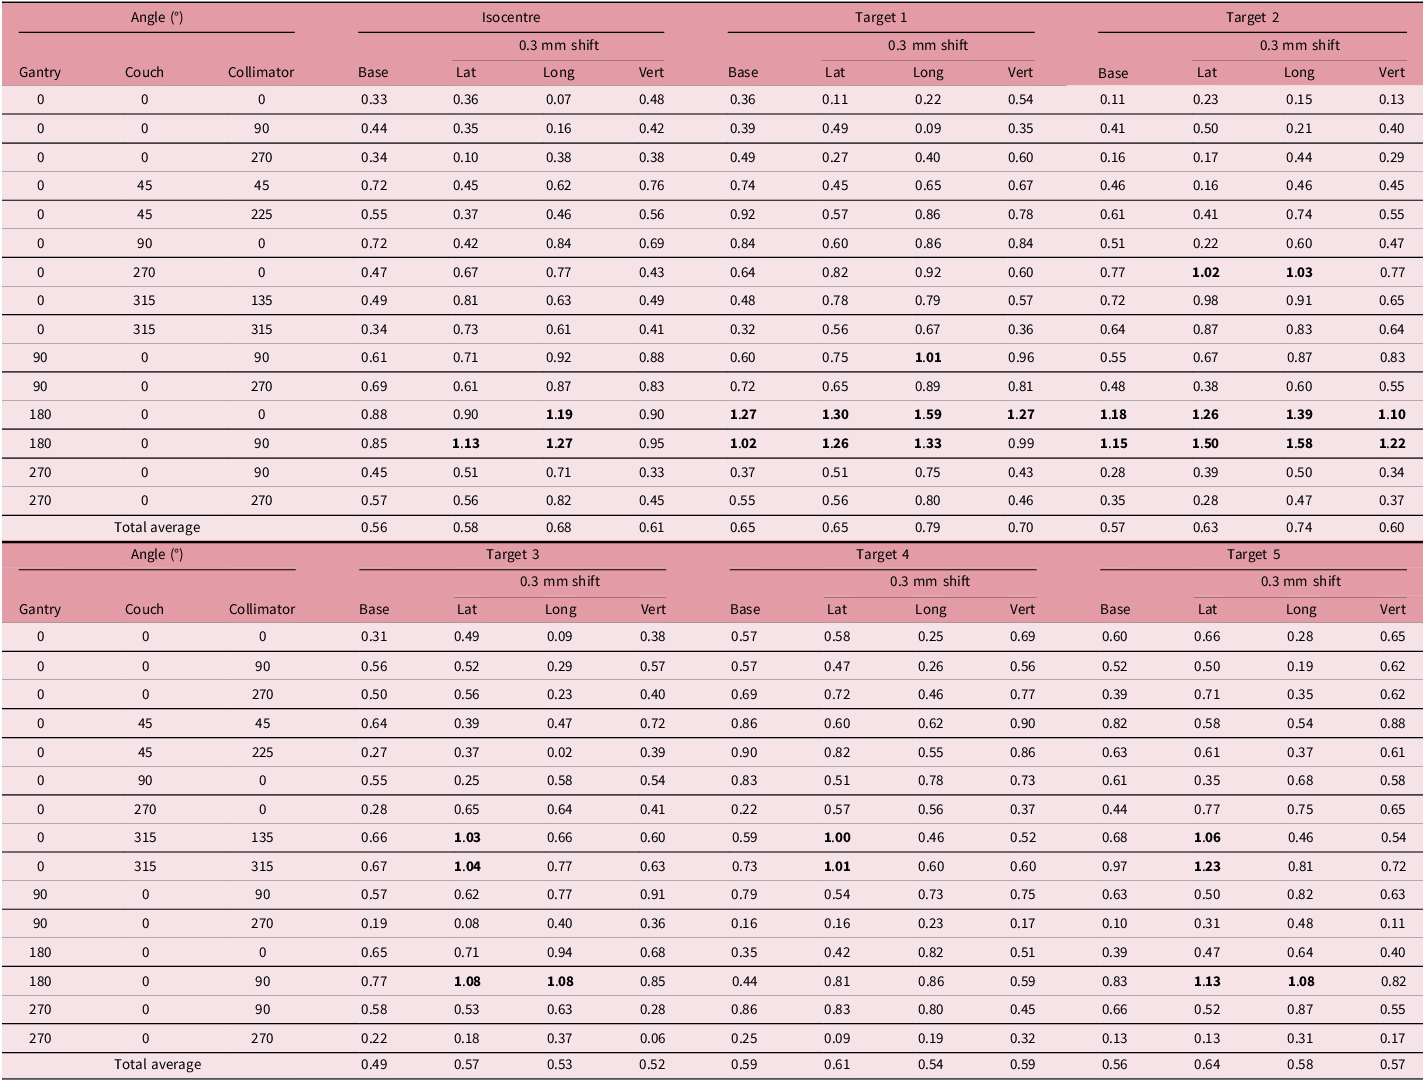
Figure 4 illustrates the results of the W–L test for the isocentre and target 1 using the MultiMet-WL QA phantom. In the W–L test results, the isocentre showed a difference exceeding 1.0 mm for a 0.3 mm sagging correction error, while target 1 off-axis exhibited a difference >1.0 mm in the 180° direction. Table 3 summarises the W–L test results for all targets using the MultiMet-WL QA phantom. The total average difference for target 1 was the largest among all targets (base: 0.65 mm, lateral: 0.65 mm, longitudinal: 0.79 mm and vertical: 0.70 mm). Additionally, for a 0.3 mm sagging correction error, the difference in the W–L test was large (max: 0.14 mm) except for the long in target 4.
Winston–Lutz test results for isocentre and target 1 using the MultiMet-WL QA phantom.

Results of the Winston–Lutz test using the MultiMet-WL QA phantom

Discussion
We examined the effects of centre and off-axis positions on IGRT systems using a method designed to simplify the understanding and sharing of information among staff through image analysis.
In the evaluation of distances between inserts, sagging correction errors of approximately 0.6 mm caused negligible changes. Set-up errors in BB positioning at the isocentre likely introduce only systematic translational errors in the geometric coordinates of CBCT images generated by the FM and may not cause geometric distortion in peripheral images. However, because the Elekta IGRT FM is created using a centre-set BB, QA for off-axis positions is essential. This includes considerations such as image scaling, beam alignment and the parallelism of imaging devices with gantry angle and the panels of the XVI and kV CBCT systems. Reference Moore, Amer and Marchant26
Based on the MTF results, image blurring was observed only in images created using the FM with shifts in the table direction; shifts in the other directions did not cause blurring. The MTF change in the table direction is likely due to reconstruction-related geometric shifting of the CBCT image. The absence of change in other directions may be related to the EPID pixel size (0.4 × 0.4 mm2) and image filtering effects, making reconstruction shifts of approximately 0.6 mm insufficient to alter MTF results. Reference Sun, Yaddanapudi and Mutic27
In our previous study, differences in automatic matching accuracy between neck and pelvis phantoms were reported. Reference Yamazawa, Osaka and Fujii17 We believe this discrepancy is related to automated matching accuracy, which varies depending on phantom size. Thus, clinical practice should consider matching accuracy in relation to phantom or target size and the chosen region of interest. Reference Harada and Takemura28
The evaluation of geometric coordinates in this study through the analysis of Catphan phantom images demonstrated a high correlation between sagging correction errors and changes in the centre-of-gravity coordinates, as compared with traditional image-matching methods. Reference Yamazawa, Osaka and Fujii17 This improvement arises because the method in this study avoids uncertainties in matching accuracy caused by slight image shifts. We speculate that deviations in sagging correction may introduce systematic errors in image-matching, which is particularly critical for treatments such as SRT that require positional accuracy <1 mm. Reference Bissonnette, Balter and Dong15
Subtraction images further visualised the impact of sagging correction errors, allowing small errors to be emphasised through image processing. This method provides clearer visualisation for staff and allows objective evaluation of laser-adjustment stability by comparing pre- and post-adjustment images. Given the widespread use of Catphan phantoms, this approach offers a standardised QA method.
In the off-axis W–L test, introducing a 0.3 mm sagging correction error increased the number of irradiation gantry and couch angle combinations exceeding the 1-mm tolerance required for SRT. Off-axis deviations became more pronounced, requiring increased caution in treatments involving multiple metastases. Small differences between centre and off-axis results likely stem from minor positioning errors during phantom installation. Reference Chojnowski, Warr and Sykes18 Conducting a final check with simple and easy-to-interpret QA tools following FM registration is clinically beneficial to avoid systematic errors in position-matching software. Reference Yan, Mittauer, Huang and Lu29
One limitation of this study is that MTF values may change depending on the phantom imaging position; however, the overall MTF trends are likely unaffected. Analysis of raw data without image processing may further clarify differences caused by small FM shifts. Another limitation is the lack of evaluation for large sagging errors (>0.6 mm), although such errors are unlikely in clinical practice. This study highlights the impact of BB positioning errors when acquiring FMs for IGRT. Furthermore, the subtraction-image method proposed here may improve information sharing among radiotherapy staff and mitigate the risk of errors in high-stakes clinical tasks. Reference O’Sullivan and Lyons30
Conclusions
Sagging correction errors in the image-matching system introduce systematic positional errors in IGRT, with off-axis locations exhibiting greater sensitivity. Sagging correction errors ≤0.6 mm in all directions except the table direction did not result in image blurring, as confirmed by MTF analysis. The subtraction-image method presented in this study provides a robust approach for visualising sagging correction errors, improving QA outcomes and supporting effective information sharing among radiotherapy staff.
Data availability statement
The data used to support the findings of this study are available from the corresponding authors upon reasonable request.
Acknowledgements
This work was supported by JSPS KAKENHI (grant number: JP23K07063).
Author contribution statement
Yasushi Fujii and Yoshinori Tanabe designed the study, the main conceptual ideas and the proof outline. Takahiro Nakayama, Junki Oshita, Ayaka Tsunoda and Yusuke Saeki collected the data. Yasushi Fujii and Yoshinori Tanabe interpreted the results and worked on the manuscript. All authors discussed the results and commented on the manuscript.
Financial support
This work was supported by JSPS KAKENHI (grant number: JP23K07063).
Competing interests
None.
Declaration of generative AI in scientific writing
None.


 Open access