





Introduction
High blood pressure, or hypertension, is a major risk factor for cardiovascular-related death globally and is attributable to about half of all heart disease and stroke-related deaths worldwide. Reference Whelton, Carey and Aronow1 In the United States, an estimated 45% of adults (120 million) are living with hypertension, Reference Ogunniyi, Commodore-Mensah and Ferdinand2 with prevalence rates highest among Black adults (59%) compared with White (47%), Asian (45%), and Hispanic (44%) adults. Reference Ogunniyi, Commodore-Mensah and Ferdinand2 However, less than a quarter of adults with hypertension have their condition under control. 3 Left untreated, hypertension can damage and/or create blockages within blood vessels, reducing both elasticity and blood flow to the heart and brain. Reference Ambale-Venkatesh, Yang and Wu4 Consequently, hypertension is recognized as a risk factor for many chronic health conditions, including cardiovascular disease (CVD), chronic kidney disease (CKD), stroke, vision loss, and dementia. Reference Zhou, Perel and Mensah5 Identification of risk factors for adult hypertension may have important implications for chronic disease prevention.
The Developmental Origins of Health and Disease (DOHaD), or Barker Hypothesis, suggests that exposures in utero and in early childhood, such as fetal nutrition, can influence the incidence of disease in childhood and later in life. Reference Barker6 Evidence supporting the DOHaD hypothesis has been demonstrated previously by Barker et. al., where fetal malnutrition and subsequent rapid weight gain in early childhood was strongly associated with diseases later in life. Reference Barker, Osmond and Kajantie7 Additional research supports the role that birth weight and gestational age play in adult-onset chronic diseases, including but not limited to cardiovascular disease, cancer, type 2 diabetes, and autoimmune conditions. Reference Daniele, Farland and Park8–Reference Spracklen, Wallace and Sealy-Jefferson13 The association between low birth weight (weighing <2500 g at birth) and increased risk for later-life hypertension is supported by previous studies. Reference Huxley, Shiell and Law14–Reference Victora, Adair and Fall16 A meta-analysis including 53 studies published through October 2016 examined the relationship between birth weight and hypertension and/or blood pressure, Reference Knop, Geng and Gorny17 with results consistently demonstrating a decreasing risk for hypertension and lower mean systolic blood pressure (SBP) as birth weights increase. Overall, however, most prior studies evaluated populations of primarily European descent and focused primarily on low birth weight. Additionally, less is known about the potential relationship between other birth weights and diastolic blood pressure (DBP) and/or pulse in adulthood.
There is a smaller body of literature on the potential association between preterm birth and both later-life hypertension and quantitative blood pressure measures. A meta-analysis of 27 studies provides evidence that being born late preterm (34–36 weeks gestational age) is associated with an increased risk of hypertension among individuals <18 and ≥18 years of age. Reference Yoshida-Montezuma, Stone and Iftikhar18 Further, a meta-analysis of 10 studies suggests an increase in SBP in people born preterm when compared to those born full term. However, as noted by the authors, their results may lack generalizability as the study populations were predominantly Scandinavian with no US-based studies. There are additional concerns that the included studies over-adjusted their models for covariates that may be collinear with gestational age and/or on the causal pathway (e.g., birth weight), suggesting an independent association with gestational age that may actually be attributable to birth weight. Reference Ryckman, Rillamas-Sun and Spracklen11
In this study, we examined the relationship between an individual’s birth weight or preterm birth status with 1) their risk for hypertension and 2) their related quantitative measures – systolic and diastolic blood pressure and 30-second pulse – using the Women’s Health Initiative (WHI), a diverse cohort of postmenopausal women from across the United States.
Methods
Study population
The WHI is a prospective cohort study designed to assess socio-demographic, clinical, and behavioral risk factors for disease outcomes in a population of postmenopausal women. From 1993–1998, 161,608 postmenopausal women between 50 and 79 years of age were enrolled from 40 clinical recruitment sites across the United States. 19 Study participants were enrolled into a long-term observational study (WHI-OS; n = 93,676) or into overlapping clinical trials (WHI-CT; n = 67,932); the present study only included women that enrolled in the observational study as these individuals completed the questionnaire that collected data on birth weight and preterm birth status. From 2005–2010 and 2010–2020, participants from each of the original WHI study arms were invited to complete two additional follow-up assessments (“Extension I” and “Extension II”). The average length of follow-up for all included participants was 15.4 years. Additional details regarding WHI’s design, recruitment, and implementation have been described elsewhere. 19 Each participating clinical recruitment site’s Institutional Review Board approved all study protocols, with all participants providing written, informed consent at enrollment.
Exposure definition and measurement
Upon entry into the WHI-OS, participants completed structured, self-administered questionnaires that gathered information on demographics, lifestyle factors, and family, medical, and reproductive health histories. Study participants reported their personal birth weight at baseline as one of the following categories: <6 pounds (lbs.); 6 lbs. to 7 lbs. 15 ounces (oz.); 8 lbs. to 9 lbs. 15 oz.; and ≥10 lbs. Although the accuracy of self-reported exact birth weight is poor, the collection of birth weight information by category has been previously validated in adults aged 25–69 years (correlation r = 0.67–0.83). Reference Jaworowicz, Nie and Bonner20–Reference Wodskou, Hundrup and Obel22 In addition to birth weight information, women were asked to report if they were born “four or more weeks premature.” We considered women who responded “yes” to this question to be born preterm. Furthermore, women were asked to report if they were part of a multiple pregnancy (twin or triplet). Trained clinical staff also used standardized protocols to obtain accurate anthropometric and other clinical measures at baseline by means of a physical assessment.
Outcome definitions and measurement
Our primary outcome was prevalent (diagnosed prior to enrollment) or incident (developed during study follow-up) treated hypertension. Hypertension was defined using the guidelines at the time of data collection (Joint National Committee IV [1988] through VI [1997]). 23–25 Individuals were considered to have prevalent hypertension if they answered “yes” to the following question: “Did a doctor ever say that you had hypertension or high blood pressure? (Do not include high blood pressure that you had only when you were pregnant.)” Participants were considered to have incident hypertension if they answered “yes” to the following question on the annual medical history questionnaires: “Since the date on this form, has a doctor prescribed for the first time any pills for high blood pressure or hypertension?” The accuracy of self-reported hypertension has been previously validated in the Women’s Health Initiative and is considered to have a high degree of sensitivity and specificity at varying time-points. Reference LaMonte, Milton and Miller26
Quantitative measures related to blood pressure obtained at enrollment (SBP, DBP, and 30-second pulse) were analyzed as secondary outcomes. During the baseline physical assessment, trained study staff measured participant blood pressure twice; the means of the two systolic and diastolic measurements were recorded. Resting pulse was taken once over a 30 s period during the same clinical assessment (termed “30-second pulse”).
Exclusion criteria
For all analyses, participants were excluded if they reported being a twin or triplet (n = 1575) or if they were missing information on both their birth weight and premature birth status (n = 3200). Additionally, participants reportedly born prematurely, or who were missing their premature birth status, were excluded from birth weight analyses (n = 3931). The final maximal sample sizes for birth weight and preterm birth analyses were n = 76,139 and n = 86,925, respectively (Supplemental Figure 1).
Statistical analyses
Baseline characteristics of study participants were examined by an individual’s preterm birth status (preterm and full term) and by birth weight category (<6 lbs., 6 lbs. to 7 lbs. 15 oz., 8 lbs. to. 9 lbs. 15 oz., and ≥10 lbs.). Categorical variables were compared using chi-square tests, while ANOVA and t-tests were used to compare continuous variables in birth weight and preterm birth analyses, respectively. Multivariable linear regression modeling was used to generate crude and adjusted beta estimates (β) and associated standard errors (SE) to examine for associations between birth weight or preterm birth status with quantitative blood pressure-related measures. Furthermore, multivariable logistic regression modeling was used to estimate crude and adjusted odds ratios (OR) and 95% confidence intervals (95% CI) for the associations between birth weight and preterm birth status with prevalent hypertension. To determine the association between birth weight or preterm birth and incident hypertension, survival analyses were conducted using Cox-proportional hazards models to generate crude and adjusted hazards ratios (HR) and associated 95% CIs. Follow-up time was calculated as the number of days from enrollment until one of the following: 1) self-report of taking medications for hypertension; 2) last study contact prior to loss-to-follow-up; or 3) end of Extension II. The proportional hazards assumption was tested based on visualization of the survival probabilities over time and the scaled Schoenfeld residuals for both birth weight and preterm birth; the assumptions were met. For birth weight analyses, “6 lbs. to 7 lbs. 15 oz.” was used as the referent category as full-term infants born within this weight range are considered to be within a normal weight range. “Full term” was used as the referent category for preterm birth analyses.
Established demographic and lifestyle risk factors for hypertension that were reported at study enrollment were considered for inclusion as covariates in our models. These include age (continuous), race (categorical), Hispanic ethnicity (categorical), neighborhood socioeconomic status (NSES, continuous), alcohol use (categorical), smoking history (categorical), recreational physical activity (metabolic equivalent of task [MET]/week, continuous), education (categorical), use of antihypertensive medications (binary; quantitative blood pressure analyses only), and the region of the US in which the study participant lived (categorical). Self-reported diabetes was explored as a potential covariate; however, it was statistically insignificant in bivariate analyses and, therefore, not included in our final models.
There is controversy in life-course epidemiology as to whether adult lifestyle factors, such as alcohol use, should be adjusted for in statistical models. Reference Farland, Correia and Dodge27 Due to this, results are presented unadjusted, partially adjusted, and fully adjusted for demographic and lifestyle factors. Additionally, because birth weight and gestational age are strongly correlated, including the birth weight category as a covariate in preterm birth analyses may adjust away part or all of an association between preterm birth and hypertension or quantitative blood pressure measures. To allow for a direct comparison of disease risk among women born of similar birth weights, preterm birth analyses are also presented stratified by birth weight category. Lastly, due to differences in the prevalence of hypertension in racial and ethnic populations, results are presented for all analyses stratified by race and ethnicity. All statistical tests were two sided and P-values less than 0.05 were considered statistically significant. All analyses were performed using Stata SE Version 17.0. 28
Results
Birth weight
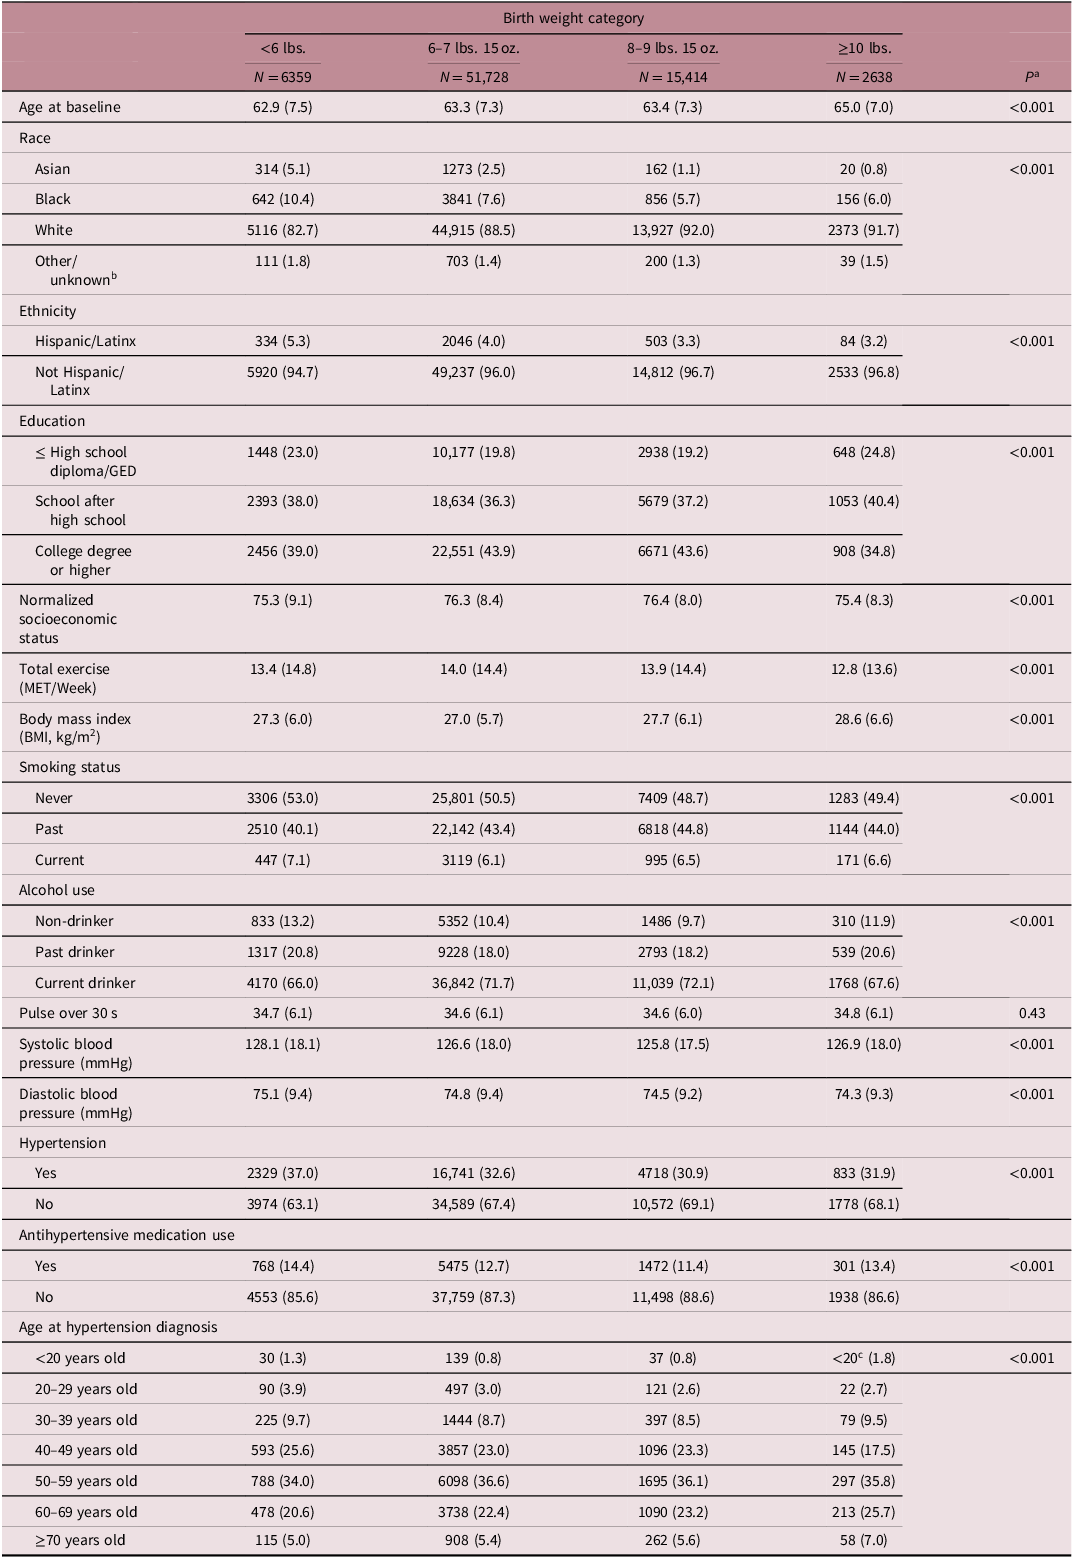
Table 1 shows baseline characteristics of study participants stratified by self-reported birth weight category. At enrollment, participants born weighing <6 lbs. were more likely to be younger, identify as Asian, Black, and/or Hispanic/Latinx, report never having smoked, report being a past drinker or non-drinker, have a higher mean SBP or DBP, and have hypertension than participants in other birth weight categories. At enrollment, participants born weighing ≥10 lbs. were more likely to have a higher BMI and lower levels of physical activity compared to participants born in other birth weight categories. Individuals born weighing <6 lbs. or ≥10 lbs. were more likely to report taking antihypertensive medications than individuals born in the other two birth weight categories. There was no difference in 30-second pulse across birth weight categories.
Baseline characteristics of 76,139 WHI study participants by birth weight category

Numbers are N (%) for categorical variables and (mean, standard deviation) for continuous variables.
a P values are from ANOVA and chi-square statistics and compare groups across birth weight.
b The Other/Unknown category includes American Indian/Alaskan Native; Native Hawaiian/Pacific Islander, More than one race, and Unknown/Not reported.
C Policy from the Women’’s Health Initiative will not allow researchers to report number of participants in cells with fewer than 20 individuals. As such, cells that contain fewer than 20 participants read “<20”.
WHI, women’’s health initiative; GED, general educational development; MET, metabolic equivalent of task; BMI, body mass index.
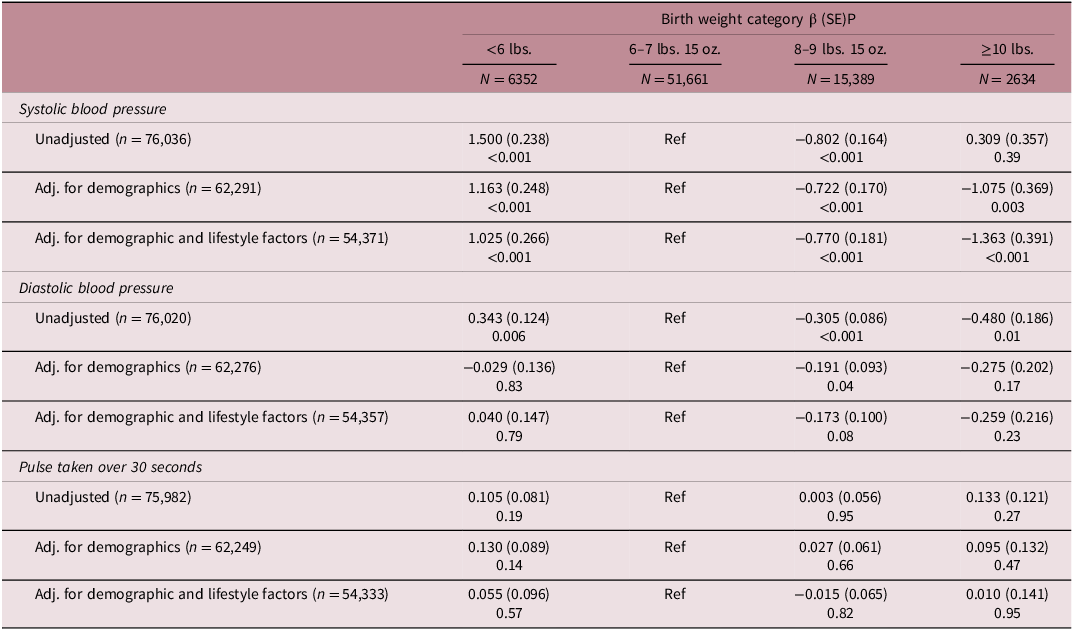
Table 2 presents unadjusted and demographic- and lifestyle-adjusted beta (β) estimates for the associations between birth weight and SBP, DBP, and 30-second pulse. Overall, we observed an inverse association between birth weight category and SBP and DBP. Compared to participants born weighing between 6 lbs. to 7 lbs. 15 oz., participants born weighing less than 6 lbs. and participants born weighing ≥10 lbs. had a higher and lower mean SBP, respectively (<6 lbs.: βadj = 1.025, SE = 0.266, P < 0.001; ≥10 lbs.: βadj = −1.363, SE = 0.391, P < 0.001). In analyses stratified by race and ethnicity, the observed associations between birth weight and mean SBP among participants were strongest and only statistically significant among women who identify as White and non-Hispanic/Latinx after adjusting for confounding (Supplemental Table S1). Furthermore, participants born weighing <6 lbs. had a higher mean DBP (βunadj = 0.343, SE = 0.124, P = 0.006) and participants born weighing ≥10 lbs. had a lower mean DBP (βunadj = −0.480, SE = 0.186, P = 0.01) when compared to participants weighing between 6 lbs. to 7 lbs. 15 oz.; however these associations became statistically insignificant when fully adjusting for demographic and lifestyle factors (Table 2). We did not observe any significant associations between any of the birth weight categories and 30-second pulse.
Results from linear regression analyses of the association between birth weight and quantitative blood pressure measures

Demographic factors include age, race, ethnicity, region, and use of antihypertensive medications. Lifestyle factors include smoking status, education, normalized socioeconomic status, exercise (metabolic equivalent of task/week), and alcohol use.
SE, standard error.
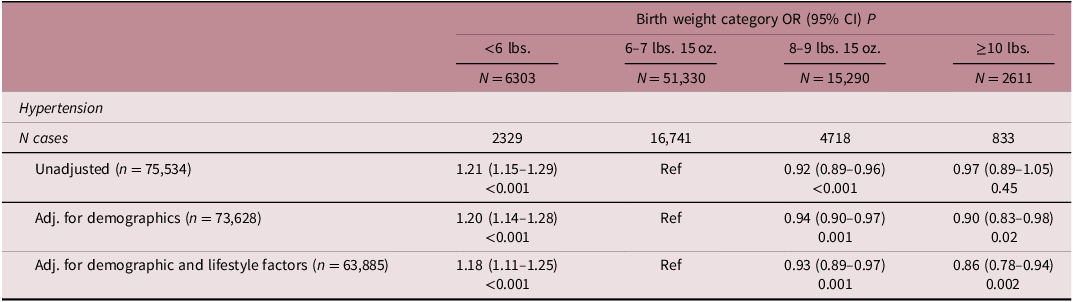
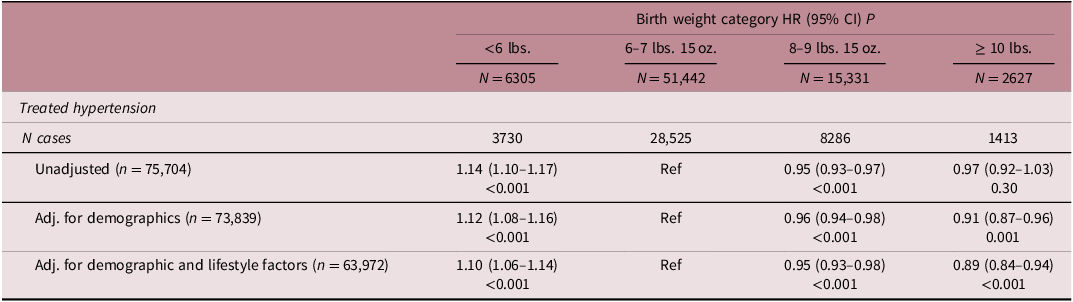
We observed an inverse association between birth weight category and risk for both prevalent and incident hypertension (Tables 3 and 4). Compared to those born weighing between 6 lbs. and 7 lbs. 15 oz., participants born weighing less than 6 lbs. had increased odds (ORadj 1.18, 95% CI 1.11–1.25, P < 0.001) while those born weighing ≥10 lbs. had decreased odds (ORadj 0.86, 95% CI 0.78–0.94, P = 0.002) for prevalent hypertension reported at study enrollment. Similarly, participants born weighing less than 6 lbs. (HRadj 1.10, 95% CI 1.06 –1.14, P < 0.001) and ≥10 lbs. (HRadj 0.89, 95% CI 0.84– 0.94, P < 0.001) had significantly increased and decreased risk for incident hypertension, respectively. Prevalent and incident hypertension results were consistent among women who identified as White and non-Hispanic/Latinx after adjusting for confounding (Supplemental Tables S2 and S3).
Results from logistic regression analyses of the association between birth weight and prevalent hypertension reported at enrollment

Demographic factors include age, race, ethnicity, and region. Lifestyle factors include smoking status, education, normalized socioeconomic status, exercise (metabolic equivalent of task/week), and alcohol use.
OR, odds ratio; CI, confidence interval.
Results from Cox-proportional hazards regression analyses of the association between birth weight and incident treated hypertension

Demographic factors include age, race, ethnicity, and region. Lifestyle factors include smoking status, education, normalized socioeconomic status, exercise (metabolic equivalent of task/week), and alcohol use.
HR, hazard ratio; CI, confidence interval.
Preterm birth
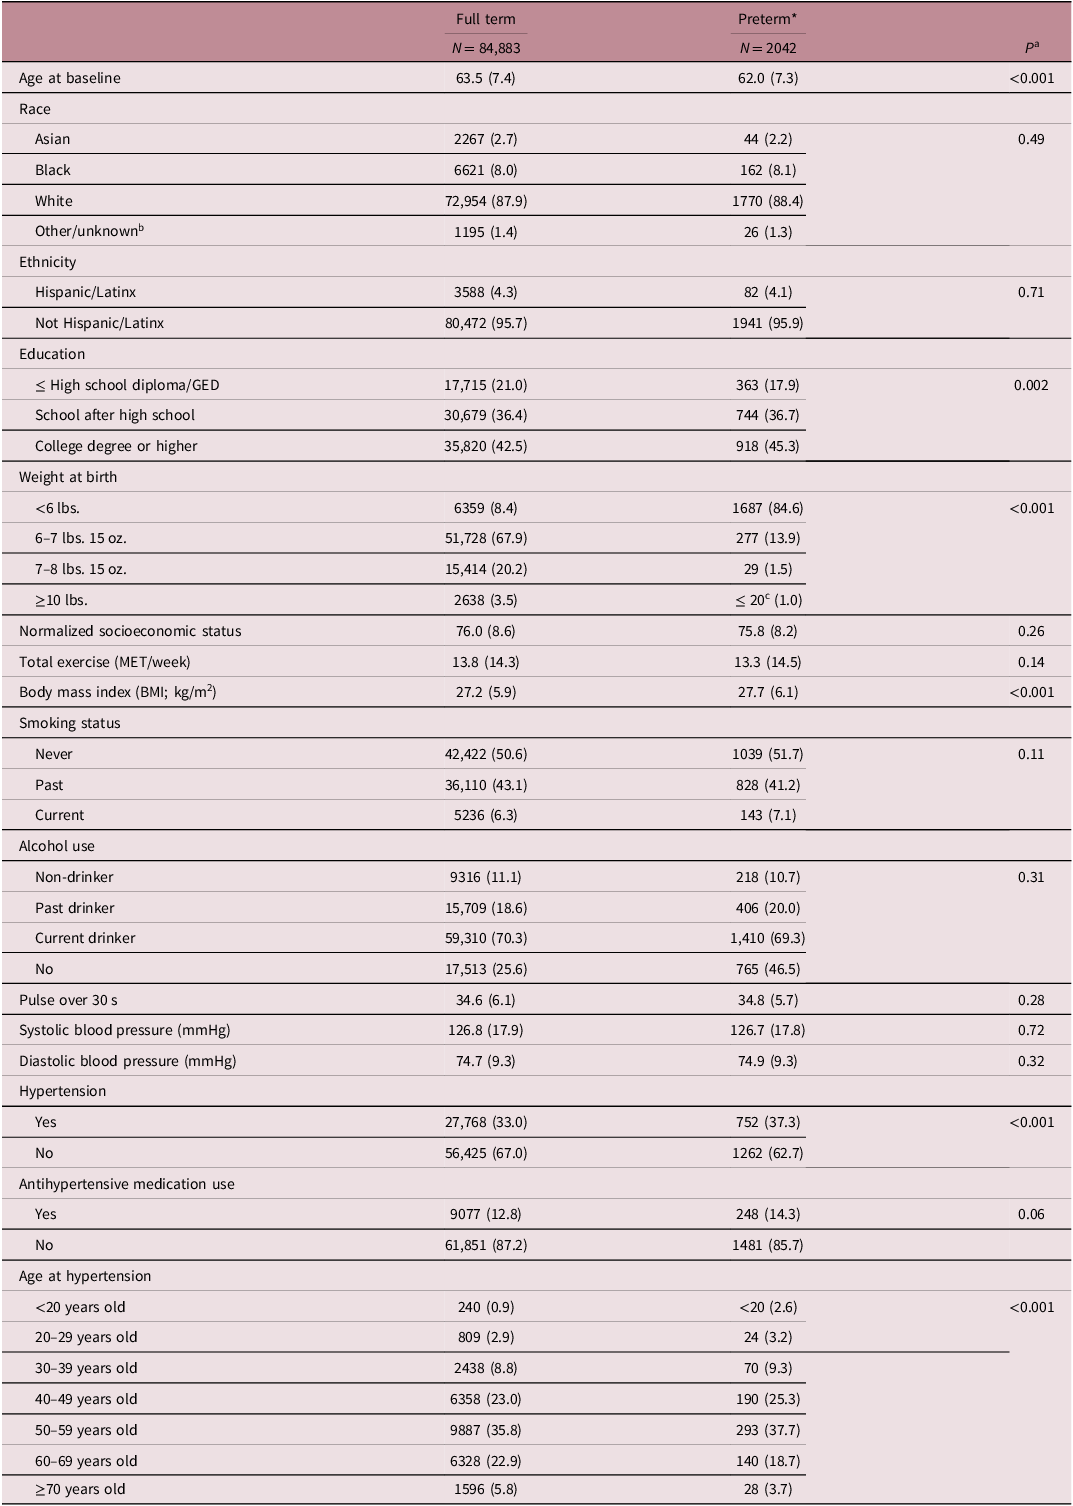
Table 5 shows baseline characteristics of study participants stratified by preterm birth category. At enrollment, participants who reported being born full term were more likely to be older, have ≤ a high school diploma/General Educational Development (GED) and have a lower BMI when compared to participants who reported being born preterm. Preterm participants were more likely to have been born weighing <6 lbs. and have hypertension at enrollment compared to participants who reported being born full term. No statistically significant differences were identified between full-term and preterm participants across race, ethnicity, NSES, total exercise, smoking status, alcohol use, 30-second pulse, SBP, and DBP.
Baseline characteristics of 86,925 WHI study participants, by preterm birth category

Numbers are N (%) for categorical variables and (mean, STD) for continuous variables.
*Preterm defined as being born ≥4 weeks premature.
a P values are from t-test and chi-square statistics and compare groups across preterm birth category.
b The other/unknown category includes: American Indian/Alaskan Native; Native Hawaiian/Pacific Islander; More than one race; and Unknown/Not reported.
C Policy from the Women’s Health Initiative will not allow researchers to report number of participants in cells with fewer than 20 individuals. As such, cells that contain fewer than 20 participants read “<20”.
WHI, women’s health initiative; GED, general educational development; NSES, normalized socioeconomic status; MET metabolic equivalent of task; BMI, body mass index.
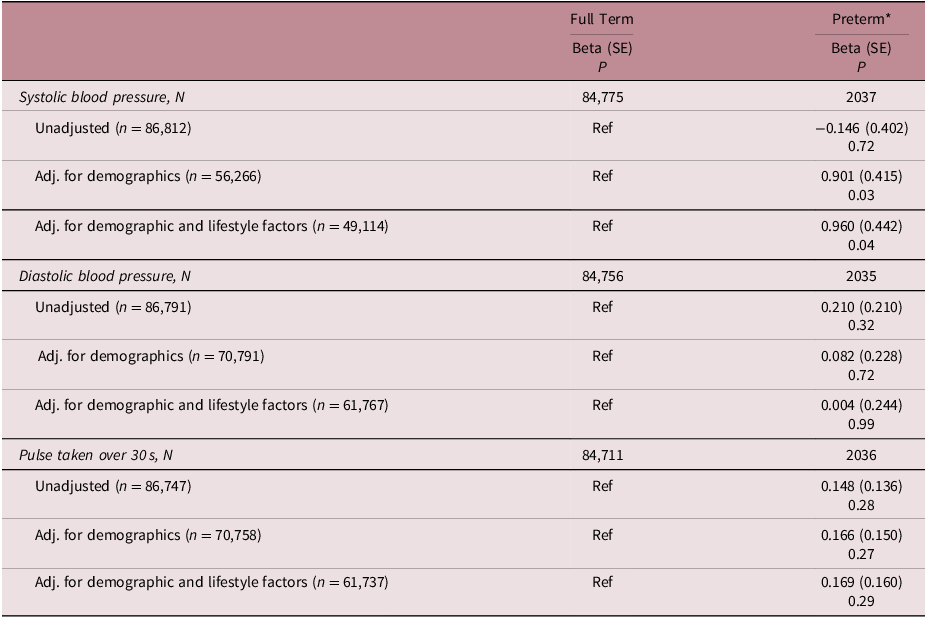
Table 6 presents unadjusted and adjusted β estimates for the association between preterm birth status and quantitative blood pressure measures. Participants born preterm have significantly higher SBP levels than those born full term (βadj = 0.960, SE = 0.442, P = 0.04). When stratifying by race and ethnicity and adjusting for demographic and lifestyle factors, there was a marginally significant increase in SBP among Non-Hispanic/Latinx participants (βadj = 0.920, SE = 0.448, P = 0.04) (Supplemental Table S4). Additionally, Asian participants had a significantly higher DBP after adjusting fully adjusting for confounding (βadj = 5.413, SE = 2.221, P = 0.02). Stratified by birth weight category, there was a statistically significant decrease in SBP among participants born preterm and who weighed 6–7 lbs. 15 oz. at birth in only the unadjusted model when compared to participants born full term (β = −3.268, SE = 1.082, P = 0.003) (Supplemental Table S5). There was no statistically significant association between being born premature and 30-second pulse. Given the collinear nature of birth weight and gestational age, these results suggest that birth weight category is likely the exposure underlying the observed relationship.
Results from linear regression analyses of the association between preterm birth status and quantitative measures related to hypertension

Demographic factors include age, race, ethnicity, region, and use of hypertensive medications. Lifestyle factors include smoking status, education, normalized socioeconomic status, exercise (metabolic equivalent of task/week), and alcohol use.
*Preterm defined as being born ≥4 weeks premature.
SE, standard error.
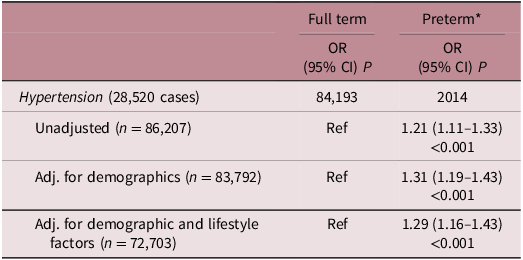
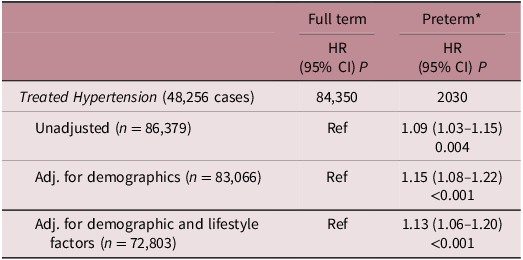
Results for the associations between preterm birth status with baseline and incident hypertension are presented in Tables 7 and 8, respectively. We observed significantly higher odds of prevalent hypertension in participants born preterm when compared to those born full term (ORadj 1.29, 95% CI 1.16–1.43; Table 7, P < 0.001). We also observed a significantly higher risk of incident hypertension in participants born preterm when compared to participants born full term (HRadj 1.13, 95% CI 1.06–1.20; Table 8, P < 0.001). In analyses stratified by race and ethnicity, all prevalent and incident results remained significant in White and Non-Hispanic/Latinx populations (Supplemental Tables S6 and S7). However, when limiting our analyses to only those who reported weighing <6 lbs. at birth, all results were attenuated and no longer statistically significant (Supplemental Tables S8 and S9), suggesting birth weight category is likely the exposure underlying the observed relationship.
Results from logistic regression analyses of the association between preterm birth status and hypertension

Demographic factors include age, race, ethnicity, and region. Lifestyle factors include smoking status, education, normalized socioeconomic status, exercise (metabolic equivalent of task/week), and alcohol use.
*Preterm defined as being born ≥4 weeks premature.
OR, odds ratio; CI confidence interval.
Results from Cox-proportional hazards regression analyses of the association between preterm birth and incident treated hypertension

Demographic factors include age, race, ethnicity, and region. Lifestyle factors include smoking status, education, normalized socioeconomic status, exercise (metabolic equivalent of task/week), and alcohol use.
*Preterm defined as being born ≥4 weeks premature.
HR, hazard ratio; CI, confidence interval.
We did not identify any statistical interactions between birth weight category and preterm birth for any linear, logistic, and Cox-proportional hazards regression models.
Discussion
We identified multiple significant associations between birth weight and preterm birth with hypertension and related measures within the WHI-OS cohort. Individuals who self-reported being born <6 lbs. had a higher SBP and higher prevalence of hypertension at baseline and were more likely to develop incident hypertension compared to those with birth weights between 6 and 7 lbs. 15 oz. Conversely, those born weighing ≥10 lbs. had a lower SBP and had a lower prevalence of hypertension at baseline and were and were more likely to develop incident hypertension compared to those with birth weights between 6 and 7 lbs. 15 oz. Initial analyses suggest individuals born ≥4 weeks premature had a higher mean SBP and had a lower prevalence of hypertension at baseline and were more likely to develop incident hypertension compared to those born full term; however, the attenuation and loss of significance when limiting analyses to those reportedly weighing <6 lbs. at birth suggests birth weight may be the key exposure underlying these relationships. The observed SBP and DBP differences between groups is modest; however, it’s important to note that even small differences in blood pressure have large implications at the population level, with a 2 mmHg reduction in SBP being shown to reduce stroke and heart disease mortality by 10% and 7%, respectively. Reference Andraweera, Condon and Collett29
Low birth weight and preterm birth are often considered markers of poor fetal nutrition and/or an adverse in utero environment. According to Barker’s hypothesis, maternal or fetal malnutrition can result in fetal epigenetic changes that may alter DNA methylation patterns and, thus, gene expression programming, which can influence the risk of disease later in life and adulthood. Reference Barker6,Reference Jebasingh and Thomas15 Additionally, a poor in utero environment is suspected to reduce the number and size of kidney nephrons, negatively impacting renal function, which is a critical component of arterial blood pressure and sodium regulation. Reference Bruno, Faconti and Taddei30,Reference Wadei and Textor31 This can also impact the renin-angiotensin-aldosterone (RAAS) system, which is responsible for regulating both blood volume and systemic vascular resistance. Reference Victora, Adair and Fall16 Further, preterm infants are typically born before nephrogenesis is completed, leading to abnormal renal development as a result of accelerated renal maturation. Reference Zohdi, Sutherland and Lim32 Consequently, altered kidney development and function experienced by infants born from an adverse in utero environment may account for the increased risk of high blood pressure values and hypertension. Reference Abitbol, DeFreitas and Strauss33
Current evidence suggests an inverse association between birth weight and SBP. Reference Huxley, Neil and Collins34 High birth weights are associated with decreases in SBP, although the magnitude of the change is variable, and its significance often decreases as the sample size of the study increases. Reference Victora, Adair and Fall16,Reference Huxley, Neil and Collins34 A 2018 meta-analysis of 53 studies found that each kilogram increase in birth weight was associated with a 1.36 mmHg reduction in SBP and a 0.33 mmHg reduction in DBP when compared to the previous kilogram. Reference Knop, Geng and Gorny17 However, the effect estimates were heterogeneous when results were stratified by continent (e.g., Europe: β = −1.26; Asia: β = −2.90; South America: β = −3.64), suggesting this relationship may be influenced by additional genetic, cultural, and/or environmental factors. Our large racially/ethnically diverse sample from the WHI cohort supports the overall findings from the meta-analysis; however, we lacked sufficient power to detect significant associations in most of the race and ethnicity categories.
With respect to the relationship between birth weight and hypertension, the 2018 meta-analysis revealed that a birth weight less than 2.5 kg (∼5.5 lbs.) is associated with a 30% increase in hypertension risk later in life when compared to individuals born weighing ≥2.5 kg. Reference Knop, Geng and Gorny17 Further, each kilogram increase in birth weight was associated with a 23% reduction in risk. Our results are consistent with this meta-analysis, but many of the studies did not account for gestational age, race, ethnicity, physical activity, and/or demographic and lifestyle covariates in their original models. Interestingly, results for hypertension risk per kilogram increase in birth weight stratified by continent demonstrated differences in effect estimates (Europe: HR = 0.77, 95% CI 0.61– 0.97; South America: HR 0.60, 95% CI 0.42–0.87), again suggesting possible population differences in the association. Evidence from the Nurse’s Health Study (NHS), the study population most similar to ours, supports a 39% increase in hypertension risk (95% CI 1.29–1.50) in women from NHS I who report a birth weight less than 5.0 lbs. and a 43% increase in risk (95% CI 1.31–1.56) in women from NHS II who report a birth weight less than 5.5 lbs. when compared to a normal birth weight category. Reference Curhan, Chertow and Willett35 The effect sizes from these studies are larger than, but still consistent with, our results, which may stem from the sample sizes differences as well as the use of different birth weight categories. Additionally, NHS was composed entirely of more knowledgeable health professionals than our population. Given that the low birth weight categories have a smaller weight range, we would expect these associations to be larger in NHS I and NHS II than in our WHI data. Differences in findings across studies may also be due to differing selection forces influencing the make-up of the study samples. The WHI enrolled post-menopausal women from 40 clinical sites across the U.S., and women in poorer health may have chosen not to participate or may be less likely to complete follow-up assessments. In contrast, the NHS enrolled female nurses with a wider range of ages.
The body of literature on the associations between gestational age and SBP and hypertension is much more limited. Evidence supports an increase in SBP in people born preterm, with effect sizes typically larger in women. Reference Hovi, Vohr and Ment36,Reference Kistner, Celsi and Vanpee37 In a meta-analysis of 10 studies, evidence suggests that preterm infants had a higher SBP than full-term infants (pooled estimate 2.55 mmHg), which is stronger than our estimate but consistent with the direction. Reference de Jong, Monuteaux and van Elburg38 This meta-analysis considered childhood, adolescent, and adult SBP, which limits its application to our study results. A second meta-analysis of 6 studies found that adults born preterm were at increased risk for incident hypertension (pooled risk ratio 1.23, 95% CI 1.14–1.32). Reference Yoshida-Montezuma, Stone and Iftikhar18 We, too, found that individuals in our study born preterm had an increased risk for prevalent and incident hypertension in unadjusted and adjusted models. However, these associations were attenuated when stratifying by birth weight category, suggesting that birth weight, not gestational age, is the true risk factor underlying the observed association. To further tease apart this relationship, participant birth-weight-for-gestational-age z-scores that allow for the consideration of both birth weight and gestational age would be necessary; unfortunately, these data are not available in the WHI dataset.
Strengths and limitations
Our study is strengthened by the use of a large, multi-ethnic, multi-racial cohort with a maximal sample size of over 80,000. Additionally, we were able to include several demographic and lifestyle covariates to adjust for confounding in our models such as age, ethnicity, and physical activity. As mentioned previously, the accuracy of self-reported hypertension has been validated in the Women’s Health Initiative and is considered to have a high degree of sensitivity and specificity at varying time-points. Reference LaMonte, Milton and Miller26 Furthermore, sensitivity analyses allowed us to evaluate preterm birth as an exposure stratified by birth weight due to their collinearity.
Having been born between 1910 and 1940, the women in WHI who were premature likely had mild prematurity (often referred to as late preterm) or were much healthier compared to many premature infants born today. Reference Ogunniyi, Commodore-Mensah and Ferdinand2 Accordingly, the results from this study may not reflect risk of premature infants born in the present as a large majority of preterm infants born today survive in part due to advancements in clinical technologies such as surfactant therapy and high-frequency ventilation, which were not widely available until the 1990s. Reference Philip39 Nonetheless, improved survival of premature infants may lead to an increase in adverse health events later in life. If true, the presence of this survival bias would suggest that the relationships observed in this study would be stronger among preterm infants who did not survive to be included in this study. Reference Singer, Thiede and Perez40
Our study was limited by a lack of information on postnatal growth and childhood BMI. These early-life exposures may influence cardiovascular homeostasis and lead to an increase in hypertension risk. Additionally, WHI did not ask participants to self-report unmedicated incident hypertension. Since a large proportion of people with hypertension under 65 are not on antihypertensives, these individuals with a milder diagnosis would be missed in our survival analyses as they would likely be controlling their BP with lifestyle modifications. The reliance on self-report also impacts our exposure measures, which were limited to birth weight categories. While recall of birth weight has been previously validated (r = 0.58–0.81), recall of prematurity has not. Reference Wodskou, Hundrup and Obel22,Reference Tehranifar, Liao and Flom41,Reference Wise, Wang and Wesselink42 In consideration of the age group and birth years of WHI participants, the validity of recalling these categories may be further limited by a lack of ultrasound technologies, which provide a much more accurate estimate of gestational age than fundal height and date of last menstrual period. Future research could examine blood pressure and hypertension risk in relation to more fine-grained measures of gestation age at birth (e.g., very preterm). Lastly, race- and ethnicity-stratified analyses were impacted by limited sample size.
Further directions
As growing evidence supports the associations between in utero exposures with risk for cardiovascular disease, physicians should begin to consider birth history in assessing their patients’ risks for developing adverse cardiovascular outcomes. To this end, medical and birth records should be preserved in the health system and passed on to later generations. Further, this research suggests a growing need for research into nutritional and early-life interventions to minimize the risk of later-life chronic disease in individuals born low birth weight or premature. Also needed is research to understand the role of social and environmental factors on the association between birth weight and preterm birth and later-life BP and hypertension risk.
As mentioned previously, the WHI cohort is representative of women born between 70–100 years ago. Research on a diverse cohort of low birth weight and premature participants born after the adoption of high-frequency ventilation and other therapies is critical in determining the extent to which these exposures influence lifelong cardiovascular outcomes, particularly since the risk of hypertension may be higher than observed.
Although our results suggest high birth weight is associated with lower SBP and lower risk for hypertension, high birth weight has been previously associated with an increased risk of comorbidities such as later-life physical disability that may weaken cardiovascular health. Additionally, the WHI does not differentiate between primary and secondary hypertension. Determining if birth weight and/or premature birth is associated with secondary hypertension may provide insights into whether these exposures have a compounding effect on lifelong chronic disease risk.
Supplementary material
The supplementary material for this article can be found at https://doi.org/10.1017/S2040174426100579.
Acknowledgments
We thank the WHI investigators and staff for their dedication and the study participants for making the program possible.
Financial support
The Women’s Health Initiative program is funded by the National Heart, Lung, and Blood Institute, National Institutes of Health, U.S. Department of Health and Human Services through contracts HHSN268201100046C, HHSN26801100001C, HHSN268201100002C, HHSN268201100003C, HHSN268201100004C, and HHSN271201100004C.
Competing interests
None.


 Open access

