


How much do judges matter for the resolution of legal cases? This question haunts the American legal profession. During the confirmation hearings for Chief Justice John Roberts, he argued that “judges wear black robes, because it doesn’t matter who they are as individuals. That’s not going to shape their decision” (Roberts Reference Roberts2005, p. 178). But other judges have vociferously rejected this notion, offering a range of rationales for why it is unreasonable to presume (or even aspire to the notion that) judges do not matter for case outcomes. Perhaps most famously, then-Judge Sonia Sotomayor said in a 2001 speech that “I would hope that a wise Latina woman, with the richness of her experiences, would more often than not reach a better conclusion than a white male who hasn’t lived that life” (Sotomayor Reference Sotomayor2002, p. 92).
Among those who study the legal system, there is widespread agreement that judges do matter for the resolution of cases. But just how much they matter is a source of debate. In this paper, we have a simple goal: to offer a novel way to quantitatively measure the extent to which judges matter for case outcomes.
We build on an unusually rich set of prior research findings. An enormous empirical literature examines the myriad ways that cases could get resolved differently depending solely on the circumstances under which they are heard. Perhaps most importantly, judicial politics scholars have studied how case outcomes depend on judges’ traits – their ideologies, races, genders, etc.Footnote 1 For example, many studies have documented that federal appeals are resolved differently when assigned to majority Republican panels instead of majority Democratic panels (e.g., Revesz Reference Revesz1997; Sunstein et al. Reference Sunstein, Schkade, Ellman and Sawicki2006; Epstein, Landes, and Posner Reference Epstein, Landes and Posner2013). Others have documented that federal appeals are resolved differently when assigned to panels containing women or Black judges instead of all-male or all non-Black panels (e.g., Farhang and Wawro Reference Farhang and Wawro2004; Boyd, Epstein, and Martin Reference Boyd, Epstein and Martin2010; Kastellec Reference Kastellec2013).
These studies provide important data points for evaluating the extent to which judges matter. Their focus is on characterizing the extent to which judges that share certain traits systematically disagree with other judges. Systematic disagreement among judges is also our focus,Footnote 2 but our starting point is that empirical estimates like these almost always obscure some amount of the overall disagreement among judges or panels of judges. They are therefore best understood to be downward biased estimates of the overall disagreement between judges. To be clear, this is not intentional, as these estimates typically are not meant to quantify overall disagreement among judges. But, if one were to try to learn about overall disagreement by looking at these findings, they will generally understate the overall extent to which judges matter for case outcomes.
The core methodological issue is well known: estimates of average treatment effects (ATEs) can mask underlying heterogeneity. In particular, there are two distinct ways that the “standard” judicial politics ATEs mask heterogeneity. First, by lumping together a collection of judges by a shared trait (e.g., political ideology, race or gender), estimates will not pick up on important differences among judges who share that trait (see also Giles, Hettinger, and Peppers Reference Giles, Hettinger and Peppers2001). Second, even when a group of judges who share a trait behave similarly to one another, it is possible that, as a group, they respond differently to different kinds of cases. For example, Democratic appointees may be more likely than Republican appointees to reverse a lower court decision favoring the defendant but less likely to reverse a lower court decision favoring the plaintiff. Effects going in different directions cancel out when averaging, making it seem like there are smaller differences among judges than there truly are.
In this paper, we offer a new way to quantitatively characterize the extent of disagreement between judges that reveals substantially more disagreement than these traditional ATEs in the court’s literature. Our core innovation is to recast the methodological problem above as one of developing a new treatment variable that, by construction, minimizes heterogeneity in unit-level effect directions. Then, an average treatment effect estimated using this new treatment variable will (at least in principle) reveal the full extent of disagreement between judges.
We begin with a simple theoretical model that allows us to derive a monotonicity-robust treatment (or MRT) that we formally demonstrate yields an unbiased estimate of disagreement. While this treatment variable is primarily a statistical creation that allows us to more accurately estimate disagreement, it also has a substantive interpretation. For example, if the outcome of interest in a particular setting is whether a case is reversed (as in our empirical application), then a binary version of the MRT indicates whether cases are assigned to the panel more likely to reverse it or to the panel less likely to reverse it. Importantly, this is a unit-by-unit determination. For example, Panel A may be more likely to reverse than Panel B on Case 1, but less likely to reverse on Case 2. In this scenario, Case 1 would be in the MRT “treatment group” if it were assigned to Panel A, while Case 2 would be in the MRT “treatment group” if it were assigned to Panel B.
The core practical challenge is measuring MRTs accurately using real-world data. Any measurement error in an MRT will cause resulting estimates of disagreement to be downward biased since measurement error means the “hidden” heterogeneity in the dataset has not been fully eradicated. Since all real-world measures are measured with some error, any estimate of disagreement using our technique will be somewhat downward biased. To mitigate this problem, we develop a machine learning method for measuring MRTs, which is designed to aggressively minimize measurement error and can be applied in a wide variety of contexts. We demonstrate that this method for measuring MRTs is robust and generates quantitative estimates that reveal substantially more disagreement among judges than traditional ATEs.
We apply our method to an original dataset of civil appeals heard by the Ninth Circuit from 1995 to 2013. We begin by measuring an MRT for the cases in our dataset, which in our specific application, we term the “panel reversal quantile” (or PRQ). We show that the PRQ we measure preserves random assignment and has strong face and construct validity. Since PRQs are meant to measure a latent trait – that is, the reversal proclivity of a panel – an assessment of the construct validity of our PRQs requires us to demonstrate that our measure does indeed correlate with whether cases are reversed. As we discuss in more detail below, since our PRQs are measured entirely out of sample using a cross-validation approach, it is not a foregone conclusion that they will be correlated with whether cases are reversed. Our measurement strategy might not work, meaning that PRQs could have low construct validity. We show that in our dataset, PRQs are strongly correlated with whether a panel reverses or affirms, and even more strongly correlated with case outcomes than political ideology.
Using our newly measured PRQs, we then quantitatively characterize disagreement among the panels of judges in the Ninth Circuit by calculating the frequency with which reversals of lower court decisions would have been affirmances had they been assigned to different panels of judges (and vice versa). Since we are seeking to calculate a summary measure of disagreement between panels in a court that has many unique panels that hear cases,Footnote 3 it is not immediately obvious how to aggregate disagreement between each pair of panels to an overall court-level estimate. We calculate three different summary measures of disagreement in the Ninth Circuit, which we argue are highly informative about how much judges matter for outcomes in the court.
First, we divide up our dataset into PRQ quintiles so that cases are assigned to one of five treatment arms indicating differing levels of panel reversal proclivity. We show that, as compared to the lowest (least reversal prone) quintile, cases assigned to panels in the third, fourth, and fifth quintiles are significantly more likely to be reversed. For example, cases in the fifth PRQ quintile are at leastFootnote 4 16% more likely to be reversed than cases in the first quintile. Second, we ask, What share of cases could have come out differently solely based on panel assignment? In other words, if we switched the case loads of the most reversal-prone and the least reversal-prone panels, how many cases would have come out differently? We estimate that at least 38% of cases could have come out differently. Third, we ask, If all cases had been randomly reassigned, how many of them would come out differently? We estimate that at least 6.5% of cases would have come out differently if all the cases in our dataset had been randomly reassigned. Importantly, these estimates capture disagreement among judges and not other “nonjudicial” factors. They therefore give us two quantitative measures of the extent to which judges matter for case outcomes in our dataset of Ninth Circuit cases.
In this paper, we take as given that it is important to quantify disagreement between judges because it allows us to empirically understand how much judges matter for case outcomes. Indeed, quantitative estimates like these speak to weighty normative issues relating to nature of justice in the United States, as well as policy debates over the functioning of the courts, such as whether the Ninth Circuit is too big (e.g., Kozinksi et al. Reference Kozinski, Schroeder, Browning and Goodwin2006). However, many court scholars and observers want to know more than just the extent to which judges disagree in cases. They often seek to understand why judges disagree. We too find it interesting and important to understand the reasons that judges make systematically different decisions. We readily acknowledge that standard judicial politics ATEs have been carefully chosen to shed light on substantively important sources of disagreement, such as political ideology and personal background, even if they do not show the full extent of inter-judge disagreement. This is not our goal here. We are focused on quantifying the extent of disagreement, regardless of its sources.
We contribute most directly to a small number of recent studies attempting to quantify disagreement among decision-makers (e.g., Fischman Reference Fischman2014; Kahneman et al. Reference Kahneman, Rosenfield, Gandhi and Blaser2016; Kahneman, Sibony, and Sunstein Reference Kahneman, Sibony and Sunstein2022). A core challenge that arises in this prior work is that disagreement is difficult to estimate. Fischman (Reference Fischman2014) is the first to elucidate the averaging problem we describe. Much of our theoretical discussion is similar in spirit (although with some differences), but our core focus is different. While Fischman is primarily concerned with mathematically characterizing upper and lower bounds, we are focused on using novel computational techniques to try to aggressively push up the lower bound to reveal more inter-judge disagreement. Moreover, Fischman’s approach to measuring the lower bound on inconsistency introduces finite sample bias, which requires a subsampling correction. Because our measurement technique does not involve taking absolute values, our method avoids introducing finite sample bias in the first place. Kahneman, Sibony, and Sunstein (Reference Kahneman, Sibony and Sunstein2022) urges researchers to run experiments. For example, one could create simulated case materials and ask a set of decision-makers to evaluate each one and come to a (hypothetical) decision. While this may have high internal validity (and help get around the averaging problem), it has low external validity to real-world data. Our major contribution is to provide a method for mitigating the averaging problem so that researchers can better estimate disagreement between judges sitting in real-world courts.
Until now, judicial politics researchers have formed their impressions about how much judges matter for case outcomes based on disparate empirical estimates that understate the extent of disagreement among judges. By revealing more of the disagreement among judges, we think our method has the potential to allow scholars to peer into the black box of judicial decision-making and see what else is there. While in this paper we are primarily focused on explicating the method (and applying it to a dataset of Ninth Circuit cases), in the conclusion, we briefly touch on some potentially promising applications.
Quantifying how much judges “matter”
We use a simple formal model of appeals to precisely characterize what we mean when we talk about whether judges “matter” in our empirical context (the Ninth Circuit). We will not explore intra-panel dynamics in this article, so we treat panels as unitary actors. We will therefore interchangeably refer to “judges mattering” and “panels mattering.” Exploring intra-panel dynamics in our empirical setting is an interesting avenue for future research, but there are additional methodological challenges that would make it more difficult.Footnote 5 Our analysis would easily extend to contexts where judges hear cases on their own, such as U.S. District Courts. In the main text below, we provide an abbreviated discussion of the model so that we can get quickly to the main points. In Online Appendix A, we analyze the model in detail.
In the model, cases are defined by sets of “case features” (labeled $ \mathbf{f} $
) as well as idiosyncratic “fact patterns” (labeled
$ \mathbf{f} $
) as well as idiosyncratic “fact patterns” (labeled $ x\in \mathrm{\mathbb{R}} $
). At an intuitive level, case features define clusters of similar cases (e.g., civil rights cases about racial discrimination brought by the EEOC), whereas case patterns represent the specific facts of a case that signal the strength of each litigant’s arguments. More formally, case features define a specific case space (see Lax Reference Lax2011) over which there is a distribution of fact patterns. That is,
$ x\in \mathrm{\mathbb{R}} $
). At an intuitive level, case features define clusters of similar cases (e.g., civil rights cases about racial discrimination brought by the EEOC), whereas case patterns represent the specific facts of a case that signal the strength of each litigant’s arguments. More formally, case features define a specific case space (see Lax Reference Lax2011) over which there is a distribution of fact patterns. That is, $ x $
is distributed according to some conditional distribution with probability density function
$ x $
is distributed according to some conditional distribution with probability density function $ f\left(x|\mathbf{f}\right) $
.
$ f\left(x|\mathbf{f}\right) $
.
Each case $ i $
is assigned to a panel
$ i $
is assigned to a panel $ p $
, which issues a decision
$ p $
, which issues a decision $ {y}_i\left(p,{x}_i,{\mathbf{f}}_i\right) $
upon seeing
$ {y}_i\left(p,{x}_i,{\mathbf{f}}_i\right) $
upon seeing $ {x}_i $
and
$ {x}_i $
and $ {\mathbf{f}}_i $
. For ease of exposition, we will just assume
$ {\mathbf{f}}_i $
. For ease of exposition, we will just assume $ y=1 $
indicates a decision to reverse a lower court decision, and
$ y=1 $
indicates a decision to reverse a lower court decision, and $ y=0 $
indicates a decision to affirm a lower court decision. Each panel
$ y=0 $
indicates a decision to affirm a lower court decision. Each panel $ p $
has an ideal point for each case space. Formally, we denote this ideal point as
$ p $
has an ideal point for each case space. Formally, we denote this ideal point as $ {\hat{x}}_p\left(\mathbf{f}\right) $
and assume that on a specific case
$ {\hat{x}}_p\left(\mathbf{f}\right) $
and assume that on a specific case $ i $
drawn from the case space defined by
$ i $
drawn from the case space defined by $ \mathbf{f} $
, a panel
$ \mathbf{f} $
, a panel $ p $
strictly prefers
$ p $
strictly prefers $ {y}_i=1 $
if
$ {y}_i=1 $
if $ {x}_i\le {\hat{x}}_p\left({\mathbf{f}}_i\right) $
and strictly prefers
$ {x}_i\le {\hat{x}}_p\left({\mathbf{f}}_i\right) $
and strictly prefers $ {y}_i=0 $
otherwise. Since each panel has its own ideal point for each case space
$ {y}_i=0 $
otherwise. Since each panel has its own ideal point for each case space $ \mathbf{f} $
, then two panels with ideal points
$ \mathbf{f} $
, then two panels with ideal points $ {\hat{x}}_1\left({\mathbf{f}}_i\right)<{\hat{x}}_2\left({\mathbf{f}}_i\right) $
will disagree about how to resolve a case
$ {\hat{x}}_1\left({\mathbf{f}}_i\right)<{\hat{x}}_2\left({\mathbf{f}}_i\right) $
will disagree about how to resolve a case $ i $
whenever
$ i $
whenever $ {\hat{x}}_1\left(\mathbf{f}\right)<{x}_i\le {\hat{x}}_2\left(\mathbf{f}\right) $
. In this situation, we say that judges “matter” for the case’s outcome (see Definition 6 in Online Appendix A).
$ {\hat{x}}_1\left(\mathbf{f}\right)<{x}_i\le {\hat{x}}_2\left(\mathbf{f}\right) $
. In this situation, we say that judges “matter” for the case’s outcome (see Definition 6 in Online Appendix A).
Empirical implications
Consider a population of cases that are resolved according to the model of judicial decision-making summarized above. From an ex ante perspective, and given the uncertainty in the model, we can think of case outcomes as a random variable, $ {Y}_i(p) $
, which depends on the assigned panel. In the model,
$ {Y}_i(p) $
, which depends on the assigned panel. In the model, $ {Y}_i(p) $
is well defined for all
$ {Y}_i(p) $
is well defined for all $ p\in \mathcal{P} $
, and it is on the equilibrium path if
$ p\in \mathcal{P} $
, and it is on the equilibrium path if $ p $
is actually assigned to case
$ p $
is actually assigned to case $ i $
, and off the equilibrium path otherwise. Using the terminology from the standard potential outcomes framework (see part 1 of Imbens and Rubin Reference Imbens and Rubin2015), for every
$ i $
, and off the equilibrium path otherwise. Using the terminology from the standard potential outcomes framework (see part 1 of Imbens and Rubin Reference Imbens and Rubin2015), for every $ p\in \mathcal{P} $
,
$ p\in \mathcal{P} $
, $ {Y}_i(p) $
is a potential outcome of case
$ {Y}_i(p) $
is a potential outcome of case $ i $
. In all of our analysis below, we will make a stable unit treatment value assumption (SUTVA). This means that we will assume that each case
$ i $
. In all of our analysis below, we will make a stable unit treatment value assumption (SUTVA). This means that we will assume that each case $ i $
has a set of exactly
$ i $
has a set of exactly $ \mid \mathcal{P}\mid $
potential outcomes, one for each panel, which are “stable” in that they do not depend on how other cases were assigned to panels. We return to this below.
$ \mid \mathcal{P}\mid $
potential outcomes, one for each panel, which are “stable” in that they do not depend on how other cases were assigned to panels. We return to this below.
In the population of cases under consideration, how much do judges matter? Since we say that judges matter for outcomes when panels disagree about how a case should be resolved, we need to quantify how many cases feature inter-panel disagreement in order to quantify how much judges matter. It is not obvious how to quantify disagreement among a large set of potential decision-makers. We will work with a foundational definition of disagreement that is dyadic.
Definition 1. For a population of cases, the disagreement between panels $ {p}_1 $
and
$ {p}_1 $
and $ {p}_2 $
can be quantified by
$ {p}_2 $
can be quantified by
 $$ \delta \left({p}_1,{p}_2\right)\equiv {\unicode{x1D53C}}_i\left[|{Y}_i\left({p}_1\right)-{Y}_i\left({p}_2\right)|\right]. $$
At a theoretical level, this is how we formally quantify how much judges matter. We acknowledge there may be other conceptualizations of judicial disagreement, or for what it means for judges to “matter,” but we think ours is reasonable. It amounts to the simple idea that if a case would come out differently if assigned to another panel, then judges mattered for the outcome. To use this definition in the context of a court with more than two decision-makers, one has to decide which dyads of decision-makers to examine when quantifying how much judges matter. We will return to this issue farther below, but we will first develop all of our core ideas imagining a setting with just two panels that could hear cases.
Disagreement, as defined above, is a purely theoretical quantity since it is impossible to estimate due to the fundamental problem of causal inference (Holland Reference Holland1986). However, there is another quantity that can, in principle, be estimated and which under certain conditions is equivalent to $ \delta \left({p}_1,{p}_2\right) $
.
$ \delta \left({p}_1,{p}_2\right) $
.
Definition 2. For a population of cases, the disparity between panels $ {p}_1 $
and
$ {p}_1 $
and $ {p}_2 $
is given by
$ {p}_2 $
is given by
 $$ \phi \left({p}_1,{p}_2\right)\equiv \left|\unicode{x1D53C}\left[{Y}_i\left({p}_1\right)-{Y}_i\left({p}_2\right)\right]\right|. $$
Below, we show that the disparity between two panels can be estimated, but before we do, we must show that the disagreement between any two panels is equivalent to the disparity between those two panels. This is only true if the ideal points of the panels retain the same ordering across all cases in the population. We formally define this condition as follows.
Definition 3. For a case $ i $
, let
$ i $
, let $ {\mathbf{p}}_i $
be a profile of sets of panels ordered in increasing order of ideal points and where each set contains all panels sharing an ideal point.Footnote 6 A population of cases
$ {\mathbf{p}}_i $
be a profile of sets of panels ordered in increasing order of ideal points and where each set contains all panels sharing an ideal point.Footnote 6 A population of cases $ \mathcal{M} $
satisfies monotonicity if and only if
$ \mathcal{M} $
satisfies monotonicity if and only if $ {\mathbf{p}}_i={\mathbf{p}}_j $
for all
$ {\mathbf{p}}_i={\mathbf{p}}_j $
for all $ i,j\in \mathcal{M} $
.
$ i,j\in \mathcal{M} $
.
Our first formal result demonstrates that disagreement and disparities are equivalent in populations of cases where monotonicity holds. All proofs of formal results included in the main text are in Online Appendix B.
Lemma 1. For a population of cases $ \mathcal{M} $
such that monotonicity is satisfied, then
$ \mathcal{M} $
such that monotonicity is satisfied, then $ \delta \left({p}_1,{p}_2\right)=\phi \left({p}_1,{p}_2\right) $
.
$ \delta \left({p}_1,{p}_2\right)=\phi \left({p}_1,{p}_2\right) $
.
We have claimed that the disparity is estimable, but the definition above is still expressed in terms of counterfactual quantities. It can be estimated with observable quantities as long as the potential outcomes are independent of panel assignment. This is a well-known idea from the Neyman-Rubin potential outcomes framework for causal inference. In our substantive context, it would be reasonable to assume independence of the potential outcomes if cases are randomly assigned to panels.
Definition 4. For a population of cases $ \mathcal{R} $
, let
$ \mathcal{R} $
, let $ {A}_i $
indicate the panel assigned to case
$ {A}_i $
indicate the panel assigned to case $ i\in \mathcal{R} $
. Then,
$ i\in \mathcal{R} $
. Then, $ \mathcal{R} $
satisfies random assignment if and only if
$ \mathcal{R} $
satisfies random assignment if and only if $ {Y}_i(p)\perp {A}_i $
for all
$ {Y}_i(p)\perp {A}_i $
for all $ p $
.
$ p $
.
In most applied empirical settings (including ours), cases can only be considered randomly assigned conditional on some known confounders. For example, cases may be randomly assigned within a courthouse and within a period of time. For exposition, our following results presume unconditional random assignment. However, they can be easily modified to accommodate random assignment conditional on known confounders (e.g., see p. 54 of Angrist and Pischke Reference Angrist and Pischke2009). The next result formally shows that the disparity above can be estimated if random assignment holds.
Lemma 2. For a population of cases $ \mathcal{R} $
that satisfies random assignment,
$ \mathcal{R} $
that satisfies random assignment,
 $$ \phi \left({p}_1,{p}_2\right)=\left|\unicode{x1D53C}\left[{Y}_i\left({p}_1\right)-{Y}_i\left({p}_2\right)\right]\right|=\left|{\unicode{x1D53C}}_i\left[{Y}_i|{p}_1\right]-{\unicode{x1D53C}}_i\left[{Y}_i|{p}_2\right]\right|\equiv D\left({p}_1,{p}_2\right). $$
It is well known that if treatment is randomly assigned, then an unbiased and consistent estimator for the difference in means is the difference in sample means (see, for example, Theorem 16.3 in Wasserman Reference Wasserman2004), which we label $ \hat{D}\left({p}_1,{p}_2\right) $
. We now have our first major result.
$ \hat{D}\left({p}_1,{p}_2\right) $
. We now have our first major result.
Proposition 1. In a sample of cases, the sample disparity between panels $ {p}_1 $
and
$ {p}_1 $
and $ {p}_2 $
,
$ {p}_2 $
, $ \hat{D}\left({p}_1,{p}_2\right) $
, is an unbiased and consistent estimator for disagreement if
$ \hat{D}\left({p}_1,{p}_2\right) $
, is an unbiased and consistent estimator for disagreement if
-
(i) the population of cases satisfies random assignment; and
-
(ii) the population of cases satisfies monotonicity.
What if these conditions are not satisfied?
Unless both conditions in Proposition 1 are satisfied, the sample disparity will not be an unbiased and consistent estimator for disagreement. We now characterize what happens when each of the conditions is not satisfied. The most straightforward of these is the first, random assignment, as it is already well known that a difference in means estimator may be biased in the absence of independence of potential outcomes and treatment assignment. Because failure to satisfy random assignment prevents us from making a clear statement about the link between the estimator and the estimand, we use the common practice of referring to it as an “identification” problem.
Proposition 2. (The Identification Problem). For a population of cases, if random assignment is not satisfied, then it is possible that $ \phi \left({p}_1,{p}_2\right)\ne D\left({p}_1,{p}_2\right) $
.
$ \phi \left({p}_1,{p}_2\right)\ne D\left({p}_1,{p}_2\right) $
.
However, if monotonicity is not satisfied, then the disparity between panels $ {p}_1 $
and
$ {p}_1 $
and $ {p}_2 $
will always understate true disagreement, as the following proposition shows.
$ {p}_2 $
will always understate true disagreement, as the following proposition shows.
Proposition 3. (The Averaging Problem). For a population of cases, if monotonicity is not satisfied, then $ \delta \left({p}_1,{p}_2\right)>\phi \left({p}_1,{p}_2\right) $
.
$ \delta \left({p}_1,{p}_2\right)>\phi \left({p}_1,{p}_2\right) $
.
The conceptual point underlying this proposition is not original to us and has been discussed elsewhere, most most prominently in Fischman (Reference Fischman2014). But, the basic idea is intuitive. Since unit-level treatment effects can be positive or negative, if one averages them before taking the absolute value, this will push the magnitude of the resulting estimate toward zero. We term this the “averaging problem.”
To see this more concretely, consider two hypothetical panels depicted in Figure 1 who are randomly assigned to hear five cases each. A black circle indicates a panel would reverse the lower court decision, and a white circle indicates a panel would affirm. In the observed dataset depicted on the left, Panel 1 reverses in 60% of cases while Panel 2 reverses in 80% of cases. Then we would calculate a sample disparity of 20%.
A hypothetical example of a court that hears ten cases, randomly split among two panels. The left panel shows an observed dataset, and the right panel shows all potential outcomes for all ten cases. A black circle indicates a reversal of the lower court decision, and a white circle indicates an affirmance of the lower court decision.

A disparity is informative about disagreement: a high disparity between two panels indicates that disagreement between them is also high. However, the converse is not true, since a low disparity (i.e., close to zero) does not indicate a lack of disagreement. For example, consider again Figure 1. On the right, we depict all the potential outcomes for each panel, which demonstrates that these two panels would come to a different decision in every single case, yielding a 100% disagreement. This is substantially more disagreement than the sample disparity revealed.
The underlying problem is that Panel 1 is more inclined than Panel 2 to reverse some cases, while the converse is true for other cases. For example, Panel 1 is more inclined to reverse Case 2, but Panel 2 is more inclined to reverse Case 3. This suggests that that the ordering of the two panels’ ideal points may differ between Case 2 and Case 3.Footnote 7 In other words, in this set of cases, monotonicity is not satisfied since the ordering of the panels’ ideal points is not the same across all cases. The averaging problem is downstream of a violation of monotonicity.
Solving the averaging problem by measuring a new treatment variable
We propose a solution to the averaging problem that entails measuring a new treatment variable that we call the monotonicity-robust treatment (or MRT). At a theoretical level, the basic idea is that a straightforward transformation of the original treatment variable (i.e., panel assignment) can retain the informational content of that variable while ensuring that observed treatment effects all have the same sign. Specifically, under our MRT, a case is “treated” for a case $ i $
if it was assigned to the panel with the higher ideal point for that case (and thus the panel more likely to reverse). Formally,
$ i $
if it was assigned to the panel with the higher ideal point for that case (and thus the panel more likely to reverse). Formally,
Definition 5. Let $ {a}_i $
indicate the panel assigned to case
$ {a}_i $
indicate the panel assigned to case $ i $
. Then, the monotonicity-robust treatment (MRT) is defined by
$ i $
. Then, the monotonicity-robust treatment (MRT) is defined by
 $$ {m}_i\left({p}_1,{p}_2\right)=\left\{\begin{array}{ll}1& \mathrm{if}\;{a}_i\in \underset{p\in \left\{{p}_1,{p}_2\right\}}{\arg \hskip0.1em \max}\left\{{\hat{x}}_p\right\}\\ {}0& \mathrm{if}\;{a}_i\in \underset{p\in \left\{{p}_1,{p}_2\right\}}{\arg \hskip0.1em \min}\left\{{\hat{x}}_p\right\}\\ {}\varnothing & \mathrm{otherwise}.\end{array}\right. $$
This definition of the MRT relies on unobservable quantities (the panels’ ideal points), but there is an observable quantity that allows us to infer the orderings. In Lemma 4 in Online Appendix B, we show that $ \unicode{x1D53C}\left[{Y}_i|{p}_1,\mathbf{f}\right]<\unicode{x1D53C}\left[{Y}_i|{p}_2,\mathbf{f}\right] $
if and only if
$ \unicode{x1D53C}\left[{Y}_i|{p}_1,\mathbf{f}\right]<\unicode{x1D53C}\left[{Y}_i|{p}_2,\mathbf{f}\right] $
if and only if $ {\hat{x}}_1\left(\mathbf{f}\right)<{\hat{x}}_2\left(\mathbf{f}\right) $
. We can rewrite the definition of
$ {\hat{x}}_1\left(\mathbf{f}\right)<{\hat{x}}_2\left(\mathbf{f}\right) $
. We can rewrite the definition of $ {m}_i\left({p}_1,{p}_2\right) $
as follows:Footnote 8
$ {m}_i\left({p}_1,{p}_2\right) $
as follows:Footnote 8
 $$ {m}_i\left({p}_1,{p}_2\right)=\left\{\begin{array}{ll}1& \mathrm{if}\;{a}_i\in \underset{p\in \left\{{p}_1,{p}_2\right\}}{\arg \hskip0.1em \max}\left\{\unicode{x1D53C}\left[{Y}_i|p,\mathbf{f}\right]\right\}\\ {}0& \mathrm{if}\;{a}_i\in \underset{p\in \left\{{p}_1,{p}_2\right\}}{\arg \hskip0.1em \min}\left\{\unicode{x1D53C}\left[{Y}_i|p,\mathbf{f}\right]\right\}\\ {}\varnothing & \mathrm{otherwise}.\end{array}\right. $$
Finally, we can define an average treatment effect using this MRT, which we refer to as the monotonicity-robust observable disparity (MROD), which we now show is, by construction, equivalent to disagreement whenever cases are randomly assigned.
Proposition 4. Define the monotonicity-robust observable disparity (MROD) as $ M\left({p}_1,{p}_2\right)\equiv \unicode{x1D53C}\left[{Y}_i|{m}_i\left({p}_1,{p}_2\right)=1\right]-\unicode{x1D53C}\left[{Y}_i|{m}_i\left({p}_1,{p}_2\right)=0\right] $
. Then, for a population of cases satisfying random assignment,
$ M\left({p}_1,{p}_2\right)\equiv \unicode{x1D53C}\left[{Y}_i|{m}_i\left({p}_1,{p}_2\right)=1\right]-\unicode{x1D53C}\left[{Y}_i|{m}_i\left({p}_1,{p}_2\right)=0\right] $
. Then, for a population of cases satisfying random assignment, $ M\left({p}_1,{p}_2\right)=\delta \left({p}_1,{p}_2\right) $
.
$ M\left({p}_1,{p}_2\right)=\delta \left({p}_1,{p}_2\right) $
.
We denote estimates of the MROD in a sample as $ \hat{M}\left({p}_1,{p}_2\right) $
. However, to estimate an MROD, we need to know
$ \hat{M}\left({p}_1,{p}_2\right) $
. However, to estimate an MROD, we need to know $ {m}_i $
for each case, which itself must be estimated. In principle, for two panels
$ {m}_i $
for each case, which itself must be estimated. In principle, for two panels $ {p}_1 $
and
$ {p}_1 $
and $ {p}_2 $
, we can estimate
$ {p}_2 $
, we can estimate $ {m}_i\left({p}_1,{p}_2\right) $
for each case heard by these panels by estimating
$ {m}_i\left({p}_1,{p}_2\right) $
for each case heard by these panels by estimating $ \unicode{x1D53C}\left[{Y}_i|p,\mathbf{f}\right] $
and plugging into (1) to yield
$ \unicode{x1D53C}\left[{Y}_i|p,\mathbf{f}\right] $
and plugging into (1) to yield $ {\hat{m}}_i\left({p}_1,{p}_2\right) $
.
$ {\hat{m}}_i\left({p}_1,{p}_2\right) $
.
Unfortunately, estimates of $ \unicode{x1D53C}\left[{Y}_i|p,\mathbf{f}\right] $
from finite samples will be inaccurate. This will generate measurement error where some cases will be incorrectly classified as
$ \unicode{x1D53C}\left[{Y}_i|p,\mathbf{f}\right] $
from finite samples will be inaccurate. This will generate measurement error where some cases will be incorrectly classified as $ {\hat{m}}_i\left({p}_1,{p}_2\right)=1 $
when in reality,
$ {\hat{m}}_i\left({p}_1,{p}_2\right)=1 $
when in reality, $ {m}_i\left({p}_1,{p}_2\right)=0 $
, and vice versa. The measurement error reintroduces a (milder form) of the averaging problem,Footnote 9 which we formally show next.
$ {m}_i\left({p}_1,{p}_2\right)=0 $
, and vice versa. The measurement error reintroduces a (milder form) of the averaging problem,Footnote 9 which we formally show next.
Proposition 5. (The Floor Problem). If there is measurement error in $ {\hat{m}}_i\left({p}_1,{p}_2\right) $
, then
$ {\hat{m}}_i\left({p}_1,{p}_2\right) $
, then $ \hat{M}\left({p}_1,{p}_2\right)<M\left({p}_1,{p}_2\right) $
.
$ \hat{M}\left({p}_1,{p}_2\right)<M\left({p}_1,{p}_2\right) $
.
We call this the floor problem because any MROD estimated with noisy measures of the MRT will only give a lower bound – or “floor” – on the true estimate of disagreement. Since a researcher is always working with a finite dataset, there is nothing that can be done about the fact that there will be some error in the estimates of $ {\hat{m}}_i $
; the floor problem always exists to some extent. However, the silver lining of the previous result is that we know the direction of the bias in our estimates: our estimates will always understate the true level of disagreement between panels. Plus, as the proof of the result implies, the bias due to the floor problem will decline as estimates of
$ {\hat{m}}_i $
; the floor problem always exists to some extent. However, the silver lining of the previous result is that we know the direction of the bias in our estimates: our estimates will always understate the true level of disagreement between panels. Plus, as the proof of the result implies, the bias due to the floor problem will decline as estimates of $ {m}_i\left({p}_1,{p}_2\right) $
become more accurate.
$ {m}_i\left({p}_1,{p}_2\right) $
become more accurate.
Accommodating more than two panels
Most courts have more than two panels. We can apply all the ideas above to a large court in a flexible manner. Recall that what matters for defining a MRT such as $ {m}_i\left({p}_1,{p}_2\right) $
is the ordering of the two panels’ ideal points, not their cardinality. So, for each case, if we order all panels by their ideal points and determine which quantile the assigned case was in, then we can generate a “composite” measure of the MRT.
$ {m}_i\left({p}_1,{p}_2\right) $
is the ordering of the two panels’ ideal points, not their cardinality. So, for each case, if we order all panels by their ideal points and determine which quantile the assigned case was in, then we can generate a “composite” measure of the MRT.
Consider the scenario in Figure 2, which depicts the case space for cases that share case features $ \mathbf{f} $
. There are 10 possible panels who could have been assigned to cases, but only one is actually assigned for each case. Two hypothetical cases are depicted. With respect to the panels’ ideal points, the first case was assigned to a panel in the 30th quantile (30% of panels have lower ideal points), and the second case was assigned to a panel in the 80th quantile (80% of panels have lower ideal points).
$ \mathbf{f} $
. There are 10 possible panels who could have been assigned to cases, but only one is actually assigned for each case. Two hypothetical cases are depicted. With respect to the panels’ ideal points, the first case was assigned to a panel in the 30th quantile (30% of panels have lower ideal points), and the second case was assigned to a panel in the 80th quantile (80% of panels have lower ideal points).
A hypothetical case space with case features $ \mathbf{f} $
and ten panels with differing ideal points. Two cases – Case 1 and Case 2 – are assigned to different panels, which are marked in the figure. Case 1 was assigned to a panel at the 30th quantile, and Case 2 was assigned to a panel at the 80th quantile.
$ \mathbf{f} $
and ten panels with differing ideal points. Two cases – Case 1 and Case 2 – are assigned to different panels, which are marked in the figure. Case 1 was assigned to a panel at the 30th quantile, and Case 2 was assigned to a panel at the 80th quantile.

If cases are randomly assigned, this means that Case 1 was was randomly assigned to a “30th quantile panel,” whereas Case 2 was randomly assigned to a “80th quantile panel.” Formally, let $ {a}_i $
be the panel assigned to case
$ {a}_i $
be the panel assigned to case $ i $
. Then we can define the quantile to which case
$ i $
. Then we can define the quantile to which case $ i $
was assigned as
$ i $
was assigned as
 $$ {q}_i=\frac{\mid \left\{p\in \mathcal{P}:{\hat{x}}_p<{\hat{x}}_{a_i}\right\}\mid }{\mid \mathcal{P}\mid }=\frac{\mid \left\{p\in \mathcal{P}:\unicode{x1D53C}\left[{Y}_i|p,\mathbf{f}\right]<\unicode{x1D53C}\left[{Y}_i|{a}_i,\mathbf{f}\right]\right\}\mid }{\mid \mathcal{P}\mid}\in \left[0,1\right] $$
(The latter equality is guaranteed by Lemma 4 from Online Appendix B.) We call $ {q}_i $
a case
$ {q}_i $
a case $ i $
’s “panel reversal quantile” (which we abbreviate as PRQ) because they capture panels’ proclivities to reverse. From an ex ante perspective, panels in low PRQs are less likely to reverse a randomly drawn case than panels in higher PRQs.
$ i $
’s “panel reversal quantile” (which we abbreviate as PRQ) because they capture panels’ proclivities to reverse. From an ex ante perspective, panels in low PRQs are less likely to reverse a randomly drawn case than panels in higher PRQs.
The PRQ is a continuous generalization of the binary MRT that we had defined above for a specific pair of panels. Then, we can analogously define an MROD for a pair of two specific PRQs such as $ {Q}_1 $
and
$ {Q}_1 $
and $ {Q}_2 $
:
$ {Q}_2 $
:
 $$ M\left({Q}_1,{Q}_2\right)=\left|\unicode{x1D53C}\left[{Y}_i|{q}_i={Q}_1\right]-\unicode{x1D53C}\left[{Y}_i|{q}_i={Q}_2\right]\right|. $$
Since PRQs are a type of MRT, we will refer to them interchangeably in the following sections.
A side note on SUTVA
We assume SUTVA holds in our setting. However, this assumption is likely to be controversial. First, since cases makes precedents – and more generally, judges and litigants learn from resolution of prior cases – a prior case’s panel assignment might indeed influence future cases’ outcomes. Second, each treatment (i.e., panel) is very likely to have different “versions” of itself that might amount to entirely different treatments.
In our empirical application below, we take an important step to try to mitigate the threat of SUTVA violations. Specifically, all of our effects are estimated within each year. In addition to ensuring that we satisfy the random assignment assumption, this also reduces the impact that learning from prior cases has on the resolution for future cases. For example, it is much less reasonable to assume SUTVA when comparing cases decided in 1995 to cases decided in 2013 than it is when comparing cases decided in 1995 to other cases decided in 1995.
Stepping back, however, SUTVA is implicit in all studies of judicial decision-making that make a claim to unbiased effects, so this issue is not unique to our analysis. Exactly how and why SUTVA affects average treatment effects in judicial politics research is an interesting issue for future research.
Measuring MRTs in the Ninth Circuit
In this section, we measure MRTs in an original dataset of all civil appeals from district courts that were filed between 1995 and 2013 in the Ninth Circuit and that were randomly assigned to three-judge panels. To do this, we need to (1) justify the assumption that panels are randomly assigned to cases (see Proposition 2), (2) assure that our MRTs preserve randomization (i.e., are not correlated with pretreatment characteristics), and (3) measure MRTs with as little measurement error as possible (see Proposition 5).
In order to measure MRTs and assure that they preserve randomization, we draw from the growing literature on estimating heterogeneous treatment effects with meta-learners. As explained below, we use a modified version of the S-Learner and use cross-fitting to protect the assumption that the MRTs are as if randomly assigned to cases. While we develop our approach using data from the Ninth Circuit, this approach could be easily adapted for other judicial decision-making contexts. However, we cannot say anything general about how well it will work in all settings. While better algorithms, better data, and more data can reduce measurement error in MRTs, there is little that can be said about which exact combinations of algorithms, predictors, and data will sufficiently reduce measurement error. As a result, a key component of our approach is validation. Below, we validate our Ninth Circuit measures in two ways. First, we provide support for the assumption that the MRTs are not correlated with pretreatment characteristics. Our measurement strategy thus preserves random assignment. Then, we demonstrate the strong face and construct validity of our measured MRTs. In particular, we demonstrate that the MRTs are indeed strongly predictive of case outcomes, which is what they are designed for.
Our dataset consists of 11,359 appeals, and the outcome variable in our analyses is whether a case is affirmed or not. When a case is not affirmed, we generally refer to the outcome as a “reversal,” although that includes decisions to vacate or remand, decisions to reverse or vacate in part, and, on rare occasion (approximately 1%), decisions labeled as “Other.”Footnote 10 Our dataset has 3,130 unique three-judge panels that are composed of 371 unique judges.
Verifying random assignment of panels to cases
The Ninth Circuit reports that it randomly assigns panels of three judges to most of its cases. As we verified in a conversation with the Clerk of Court, some cases are prescreened and assigned to panels nonrandomly. We drop these cases from our analysis. Of course, case assignment is only random within a time period and region. Thus, when using MRTs to estimate treatment effects, we include region-year fixed effects.
We test the assumption that cases are randomly assigned to panels by testing if case characteristics can predict whether a panel is majority Republican. If they can, then this would indicate that certain types of cases are more likely to be assigned to certain types of judges, violating random assignment. Fortunately, in our dataset, we cannot predict judge partisanship with case characteristics. More specifically, Figure 3 shows that a stacking ensemble with access to case predictors is no better able to predict whether a case is assigned to a majority Republican panel than is a stacking ensemble with only access to region-year fixed effects. The results provide evidence that panels are randomly assigned to cases.
We plot two ROC curves for machine learning models that attempt to predict whether a panel is majority Republican (i.e., judge characteristics). One model has access only to region-year fixed effects (the red line), while the other model has access to these fixed effects plus all other case predictors in our dataset (blue line). These additional case predictors do not provide any additional predictive power, indicating that they are not associated with judge characteristics.

Measuring MRTs with a modified S-Learner
Obtaining the most accurate measures of the relevant MRT (i.e., the PRQ $ {\hat{q}}_i $
) requires obtaining the most accurate ordering of
$ {\hat{q}}_i $
) requires obtaining the most accurate ordering of $ \hat{\unicode{x1D53C}}\left[{Y}_i|p,\mathbf{f}\right] $
for all combinations of panels and case characteristics. For modeling complex interactions in a conditional expectation, it is now common to use machine learning, specifically ensemble learning. We use Automatic Machine Learning (AutoML) within H2O, an open-source environment in R. The stacking methodology employs supervised learning based on loss functions, leveraging
$ \hat{\unicode{x1D53C}}\left[{Y}_i|p,\mathbf{f}\right] $
for all combinations of panels and case characteristics. For modeling complex interactions in a conditional expectation, it is now common to use machine learning, specifically ensemble learning. We use Automatic Machine Learning (AutoML) within H2O, an open-source environment in R. The stacking methodology employs supervised learning based on loss functions, leveraging $ k $
-fold cross-validation to determine the optimal combination of diverse base algorithms. The process begins by generating cross-validated predictions for each base learning algorithm in the ensemble, which may include generalized linear models, random forests, and neural networks. This is accomplished by dividing the dataset into
$ k $
-fold cross-validation to determine the optimal combination of diverse base algorithms. The process begins by generating cross-validated predictions for each base learning algorithm in the ensemble, which may include generalized linear models, random forests, and neural networks. This is accomplished by dividing the dataset into $ k $
folds, where training occurs on
$ k $
folds, where training occurs on $ k-1 $
folds while generating predictions on the remaining fold. This procedure repeats
$ k-1 $
folds while generating predictions on the remaining fold. This procedure repeats $ k $
times, ensuring each fold serves as validation data exactly once. Subsequently, the system regresses these predictions against actual outcomes to determine appropriate weights for each base algorithm. The resulting weighted combination yields an ensemble prediction function that is then applied across the entire dataset. The approach is asymptotically optimal for learning outcomes (Polley and Van der Laan Reference Polley and Van der Laan2010). Details regarding our ensemble learner are available in Online Appendix C.2.
$ k $
times, ensuring each fold serves as validation data exactly once. Subsequently, the system regresses these predictions against actual outcomes to determine appropriate weights for each base algorithm. The resulting weighted combination yields an ensemble prediction function that is then applied across the entire dataset. The approach is asymptotically optimal for learning outcomes (Polley and Van der Laan Reference Polley and Van der Laan2010). Details regarding our ensemble learner are available in Online Appendix C.2.
But there is still the question of how to employ ensemble learning to achieve the most accurate ordering of $ \hat{\unicode{x1D53C}}\left[{Y}_i|p,\mathbf{f}\right] $
. For this, we take guidance from the literature on meta-learners, techniques to employ machine learning to optimally estimate heterogeneous treatment effects. This literature has almost entirely focused on contexts with binary treatments (Goplerud, Imai, and Pashley, Reference Goplerud, Imai and PashleyForthcoming). Even though we have many more treatments (i.e., each unique panel), the research on meta-learners is instructive.
$ \hat{\unicode{x1D53C}}\left[{Y}_i|p,\mathbf{f}\right] $
. For this, we take guidance from the literature on meta-learners, techniques to employ machine learning to optimally estimate heterogeneous treatment effects. This literature has almost entirely focused on contexts with binary treatments (Goplerud, Imai, and Pashley, Reference Goplerud, Imai and PashleyForthcoming). Even though we have many more treatments (i.e., each unique panel), the research on meta-learners is instructive.
One common meta-learner is the S-Learner, or the “Single Learner.” With a standard S-Learner, we would fit a single model of $ \hat{\unicode{x1D53C}}\left[{Y}_i|p,\mathbf{f}\right] $
. Then, using that model, we would generate predictions of
$ \hat{\unicode{x1D53C}}\left[{Y}_i|p,\mathbf{f}\right] $
. Then, using that model, we would generate predictions of $ \hat{\unicode{x1D53C}}\left[{Y}_i|p,\mathbf{f}\right] $
for each panel in each case. For a case
$ \hat{\unicode{x1D53C}}\left[{Y}_i|p,\mathbf{f}\right] $
for each panel in each case. For a case $ i $
, the quantile of the assigned panel’s predicted outcome in a distribution of counterfactual panels’ predicted outcomes would be that case’s estimated PRQ,
$ i $
, the quantile of the assigned panel’s predicted outcome in a distribution of counterfactual panels’ predicted outcomes would be that case’s estimated PRQ, $ {\hat{q}}_i $
.
$ {\hat{q}}_i $
.
A well-understood problem with this approach is that, by maximizing accuracy of $ \hat{\unicode{x1D53C}}\left[{Y}_i|p,\mathbf{f}\right] $
, the S-Learner may poorly estimate the ranking of
$ \hat{\unicode{x1D53C}}\left[{Y}_i|p,\mathbf{f}\right] $
, the S-Learner may poorly estimate the ranking of $ \hat{\unicode{x1D53C}}\left[{Y}_i|p,\mathbf{f}\right] $
among panels (Salditt, Eckes, and Nestler Reference Salditt, Eckes and Nestler2024). This is because the learner may place excessive weight on predictors other than the assigned panel, especially if those predictors are highly predictive of the outcome. (In fact, a standard S-Learner might entirely exclude panel variables from its fitted model!) Since case characteristics are highly predictive of outcomes, and data from each unique panel is sparse, it is likely that a standard S-Learner would place excessive weight on case characteristics and fail to accurately discern the ranking among panels.
$ \hat{\unicode{x1D53C}}\left[{Y}_i|p,\mathbf{f}\right] $
among panels (Salditt, Eckes, and Nestler Reference Salditt, Eckes and Nestler2024). This is because the learner may place excessive weight on predictors other than the assigned panel, especially if those predictors are highly predictive of the outcome. (In fact, a standard S-Learner might entirely exclude panel variables from its fitted model!) Since case characteristics are highly predictive of outcomes, and data from each unique panel is sparse, it is likely that a standard S-Learner would place excessive weight on case characteristics and fail to accurately discern the ranking among panels.
One way to “force” a learner to place sufficient weight on panel variables in its fitted model would be to estimate a separate model for each panel – for example, separately fit $ \hat{\unicode{x1D53C}}\left[{Y}_i|{p}_1,\mathbf{f}\right] $
,
$ \hat{\unicode{x1D53C}}\left[{Y}_i|{p}_1,\mathbf{f}\right] $
, $ \hat{\unicode{x1D53C}}\left[{Y}_i|{p}_2,\mathbf{f}\right] $
, and so on. In contexts where researchers are dealing with binary treatment variables, this kind of meta-learner is referred to as a T-Learner (short for “Two Learner”). Unfortunately, a T-Learner is not an option in our context. As indicated by its name, it is designed for a binary treatment, but we have many more treatments – each unique panel is a treatment. And because each unique panel decided few cases together, it is not feasible to fit separate, high-quality models for each unique panel.Footnote 11
$ \hat{\unicode{x1D53C}}\left[{Y}_i|{p}_2,\mathbf{f}\right] $
, and so on. In contexts where researchers are dealing with binary treatment variables, this kind of meta-learner is referred to as a T-Learner (short for “Two Learner”). Unfortunately, a T-Learner is not an option in our context. As indicated by its name, it is designed for a binary treatment, but we have many more treatments – each unique panel is a treatment. And because each unique panel decided few cases together, it is not feasible to fit separate, high-quality models for each unique panel.Footnote 11
So, we modify the S-Learner to increase algorithmic emphasis on ranking $ \hat{\unicode{x1D53C}}\left[{Y}_i|p,\mathbf{f}\right] $
for different panels. Recall that the core problem with the standard S-Learner is that the variable of core interest, the panel, may be excluded or given little weight. We make three modifications to address this problem.
$ \hat{\unicode{x1D53C}}\left[{Y}_i|p,\mathbf{f}\right] $
for different panels. Recall that the core problem with the standard S-Learner is that the variable of core interest, the panel, may be excluded or given little weight. We make three modifications to address this problem.
Add panel characteristics. As discussed above, because data from each unique panel is sparse, an S-Learner is unlikely to place sufficient weight on those variables when estimating $ \hat{\unicode{x1D53C}}\left[{Y}_i|p,\mathbf{f}\right] $
. To improve the likelihood that the learner will use panel characteristics to fit its models, we add a collection of panel characteristic variables, such as how many Republican appointees are on the panel; the median, average, maximum, and minimum DIME score of the panel’s judges (Bonica and Sen Reference Bonica and Sen2017); and dummy variables indicating whether each judge was on the panel. The full list of panel characteristics included in our learner is available in Table C.2 in Online Appendix C.1. By including panel characteristics in the model, we make it easier for the algorithm to predict how different panels would decide different cases. Formally speaking, this transforms the target of estimation from
$ \hat{\unicode{x1D53C}}\left[{Y}_i|p,\mathbf{f}\right] $
. To improve the likelihood that the learner will use panel characteristics to fit its models, we add a collection of panel characteristic variables, such as how many Republican appointees are on the panel; the median, average, maximum, and minimum DIME score of the panel’s judges (Bonica and Sen Reference Bonica and Sen2017); and dummy variables indicating whether each judge was on the panel. The full list of panel characteristics included in our learner is available in Table C.2 in Online Appendix C.1. By including panel characteristics in the model, we make it easier for the algorithm to predict how different panels would decide different cases. Formally speaking, this transforms the target of estimation from $ \hat{\unicode{x1D53C}}\left[{Y}_i|p,\mathbf{f}\right] $
to
$ \hat{\unicode{x1D53C}}\left[{Y}_i|p,\mathbf{f}\right] $
to $ \hat{\unicode{x1D53C}}\left[{Y}_i|p,\mathbf{c},\mathbf{f}\right] $
, where
$ \hat{\unicode{x1D53C}}\left[{Y}_i|p,\mathbf{c},\mathbf{f}\right] $
, where $ \mathbf{c} $
is a vector of panel characteristics.
$ \mathbf{c} $
is a vector of panel characteristics.
Residualize outcome variable. S-Learners are prone to put too much weight on highly predictive variables, such as case characteristics. To counteract that, we first “residualize” the outcome variable to remove information about case characteristics, and then change the target outcome of the S-Learner to this residualized outcome in order to better focus the learner on panel variables. The residualization process proceeds as follows. We first estimate $ \unicode{x1D53C}\left[{Y}_i|\mathbf{f}\right] $
with ensemble learning to best capture the variation in the outcome explained solely by case characteristics. We then isolate the residual variation in the outcome by subtracting those estimates from the outcome. We use those residuals as the target outcome for our S-Learner. More formally, our S-Learner’s target of estimation is
$ \unicode{x1D53C}\left[{Y}_i|\mathbf{f}\right] $
with ensemble learning to best capture the variation in the outcome explained solely by case characteristics. We then isolate the residual variation in the outcome by subtracting those estimates from the outcome. We use those residuals as the target outcome for our S-Learner. More formally, our S-Learner’s target of estimation is $ \hat{\unicode{x1D53C}}\left[{\tilde{Y}}_i|p,\mathbf{c},\mathbf{f}\right] $
, where
$ \hat{\unicode{x1D53C}}\left[{\tilde{Y}}_i|p,\mathbf{c},\mathbf{f}\right] $
, where $ {\tilde{Y}}_i={Y}_i-\hat{\unicode{x1D53C}}\left[{Y}_i|\mathbf{f}\right] $
. Note that we keep case features in our S-Learner despite residualizing because it is possible (indeed likely) that interactions between panel and case characteristics are predictive.
$ {\tilde{Y}}_i={Y}_i-\hat{\unicode{x1D53C}}\left[{Y}_i|\mathbf{f}\right] $
. Note that we keep case features in our S-Learner despite residualizing because it is possible (indeed likely) that interactions between panel and case characteristics are predictive.
Screen for predictive case characteristics. Our third, final, and most minor modification is to screen case characteristics for promising interactions with panel characteristics. That is, before estimating $ \unicode{x1D53C}\left[{\tilde{Y}}_i|p,\mathbf{c},\mathbf{f}\right] $
, we select a subset of the case characteristics that have strong interactions with panel variables. This again modifies the S-Learner’s target of estimation to
$ \unicode{x1D53C}\left[{\tilde{Y}}_i|p,\mathbf{c},\mathbf{f}\right] $
, we select a subset of the case characteristics that have strong interactions with panel variables. This again modifies the S-Learner’s target of estimation to $ \hat{\unicode{x1D53C}}\left[{\tilde{Y}}_i|p,\mathbf{c},\tilde{\mathbf{f}}\right] $
, where
$ \hat{\unicode{x1D53C}}\left[{\tilde{Y}}_i|p,\mathbf{c},\tilde{\mathbf{f}}\right] $
, where $ \tilde{\mathbf{f}} $
is a smaller, prescreened collection of case features.
$ \tilde{\mathbf{f}} $
is a smaller, prescreened collection of case features.
The screening function we use to determine $ \tilde{\mathbf{f}} $
is as follows:
$ \tilde{\mathbf{f}} $
is as follows:
-
1. Run a LASSO regression on the panel predictors and select all panel predictors with a scaled importance greater than 0.8.
-
2. Run a LASSO regression that interacts the selected panel predictors with all case predictors and select the case predictors with a scaled importance greater than 0.8.
-
3. Include all panel predictors and only the case predictors selected in Step 2 in the ensemble, estimating $ \hat{\unicode{x1D53C}}\left[{\tilde{Y}}_i|p,\mathbf{c},\tilde{\mathbf{f}}\right] $
.
$ \hat{\unicode{x1D53C}}\left[{\tilde{Y}}_i|p,\mathbf{c},\tilde{\mathbf{f}}\right] $
.

The cutoffs we used for scaled importance were selected via testing the performance on data that is not used in the analysis. This third modification does not substantially alter our estimates of $ {\hat{q}}_i $
. It is simply one last nudge for the S-Learner to focus on panel variables and their interactions with case features.
$ {\hat{q}}_i $
. It is simply one last nudge for the S-Learner to focus on panel variables and their interactions with case features.
Cross-fitting to preserve the assumption that panels are randomly assigned to cases
Above, we provided evidence that panels are randomly assigned to cases. For valid causal inference, it is critical that our new treatment variable, $ {\hat{q}}_i $
, preserves that randomization such that the newly constructed treatment variable is not associated with pretreatment characteristics.
$ {\hat{q}}_i $
, preserves that randomization such that the newly constructed treatment variable is not associated with pretreatment characteristics.
Machine learning models that predict outcomes (like ours) can introduce bias when they are used to construct variables for downstream causal inference analyses. The core problem is that outcomes in a training set may be correlated with predictors in that training set, even though there is no true correlation. For example, a correlation in a training set could simply be spurious, which is possible due to random chance alone. This is a classic example of over-fitting. In our context, this would mean that estimated PRQs could be correlated with pretreatment case characteristics even though actual panel assignments are random (as we showed above).
To deal with this problem, we draw on recent methodological work showing that cross-fitting can help preserve causal identification when using machine learning methods to estimate heterogeneous treatment effects (Chernozhukov et al. Reference Chernozhukov, Chetverikov, Demirer, Duflo, Hansen, Newey and Robins2018). In our context, cross-fitting helps preserve the random assignment assumption by ensuring that the predictions used to construct the PRQs are generated from models trained on different data than the data for which we are making predictions. Specifically, we do the following:
-
1. Randomly partition our dataset into
$ K $
folds. -
2. For each fold
$ k\le K $
:-
• train our modified S-Learner on all folds except fold
$ k $
; and -
• use that model to generate predictions and construct PRQs only for observations in fold
$ k $
.
-
-
3. Combine the PRQs from all
$ K $
folds to form our final dataset.


This procedure ensures that the data used to construct each case’s PRQ was not used to train the model that yielded that PRQ. As a result, any spurious correlations between our machine learning predictions and case characteristics that might arise during training cannot affect our PRQ measures. We use $ K=10 $
folds for our cross-fitting procedure, a standard choice in machine learning.
$ K=10 $
folds for our cross-fitting procedure, a standard choice in machine learning.
Importantly, we apply the cross-fitting procedure to both stages of our modified S-Learner: both when generating the initial panel-free predictions used for residualization (i.e., estimating $ \hat{\unicode{x1D53C}}\left[{Y}_i|\mathbf{f}\right] $
) and when generating the panel-specific predictions used to construct the PRQs (i.e., estimating
$ \hat{\unicode{x1D53C}}\left[{Y}_i|\mathbf{f}\right] $
) and when generating the panel-specific predictions used to construct the PRQs (i.e., estimating $ \hat{\unicode{x1D53C}}\left[{\tilde{Y}}_i|p,\mathbf{c},\tilde{\mathbf{f}}\right] $
). This comprehensive approach helps ensure that we maintain the random assignment assumption throughout our entire estimation procedure.
$ \hat{\unicode{x1D53C}}\left[{\tilde{Y}}_i|p,\mathbf{c},\tilde{\mathbf{f}}\right] $
). This comprehensive approach helps ensure that we maintain the random assignment assumption throughout our entire estimation procedure.
Evidence that random assignment is preserved
Although cross-fitting should suffice to preserve randomization, we conduct an additional test for verification. We examine whether cases that are more likely to be reversed are disproportionately assigned to panels with higher PRQs.
To implement this test, we employ the predictions from an ensemble learner trained on only case features that we obtained to residualize outcomes in Measuring MRTs with a modified S-Learner. These predictions represent the baseline probability that each case would be reversed, independent of which panel hears it. If our measured PRQs preserve random assignment, they should not be systematically related to these “reversibility” predictions.
We test for potential nonrandom assignment by regressing PRQs on the panel-independent predictions of reversal, including region-time fixed effects. The results support the assumption that random assignment is preserved: we estimate a statistically insignificant coefficient of −0.07 ( $ p $
-value: 0.11). Thus, we do not find evidence that more reversable cases are being disproportionately assigned to panels with higher PRQs. This finding, combined with our use of cross-fitting and our earlier evidence that panels are randomly assigned to cases, provides strong support for the validity of our measurement strategy.
$ p $
-value: 0.11). Thus, we do not find evidence that more reversable cases are being disproportionately assigned to panels with higher PRQs. This finding, combined with our use of cross-fitting and our earlier evidence that panels are randomly assigned to cases, provides strong support for the validity of our measurement strategy.
Face validity of PRQs
In Figure 4, we provide some substantive texture for our PRQ variable, which demonstrates that it actually captures patterns of decision-making that Ninth Circuit observers would find intuitive. First note that the cases heard by panels including Judge Reinhardt tend to be clustered at the high end of the PRQ distribution. This indicates that these panels are unusually likely to reverse the cases that they are assigned. It is thus noteworthy that Judge Reinhardt’s decision-making earned him a number of nicknames, which included “Bad Boy of the Federal Judiciary.” However, consider the cases heard by panels including Judge Kozinski. While these are more concentrated at lower percentiles, they are more spread out. This suggests that Judge Kozinski’s presence on these panels was more moderating than Judge Reinhardt, perhaps unsurprising given that he was Chief Judge during much of the period we study and was thus likely to have been especially concerned with the overall operation of the court and the collegiality between judges.
We plot the distribution of PRQs for cases assigned to panels containing Judge Reinhardt and the distribution of PRQs for cases assigned to panels containing Judge Kozinski. The former indicates that Judge Reinhardt was unusually influential, since cases assigned to his panels were much more inclined to reverse than the court norm. The latter indicates that Judge Kozinski was more conciliatory, since cases assigned to his panels were distributed fairly uniformly across PRQs. This is an indication that he “went along” with the other judges on his panel.

Construct validity of PRQs
We have argued – and shown formally – that PRQs capture the extent to which an assigned panel is inclined to reverse or affirm. Before we proceed to our substantive analysis in which we empirically quantify disagreement among panels in the Ninth Circuit, we demonstrate that our measured PRQs have strong construct validity.
In particular, PRQs will have strong construct validity if they strongly predict whether a case is more or less likely to be reversed. To demonstrate construct validity, we bin cases into PRQ deciles and calculate the mean reversal rate in each decile. We plot this in black in Figure 5, which shows that PRQs are strongly correlated with reversal rates. The correlation between PRQ decile and reversal rates is 0.92.
We further demonstrate the strength of our measure by comparing it to a different treatment variable – political ideology – that has been shown to explain substantial disagreement between panels (see, ch. 3 of Friedman et al. Reference Friedman, Lemos, Martin, Clark, Larsen and Harvey2020). In Figure 5, we show the correlation between DIME scores and reversal rates in gray.Footnote 12 The correlation is substantially weaker (0.64), indicating that political ideology (at least as measured by DIME scores) does not explain as much disagreement between panels as we have been able to explain with PRQs.
We show the correlation between PRQs and reversal rates (in black), and between DIME scores and reversal rates (in gray). For the latter, we use the median DIME score of each assigned panel, which we then normalize into percentiles for ease of comparison.

How much do judges matter in the Ninth Circuit?
Now that we have measured a new MRT, and we can perform several analyses to characterize how much judges matter in the Ninth Circuit. In real-world datasets like ours, the number of cases heard by panels at each PRQ will be fairly small. So, if we try to estimate MRODs with specific PRQs, our MROD estimates will be very imprecise. Just to illustrate, suppose we wanted to estimate an MROD to quantify disagreement between the panels exactly at the 10th PRQ and exactly at the 90th PRQ. In our dataset, there are two cases at the 10th percentile and one case at the 90th percentile. Obviously, estimating this MROD is not feasible.
The easiest and simplest way to deal with this is to simply “bin” PRQs into (approximately) equal-sized intervals. For example, if we bin into five groups, then all cases whose assigned panel has a PRQ less than or equal to 0.20 will be “treated” to the first quintile. Obviously, the downside of doing this is that we are consolidating potentially very different panels into single treatment groups. This will mechanically tend to yield lower estimates of disagreement in exchange for more precise ones.Footnote 13
Comparing quintiles
We begin by binning the PRQs into five equal bins, or PRQ quintiles. In Figure 6, we show the estimated effect of assigning cases to different PRQ quintiles relative to the lowest PRQ quintile. For example, assignment to a panel in the highest PRQ quintile rather than the lowest PRQ quintile results in an approximately 16 percentage point increase in the reversal rate.
The effect of assigning cases to panels predicted to be more likely to reverse. The reference group is cases assigned to panels in the lowest PRQ quintile. Error bars reflect 95% confidence intervals. Point estimates and standard errors (in parentheses) are also included above each confidence interval.

Comparing extremes of the PRQ distribution
We now estimate several MRODs that allow us to quantify the extent to which judges could matter by comparing outcomes in cases heard by the most outlier panels in the PRQ distribution. Of course, the practical difficulty is again in choosing which outlier panels to compare. Too far on the extremes of the distribution, our estimates will be quite noisy, but not far enough, we will uncover less hidden disagreement. We thus test a number of different options. Figure 7 displays the estimated effect of assigning a case to the top X% PRQs relative the lowest X% PRQs, where X can be either 10, 5, 4, 3, 2, or 1.
Estimates of the extent to which judges matter for case outcomes in the Ninth Circuit. The leftmost estimate is the estimated effect on the likelihood of reversal from reassigning cases that were assigned to the 10% of panels with the lowest predicted probability of reversing them to the 10% of panels with highest predicted probability of reversing them. Each subsequent comparison is of the same form (e.g., lowest 5% versus highest 5%). Error bars reflect 95% confidence intervals. Point estimates and standard errors (in parentheses) are also included above each confidence interval.

Substantively, each of these estimates gives the percentage of appeals that would be decided differently if each case were assigned to a panel most likely to reverse it versus a panel least likely to reverse it. Looking at the right-most estimate, we estimate that at least 38% of cases would be decided differently if they were assigned to a panel in the top 1% of panels most likely to reverse instead of to a panel in the bottom 1% of panels most likely to reverse (and vice versa).
How much would re-randomization change outcomes?
Another potentially interesting quantity for evaluating how much judges matter for case outcomes is to calculate what percentage of cases would be decided differently had cases been re-randomized. In other words, how many cases’ outcomes were due solely to the random allocation of their assigned panel?
Formally, this amounts to calculating the average of a large set of (pairwise) MRODs. For example, suppose we bin PRQs into quartiles; then the average MROD would simply average each pairwise MROD across all combinations of the four quantiles. Figure 8 plots average MRODs using increasingly fine binning of the PRQs. As the bins become more numerous, our estimates increase because we are uncovering more hidden disagreement among judges. The estimates eventually level off once increasing the number of partitions no longer helps us uncover additional hidden disagreement. The resulting “asymptote” is our best estimate of how many cases would be decided differently if they were randomly reassigned. In this case, we estimate that at least 6.5% of cases would be decided differently if all the cases in our dataset were randomly reassigned.
Estimates of how many cases would have a different outcome if they were randomly reassigned to panels. Estimates are the average of the pairwise estimated effects of assigning cases from a lower quantile partition to a higher quantile partition, including an effect of zero for each partition (allowing for cases to be reassigned to a panel in the same quantile range).

Conclusion
Quantifying how much judges matter for case outcomes is critical to evaluating the American courts. If there are stark differences in the way judges resolves cases, this casts doubt on the notion that judges are simply “neutral arbiters” and raises questions about whether judge-made law can ever be truly consistent.
Yet, decades after the quantitative revolution in judicial politics research, there are still serious challenges to identifying the full extent of disagreement among judges. Traditional average treatment effects paint an incomplete and piecemeal picture of the total amount of disagreement among judges. We demonstrate how advances in machine learning can be leveraged to create a treatment variable that is optimized for quantitatively exposing disagreement between decision-makers. With the introduction of our monotonicity robust treatment variable, the PRQ, we hope to encourage the development of a more robust and wide-reaching quantitative literature evaluating the breadth of judicial influence over cases.
There are many ways that high-quality estimates of disagreement can aid substantive scholarly research on courts. Perhaps most obviously, advances in estimating disagreement among judges could help resolve the debate over whether the Ninth Circuit’s exceptional size has resulted in heightened levels of decision-making inconsistency. Our method might also help the very research it has taken inspiration from: the judicial politics literature that focuses on how politics, race, and gender influence decision-making. Scholars in that field might use our aggressive method for uncovering disagreement to evaluate the plausibility of theoretical explanations. For example, if inter-judge disagreement is much higher than an average treatment effect motivated by a theoretical explanation, this provides information about the relative importance of the theoretical explanation (similar to the way R-squared is sometimes interpreted). We could also imagine court scholars using our method to identify outlier decisions so as to explore strategic judicial behavior with those decisions – for example, do judges tend to leave outlier decisions unpublished so as to avoid drawing attention from their colleagues? We think the possibilities are plentiful, and we encourage researchers to take the study of judicial disagreement seriously.
Supplementary material
The supplementary material for this article can be found at http://doi.org/10.1017/jlc.2025.10006.


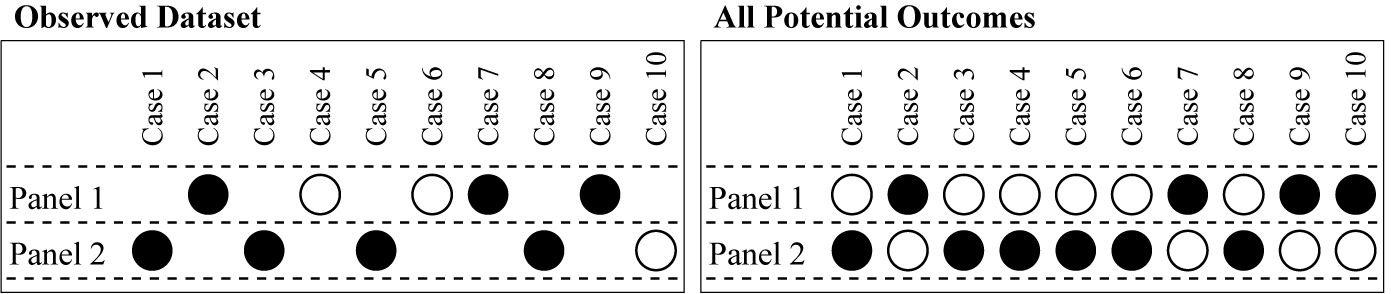
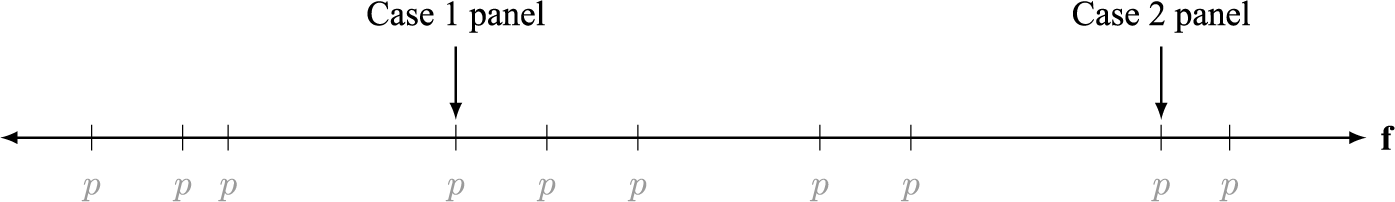

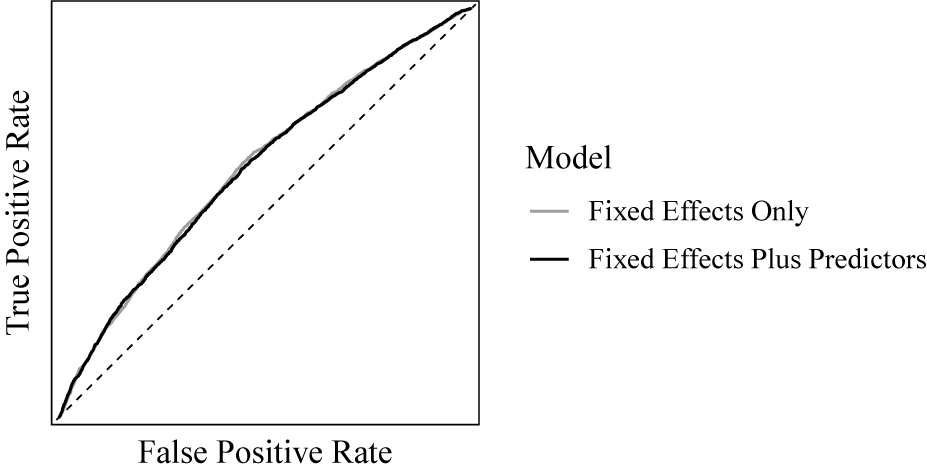
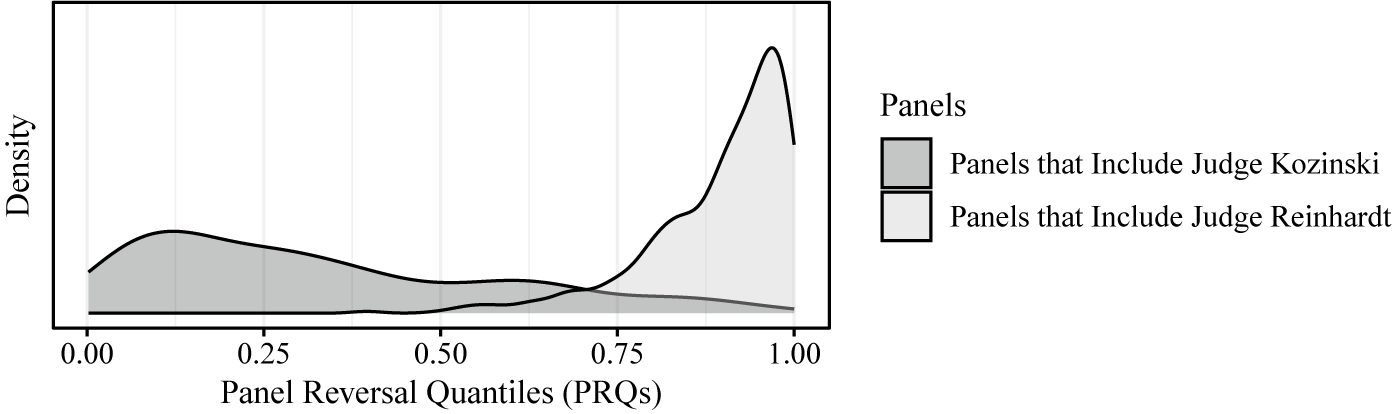
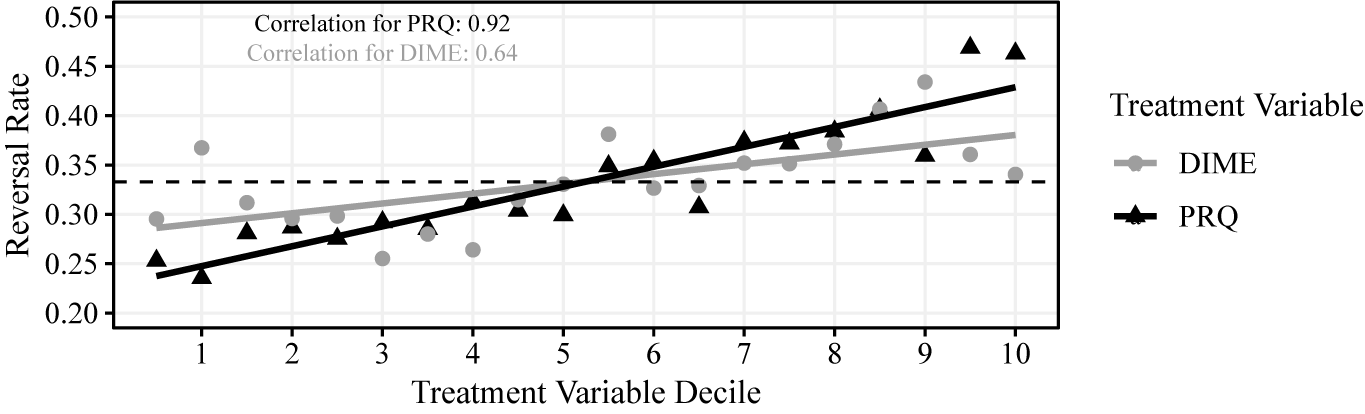
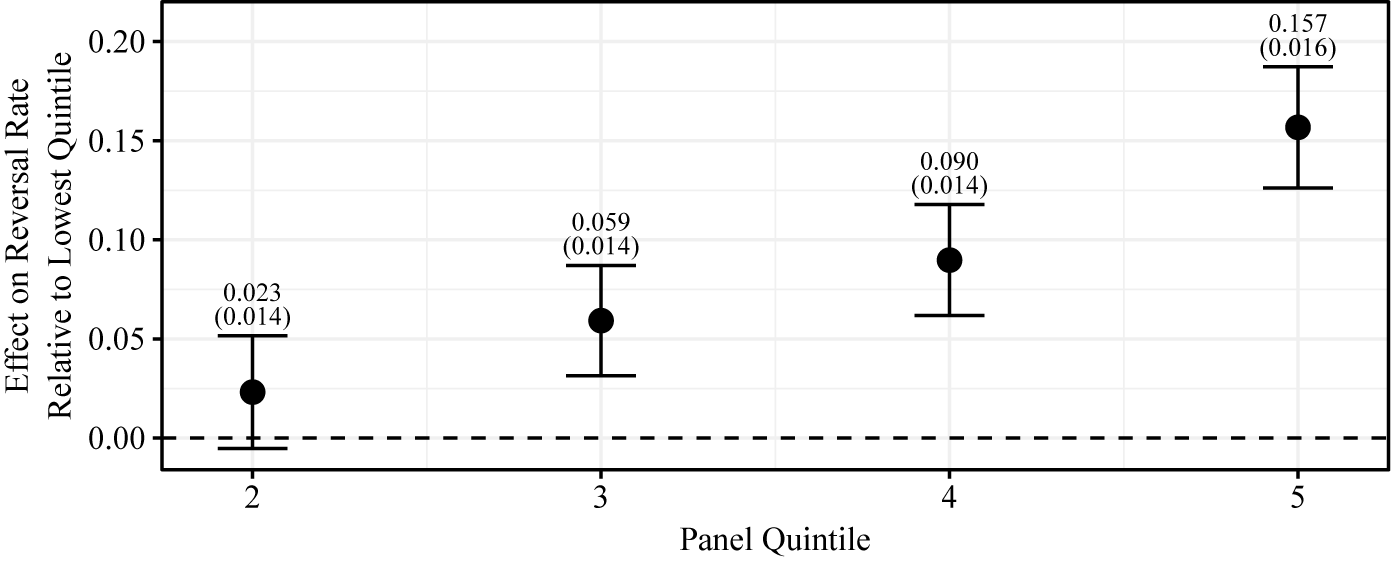
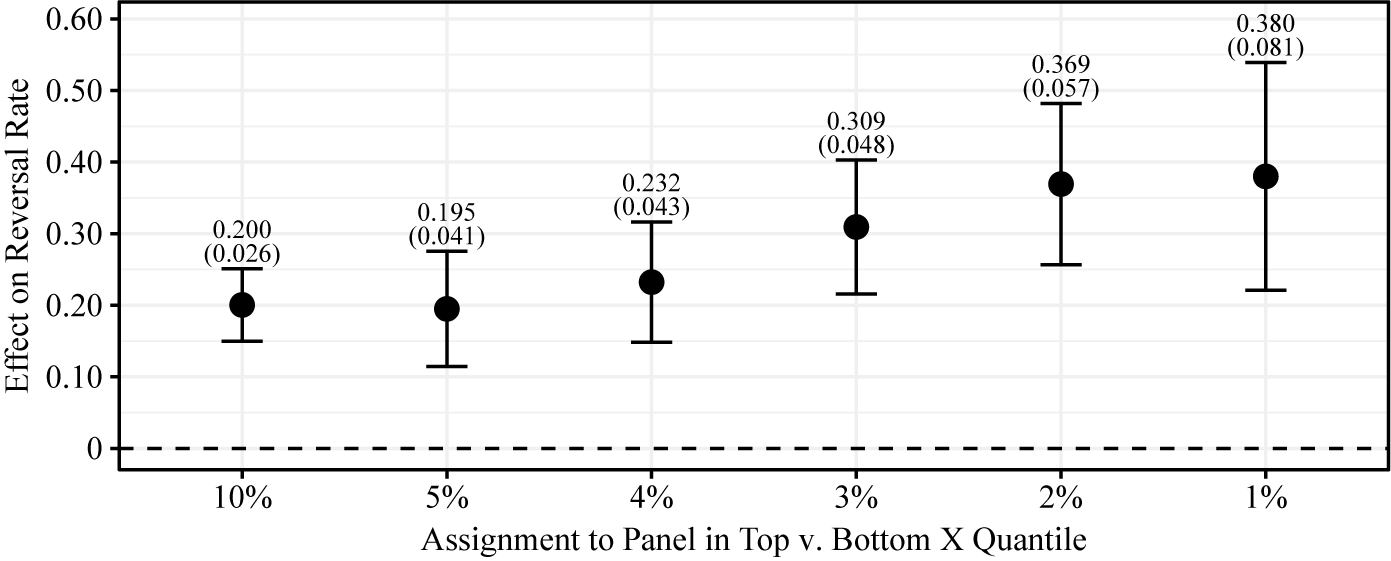
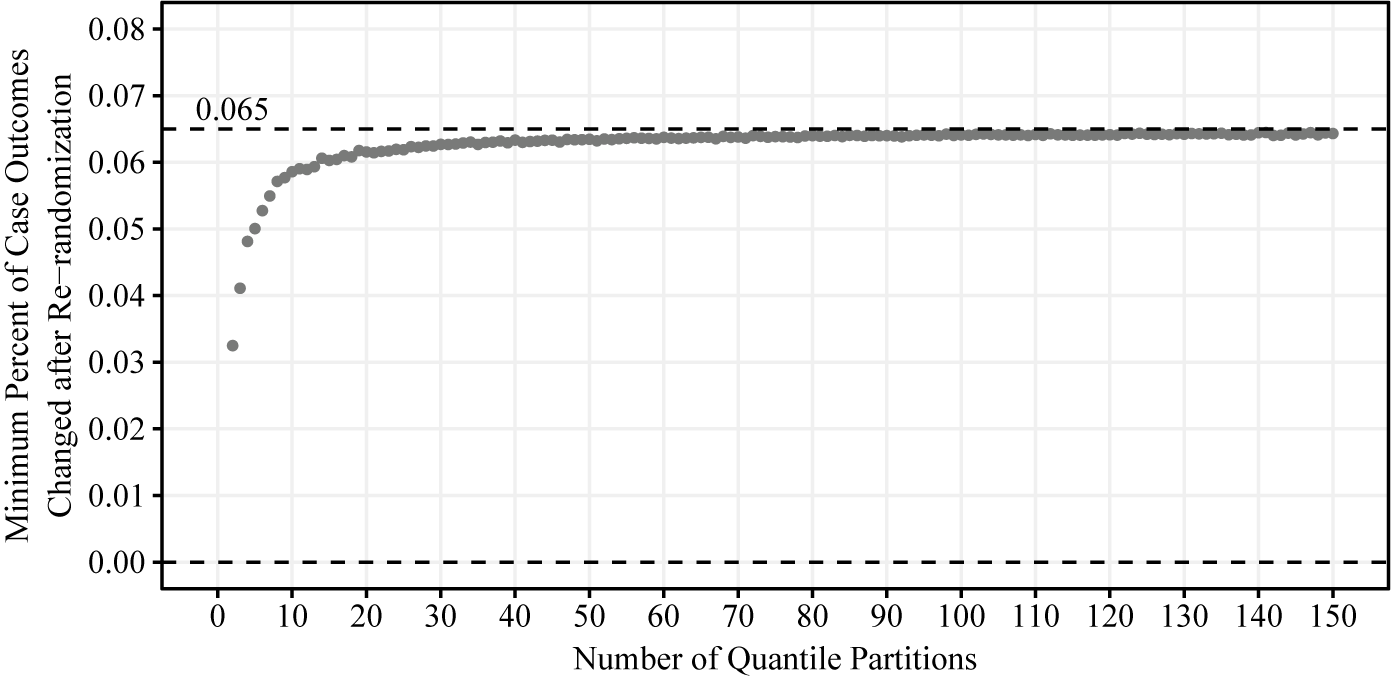


 Open access