





Introduction
Stress related to dietary, social, and environmental changes during the weaning period causes intestinal disorders, dysbiosis, increases permeability, and compromises gut functionality (Moeser et al. Reference Moeser, Pohl and Rajput2017). Changes in the intestinal microbiota affect immune system function, modulating both pro-inflammatory and anti-inflammatory responses (Patil et al. Reference Patil, Gooneratne and Ju2020). These factors, combined with the metabolic changes that the animal undergoes at this stage, can compromise growth and performance throughout the piglet’s life.
Gut microbiota also plays a significant role in the modulation of the endocannabinoid system, a network of lipid intermediates and receptors, capable of altering appetite, metabolism, and inflammation (Muccioli et al. Reference Muccioli, Naslain and Bäckhed2010). The arachidonic acid-derived endocannabinoids, 2-arachidonylglycerol (2-AG), and anandamide (N-arachidonoylethanolamine; AEA), interact with CB1 and CB2 cannabinoid receptors present in tissues and on immune system cells to reduce the release of pro-inflammatory cytokines and modulate the immune response (Karwad et al. Reference Karwad, Couch and Theophilidou2017; Rakotoarivelo et al. Reference Rakotoarivelo, Mayer and Simard2024). In addition, the endocannabinoid system is involved in several physiological processes, including regulating energy balance, metabolism, food intake regulation, weight gain, fat accumulation in adipocytes, and general whole-body homeostasis (Silvestri and Di Marzo Reference Silvestri and Di Marzo2013; Turcotte et al. Reference Turcotte, Chouinard and Lefebvre2015); thus, it is also expected to influence animal performance. Given the flexibility of the enzymes that regulate the formation of 2-AG and AEA, other fatty acids can similarly be utilized in the formation of related molecules. These molecules often signal through receptors other than the cannabinoid CB1 and CB2 receptors, and may exert metabolic effects opposite to 2-AG and AEA. This enlarged family of bioactive lipids (including 2-AG and AEA), along with their receptors and regulatory enzymes, is termed the endocannabinoidome (eCBome) (Di Marzo Reference Di Marzo2018; Di Marzo and Silvestri Reference Di Marzo and Silvestri2019; Veilleux et al. Reference Veilleux, Di Marzo and Silvestri2019). The eCBome is highly responsive to diets, especially dietary fatty acids, which can rapidly shift the synthesis of individual eCBome lipids and other lipids involved in cell including several types of oxylipins derived from omega-3 and -6 fatty acids (Bourdeau-Julien et al. Reference Bourdeau-Julien, Castonguay-Paradis and Rochefort2023; Lacroix et al. Reference Lacroix, Pechereau and Leblanc2019).
Oxylipins are formed by enzymatic or non-enzymatic oxidation of polyunsaturated fatty acids (PUFAs) for which four main production pathways prevail: lipoxygenases (LOXs), cyclooxygenases (COXs), cytochrome P450 (CYPs), and reactive oxygen species (ROS) (Liang et al. Reference Liang, Harsch and Zhou2024). The concentration and formation pathway of oxylipins correspond to the changes observed in their PUFA precursors. Furthermore, endocannabinoids and structurally related eCBome lipids can similarly be metabolized by these enzymes to their corresponding oxylipins (Simard et al. Reference Simard, Archambault and Lavoie2022). When sourced from omega-3 fatty acids, there is an increase in the production of anti-inflammatory oxylipins, while omega-6 fatty acids tend to promote the synthesis of pro-inflammatory oxylipins (Coras et al. Reference Coras, Pedersen and Narasimhan2021; Shearer and Walker Reference Shearer and Walker2018). Furthermore, the gut microbiome plays a crucial role in oxylipin synthesis. Specific microbial populations are known to similarly metabolize dietary fatty acids and are likely to influence the types and amounts of oxylipins produced (Ávila-Román et al. Reference Ávila-Román, Arreaza-Gil and Cortés-Espinar2021; Beccaccioli et al. Reference Beccaccioli, Pucci and Salustri2022; Niu and Keller Reference Niu and Keller2019). This interaction suggests that diet and microbiome composition may together modulate oxylipin profiles, impacting inflammatory pathways and overall health (Parchem et al. Reference Parchem, Letsiou and Petan2024; Xu et al. Reference Xu, Jurado-Fasoli and Ortiz-Alvarez2022).
Diet can modulate several aspects of gut health, including microbiota, composition, and intestinal permeability (Blavi et al. Reference Blavi, Solà-Oriol and Llonch2021), and may be a useful strategy to mitigate weaning stress in piglets (Wei et al. Reference Wei, Tsai and Howe2021). Weaned piglets commonly have an abrupt switch from digestible liquid milk to a solid corn–soybean-based diet. However, the digestive tract of weaned piglets is inefficient in metabolizing plant foods, and until the gut and microbiota composition are remodeled, feed efficiency and nutrient digestibility are low (Wei et al. Reference Wei, Tsai and Howe2021). On the other hand, the addition of milk fat globule membrane and bioactive components to formula for neonatal piglets showed modulation of the microbiota in the colon and feces, reduced the proportion of opportunistic pathogens, and increased the final body weight of piglets by 8% compared to a commercial formula (Berding et al. Reference Berding, Wang and Monaco2016).
The milk fat membrane contains polar lipids, such as glycerophospholipids and sphingolipids (SL), composed of sphingomyelin. These lipids are key components of cellular membranes and contribute to immune signaling by modulating membrane organization and inflammatory receptor activity (Norris et al. Reference Norris, Porter and Jiang2017). They are also associated with antioxidant and neuroprotective effects (Kim et al. Reference Kim, Akbar and Kim2010) and may indirectly promote neonatal development (Zeisel et al. Reference Zeisel, Char and Sheard1986). Dietary sphingomyelin has been shown to attenuate LPS-induced macrophage activation and reduce pro-inflammatory cytokine production, suggesting a direct modulatory role in innate immune responses (Norris et al. Reference Norris, Porter and Jiang2017). For instance, phospholipid-dependent signaling, particularly involving phosphatidylserine, is known to regulate cell survival pathways and apoptotic cell clearance, processes that are tightly linked to immune resolution and inflammatory control (Kim et al. Reference Kim, Akbar and Kim2010). Furthermore, polar lipids can act as precursors or modulators of bioactive lipid mediators that participate in the regulation of intestinal inflammation and metabolic homeostasis (Dione et al. Reference Dione, Lacroix and Taschler2020; Manca et al. Reference Manca, Boubertakh and Leblanc2020; Suriano et al. Reference Suriano, Manca and Flamand2023).
However, little is known about how sphingomyelin modulates the microbiota in pigs in association with effects on the immune system and the eCBome, and whether these impacts differ from those produced by diet compositions commonly used in pig farming practice. This is of particular relevance given that the gut microbiome and eCBome interact, with one altering the composition of the other, which are relevant to adiposity levels and glucose regulation (Dione et al. Reference Dione, Lacroix and Taschler2020; Manca et al. Reference Manca, Boubertakh and Leblanc2020; Suriano et al. Reference Suriano, Manca and Flamand2023). This interaction highlights a microbiota–lipid mediator–immune axis potentially influenced by dietary polar lipids.
Although several studies have explored the physiological effects of dietary polar lipids in piglets, such as improvements in intestinal morphology, lipid absorption, immune modulation, and cognitive performance (Fil et al. Reference Fil, Fleming and Chichlowski2019; Kerr et al. Reference Kerr, Kellner and Shurson2015; Liu et al. Reference Liu, Radlowski and Conrad2014; Mudd et al. Reference Mudd, Alexander and Berding2016), to our knowledge, none have examined how these bioactive lipids influence the gut microbiota composition and the broader network of lipid mediators involved in inflammation and metabolic regulation.
We hypothesized that, first, the polar lipid-based diet (rich in sphingolipids) would have a different impact on the composition of the intestinal microbiota compared to a soy-based diet and, second, that changes in the composition of intestinal microbiota would be associated with the modulation of several types of lipids, including eCBome lipids and those related to inflammation and animal performance. Therefore, our objective was to evaluate the use of a dairy processing by-product rich in polar lipids on the microbiome and plasma lipid mediators of piglets during the weaning period.
Methods
Experimental design and treatments
All procedures were approved by the Animal Care Committee (2022-PO-440) of the Centre de Recherche en Sciences Animales de Deschambault (CRSAD), following the regulations of the Canadian Council on Animal Care (1993).
Two hundred and forty weaned male piglets, 21 days of age, from a single genetic line (25% Landrace, 25% Yorkshire, and 50% Duroc), were blocked by initial weight (6.3 ± 0.5 kg) and distributed into 48 pens of 5 animals in a complete randomized block design with a 2 × 3 factorial arrangement. The experiment began on the weaning day, when the piglets arrived at the nursery unit. From day 0 to 21, the animals received: (1) Soy diet (SD): feed containing soy lipids where sphingomyelin (SM), phosphatidylcholine (PC), and triglyceride (TG) were 0.40, 18, and 44% of total lipids, respectively (24 pens) or (2) Polar diet (PD): diet containing lipids from cow’s milk fat globules where SM, PC, and TG were 13, 27, and 44% of total lipids, respectively (24 pens). Within each diet group from day 0 to 7, animals received 1 of 3 milk replacers (MRs): (1) Control milk substitute (CO): commercial product composed of animal fat lipids and coconut oil where SM, PC, and TG were 11, 27, and 50% of total lipids, respectively (16 pens); (2) Milk substitute rich in polar lipids (PO): product composed of 25% of polar lipids derived from cow’s milk fat globules (ISO Chill 6000, Agropur) where SM, PC, and TG were 21, 36, and 22% of total lipids, respectively (16 pens); or (3) Milk substitute composed of vegetable lipids (SO): soy-based product where SM, PC, and TG were 0.2, 0.8, and 75% of total lipids, respectively (16 pens). A two-phase program was offered. In the first phase, diet treatments were applied from day 0 to 21. While in the second feeding phase, from day 21 to 42, all piglets received a common commercial pelleted feed. In both phases, all feed and water were provided ad libitum.
The experimental diets were formulated to provide equal levels of digestible amino acids and metabolizable energy across treatments, ensuring that any observed effects could be attributed to lipid sources rather than to nutrient imbalances. The MRs contained, on average, 27% crude protein (CP) and 15% total fatty acids (FA). For the solid portion of the diet, the SD formulation contained approximately 21% CP and 7.6% total FA, whereas the PD diet provided 19.4% CP and 6.3% total FA. These nutrient levels were designed to remain comparable across treatments, maintaining isonitrogenous and isoenergetic conditions between groups. A complete description of the ingredient composition, nutrient levels (including digestible amino acids and minerals), FA profile, and the full characterization of lipid classes can be found in Larsen et al. (Reference Larsen, Chakroun and Létourneau-Montminy2024).
Microbiome analysis
Feces were collected from three piglets from each pen on days 7, 14, 21, and 42. Samples were pooled per pen (n = 192 samples) and stored at −80°C until processing. All analyses were carried out at “Institut Universitaire de Cardiologie et Pneumologie de Québec” (IUCPQ, QC, Canada). Consistent with the standard microbiome experimental design in swine research (Holman and Chénier Reference Holman and Chénier2014; Kim et al. Reference Kim, Borewicz and White2011; Krause et al. Reference Krause, Bhandari and House2010), our study used the pen as the experimental unit since the treatment was applied at the pen level, and pigs within a pen share a common microbiota environment. Thus, homogeneity in microbiota composition is smaller within pen than between pens. Pooled fecal samples from multiple pigs (i.e., three piglets) per pen are expected to accurately represent the pen-level microbial composition; thus, pen was used as the independent replicate in the mixed models.
DNA was extracted using the QIAmp Power Fecal DNA kit (Qiagen, Hilden, Germany) according to the manufacturer’s instructions. DNA concentrations of the extracts were measured by Kit (Thermo Fisher Scientific, MA, USA). The samples were stored at −80°C until 16S rDNA library preparation, according to the Illumina 16S ribosomal RNA gene V3–V4 region amplicon preparation protocol for the Illumina MiSeq System.
In summary, 12.5 ng of DNA was used as template, and the V3–V4 region of the 16S rRNA gene was amplified by polymerase chain reaction (PCR; Forward Primer = 5’ TCGTCGGCAGCGTCAGATGTGTATAAGAGACAGCCTACGGGNGGCWGCAG. Reverse Primer = 5’ GTCTCGTGGGCTCGGAGATGTGTATAAGAGACAGGACTACHVGGGTATCTAATCC) in conjunction with the Nextera XT Index Kit V2 sets A and D (Illumina, CA, USA). The 16S metagenomic libraries were qualified with a Bioanalyser DNA 1000 Chip (Agilent, CA, USA) to verify the amplicon size (expected size ∼630 bp) and quantified with a Qubit (Thermo Fisher Scientific, MA, USA). Libraries were then normalized and pooled to 4 nM and denatured and diluted to a final concentration of 8 pM. Sequencing was performed using the MiSeq Reagent Kit V3 (600 cycles) on an Illumina MiSeq System (Illumina, CA, USA). Sequencing reads were generated in less than 65 h. Image analysis and base calling were carried out directly on the MiSeq.
Sequencing data were processed using the Divisive Amplicon Denoising Algorithm (DADA2) pipeline (Callahan et al. Reference Callahan, McMurdie and Rosen2016), and taxonomic assignation was done against the Silva v138 reference database. The operational taxonomic units that were present in fewer than three samples were filtered out.
Data analyses were performed in the web-based platform Microbiome Analyst 2.0 (Lu et al. Reference Lu, Zhou and Ewald2023). Data integrity and library size were checked. The data were filtered by excluding features present in less than 10% of the samples and by removing features with zero variance across the interquartile range. Normalization was performed by rarefaction to 4600 reads and then by total sum scaling and centered log ratio transformation. Univariate analysis, metagenome sequence, and linear discriminant analysis (LDA) effect size (LEfSe) were performed using the Kruskal–Wallis rank-sum test. Beta-diversity analysis was performed using the Bray–Curtis index of dissimilarity, followed by permutational MANOVA and Analysis of group similarities (ANOSIM), and the ordination method was followed by the principal coordinates analysis (PCoA). Alpha diversity measures were used to determine treatment effects on bacterial richness and evenness (i.e., Shannon, Simpson, and Chao1 indexes) followed by Welch’s t-test/ANOVA. Significance was declared at false discovery rate (FDR) <0.05. For visualization purposes, heat map clustering (Euclidean distance and the Ward clustering method), pie charts, and relative abundance bar plots were generated.
Analysis of plasma endocannabinoids and other lipid mediators
Blood samples were collected from three piglets from each pen on days 7, 14, and 21 for the quantification of endocannabinoid mediators in the plasma (n = 144 samples). Plasma lipids were extracted according to Turcotte et al. (Reference Turcotte, Archambault and Dumais2020) with some modifications. Briefly, 200 μL of plasma samples were mixed with 300 μL of TRIS-HCl (pH 7.4, 50 mM). Toluene (2 mL) containing 11.5 µL/mL acetic acid and 5 µL of internal standards was then added to the samples, vortexed for 1 min, centrifuged at 4000 g for 5 min with no brakes (2) at 4ºC. Samples were then placed in an ethanol-dry-ice bath (−80°C) to freeze the aqueous phase, and the toluene upper phase was collected and evaporated to dryness under a stream of nitrogen. Samples were reconstituted in 60 µL of mobile phase containing 50% of solvent A (water + 1 mM ammonium acetate + 0.05% acetic acid) and 50% of solvent B (acetonitrile/water; 95/5; v/v; +1 mM ammonium acetate + 0.05% acetic acid). A 40 μL aliquot was injected onto an RP-HPLC column (Kinetex C8, 150 × 2.1 mm, 2.6 μm, Phenomenex). Quantification of eCBome-related mediators was carried out by liquid chromatography interfaced with the electrospray source of a Shimadzu 8050 triple quadrupole mass spectrometer and using multiple reactions monitoring in positive ion mode for the compounds and their deuterated homologs or a surrogate.
Quantification was achieved by generating calibration curves using pure standards and analyzed on the LC-MS/MS system three times. The slope was then calculated using the ratio between the peak areas of the compound and its standard (1-AG-d5 for MAGs and AEA-d4 for anandamide).
The data were analyzed using the web-based platform MetaboAnalyst 5.0 (Pang et al. Reference Pang, Chong and Zhou2021). Non-filtered data were normalized by the sum method, generalized log-transformed, and Pareto-scaled. Multivariate analysis of data included partial least squares discriminant analysis (PLS-DA) using the Kruskal–Wallis rank-sum test. Significance was declared at FDR < 0.05. For visualization purposes, heat maps were generated to showcase the magnitude of fold-change in a color gradient for increased (red) or decreased (blue) relative abundance.
Other statistical analyses
Microbiome and endocannabinoid mediators’ data that were found to be significantly affected by treatments were then analyzed in a mixed model in SAS 9.4 (SAS Institute, 2017), including pen as a random effect and MR, diet, time, and the interactions as fixed effects. Significant differences were considered when P < 0.05 for main effects and P < 0.10 for interactions.
Results
Diet and MR effects on taxonomy assignment
At the phylum level, the relative abundance of Firmicutes (53.8%) was the highest, followed by Bacteroidota (38.4%) and Spirochaetota (2.5%) across all days and in groups. However, when observing the days individually (Fig. 1A), there was variation between the phyla. Bacteroidota represented 45.6 and 46.6% of the total phyla, followed by Firmicutes with 45.5 and 46.3% on days 7 and 14, respectively. While on days 21 and 42, Firmicutes were more abundant, representing 64.3 and 57.6% of the total phyla, respectively.
Relative abundance of microbiota by (A) Phylum and (B) Genus by time in piglets in the nursery phase. Treatments were: (1) Milk Replacer: a commercial milk substitute rich in animal fat lipids and coconut oil (CO); a milk substitute rich in polar lipids (PO) or milk substitute rich in soy lipids (SO) from day 0 to 7 of the nursery phase; (2) Diet: solid diet rich in soy lipids (SD) or a diet rich in polar lipids from cow milk fat globular membranes (PD) from day 0 to 21. From day 21 to 42 all piglets received a commercial diet.

Figure 1 Long description
The x-axis is labeled with days 0, 7, 14, 21 and 42, while the y-axis represents relative abundance. Different colors represent various phyla, including Firmicutes, Bacteroidota and others. A smaller bar graph to the right shows the percentage distribution of phyla across different days. The image B shows a stacked bar graph illustrating the relative abundance of microbiota by genus over time in piglets during the nursery phase. The x-axis is labeled with days 0, 7, 14, 21 and 42 and the y-axis represents relative abundance. Various genera are represented by different colors, with labels provided below the graph. A smaller graph above shows the genus distribution across different days, with the x-axis labeled as Bray-Curtis distance.
A mixed-effects model analysis detected a three-way interaction between diet, MR, and time on the relative abundance of the Proteobacteria phylum (P = 0.03; Supplemental Table 1), whereas a tendency was observed for Bacteroidota (P = 0.09). Furthermore, there was a diet effect for Desulfobacterota, whose relative abundance was higher in the PD relative to SD dietary group (P < 0.05), whereas a similar tendency was observed for Actinobacteriota (P = 0.05).
Most phyla were significantly affected by time, with Actinobacteriota, Bacteroidota, Desulfobacterota, Proteobacteria, Spirochaetota, and WPS-2 presenting a reduction over the dietary treatment period (P < 0.01), whereas Campilobacterota, Cyanobacteria, Euryarchaeota, Firmicutes, and Verrucomicrobiota increased over that period (P < 0.05).
Prevotella, which belongs to the phylum Bacteroidota, was the genus with the highest relative abundance, representing 20.7% of the total of genera across treatments (Fig. 1B). The next most abundant genera were Lactobacillus (10.4%) and Agathobacter (7.4%), both belonging to the Firmicutes phylum, whereas 14.5% were classified as Not_Assigned.
A mixed-effects model analysis detected a three-way interaction between diet, MR, and time on the relative abundance of the genera Incertae_Sedis, Prevotella, Prevotellaceae_NK3B31_group, and Succinivibrio (P < 0.05), whereas a tendency was observed for Intestinimonas, Lachnospiraceae_NC2004_group, Lachnospiraceae_UCG_004, Prevotellaceae_UCG_003, and UCG_005 (P < 0.10; Supplemental Table 2). A two-way interaction between time and diet was detected for the relative abundance of the genera Alloprevotella, Anaerovibrio, Asteroleplasma, Campylobacter, Catenisphaera, Christensenellaceae_R_7_group, Desulfovibrio, Escherichia_Shigella, Horsej_a03, Lachnospiraceae_NK3A20_group, Lachnospiraceae_NK4B4_group, Lachnospiraceae_XPB1014_group, Megasphaera, Not_Assigned, Oribacterium, Oscillospira, possible_genus_Sk018, Prevotellaceae_UCG_004, Solobacterium, UCG_008 (P < 0.05). Whereas a tendency was observed for Butyricicoccus, Candidatus_Soleaferrea, Family_XIII_AD3011_group, Lachnoclostridium, and Parabacteroides (P < 0.10). An interaction between time and MR was detected only for the relative abundance of Fusicatenibacter (P = 0.02), whereas a tendency was observed for Alloprevotella, Clostridium_sensu_stricto_6, Phascolarctobacterium, and UCG_008 (P < 0.10). While an interaction between MR and diet was detected only on the relative abundance of the Agathobacter, Not_Assigned (P < 0.05), and a tendency to Faecalibacterium (P = 0.07).
Most genera were significantly affected by time, with Agathobacter, Anaerovibrio, Bacteroides, CAG_873, Candidatus_Soleaferrea, Catenisphaera, Chlamydia, Christensenellaceae_R_7_group, Colidextribacter, Desulfovibrio, Escherichia_Shigella, Family_XIII_AD3011_group, Frisingicoccus, Mailhella, Monoglobus, Not_Assigned, Parabacteroides, Prevotellaceae_UCG_001, Prevotellaceae_UCG_004, Rikenellaceae_RC9_gut_group, Treponema, Turicibacter, and UCG_002 being reduced over the treatment period (P < 0.01). Whereas Acidaminococcus, Asteroleplasma, Blautia, Butyricicoccus, Campylobacter, Catenibacterium, Clostridium_sensu_stricto_6, Dorea, Faecalibacterium, Family_XIII_UCG_001, Fusicatenibacter, Incertae_Sedis, Intestinibacter, Intestinimonas, Lachnospira, Lachnospiraceae_ND3007_group, Lachnospiraceae_NK3A20_group, Lachnospiraceae_NK4B4_group, Lachnospiraceae_UCG_004, Lactobacillus, Methanosphaera, Mitsuokella, Olsenella, Pseudobutyrivibrio, Ruminococcus, Shuttleworthia, Solobacterium, Subdoligranulum, Sutterella, and Terrisporobacter increased over that period (P < 0.05). The genera Alloprevotella¸ Anaerostipes, Clostridium_sensu_stricto_1¸ Collinsella, Coprococcus, Denitrobacterium, Fournierella, Holdemanella, Horsej_a03, Lachnoclostridium, Lachnospiraceae_NC2004_group, Lachnospiraceae_NK4A136_group, Lachnospiraceae_UCG_001, Lachnospiraceae_XPB1014_group, Marvinbryantia, Megasphaera, NK4A214_group, Oribacterium, Oscillibacter, Oscillospira, Peptococcus, Phascolarctobacterium, possible_genus_Sk018, Prevotella, Prevotellaceae_NK3B31_group, Prevotellaceae_UCG_003, Selenomonas, Sphaerochaeta, Succinivibrio, UCG_003, UCG_004, UCG_005, and UCG_008 varied over time (P < 0.05). The genera Coprococcus¸ NK4A214_group, Phascolarctobacterium, and Roseburia were higher in the PD diet (P < 0.05), while Olsenella, Peptococcus, and Rikenellaceae_RC9_gut_group had a similar tendency (P < 0.10). There was no impact of MR type on the relative abundance of any genus.
The LEfSe showed a diet effect on the Desulfobacterota and Spirochaetota phyla, both of which were higher in the PD group (Fig. 2A). Also, 12 genera were identified as characterizing PD and SD. Rikenellaceae_RC9_gut_group, Lachnospiraceae_NK4A136_group, Roseburia, Desulfovibrio, Oscillospiraceae_NK4A214_group, Lachnospiraceae_NC2004_group, and Lachnospiraceae_FCS020_group were higher in PD diet with LDA score > 2. While Shuttleworthia, Lachnospiraceae_UCG_004, Lachnospiraceae_UCG_001, Anaerovibrio, and UCG_008 were higher in SD treatment with LDA score <−2 (Fig. 2B). No significant features were identified for MR at the phylum, genus, or Amplicon Sequence Variant (ASV) level.
Linear discriminant analysis effect size (LEfSe) at the (A) Phylum and (B) Genus levels during the treatment period of nursery phase (average of days 7, 14, 21, and 42) in piglets fed a diet rich in soy lipids (SD) or a diet rich in polar lipids from cow milk fat globular membranes (PD).
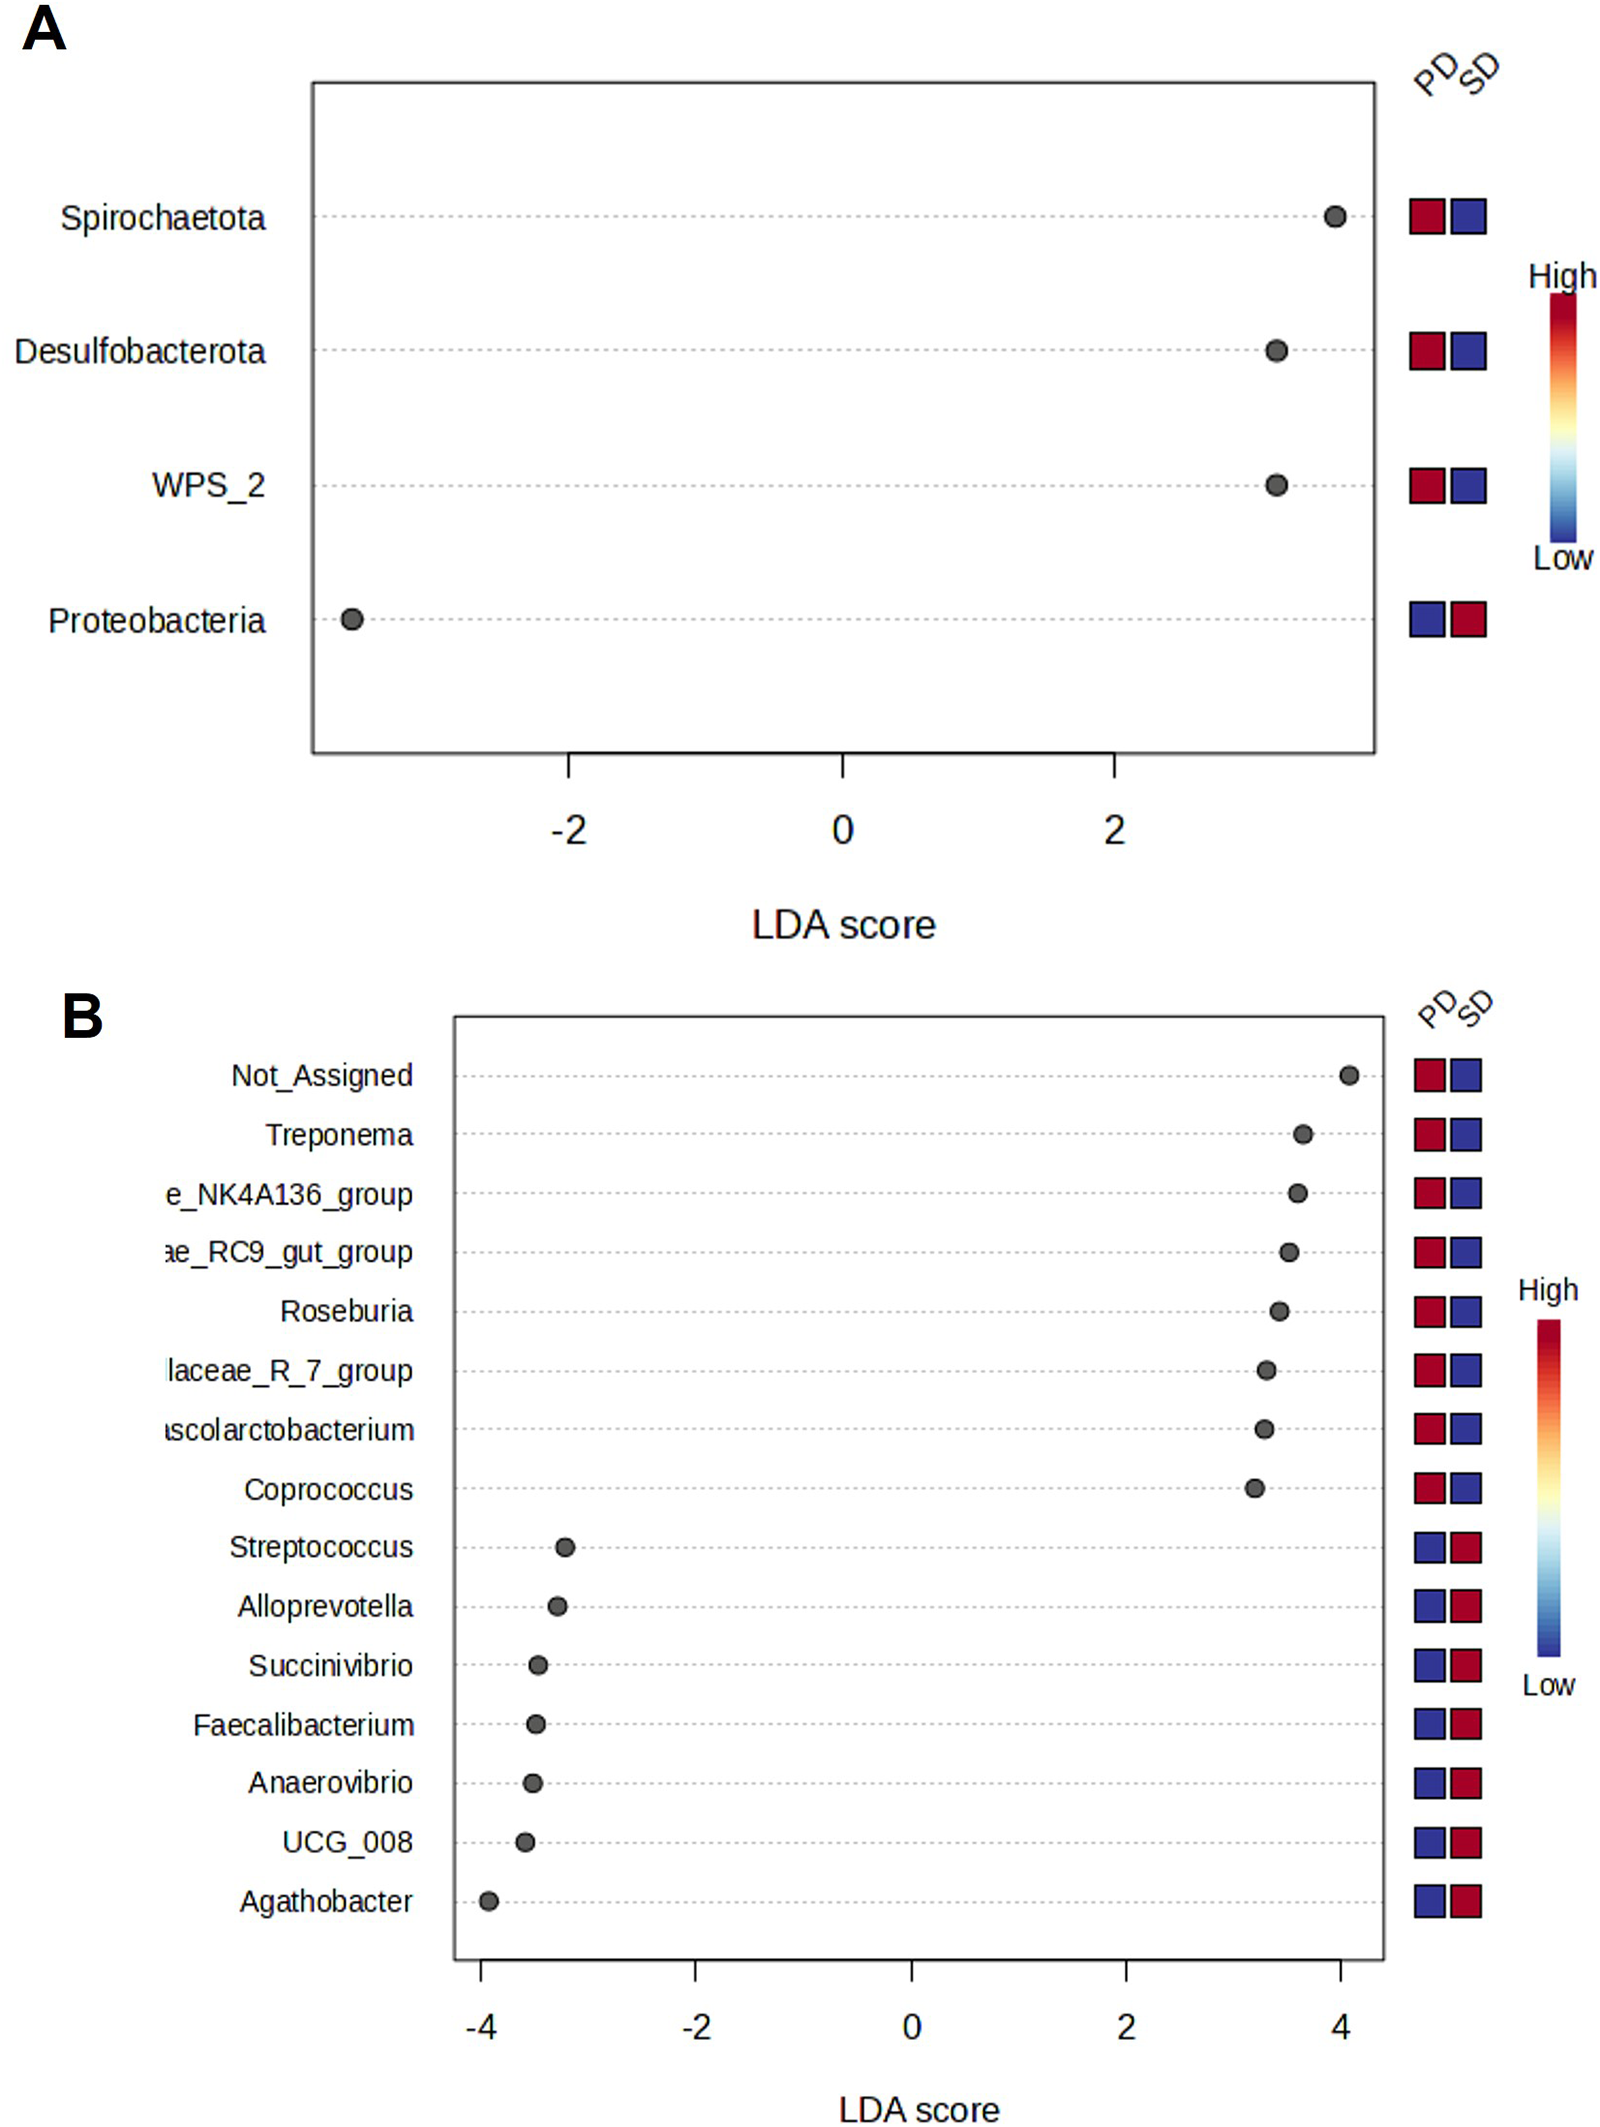
Figure 2 Long description
The image A shows a graph with the x-axis labeled 'LDA score' ranging from negative 2 to positive 2. Four phyla are listed: Spirochaetota, Desulfobacterota, WPS underscore 2 and Proteobacteria. Each phylum has a corresponding bar indicating high or low levels in the PD and SD groups. The image B shows a graph with the x-axis labeled 'LDA score' ranging from negative 4 to positive 4. Twelve genera are listed: Not underscore Assigned, Treponema, e underscore NK4A136 underscore group, 3e underscore RC9 underscore gut underscore group, Roseburia, laceae underscore R underscore 7 underscore group, Oscillibacterium, Coprococcus, Streptococcus, Alloprevotella, Succinivibrio, Faecalibacterium, Anaerovibrio, UCG underscore 008 and Agathobacter. Each genus has a corresponding bar indicating high or low levels in the PD and SD groups.
Beta diversity
Likewise, the assessment of beta diversity by treatments demonstrated grouping by time at the feature-level, showing a clear progression of the development of the overall microbiome architecture over time (Fig. 3). When analyzing sampling days individually, taxonomical distances were evident between the SD and PD dietary treatments on days 7 (P = 0.001), 14 (P = 0.001), and 21 (P = 0.001; Fig. 3C, 3E, and 3G, respectively).
Principal coordinates analysis for Beta-diversity at the feature-level by Time (A) and by Milk Replacer (MR) and Diet from day 7 to 42 (B–I). Treatments were: (1) MR: commercial milk substitute rich in animal fat and coconut oil (CO); milk substitute rich in polar lipids (PO) or milk substitute rich in soy lipids (SO) from day 0 to 7 of the nursery phase; (2) Diet: solid feed containing soy lipids (SD) or lipids from cow milk fat globular membranes (PD) from day 0 to 21. From day 21 to 42 all piglets received a commercial diet.

Figure 3 Long description
The P-value is 0.24. The image B shows a plot for day 7 with milk replacer treatments: CO, PO and SO, with a P-value of 0.24. The image C shows a plot for day 7 with diet treatments: PD and SD, with a P-value of 0.001. The image D shows a plot for day 14 with milk replacer treatments: CO, PO and SO, with a P-value of 0.33. The image E shows a plot for day 14 with diet treatments: PD and SD, with a P-value of 0.001. The image F shows a plot for day 21 with milk replacer treatments: CO, PO and SO, with a P-value of 0.88. The image G shows a plot for day 21 with diet treatments: PD and SD, with a P-value of 0.001. The image H shows a plot for day 42 with milk replacer treatments: CO, PO and SO, with a P-value of 0.98. The image I shows a plot for day 42 with diet treatments: PD and SD, with a P-value of 0.001. Each graph displays ellipses representing different treatments and their grouping over time.
Alpha diversity
A mixed model analysis showed an effect of time (P < 0.01) on alpha diversity at the resource level, whether evaluated by Chao1, Shannon, or Simpson indexes (Fig. 4; Supplemental Table 3). In addition, a tendency for a diet × time interaction for Chao-1, differences on d21 were explored, showing greater diversity in PD relative to SD irrespective MR type (P = 0.05). No differences were observed between groups according to MR type.
Alpha diversity at the feature level by time analyzed by the (A) Chao1, (B) Shannon, and (C) Simpson indexes. Treatments were: (1) Milk Replacer: a commercial milk substitute rich in animal fat lipids and coconut oil (CO); a milk substitute rich in polar lipids (PO) or milk substitute rich in soy lipids (SO) from day 0 to 7 of the nursery phase; (2) Diet: solid diet rich in soy lipids (SD) or a diet rich in polar lipids from cow milk fat globular membranes (PD) from day 7 to 21. From day 21 to 42 all piglets received a commercial diet. Different letters indicate statistical difference (P < 0.05) between diets on the same day of analysis.

Figure 4 Long description
The image A shows a bar graph illustrating alpha diversity over time using the Chao1 index. The x-axis is labeled 'Time, d' with values 7, 14, 21 and 42. The y-axis shows numerical values ranging from 0 to 400. Bars represent different diets and milk replacers: CO, PO, SO for PD and SD. P-values for MR, Diet, Time, MR times Time, Diet times Time and MR times Diet times Time are listed. The image B shows a bar graph using the Shannon index. The x-axis is labeled 'Time, d' with values 7, 14, 21 and 42. The y-axis ranges from 4 to 5.5. Bars represent CO, PO, SO for PD and SD. P-values for MR, Diet, Time, MR times Time, Diet times Time and MR times Diet times Time are listed. The image C shows a bar graph using the Simpson index. The x-axis is labeled 'Time, d' with values 7, 14, 21 and 42. The y-axis ranges from 0.96 to 1. Bars represent CO, PO, SO for PD and SD. P-values for MR, Diet, Time, MR times Time, Diet times Time and MR times Diet times Time are listed.
Endocannabinoids and other lipid mediators
No significant effects of MR type interactions involving MR were detected; therefore, results focus on diet, time, and diet × time effects (Supplemental Table 4). Plasma concentrations of lipid mediators were evaluated across diets (PD: polar lipid-rich vs. SD: soybean lipid-rich) and time points (days 7, 14, and 21). Overall, time exerted a strong influence on most compounds, with concentrations generally declining as pigs matured. Several mediators also exhibited significant diet effects or diet × time interactions, indicating that the impact of dietary lipid source varied across the experimental period (Supplemental Table 4).
Among the prostaglandins, PGE₂ exhibited a pronounced time effect (P < 0.0001), with concentrations peaking on day 14 in both diets and being lower in PD relative to SD on day 21 (P < 0.05; Supplemental Table 4). Similarly, thromboxane TBX₂ declined steadily from day 7 to 21 (Time P < 0.001) and was lower in PD relative to SD on day 21 (P < 0.05). 12(S)-HHTrE, a metabolite of AA in the cyclooxygenase pathway, was not affected by time or treatment.
Ethanolamide profiles revealed distinct diet-related trends (Supplemental Table 4). Linoleoyl ethanolamide (LEA) displayed a highly significant diet effect (P < 0.0001) and a diet × time interaction (P = 0.001), with SD consistently yielding higher concentrations than PD across all time points. Palmitoyl ethanolamide (PEA) concentrations decreased over time a strong time effect (P < 0.0001), showed a diet effect (P = 0.007) where PD was higher overall. Oleoyl ethanolamide (OEA) and arachidonoyl ethanolamide (AEA) were influenced primarily by time (P < 0.0001), with no significant diet effect; both declining steadily from day 7 to 21. Stearoyl ethanolamide (SEA) also decreased over time (P < 0.0001), and exhibited a modest diet effect (P = 0.03), with PD exceeding SD on day 14 (P < 0.05); while docosahexaenoyl ethanolamide (DHEA) showed both diet (P = 0.004) and time effects (P = 0.01), remaining consistently higher in SD. Lastly, docosapentaenoyl ethanolamide (DPEA) (n-3) showed decreased over time but did not differ by treatment, whereas DPEA (n-6) was higher in PD relative to SD only on day 21 (diet × time P < 0.01).
Monoacylglycerols were inconsistently affected by time and diet (Supplemental Table 4). 1/2-LG and 1/2-OG increased over time with SD being higher at later stages (diet × time P < 0.05), while 1/2-DHG was higher overall in SD relative to PD (diet P = 0.001), particularly on day 21 (P < 0.05). 1/2-AG and 1/2-DPG, 1/2-PG, and 1/2 EPG were not affected by dietary treatment.
PUFAs exhibited diet and time dependencies (Supplemental Table 4). Omega-3 fatty acids such as stearidonic acid (SDA), eicosapentaenoic acid (EPA), and docosahexaenoic acid (DHA) exhibited significant diet × time interactions (P < 0.05), with SD diet producing substantially higher concentrations at later time points. Docosapentaenoic acid (DPA) (n-3) concentrations decreased over time (P < 0.0001) and were overall higher in SD (diet P = 0.01). Downstream lipid mediators 18-hydroxyeicosapentaenoic acid E-series (HEPE) (from EPA) and 4-hydroxydocosahexaenoic acid (HDHA) (from DHA) also showed a diet × time interaction (P < 0.05), being higher in SD on day 21 (P < 0.05). In contrast, 14-HDHA + 7-HDHA and 17-HDPA (DHA- and EPA-derived, respectively) decreased over time (P < 0.05) but were not different between treatments. Specialized pro-resolving mediators were detected at low levels. RvE1 showed no consistent diet effect, but decreased over time (P < 0.0001), while Maresin 1 was not affected by time or treatment.
A diet × time interaction was observed for LA, which increased over time and was consistently higher in the SD group (P < 0.05). Linoleic acid-derived oxylipins, including 13-HODE, 9-HODE, 13-KODE, and the conjugates 13-HODE-G and 13-HODE-EA showed highly significant diet and diet × time effects (P < 0.0001). These compounds were consistently higher in SD-fed pigs, and differences widened over time (Supplemental Table 4). ALA-derived 13(s)-HOTrE also exhibited a diet × time interaction (P < 0.01), increasing pronouncedly over time and being higher in SD relative to PD at all timepoints (P < 0.05).
Dihomo-γ-linoleic acid (DGLA) and 12-HETrE (DGLA-derived) displayed diet × time interactions (P = 0.01; Supplemental Table 4), followed a similar trend, with SD concentrations surpassing PD on day 21 (P < 0.05), whereas 15-HETrE, also DGLA-derived, was overall higher in PD. AA was influenced only by time (P < 0.0001), showing no overall diet effect, except for an increase in SD on day 21 (P < 0.05). Similarly, AA-derived oxylipins, such as 15-HETE, 15-KETE, 12-HETE, 11-HETE, 5-HETE, and 5(S),15(S)-DiHETE also exhibited diet × time interactions (all P < 0.05), generally increasing over time and being higher in SD (P < 0.05).
PLS-DA plots of the plasma endocannabinoidome and other lipid mediators revealed unique features predictive of CO, PO, and SO MR treatments on days 7, 14, and 21, although no clear clustering was evident (Fig. 5). Similarly great variation in group discrimination was observe based on variable importance projection (VIP) scores (<1), as some group predictors shifted between groups over time. For instance, increased concentrations of 5-KETE, 5-KETE-G were predictive of the CO group on day 7, but predictive of the SO group on day 21. Similarly, higher 18-HEPE and 12-HETrE concentrations were predictive of PO on day 7, but predictive of SO on day 21. In contrast, higher 15-HETrE concentrations allowed for discrimination of the PO group consistently on 7, 14, and 21, whereas 12(S)-HHTrE was more variable, predicting PD on day 7 and SD on day 21. Lastly, RvE1 was a consistent predictor of the SO MR group on days 7 and 21.
Partial least squares discriminant analysis of endocannabinoids and lipid mediators concentrations in plasma on day 7, 14, and 21 of the nursery phase in piglets fed a commercial milk substitute rich in animal fat lipids and coconut oil (CO); a milk substitute rich in polar lipids (PO) or milk substitute rich in soy lipids (SO). (A) Two-dimensional partial least squares discriminant (PLS-DA) score plot. (B) Variable importance projection (VIP) scores analysis based on component 1 of the PLS-DA used to rank the relative contribution of lipids to the variance between treatments. Plasma endocannabinoids and lipids mediators data were obtained using a LC-MS/MS custom assay.

Figure 5 Long description
Each set includes a PLS-DA score plot and a VIP score graph. A shows a score plot with three color-coded groups (CO, PO, SO) on day 7, with axes labeled Component 1 and Component 2. B is a VIP score graph for day 7, listing lipid mediators like 4-HDHA and 12-HEPE, with VIP scores on the x-axis. C shows a score plot for day 14 with similar groupings. D is a VIP score graph for day 14, listing mediators like 12-DiHETE and 18-HEPE. E shows a score plot for day 21, again with three groups. F is a VIP score graph for day 21, listing mediators like 13(S)-HODE and 5-KETE. Each VIP graph includes a color-coded scale indicating high to low values.
The PLS-DA plots of plasma endocannabinoids and other lipid mediators revealed a clear clustering of PD and SD diet treatments on days 7, 14, and 21 of treatment (Fig. 6). The VIP scores analysis showed that similar to MR discriminant analysis results, higher 15-HETErE concentrations were predictive of the PD treatment across timepoints (VIP score > 1 on days 7,14, and 21), while 5(S),15(S)-DiHETE, 13-HODE-G, 13-KODE were predictive of the SD treatment in all time points. Higher SDA, 4-HDHA, and 1/2-DHG were predictive of the SD dietary group on days 14 and 21. Lastly, higher concentrations of the ethanolamides PEA, AEA, and SEA were predictive of the PD dietary group on day 21.
Partial least squares discriminant analysis and hierarchical grouping of endocannabinoids and lipid mediator concentrations in plasma on day 7, 14, and 21 of the nursery phase in piglets fed a diet rich in soy lipids (SD) or a diet rich in polar lipids from cow milk fat globular membranes (PD). (A) two-dimensional partial least squares discriminant (PLS-DA) score plot. (B) Variable importance projection (VIP) scores analysis based on component 1 of the PLS-DA used to rank the relative contribution of lipids to the variance between treatments. Plasma endocannabinoids and lipids mediator concentrations were obtained using a LC–MS/MS custom assay.

Figure 6 Long description
B shows VIP scores for day 7, listing lipids like 15-HETE and 16-POH. C shows a score plot for day 14 with distinct PD and SD clusters. D shows VIP scores for day 14, highlighting lipids such as 5(S),15(S)-DiHETE and SDA. E shows a score plot for day 21 with PD and SD clusters. F shows VIP scores for day 21, listing lipids like 5(S),15(S)-DiHETE and AEA. Each VIP score plot includes a color scale indicating low to high values.
Discussion
Stress due to separation from the sow, the new environment and the abrupt transition from liquid-to-solid diet during the weaning period causes changes in the intestinal structure of piglets (Moeser et al. Reference Moeser, Pohl and Rajput2017), dysbiosis in gut microbiota (Wei et al. Reference Wei, Tsai and Howe2021), and can trigger inflammation (Callahan et al. Reference Callahan, McMurdie and Rosen2016; Campbell et al. Reference Campbell, Crenshaw and Polo2013; Dione et al. Reference Dione, Lacroix and Taschler2020; Fil et al. Reference Fil, Fleming and Chichlowski2019; Holman and Chénier Reference Holman and Chénier2014; Kerr et al. Reference Kerr, Kellner and Shurson2015; Kim et al. Reference Kim, Akbar and Kim2010, Reference Kim, Borewicz and White2011; Krause et al. Reference Krause, Bhandari and House2010; Larsen et al. Reference Larsen, Chakroun and Létourneau-Montminy2024; Liu et al. Reference Liu, Radlowski and Conrad2014; Lu et al. Reference Lu, Zhou and Ewald2023; Manca et al. Reference Manca, Boubertakh and Leblanc2020; Mudd et al. Reference Mudd, Alexander and Berding2016; Norris et al. Reference Norris, Porter and Jiang2017; Pang et al. Reference Pang, Chong and Zhou2021; Suriano et al. Reference Suriano, Manca and Flamand2023; Turcotte et al. Reference Turcotte, Archambault and Dumais2020; Zeisel et al. Reference Zeisel, Char and Sheard1986). Contrary to common practice in farms, where only dry feed is offered at weaning, our model included MRs for 7 days after weaning, which may have facilitated adaptation to new feeds and intestinal maturation. Our observations are thus applicable to this type of context and may differ from those under higher levels of stress, where an abrupt transition from liquid-to-solid feed is performed.
The expectation was that animals that received polar lipids, either in the MR or in the diet – coming from a source of polar lipids from a modified by-product of cheese manufacturing rich in sphingolipids – would present lower levels of markers of immune activation and gut permeability (i.e., plasma lipopolysaccharide binding protein [LBP] and fecal calprotectin) (Bischoff et al. Reference Bischoff, Barbara and Buurman2014; Seethaler et al. Reference Seethaler, Basrai and Neyrinck2021). Importantly, immune responses are also mediated through a wide range of lipid species (i.e., oxylipids and endocannabinoids), which in turn are associated with intestinal microbiota composition (Muccioli et al. Reference Muccioli, Naslain and Bäckhed2010). Indeed, in the present experiment, we observed that of all the endocannabinoids, only EAE (anandamide) increased, and proinflammatory lipid mediators such as 13-HODE and 13-KODE were reduced by the supplementation of polar lipids in the diet. In addition, lower concentrations of plasma LBP and fecal calprotectin were predictive of polar lipids diet and MR in a PLS-DA analysis (Larsen et al. Reference Larsen, Chakroun and Létourneau-Montminy2024). Together, these data suggest that polar lipid supplementation results in a lower inflammation phenotype under the conditions of our study.
Our lipidomic data (Larsen et al. Reference Larsen, Chakroun and Létourneau-Montminy2024), including diverse lipid classes, such as sphingolipids, phospholipids and cholesterol esters, demonstrated that the lipid profile of dietary treatments (PD and SD) had a great influence on the plasma lipid composition of piglets at 7 days post-weaning, whereas no major changes were observed in response lipids contained in the MR treatments (CO, PO, and SO). As specific lipid types present in the diet can influence the composition of the microbiota, and this is related to inflammatory processes in the gastrointestinal tract (Schoeler and Caesar Reference Schoeler and Caesar2019), we aimed in the present study to investigate changes in the composition of the microbiota and lipid mediators. To our knowledge, our study is the first to evaluate the influence of dietary polar lipids on both plasma lipid mediators and intestinal microbiota composition of weaned piglets. Of note, other variables that may relate to treatment effects are reported elsewhere (Chakroun Reference Chakroun2024). Briefly, animal performance was negatively affected by the consumption of polar lipids, as evidenced by lower average daily gains and final body weight at the end of the nursery phase (Chakroun Reference Chakroun2024). This could partly be explained by lower feed intake from day 14 to 21, and/or the possibility of lower diet digestibility; however, the latter was not investigated in the present study. Importantly, no signs of nutrient absorption or intestinal issues were observed, as fecal scores remained normal. Indeed, fecal scores of all animals across treatments were in the normal range (i.e., all below 1 in a 4-point scale, with higher values indicating diarrhea) (Chakroun Reference Chakroun2024). Interestingly, the lowest values were consistently observed for the polar lipid-based relative to the plant-based treatments over the study period, suggesting that plant-based lipids reduce fecal consistency, albeit remaining within the normal range.
Firmicutes and Bacteriodota are the predominant phyla in the swine gut microbiota, followed by Proteobacteria, Actinobacteria, and Spirochaetota (Wei et al. Reference Wei, Tsai and Howe2021), which corroborates our findings. Although this predominance is generally stable, diet and age can influence the overall composition of the microbiota, in particular at lower levels of taxonomic classification. Our study demonstrated similar behavior at the phylum and genus level over time. Most of the genera that decreased their relative abundance belong to the phyla Actinobacteria, Bacteriodota, Proteobacteria, Spirochaetota, and these phyla also decreased their relative abundance over time, while most of the genera that increased over time belong to the phylum Firmicutes, which had the same effect. The genera that varied over time mainly belong to the phyla Bacteriodota and Firmicutes. Corroborating our findings, Norris et al. (Reference Norris, Jiang and Ryan2016) reported that sphingomyelin from dietary milk modulates fecal microbiota composition in mice, increasing Firmicutes and reducing the relative abundance of Bacteroidota. According to Rohrhofer et al. (Reference Rohrhofer, Zwirzitz and Selberherr2021), an increase in the concentration of dietary sphingolipids induces changes in intestinal microbiota composition, since Sphingosine and lyso-SLs have antimicrobial properties and compete with commensal bacteria for attachment to intestinal cells, preventing pathogen invasion. Although the main source of variation in plasma SL is expected to be dietary levels of these compounds, some SL are also synthesized by gut bacteria (Norris et al. Reference Norris, Porter and Jiang2017). Sphingolipids are produced by bacteria of the phylum Bacteroidota (Bacteroides, Prevotella, Porphyromonas, Sphingobacterium) and by Proteobacteria (Sphingomonas, Bdellovibrio, Acetobacter), depending on the abundance of these phyla in the gut microbiota (Olsen and Jantzen Reference Olsen and Jantzen2001).
Prevotella was the predominant genus, representing 20.7% of the total of genera among treatments on day 7 post-weaning, and its concentrations were dependent on diet, MR, and time interactions. Similarly, Wei et al. (Reference Wei, Tsai and Howe2021) found that the relative abundance of the genus Prevotella increased by 2-fold between the day of weaning to day 7 post-weaning after the introduction of solid plant-based diets. While Heinritz et al. (Reference Heinritz, Weiss and Eklund2016) found a higher prevalence of Prevotella when testing a high-fat/low-fiber diet (249 g fat/kg DM) based on lipids from sunflower margarine, sweet cream butter, and soybean oil, compared to a standard diet containing 30 g fat/kg DM in 3-month-old pigs. Other genera, such as Megasphaera and Blautia, which are involved in carbohydrate degradation, also increased during the post-weaning period in the study by Wei et al. (Reference Wei, Tsai and Howe2021). In our study, Blautia showed a significant increase in abundance until day 21 and decreased on day 42, but was not influenced by treatment, whereas Megasphaera abundance was higher in PD on days 7, 14, and 42, and lower on day 21, showing a time-dependent diet effect. In summary, diet had an impact on the diversity and composition of the microbiota, which for several taxa was time-dependent, probably reflecting progressive adaptation to dietary treatments.
Most of the genera that were found to be group-discriminant by the LEfSe analysis belonged to the Lachnospiraceae family, producers of short-chain fatty acids (SCFA) that consume carbohydrates and can have anti-inflammatory properties (Fusco et al. Reference Fusco, Lorenzo and Cintoni2023; Xu et al. Reference Xu, Bai and Cao2021). Our results suggest that this family is particularly sensitive to the types of dietary lipids and, therefore, its abundance and function can be altered by diet. The PD treatment exhibited an increase in Coprococcus, Roseburia (from Lachnospiraceae family), and Phascolarctobacterium (from the Acidaminococcaceae family; another producer of SCFA). In contrast, the genus Desulfovibrio, known to be associated with pro-inflammatory effects (Huang et al. Reference Huang, Zheng and Zhang2024; Singh et al. Reference Singh, Carroll-Portillo and Lin2023), was also predictive of PD group.
Discriminant analysis indicated that Butyricicoccaceae; UCG-008 and Anaerovibrio were predictive of the SD group. Interestingly, these taxa have been associated with inflammatory diseases in other studies (Ameer et al. Reference Ameer, Cheng and Saleem2023; Li et al. Reference Li, Ding and Zhu2022). As mentioned earlier, we have previously reported a higher concentration of proinflammatory markers in the SD group in this experiment (i.e., lipopolysaccharide-binding protein and calprotectin; Larsen et al. Reference Larsen, Chakroun and Létourneau-Montminy2024), leading us to consider that the observed alterations in the lipid-sensitive microbiota may have influenced susceptibility to inflammation. This may be further supported by the sustained elevation of LA-derived oxylipins (13-HODE, 13-HODE-G, 13-KODE), suggestive of a greater oxidative tone under SD. Of note, these types of changes in plasma lipid mediators were evaluated using a combination of univariate and multivariate analyses, allowing for evaluation of treatment effects as single variables of interest and as general patterns, which as shown by our results, were more consistent and predictable when evaluating diet compared to MR effects. MR discriminant features were inconsistently represented over time, perhaps as a reflection of the timing of MR administration, which occurred only until day 7. Importantly, the mixed model analysis showed no effect of MR on the concentrations of any analyzed lipid mediator, providing support to the notion that lipid type of each MR treatment had little influence overall.
Yang et al. (Reference Yang, Zhang and Tian2020) proposed that in addition to the impact of having diverse lipid types, fat digestibility also influenced microbiota composition of nursery piglets when comparing soybean oil, palm oil, and encapsulated palm oil as lipid sources. Our analysis revealed that, although at equal energy levels, the treatment lipid sources and their compositions differed (Larsen et al. Reference Larsen, Chakroun and Létourneau-Montminy2024). The solid PD contained 31-fold more total SL compared with the SD, whereas the PO contained 40-fold and 2-fold more total sphingolipids relative to the SO and the CO groups. From this, it was expected that the changes in the profile of plasma lipid mediators would be influenced by the dietary fatty acid profile, as suggested by Bourdeau-Julien et al. (Reference Bourdeau-Julien, Castonguay-Paradis and Rochefort2023). Interestingly, the PD mostly presented enrichment in lipid mediators whose precursors are dihomo-g-linolenic acid (DGLA, for 15-HETrE), arachidonic acid (AA, for AEA), and DPEA from the n-6 pathway (DPA n-6; for DPEA n-6). All these lipids can also be derived from linoleic acid (LA) (Simard et al. Reference Simard, Archambault and Lavoie2022); however, it only represented 23% of the total FA in the PD group, whereas it was two times higher in the SD group. This suggests that the PD group resulted in increased levels of these lipid mediators, likely by alterations in enzyme activity rather than direct precursor availability.
Furthermore, pigs in the PD treatment exhibited higher concentrations of the lipid mediators PEA and SEA, derived from palmitic and stearic acids, respectively (Hansen et al. Reference Hansen, Kleberg, Hassing, Di Marzo and Wang2015; Hesselink et al. Reference Hesselink, Kopsky and Witkamp2014). Importantly, reduced feed intake was observed in the PD group (Chakroun Reference Chakroun2024), which could be associated to the increased concentrations of PEA, a lipid mediator able to reduce food intake and inflammation via PPARA and TRPV1(Branković et al. Reference Branković, Gmizić and Dukić2024). Palmitic and stearic acids represented, respectively, 27 and 8% of total FA in the dietary composition of the PD diet. On the other hand, pigs in the SD group exhibited higher concentrations of lipid mediators whose precursors are LA (5,15-DiHETE, 1/2-LG, 13-HODE-G, 13-KODE, and 13-HODE) and alpha-linolenic acid (ALA for 13-HOTrE and SDA), the latter being 4.6 times higher in the SD compared to the PD diet.
Specialized pro-resolving mediators derived from EPA and DHA, such as Resolvin E1 and Maresin 1 (Ferreira et al. Reference Ferreira, Falcato and Bandarra2022), were not affected by treatment despite increased concentrations of DHA under the SD diet, which may suggest insufficient substrate or lack activation of those enzymatic pathways under the conditions of our experiment. The AA-derived endocannabinoid AEA, but not 2-AG, exhibited higher concentrations in the plasma of piglets fed the PD diet. Both lipids are endogenous ligands for the CB1 and CB2 receptors of the endocannabinoid (eCB) system (Veilleux et al. Reference Veilleux, Di Marzo and Silvestri2019). This suggests a potentially greater activation of this system in the PD compared with the SD dietary group. Importantly, the CB1 receptor can reduce intestinal permeability and plasma LPS (Cani et al. Reference Cani, Amar and Iglesias2007; Cuddihey et al. Reference Cuddihey, Cavin and Keenan2022). Furthermore, blocking the CB1 receptor influences the reduction of inflammation (Muccioli et al. Reference Muccioli, Naslain and Bäckhed2010). Importantly, lower concentrations of plasma LBP and fecal Calprotectin (i.e., markers of intestinal permeability or inflammation) were associated to polar lipids supplementation (Larsen et al. Reference Larsen, Chakroun and Létourneau-Montminy2024), which provides support to action of treatments through changes in microbiota and modulation of CB1 receptor, as previously mentioned. Indeed, given that the eCB system tone is associated with intestinal microbiota composition through the modulation of CB1 and FAAH expression (Rousseaux et al. Reference Rousseaux, Thuru and Gelot2007) and CB1 activity (Dione et al. Reference Dione, Lacroix and Taschler2020), we investigated the possible changes in microbiota related to eCB receptor ligands AEA and 2-AG in plasma. AEA is able to reverse adverse disturbances in the microbiota in mice with respiratory syndrome, increasing the abundance of beneficial SCFA-producing bacteria, restricting inflammation, and reducing Enterobacteriaceae – belonging to the phylum Proteobacteria – and pathogenic Pseudomonas in the lungs of mice receiving AEA treatment (Sultan et al. Reference Sultan, Wilson and Abdulla2021). The same authors also reported an increase in the relative abundance of Lachnospiraceae and Clostridia – family and class belonging to the phylum Firmicutes. In our study, the phyla Firmicutes and Proteobacteria were only affected by time and not by dietary treatments.
Conclusion
Providing polar lipids in the MR for the first 7 days had little impact on overall microbiota composition. In contrast, the inclusion of polar lipids in the diet until day 21 significantly altered microbiota composition, causing progressive shifts that favored specific genera from the Lachnospiraceae family (e.g., Coprococcus and Roseburia) and other Firmicutes-associated taxa, which are known for their potential anti-inflammatory properties. However, genera with some pro-inflammatory potential, such as Desulfovibrio, were also enriched in the polar lipid-based diet, while the soy-based diet was mostly predicted by taxa previously associated with inflammatory diseases (e.g., Butyricicoccaceae; UCG-008 and Anaerovibrio).
MR type did not consistently affect plasma lipid mediator concentrations, whereas diet type resulted in clear changes in mediator profiles. Dietary lipid source shaped oxylipin and ethanolamide networks during early development. The sustained elevation of LA-derived oxylipins (13-HODE, 13-HODE-G, 13-KODE) under SD suggests enhanced LA lipoxygenase activity and greater oxidative tone, consistent with roles in inflammatory signaling. In contrast, PD favored higher 15-HETrE, implicating arachidonic-derived epoxytriene pathways linked to anti-inflammatory actions. Increases in SDA, 4-HDHA, and 18-HEPE under the soy-based diet point to progressive activation of n-3 PUFA pathways and resolution-phase lipid mediators, whereas elevations of monoacylglycerol (1/2-DHG, 1/2-LG, 1/2-OG) indicate altered lipid signaling, which may impact energy metabolism. Ethanolamides (PEA, AEA, SEA) contributed to discrimination of the polar lipid diet after 3 weeks of feeding, suggesting coordinated endocannabinoid-like modulation that may not always manifest as large univariate mean differences. Future work should connect these biochemical signatures to functional outcomes (e.g., immune resilience, growth, and long-term health) and validate pathway-level mechanisms, including specific roles for 18-HEPE, 4-HDHA, 17-HDPA, and monoacylglycerols such as 1/2-DHG and 1/2-LG.
Although no immediate inflammatory responses were detected through conventional biomarkers, the observed microbiota and lipidomic shifts suggest a potential long-term impact on immune regulation and metabolism. Future studies should explore the effects of polar lipid supplementation under regular weaning conditions or models of active immune stimulation, as more pronounced stress models might better reveal the potential of these lipids in mitigating inflammation and improving piglet adaptation.
Supplementary material
The supplementary material for this article can be found at https://doi.org/10.1017/anr.2026.10041.
Acknowledgements
The authors express gratitude to Helene Lavallée, Jacinthe Julien, Vincent Demers-Caron, and the farm crew at the CRSAD for their dedication and support during the animal trial.
Author Contributions
The study was conceptualized by D.E.R. and J.E.R. Methodology and design were devised by D.E.R., J.E.R., M.-P.L.-M., V.D.D.M., N.F., C.S., and D.E.O. R.L., S.C., T.K., and O.W.A applied all research protocols at the research farm and laboratory. Data validation and analyses as well as writing of the original manuscript were performed by R.L., J.E.R., and D.E.R. All authors have read and agreed to the published version of the manuscript.
Funding Statement
This research was financially supported by the Innov’Action program (IA120628) from the Ministry of Agriculture and Fisheries of Quebec. Additional funding was provided by the CRSAD and the INAF (Institute of Nutrition and Functional Foods) at Université Laval.
Conflicts of Interest
The authors declare no conflict of interest.





 Open access

