
One aspect of globalism—a state of the world involving networks of interdependence at multi-continental distances—is what could be called “social globalism,” entailing long-distance transnational transmission of ideas, information, and images. Footnote 1 Social globalism implies discord, since it brings groups with different interests and values into contact with one another. Footnote 2 Contemporary social media enable individuals who identify with different groups to express their views in public in relatively safe ways. The result is a discordant set of discourses—contentious and not always deeply reflective, but revealing about values, perspectives, and emotions of large numbers of people who have politically relevant views and are ready to express them. We use the plural, “discourses,” because it is not clear that participants in social media are occupying a common public sphere, speaking to one another. There may be distinct discourses, with distinct populations, speaking to one another and only glancing at other communities, perhaps negatively.
Discourses on social media are typically focused on contemporary topics—often events that have just occurred—and therefore illuminate how people in this partially globalized world interpret phenomena that are inherently ambiguous. These discourses expand the public sphere by enabling ordinary people to comment, in real time and for a potentially global audience, on world events. They also provide opportunities for political scientists who are interested in new and interactive patterns of globalization to explore them directly, by monitoring them and seeking to analyze their content. Students of politics have been quick to observe these discourses, and to analyze them. Footnote 3
One theme of many of these discourses, especially in the contemporary Middle East, is anti-Americanism. Since World War II the United States has engaged in extensive military intervention in the Middle East—a region in which anti-American views have become predominant. Monitoring the Arabic-language social media provides a fascinating window into the cross-currents of opinion with respect to the United States in the Middle East, and therefore indicates how American policy and the policies of other countries generate animosity, ambivalence, and contentious discussion. We can learn a great deal about anti-Americanism, and more broadly about politics in an era of global social media, by analyzing these discourses.
Social scientists have sought to analyze whether anti-Americanism is principally political—hating America because of what it does, particularly its interventions—or principally social: hating America for what it is and what it represents. Footnote 4 Some of the best work on this subject, analyzing the 2004 Pew Global Attitudes Survey in detail, shows both that the Middle East stands out for its negative views of the United States and that even in the Middle East, anti-Americanism is differentiated by issue. Attitudes are most negative toward the diffusion of U.S. customs abroad, toward the war on terror, and toward the effects of American foreign policy on inequality between rich and poor countries. Attitudes toward U.S. political institutions and popular culture are somewhat negative but more balanced; views of U.S. science are quite positive. In general, what Giacomo Chiozza calls “sociocultural anti-Americanism” seems to be much less intense than political anti-Americanism. Footnote 5
We take advantage here of new technology to analyze the social media site, Twitter, in order to gain information that is not based on polls but on autonomous expressions of opinion by individuals about anti-Americanism in the Middle East. This technology enables us to observe responses to events on Twitter and to analyze the resulting discourses. In doing so, we generate multiple empirical observations about Arab attitudes, creating new information not only about anti-Americanism but also about how Arabic-speaking publics react to events and to other states in the region, notably Iran. Our analysis helps to resolve a major ambiguity in the existing literature on anti-Americanism: whether Middle Eastern animus toward the United States is directed toward the nature of its society—what the United States “is”—or toward the effects of its policies and social practices on other societies—what the United States “does.” Footnote 6 The Twitter discourse is highly political and focused on the impact of the United States abroad more than on criticisms of American society. The specter of U.S. intervention hangs over the Twitter discourse.
Our findings about the effects of the impingement of the United States, and American society, on Arab societies led us to ask whether Arab publics express similar resentments toward Iran. We find that Arabic Twitter participants strongly dislike Iranian policy and do not express positive views toward Iranian society—unlike their more ambivalent views of the United States. Our interpretation of this data is that what is often labeled “anti-Americanism” reflects, to a considerable extent, fear of alien intrusions and hegemonic influence, from whatever source, into one’s own society. It may well reflect a desire for political and social autonomy rather than dislike for America per se.
Participants on Twitter do not constitute a random sample of any identifiable population: we do not claim that our data reflect Arab attitudes in a perfectly representative sense. However, Twitter participants are not a tiny portion of the Arabic-speaking population; according to the Third Wave of the Arab Barometer, close to 40 percent of the Arab public is now online and of this population, 30 percent is on Twitter. According to a report by the Dubai School of Government, the number of active Twitter users in the Arab World reached 3.7 million in 2013, up from 2 million in 2012. Saudi Arabia records the highest number of active Twitter users at 1.9 million. Egypt (519,000) and the UAE (401,000) come in second and third. Footnote 7 In these countries Arabic is the preferred language of those who tweet, with 73.6 percent of all activity in Arabic. No systematic analysis has been done to establish the profile of Arabic Twitter users, but it seems clear that they are relatively young. Sometimes the Arab youth population has been portrayed as more cosmopolitan, more moderate, less religious, and more pro-democratic than the Arab population as a whole. Footnote 8 But careful analysis of the Arab Barometer Second Wave data (2011–2012) indicates that Arab youth are not necessarily more democratic than older cohorts and are actually slightly more supportive of political Islam. Footnote 9 Little evidence therefore exists to support the possible objection that our analyses of Twitter data are biased in a pro-democratic, moderate, or secular direction.
Twitter discourses are distinctive, and not necessarily representative of mass public attitudes, but they are increasingly important as a medium of expression and communication, particularly for citizens who are especially interested in politics. Arabic-language social media discourses affect participants’ expectations about how other Twitter participants will respond to their own posts. They are therefore likely to affect participants’ own expressions of views both through persuasion and socialization and by shaping their incentives with respect to their own contributions. Footnote 10 Hence, these discourses are politically important in their own right. Footnote 11 Insofar as public politics is migrating to the Worldwide Web, political scientists need to study social media.
Another major advantage of our focus on social media is that we can examine reactions to specific events. As we will show, these specific reactions are often more informative than aggregate findings, whether from polls or our own Twitter-based analysis, because they reflect interpretations of events as they unfold, thereby providing evidence of pre-existing attitudes, and because reactions to events are interactive, generating a social and political discourse. In situations characterized by ambiguity, people who are active on Twitter create a social reality, which may correspond more or less closely to what analysts later decide actually occurred. The technology that we employ therefore has wide implications for studying social and political discourses around the world, on a variety of topics. Its relevance is not limited to the Middle East or to the analysis of anti-Americanism. We hope that our analysis of anti-Americanism will help to stimulate creative and rigorous social media analysis in political science.
We first explain how we use social media analysis to analyze discourses about America and intervention, in the Middle East and pose our critical questions. Next we analyze general levels of anti-Americanism in the Middle East. We then move to our core contribution where we examine Twitter data following specific events. We first look at Arabic Twitter responses to actions or inactions by the United States that affected Arabs including the July 2013 coup against Mohamed Morsi’s government in Egypt and the Syrian civil war. We then turn to responses to the publicity, between September 1 and November 10, 2012, over Innocence of Muslims, a video that was widely viewed in the Arab and Muslim world and discussed on Twitter. Next, we shift to events where America was the target, either of human action (the Boston Marathon bombing of April 2013) or of nature (as in Hurricane Sandy, October 2012).
Reactions by the Arabic Twitter public to these events show that in terms of volume of traffic, political anti-Americanism is much stronger than social anti-Americanism. But a more important distinction is between attitudes toward American domestic politics and society, which reveal considerable ambivalence, and attitudes toward how the United States affects politics and society in Arab countries, which are intensely negative. Evidence of Arab hostility to Iran, which we then examine, provides crucial evidence that anti-Americanism is one aspect of a more generic phenomenon: publics in a variety of countries dislike the impingement of powerful countries on their societies.
Analyzing Social Media Discourses
Studying social media such as Twitter implies studying discourses—how people talk to one another electronically. Expressions of opinion on social media are not necessarily representative of the views of the publics of countries in which they originate, but they are views that individuals have decided—unprompted—to express. Furthermore, people who express these views have been able to see others’ views on Twitter and can therefore react to the changing social media universe as they perceive it. Data derived from monitoring Twitter traffic therefore enable us not only to answer questions similar to those posed by analysts relying on public opinion data, but also to answer questions about interactions among those people expressing opinions. Footnote 12 In carrying out this analysis we are able to learn about anti- Americanism in the Middle East on the basis of an analysis of Twitter feeds, without identifying individuals.
The existing literature on the Middle East is divided about the depth and nature of Arab animosity to the United States. One school of thought holds that levels of anti-Americanism are inherent to the culture and identity of Arabs and Muslims. Footnote 13 High levels of anti-Americanism are viewed as reactions to western and liberal values, which some in the region view as antithetical to Islamic precepts. In this vein, some studies show that levels of anti-Americanism increase when secular-religious tensions grow. Footnote 14 A different school of thought holds that levels of anti-Americanism reflect negative views of U.S. policies in the region rather than of the United States as a society. Footnote 15 Many of these scholars have shown that there is much admiration for basic American values and culture. Footnote 16
Looking at responses to events sheds light on these questions. We can investigate responses to American intervention or possible interventions in the Middle East; we can examine Arabic responses to social events where American society could be seen as critical of Arabic society; and we can look at responses to events where U.S. society itself is a target. We find that Arabic-language political discourses are permeated with anti-Americanism, particularly when issues of intervention arise; but views toward American society are more complex. The volume of social expression is much lower than that of political opinion. When Americans are the victims rather than the perpetrators of harmful actions there is some animus toward American society but this animus is not as intense as Arab hostility toward American policy abroad.
Research Design and Methodology
We use Arabic Twitter posts gathered and stored by Crimson Hexagon, a social media analytics company, employing a supervised text analysis model developed by Daniel Hopkins and Gary King. Footnote 17 Text analysis methods can be either “supervised” or “unsupervised.” Footnote 18 The difference lies in who (or what) determines the topics by which to classify texts. Using an unsupervised method, topics are not determined ex ante; rather, the statistical method itself helps determine them. Footnote 19 In contrast, using a supervised method, the researcher hand-codes a “training-set” of documents into pre-determined categories, and on the basis of these training documents the rest are classified by an algorithm. Footnote 20 In our study we seek to know the proportion of the population of tweets that fit in specific categories. The supervised ReadMe algorithm is highly suited to this calculation. Rather than estimating topic proportions based on the categorization of individual documents, ReadMe estimates these proportions using words within each text. Importantly, this means that ReadMe does not individually classify tweets. But we do get population-based estimates, which are the quantity of interest here, and we present both proportions and estimated volume, which is the product of the proportions and overall volume.
We gain access to these techniques and data through Crimson Hexagon, Footnote 21 a social media analytics company founded in 2007. Crimson Hexagon (CH) combines the text analysis method developed by Hopkins and King with a vast collection of social media data in an easy-to-use online platform. In particular, we use here, among other things, the universe of Arabic language Twitter data from 2012–2013.
The analysis proceeds as follows. First, the user determines the date range of interest and sources to draw upon, imposing language and geographical restrictions as desired. Footnote 22 After these basic parameters are set up, she determines a set of keywords on which to draw texts satisfying the other restrictions. CH offers the use of Boolean operators to create a complex set of keywords (or phrases) used to include or exclude texts. Footnote 23
After setting up the basic parameters and the keyword restrictions—forming what CH calls a “monitor”—the user is then ready to begin training. Because Crimson Hexagon uses essentially the Hopkins-King algorithm—a supervised text analysis method—a set of pre-defined categories and training texts is required. To aid with the supervised document classification process, CH feeds the user, one-by-one, tweets that match the setup restrictions. The user places each tweet into the appropriate category, continuing this process until she feels that the monitor has been sufficiently trained. Footnote 24
Once training is complete, the user runs the algorithm and accesses the analysis results. The main results consist of daily estimated frequency data for each of the categories. The user also has limited access to the raw tweets themselves, either through Crimson Hexagon’s “bulk export” function, which is limited to 10,000 tweets per day, or through example tweets, which it uses a proprietary classifier to select. They are the classifier’s “best guess” of good examples of each category. These are helpful for getting a rough sense at whether the training has picked up on what the analyst is interested in, and they were used in our monitor review process.
The greatest advantage of Crimson Hexagon is that, as a Twitter-certified product with access to the “Twitter fire hose,” it provides every public tweet ever posted on Twitter—in any language and from any location—that matches the user-determined restrictions; and its commercial customers demand a high level of filtering out of spam and bots that could otherwise contaminate our analysis. Two weaknesses of using Crimson Hexagon should be mentioned. CH limits access to the underlying source texts; we have compensated by reading thousands of tweets manually. And CH does not enable us to distinguish between original tweets and re-tweets, so our implicit assumption is that re-tweets usually reflect sympathy with the original tweet.
Thus, with a reliable set of Arabic keywords referring to the United States, we can analyze every genuine Arabic tweet referring to the United States that has ever been sent. Of course no method comes without limitations. Ferreting out sarcasm is well beyond the Read-Me algorithm. And any text method requires extensive ex post checking and transparency, which we attempt to do in our extensive online supplementary materials. Footnote 25 Only small percentages of Twitter users indicate their country, making cross-national analysis difficult.
Analyzing General Levels of Anti-Americanism in the Middle East
As mentioned earlier, examination of public opinion data from the Arab world has long revealed high levels of anti-Americanism. Footnote 26 Because Twitter posts result from choices to express oneself (rather than a response to a question someone might never have thought about), data from Twitter enable us to discover whether self-expressed views—the Arabic discourses—are similarly hostile to the United States.
Table 1 reports on two different sets of public opinion polls—the 2012 Pew Global Attitudes Poll and the 2011/2012 Arab Barometer—in seven Arab countries: Egypt, Jordan, Lebanon, Tunisia, Iraq, Algeria and Yemen. First, we look at two sets of questions in the Pew Global Attitude Poll: favorability scores toward the United States and agreement with the statement that it is good that U.S. ideas and customs are spreading to the region. Second, we turn to two Arab Barometer questions: whether respondents believe that “armed operations” are justified against the United States because of its interference in the region, and whether respondents believe there are positive features linked to American and Western culture.
Arab public opinion toward the United States

Favorability scores are quite low—remarkably low in some countries such as Egypt and Jordan, while even in Lebanon and Tunisia these scores are not predominantly positive. There is widespread opposition to the spread of Western values. Yet, quite remarkably in terms of the strongly negative views about American foreign policy and the spread of western values, 50 percent to 83 percent of respondents say that American culture has positive aspects. That is, in the polling data we see indications of the same distinction we will document for the Twitter data between Arab attitudes toward the impingement of American policy and society on Arab countries and toward American society as such.
Systematic polling data in the region is quite difficult to secure. The Pew Global Attitudes poll, for example, does not survey in many Arab countries and in the 2012 wave it only gathered data in four countries: Egypt, Lebanon, Jordan and Tunisia. The Arab Barometer data has expanded its number of countries in recent waves but problems remain. For example, some countries have not allowed social scientists to ask questions about attitudes toward the United States. Clearly, countries are worried about the negative ramifications of “exposing” the degree of anti-American sentiment in their countries. Morocco (2006), Egypt (2006), and Saudi Arabia (2013) are examples of countries restricting public opinion polling.
General Attitudes toward America in the Twitter Universe
Our first monitor, called the “General Anti-Americanism” (General AA) monitor, looks at general trends in the Arabic Twitter conversation about the United States. We sought to make this monitor as broad as possible, choosing a large date range: from the earliest date for which Twitter data is available in Crimson Hexagon to the current date. However, we quickly found that data after January 1, 2012 are the most reliable, and all of our figures are based on tweets after this date. We also aimed for breadth in our keyword criteria, producing a large set of keywords. Between January 1, 2012, and December 31, 2013, an astounding number of 33,009,354 tweets matched these date and keyword criteria and were classified in one of our six substantive categories.
The goal of our general monitor is to get a general sense of Arabic-language tweets referring to the United States. Furthermore, this analysis helps give an indication of instances of when an “event” has happened that requires additional scrutiny. We developed the six training categories shown in Table 2 based on two distinctions that are important in the anti-Americanism literature: the topic of discussion (political vs. social) and its valence (negative, neutral, or positive). Footnote 27
Estimated number of tweets per category for general attitudes monitor
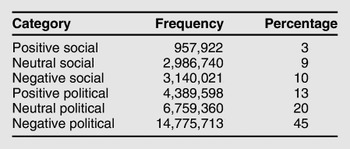
Which categories are most prominent? Is anti-Americanism rampant in the Arabic Twitter universe? Does it span both political and social categories, or is it circumscribed to political anti-Americanism? Table 2 plots the estimated number of tweets for each category. The results are striking. Although the ratio of negative to positive tweets is over 3:1 in both social and political categories, the volume of political traffic is nearly four times as great as social traffic. Footnote 28
In figure 1 we plot over time each of the categories presented in table 2. The small black triangles along the horizontal axis represent a set of key events during our time period, many of which we analyze in detail in the next section. One thing that stands out is that for these events there are often dramatic spikes in Twitter volume. This is perhaps not surprising given the nature of Twitter. However, it raises an important question: when we remove high-category days, is the volume of negative political traffic still substantially higher than the other categories?
Total Arabic tweets by political and social category using all tweets in the world, plotted across time
Note: The triangles indicate key events during this time period.

Figure 2 shows that even when we eliminate days where there are spikes in Twitter activity, negative political traffic remains dominant. The top left plot is a histogram of total on-topic volume at the daily level. The population median is given with a vertical line. This clearly shows the presence of spikes. The top right plot shows the same histogram, where we have removed all days above the fiftieth percentile. The bottom left plots the percent of total on-topic volume that is politically positive or negative (y-axis) against the percentile used to remove days that had a total volume above that percentile. For example, at an x-axis value of 1, all days are used, and at the x-axis of .5, we are only using days captured in the histogram in the top right (those days with a volume below the median). We see that once we restrict our sample to days without events, we get a similar picture. Negative political volume stays close to 40 percent of the entire sample. We see a similar story if we take the ratio of negative (political and social) to positive tweets in the bottom right of figure 2. Looking at both the universe of tweets and only using days that did not have spikes in volume, we arrive at the same conclusion that negative political tweets dominate the Arabic language conversation about U.S. politics and society.
Analysis excluding spikes in Twitter volume
Notes: The top left figure plots the histogram of total on-topic daily volume with a vertical line at the median. The top right figure plots the same distribution but using observations below the population median. The bottom left figure plots the percentage of total on-topic volume that is negative or positive political as days are removed for being over a given percentile (x-axis) in total volume. The bottom right figure plots a similar line, but where the sum of negative tweets is divided by the sum of positive tweets.

However, in spite of the predominance of negative political tweets over others, one political event stands out as prompting positive responses: the 2012 U.S. presidential election. The spike in positive traffic around this time (refer to figure 1) was the largest spike in traffic for our entire monitor. When we closely inspected this we found it was comprised principally of favorable reactions to President Obama’s re-election and admiration for the institution of free and fair elections, coupled with the desire for similar institutions in one’s own country. However, this positivity towards Obama’s re-election disappeared very quickly, resulting in a very low percentage for this category overall.
In summary, the conversation on Twitter, in Arabic, about the Unites States is especially negative towards U.S. policy; the conversation about U.S. society is also mostly negative but with some positive elements and much smaller in volume than the conversation about U.S. policy. These results hold whether we look at all Twitter traffic or only those days that reflect more of a “baseline.”
Analyzing Responses to Specific Events
We now analyze a set of events in more detail than was possible in the general monitor. We structure our analysis by looking both at events involving U.S. actions towards the Arabic speaking world, and at events in which the United States was the target. This distinction is important because we might expect different levels of traffic and different levels of positive and negative reactions to these two types of events. We might expect, because of generally negative attitudes towards the United States, that actions the United States takes towards the Arabic speaking world would generate large amounts of negative traffic. On the other hand, we might expect different reactions when the United States is the target, perhaps even expressions of satisfaction. We first discuss political events in which the United States was seen as the impinging actor; we then analyze the responses to the Innocence of Muslims video emanating from American society; and next we turn to events in which the United States and the American people were affected by actions of people or natural forces such as Hurricane Sandy. Footnote 29
Two of our monitors target political events: a monitor that tracks the U.S.-focused traffic surrounding Morsi’s removal from office and the subsequent pro- and anti-military protests in Egypt; and a monitor that tracks U.S.-focused traffic surrounding the Syrian civil war. These two situations differ from each other in many ways, but their similarities invite interesting comparisons. In both situations, two camps dominated the conversation: on the one hand, the “pro-regime” camps (those who supported Assad in the Syria monitor and those who supported the military in the Morsi monitor), and on the other, the “anti-regime” camps (those who supported the Syrian revolution and those who supported Morsi). Also, looking at these two events together allows us to understand situations in which the U.S. government is perceived to be able to influence the course of events due to its influence in the region. This is in contrast to situations where the United States is the target, which we will discuss.
Morsi and Egypt
The Morsi monitor seeks to look at the Arabic conversation surrounding the removal of Mohammed Morsi from power on July 3, 2013 and the events that followed. For this monitor, we were interested in looking at how Arabic tweeters were talking about the United States in relation to the events that were going on in Egypt. How did the Arabic tweeter public respond to these events?
For this monitor tweets were only selected for analysis if they included both a reference to the United States and a reference to Egypt. Footnote 30 We ran the monitor from June 27, 2013 (approximately a week before Morsi was forced out of office) to September 8, 2013 (when it seemed that news coverage of the situation in Egypt was giving way to coverage of the crisis in Syria).
In designing the categories for our analysis we wanted to allow for both sides of the dispute to take on both pro- and anti-American positions, and to allow for both general pro and anti sentiments towards the United States that were not in the context of supporting one or the other domestic group. With these desires in mind, we came up the categories listed in table 3, where we report the results. To facilitate comparability among the event monitors, in all cases we exclude tweets that contained only neutral news reports, though our substantive conclusions do not change if we include these.
Total estimated number of tweets in each category for Egypt, omitting 515,257 posts with News/Neutral content

The first thing to notice is that positive views of the United States were a very small proportion of Twitter traffic: 4 percent overall. The top three categories encompassed tweets that expressed opposition to the United States. The largest category was anti-American and anti-military, the next largest was general anti-Americanism, and third was anti-American and anti-Muslim Brotherhood. No matter which side of the domestic dispute an individual was on, he or she was likely to be opposed to the United States. Because of the small number of positive tweets, it is hard to determine how much of the positive traffic was coming from anti-military versus anti-Muslim Brotherhood tweeters. In summary, this analysis clearly shows sharp divisions within Egyptian society on the question of the Muslim Brotherhood, but a common opposition to the United States. Rather than an enemy of an enemy being a friend, the United States is consistently cast as an enemy.
Syria
Our analysis of Syria is similar to the Morsi analysis in that it seeks to look at how Arabic tweeters are talking about the United States in relation to one particular event or topic—in this case the Syrian Civil War, which began on March 15, 2011. The explosion of discussion on Twitter about possible U.S. intervention in Syria following alleged chemical weapons attacks by the Assad regime provides a good opportunity to look into reactions towards U.S. foreign policy. Since this story in 2013 was one of U.S. inaction, we are asking here about levels of anti-American political opinion in an event where the United States had not used force but was widely perceived as being able to influence the course of events in Syria. Footnote 31
We use tweets if they included a reference to the United States and a reference to Syria, following a similar procedure to that used in the Morsi monitor. We trained this analysis from January 1, 2012, to December 31, 2013. Modeling our categories on the Morsi monitor, but with slight adaptions based on what we found when looking at the Syria traffic, we obtained the five categories found in table 4, where we report the results.
Total estimated number of tweets in each category for Syria, split by date just prior to chemical weapons attacks

Notes: News/Neutral posts are omitted.
Pro-U.S. traffic is between about 1 percent and 4 percent of total non-news traffic, depending on the time period. All of the pro-U.S. traffic comes from the anti-regime camp, and the amount of negative traffic coming from the pro-regime camp far outweighs the negative traffic from the revolutionaries. This is to be expected, given that the United States was seen as on the side of the Syrian revolution. However, even for the anti-regime tweeters there were 350 percent more anti-U.S. tweets than pro-U.S. tweets before the chemical weapons incident, and about 1,200 percent more after the event. In addition, anti-regime traffic that was ambiguous about the United States was large prior to the chemical weapons attack but declined sharply following the attacks, whereas general negative traffic against the United States increased after the attacks. The right side of table 4 presents figures for the post-August 20 period.
Twitter responses to the Egypt and Syria situations dramatically demonstrate the breadth and depth of negative views toward American foreign policy in the Arabic Twitter universe. It is not surprising that supporters of the Muslim Brotherhood and of the Assad regime (not necessarily the same people) are negative toward the United States, since the United States was cool toward the Brotherhood and has been very negative toward the Assad regime. But what is dramatic is the extent to which Arabic Twitter users who favor the Egyptian military are not positive toward the United States, and the extent to which those who favor the Syrian revolutionaries are predominantly negative toward the United States. This is particularly striking for the Syria monitor, in which 87 percent of tweeters who expressed political views were antagonistic toward the United States, despite the fact that the United States opposed the Assad regime, which was also opposed by many Arabic tweeters. In the Egypt monitor, the proportion of political tweets that was anti-American reached 96 percent. We see a similar pattern if we only look at Twitter participants who were more or less on the same side as the United States: that is, they favored the Egyptian military or were opposed to the Assad regime. Once again, the fact that the United States was the enemy of their enemy did not make them regard it as their friend. Footnote 32
Arab Responses to Critical Views from American Society: Innocence of Muslims
Written and produced by an Egyptian-born Coptic Christian residing in the United States, the 14-minute long Innocence of Muslims film was widely considered an attack on Muslim society. After the first Arabic-dubbed version of the film appeared early September 2012, there were widespread demonstrations and riots in the Middle East, many with an anti-American tone, suggesting that the film’s views were attributed by many people to the United States. Its appearance also led to an immense outpouring of commentary on Twitter. It was important to create a monitor for this event since it could be considered an attack on Muslim society by American society, and thus responses to it could help indicate the extent to which perceptions of American society fuel anti-Americanism. If perceptions of American society do fuel anti-American sentiment, we would expect to see direct expressions of anger directed at American society in response to this event. We find, however, a much more complex pattern of responses.
We developed a short and specific list of base words to help us capture tweets related to this event. Footnote 33 We examined the two-month period right before and after the movie began making headlines in the Middle East, beginning on September 1, 2012 and continuing until November 10, 2012. As we trained the monitor, we found that responses were not easily mapped onto a simple pro- or anti-Americanism scale; such a scale did not capture the Twitter discussion about the film, which focused on what the best course of action for Muslims to address the film would be. For this reason, we modified our categories so that they captured different sentiments expressed about the film. This process led to the discovery of five categories that help us convey the substantive patterns we did find. These categories are listed in table 5.
Total estimated number of tweets in each category for the world

Note: News/Neutral content posts (433,590) were omitted.
Reviewing these results, we find that the biggest (non-news) category was the category encouraging people to ignore the film. The second largest category included posts supporting individual action against the film. The third largest category reflects posts arguing that Islam is stronger than the film. All of these reactions have negative implications but none of them represents a clear condemnation of American society in general. We did not find tweets with statements such as “This means that all Americans hate us” or “All of American society and people should be condemned.” In this monitor, we see a clear negative reaction but we do not see a predominance of direct attacks on American society, unlike the direct attacks on American policy in the general, Morsi, and Syria monitors. But there is no doubt that both in this monitor, and the general anti-American monitor for this time period, expressions of sentiment are preponderantly negative. Footnote 34
Arab Responses to Harms to America
The previous analyses all dealt with events where the Arab world was the target. We now shift our attention to two events in which the United States was a target, providing an important symmetry to our paper. We study the Boston marathon bombings and Hurricane Sandy.
Boston Marathon Bombing. On April 15, 2013 a set of bombs exploded at the Boston Marathon, killing three people and injuring an estimated 264 others. The accused perpetrators purportedly carried out the attack for the sake of Islam. This monitor shows us how Arabic tweeters responded to this attack on the United States. How much sympathy was there for victims, and were responses principally focused on U.S. politics and policies or on U.S. society?
We developed a short and specific list of base words to help us capture tweets related to this event, as detailed in the on-line supplementary materials. As with the Innocence of Muslims monitor responses did not easily map onto a pro- or anti-Americanism scale, so we grouped responses by the topics that seemed prominent during our training. These categories are listed in table 6, where we report the results. This monitor was run from April 13 to June 10, 2013.
Estimated number of tweets per category for Boston Marathon bombing monitor

Note: News/Neutral content posts (262,761) were omitted.
Figure 3 presents the Boston monitor results over time for each category, using the total number of tweets. The first small black triangle marks the date of the bombing and the second is the date of the final shoot-out with the alleged perpetrators. Table 6 presents the total number of tweets for each category, aggregated over time.
Estimated number of tweets per category over time for Boston Marathon bombing monitor

Several interesting patterns are present in the data. First, the ratio of tweets claiming that media attention to the event was undeserved to tweets expressing sympathy for the victims was almost 4:1. The low levels of sympathy towards innocent victims, and high levels of tweets dismissing the importance of their plight, suggest substantial negative sentiments toward the United States. Indeed, the amount of sympathy expressed for Arabs facing discrimination was about a third the size of sympathy for the victims, and the “Backlash” category, indicating concern about a backlash against people in the United States of Arab origin, had over 90,000 tweets. On the other hand, we did not observe tweets celebrating the attack on U.S. society. While many individuals argued that the attention was undeserved, they did so by pointing to deaths in the Arab world (especially Syria), often by arguing that behind these deaths are American policies. While overall sympathy for victims was a relatively small percentage of the conversation, it is American policies and interference in the Arab world that drew the ire of many tweeters.
We reflected a great deal about whether these negative views of the United States reflect “bias,” as distinguished from opinion. Footnote 35 Opinion reflects attitudes and reactions to events but no major cognitive distortions. People with negative opinions of other people, groups, societies, or institutions dislike what they actually do, or stand for symbolically. Bias, however, reflects distorted perceptions of reality: biased people misperceive the actions of the people, groups, societies, or institutions that they dislike.
Although in general we found it difficult to infer bias from the information we gathered, the clearest possible evidence of bias comes in the Boston Marathon monitor, specifically in the Conspiracy category. There were nearly twice as many tweets speculating about a conspiracy involving U.S. security agencies than tweets expressing sympathy for the victims.
We interpret the findings from the Boston monitor as suggesting a significant level of bias against the United States. Bias is based on a deeply negative view toward the United States that strongly colors respondent’s perceptions of observed U.S. actions and that may create negative beliefs about unobserved actions by the United States and the motivations of American decision-makers. Although there was never any credible evidence of a conspiracy beyond the plans of the two bombers, we see almost twice as many tweets that are coded as expressing belief in a conspiracy than tweets expressing sympathy for the victims of the bombings. However, our inability to discover clear evidence of bias, as opposed to negative opinion, in the other monitors makes us diffident about drawing strong general conclusions about bias.
To understand anti-Americanism it is important to ask whether the results would have been different were this event to have happened in another country. Our best effort to find a case as similar as possible comes from the Arabic Twitter conversation surrounding the death of British Army soldier Lee Rigby, who was attacked and killed by Islamist terrorists on May 22, 2013, in Woolwich, London. The results for London look very different than those for Boston. While we do not present the detailed results here, Footnote 36 relative to the total volume of activity there was much more sympathy for the victim; the view that this event is not important in light of attacks on Muslims in the Middle East is not expressed; and there was no discussion of a possible conspiracy. Apart from news reports, tweets fall into three categories: expressions of sympathy with victims (60 percent), expressions of sympathy towards Arabs/Muslims (20 percent), and expressions of concern about backlash against Muslims (20 percent). In London there were three times as many “Sympathy for Victims” tweets than “Backlash” tweets. The immediate response of Arabic tweeters was overwhelmingly one of sympathy towards Arabs and Muslims, with little to no explicit support for the attackers. There was so little discussion of a possible conspiracy that it was not included as one of our categories: the facts of the murder were accepted. This evidence suggests that hostility to the United States is greater than hostility to the United Kingdom.
Hurricane Sandy. In late October 2012, Hurricane Sandy caused extensive damage to the Northeastern United States. We explore this event—with results presented in table 7—to search for high levels of antipathy for American society that we have not heretofore detected.
Estimated number of tweets per category for Hurricane Sandy monitor

Note: News/Neutral content posts (451,728) were omitted.
In the Hurricane Sandy monitor most tweets were merely news items, leaving just over 310,000 tweets to analyze. Of these meaningful tweets, 10 percent (about 32,000) expressed the view that Hurricane Sandy is punishment for the Innocence of Muslims film or similar prejudice against Muslims. In addition, about 2 percent (almost 13,000) were generally negative and 16 percent (almost 50,000) expressed particular concern about Arabs or Muslim Americans and residents. Over 30 percent (about 99,000) said that the Hurricane Sandy events were not important. In contrast, approximately 25 percent of tweeters (almost 80,000) commented favorably on the U.S. government’s handling of the disaster, often as a contrast to the incompetence of Arab governments, and about 10 percent (over 30,000) condemned the view that Hurricane Sandy is punishment for the Innocence of Muslims film. In other words, of the Arabic Twitter participants who expressed an opinion, somewhat more than one-third expressed views that can be interpreted as generally favorable toward American society, somewhat less than one-third expressed explicitly negative views, and 30 percent regarded the events as not important. Even if we interpret “not important” as implying that harm to the United States is not bad, the difference between this monitor and those related to directly political events is striking.
The Boston Marathon and Hurricane Sandy monitors present something of a contrast. An overwhelming 88 percent of non-news responses to the Boston Marathon bombing are negative toward the United States: these events are seen as not important (in view of harm done to Arabs in the Middle East directly or indirectly by American policy); the greatest concern is for the welfare of Muslim Americans/residents; or a conspiracy of American intelligence agencies is viewed as responsible for the allegations. In contrast, in the Hurricane Sandy monitor over one-third of Twitter participants, apart from those merely re-tweeting news, expressed views quite favorable toward aspects of American society. One suggestion is that the Boston Marathon events were framed in an explicitly political way, evoking negative responses, while the Hurricane Sandy events were not.
Summary
What conclusions can we draw about the nature of anti-Americanism from our findings? We find that two dimensions help us distinguish the volume and valence of Arabic-language responses: social vs. political content; and the U.S. impact abroad vs. U.S. domestic activities. Table 8 presents the most important results for previous surveys and our own analysis, placing negative responses in bold type. The table excludes neutral content and focuses on positive and negative reactions to events or topics. We find that events and activities in cell A—those with a focus on the political impact of the United States abroad—generate the largest volume and most negative responses. On the other hand, those in cell D—with a focus on U.S. domestic social activities and events—generate the smallest volume and most positive responses, although there are criticisms as well.
Summary of findings

Note: a Most of this interest is classified as neutral.
Table 8 shows that U.S. policy is the predominant target of anti-Americanism. Discussions of American society are more ambiguous. Arabic Twitter discourses on how American society affects the Arab world are particularly negative. Several pieces of evidence point toward this conclusion. First, public opinion polls (table 1) reveal overwhelming opposition to the proposition that it is good that American customs and ideas are spreading in the Arab world, but majority agreement that there are nevertheless positive aspects of U.S. society. Second, in our analysis of general anti-Americanism presented in table 2, the vast majority of tweets that were classified as “negative social” dealt with concerns about U.S. society impinging on Arabic society, especially dealing with women’s issues. Finally, the dramatic response towards the Innocence of Muslims film is best understood as a response towards the impingement of U.S. society on Arabic society.
Lacking throughout our analyses is a discourse that is targeted towards the nature of U.S. norms and practices within the United States itself. People using social media in the Arabic-speaking world strongly dislike the impact of the United States, politically and socially, in their societies, but are less hostile to the United States as a society, with its very different customs and practices.
Further evidence from public opinion polling reinforces the significance of our distinction between views of American society and its impingement on the Arab world, although the argument is sometimes implicit. Recall from our introductory discussion that Chiozza found the most negative views of the United States to center on the diffusion of American customs abroad, the war on terror, and U.S. foreign economic policy—all issues in which the U.S. influence on the rest of the world is central. American political institutions, popular culture, and U.S. business all received a mix of evaluations, while evaluations of U.S. science were positive. In general, topics in this second set do not evoke thoughts about how United States power impinges on countries in the Middle East. Marc Lynch ascribes increases in anti-Americanism in the Middle East between 1999 and 2004 largely to the fact that “the American presence in the Arab world measurably increased” during this period. Footnote 37 Lars Berger finds, on the basis of a poll taken in 2008 in Egypt, Indonesia, and Pakistan, that fewer than ten percent of respondents approve of attacks on civilians in the United States, and that this view is strongly correlated with dislike for American culture but not with opposition to American foreign policy—opposition that is much more widely shared. Footnote 38 Berger therefore provides empirical support for a distinction that Amaney Jamal made between criticism of U.S. foreign policy and rejection of U.S. domestic practices. In her analysis, Jamal argues that fear is an important component of anti-Americanism. Footnote 39 Even Arab liberals, she claims, can become anti-American if they worry about U.S. actions, and the antipathy of sovereign nationalists to the United States is accentuated by fear. Footnote 40 Fear, of course, is only activated if the subject is thinking about the impact of the United States on him or her, and for most of our Twitter participants, that means foreign actions by the United States. Footnote 41
These two points—that political anti-Americanism is more intense than social anti-Americanism but that the latter is still strong, and that objections are stronger to the impingement of American society on the Arab world than to American society itself—are both important. They suggest that changes in United States policy alone are unlikely to transform Arab attitudes toward the United States, and that much will depend on how Arab attitudes themselves change.
Is the United States Unique?
The literature on anti-Americanism has been written overwhelmingly by Americans with an exclusive focus on the United States, and this paper is no exception. The United States has actively intervened in world politics for the last 73 years, so it is not surprising that it generates strong feelings. But in what sense should we view these feelings as distinctively “anti-American” rather than being merely expressions of a more generic phenomenon: resentment of interference in one’s own affairs by a powerful state with a distinctly different set of cultural values as well as political interests? As suggested at the outset of this paper, we need to raise our sights a bit and look at countries other than the United States to see whether anti-Americanism is a highly specific or even a unique phenomenon, centered on the United States, or one aspect of a more general phenomenon: opposition to interference and influence by powerful states with different cultural values and political interests.
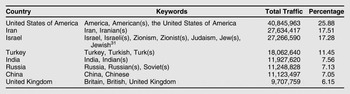
We approach this question first by asking how much Arabic tweeters talk about the United States, as opposed to other countries that are important either globally or in the Middle East. To address this question, we compared traffic about the United States to traffic about six other countries: Iran, Israel, Turkey, India, Russia, China, and the United Kingdom. The results of this analysis are found in table 9. The United States is the most important focus of this Twitter traffic, an entire quarter of which was about the United States. However, other influential non-Arab countries that regularly get involved in Middle Eastern affairs commanded a large share of this traffic as well: Iran with 17.51 percent, Israel with 17.28 percent, and Turkey with 13.84 percent.
Volume of Arabic Twitter traffic for seven countries, Jan. 1, 2012–Dec. 31, 2013
The large number of tweets about Iran enables us to ask whether negative attitudes toward the United States are unique or whether, on the contrary, they extend to other powerful states with different cultural values and political interests. To answer this question we conducted an analysis on Iran that is similar to the one we described earlier on general anti-Americanism. While the United States and Iran are both regarded as enemies, Arabic speaking tweeters appear to have distinct and cognitively consistent reasons to dislike both states, since both states are seen to interfere with their countries. So it does not require cognitive distortion to dislike both the United States and Iran.
As table 10 shows, non-neutral traffic referring to Iran was overwhelmingly negative. Indeed, we found so few tweets that were either positive, or related to Iranian society, that we were unable even to estimate the proportions of these categories. Hence there is indeed a contrast between feelings toward Iran and the United States, but it seems to favor the United States. Our findings reinforce the view taken by Peter J. Katzenstein and Robert O. Keohane, and Giacomo Chiozza, on the basis of public opinion polling, that views toward the United States elsewhere in the world are highly ambivalent. This ambivalence reflects the “polyvalence” of American symbols: “they embody a variety of values with different meanings to different people and indeed even to the same individual. Footnote 42 In both the polling data and even more in our Twitter data, one observes admiration for American popular culture, helping to create such ambivalence. There is no such Arab admiration for Iranian popular culture, and no discernible ambivalence.
Total estimated number of tweets in each category for Iran monitor
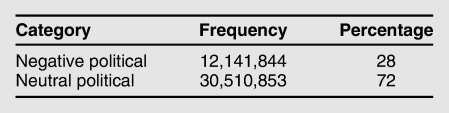
Note: The number of tweets here is higher than in table 9 because references to “Shia” or “Shiite” were included in the Iran monitor.
Anti-Americanism, Anti-Interventionism, and the Politics of Social Media Discourses
Anti-Americanism is an important political phenomenon and the subject of an extensive literature, with essentially all of the previous quantitative work relying exclusively on public opinion surveys and seeking to ascertain attitudes. In contrast, we focus on social media, specifically Twitter Arabic language feeds. We monitor millions of Arabic-language messages during 2012–13 on Twitter, enabling us to delineate the discourses that take place on social media in the Arabic-speaking world. Our aggregate monitor finds that discourses with respect to both political and social issues are overwhelmingly negative but that the volume of political traffic is four to five times as great as the volume of social traffic. Consistent with the findings of public opinion polls, distrust of the United States Government in the Middle East is deep.
Our analysis of Twitter data has allowed us to revisit many of the salient debates on anti-Americanism. First, with a high degree of confidence, we show that the primary focus of anti-Americanism in the Arabic Twitter universe is more about international politics than about domestic social norms. This finding has two important implications. First, much of the literature on anti-Americanism as driven by domestic social norms has posited that Arab societies, or even Muslim societies more generally, dislike the United States (and other Western countries) for the values that they express internally. If cultural distaste dictated high levels of anti-Americanism, then only fundamental cultural or normative change could provide a remedy to such intolerance. Direct policies would have to be aimed at inducing or supporting cultural shifts at the societal level. Such possible policies would include civil society initiatives to promote a democratic ethos, curricular development that emphasizes tolerance and western liberal values, the encouragement of “moderate” voices to assume the pulpit, and the strengthening of youth “liberal” voices on Arab streets. Their purpose would be to encourage the evolution of society in more liberal-democratic directions, generating also a more pro-American stance among Arab societies.
However, our results, especially as summarized in table 8, indicate that levels of anti-Americanism are primarily driven by the perceived impingement of America on the Middle East, and specifically by United States intervention in the region. We have further demonstrated that anti-American sentiment focuses around events in which the United States is seen as playing a major role. Overwhelmingly, citizens of the Arab world distrust the intentions of the United States: regardless of what the United States does, Arab publics will evaluate the United States through a deeply suspicious lens. As long as the United States continues to intervene militarily in the Middle East, its actions will generate resentment. Iranian intervention generates similar resentment.
Our analysis of attitudes toward Iran has led us to interrogate the very concept of anti-Americanism. The literature on anti-Americanism has been written overwhelmingly by Americans with an exclusive focus on the United States, and we began our analysis with the same mind-set. The United States has actively intervened in world politics for the last 73 years, so it is not surprising that it generates strong feelings. But in what sense should we view these feelings as distinctively “anti-American” rather than being merely expressions of resentment towards interference in one’s own affairs by a powerful state with a distinctly different set of cultural values and political interests? The concept of a distinct “anti-Americanism” has been reified by a polling technology that asked people around the world what they think of the United States, not their views of other powerful countries that are perceived to intervene in their affairs.
In light of our findings about Iran, political scientists should examine social media discourses and public opinion toward countries other than the United States to see whether anti-Americanism is a highly specific or even a unique phenomenon, centered on the United States; or merely one aspect of a more general phenomenon: opposition to interference and influence by powerful states with different cultural values and political interests. Our analysis of Twitter data and public opinion analysis suggests that the latter interpretation is likely to be correct.
Arab anti-Americanism appears to be a specific version of a more general phenomenon: dislike and distrust of the impingement of other societies with different political and social values on the Arab Middle East. Seventy-five years ago these views may have been common toward Britain and France; but as the influence of these states has diminished, publics around the world no longer think of tweaking the tail of the British lion or calling out French republicans for their imperialist hypocrisy. Anti-Americanism arose in the wake of the rise of America to world power, and was strongest in areas such as the Middle East where intervention by the United States was particularly intrusive; regional antagonism to Iran is high in the wake of active Iranian intervention in Syria and neighboring countries. If China begins to intervene on a global basis, it may be next.
Implications for Political Science and World Politics
Our analysis also raises more general questions, not limited to the study of anti-Americanism, which are relevant to the study of what we have called social globalism. Social media create a remarkable window not only into attitudes, as expressed by individuals, but into discourses. We can well imagine analyses that would try to identify different discourses on a set of topics, and their connections, and their disconnects. Twitter users with more moderate or extreme views may have different networks of whom they follow and who follows them.
These discourses are socially constructed and have their own dynamics. There may be considerable path-dependence, with initial themes helping to determine future themes: this is another set of questions worth analyzing. Social scientists should build on excellent existing work about how these discourses affect politics in the street or policy-making in governments. Footnote 43 To what extent do these discourses shape social movements and how closely are they responded to by policy-makers? Furthermore, how does social media engagement relate to other forms of expression, such as communications to leaders, commentary in newspapers, or informal discussions? Footnote 44 More broadly, political discussion includes people saying they like something, repeating what they heard, and replying to each other. But these actions on Twitter might engender substantively different dynamics from face-to-face interaction. The politics of social media discourses have created a subject that is ripe for innovative social scientific analysis.
Beyond the opportunities that social media discourses provide for social science, they raise major questions for the study of contemporary world politics. As we note in the introduction, the fact that voices of ordinary people can be heard, worldwide, is a new feature of contemporary globalism. It enables people with minority views within their own communities to find a broader community of sympathizers and to engage in debate. It also enables militant organizations, such as the Islamic State of Iraq and Syria (ISIS), to recruit, on a global basis, seeking to entice people who have never known anyone from ISIS to join these organizations. These organizations become focal points—both on social media and in the world of inter-personal politics and military action—for the expression of dissent and alienation. Prevailing high levels of anti-Americanism on social media may provide validation for decisions by some individuals to act against the United States, by joining ISIS or otherwise.
Military and organizational strength—whether on the part of Iran or the United States—does not enable modern states to control expressions on social media sites abroad, although some states such as China are quite effective in controlling domestic media sites. Footnote 45 On the contrary, the exertion of military power by these states to control events or influence political outcomes generates opposition in society that at least partially counterbalances their hard power. The United States or Iran may be able to influence the state-run media of sympathetic countries, but the extensive horizontal communication on social media reduces the dominance of state-run media and the efficacy of strategies that rely on them. Old-style intervention threatens to generate hostility that reverberates through social media, which amplifies reactions to every military action.
The dynamic and expansive character of social globalism, fostered by the internet and social media, does not imply that states have suddenly “lost control.” As Stephen Krasner has argued, states remain the most important actors in world politics and have historically been resilient, with state activity increasing along with economic and social interdependence. Footnote 46 But social media, and the discordant discourses that they engender, do generate new challenges for states, and particularly the United States, as they seek to develop strategies for effective action in world politics.
Online Supplemental Materials: “Anti-Americanism and Anti-Interventionism in Arabic Twitter Discourses”
-
Overview: Aggregate Twitter Volume
-
The Hopkins-King “ReadMe” Method
-
London Monitor Results
-
Monitor Training Details


