




INTRODUCTION
Defining the absolute chronology of the Egyptian Old Kingdom is still a work in progress. Radiocarbon dating research projects have largely focused on the early periods, with considerable advancement when synchronized with Levantine chronologies (Bronk Ramsey et al. Reference Bronk Ramsey, Dee, Rowland, Higham, Harris, Brock, Quiles, Wild, Marcus and Shortland2010; Regev et al. Reference Regev, de Miroschedji, Greenberg, Braun, Greenhut and Boaretto2012; Dee et al. Reference Dee, Wengrow, Shortland, Stevenson, Brock, Girdland Flink and Bronk Ramsey2013). In addition, Bronk Ramsey (Reference Bronk Ramsey, Dee, Rowland, Higham, Harris, Brock, Quiles, Wild, Marcus and Shortland2010) offered scholars working with Egyptian historical chronologies confidence that the generally accepted dating framework for the New Kingdom in particular was on solid ground. In this latest study, research on the Old Kingdom (OK) has been less prominent, with less than 20 new radiocarbon (14C) dates obtained. Previous studies such as that conducted by Bonani et al. (Reference Bonani, Haas, Hawass, Lehner, Nakhla, Nolan, Wenke and Wölfli2001) have sought to add new data, but the OK chronology still remains weakly-constrained. As a result, absolute dates for the late Old Kingdom are particularly scarce.
Modeling a framework of absolute dates for the OK using Bayesian statistics is underway at the Institut français d’archéologie orientale (Cairo), led by Dr Anita Quiles (ANR Programme MERYT). Datasets include material contributed by missions focusing on well-contexted samples linked to known historical anchors. One of these anchors is the person of Djau, a well-known official who served king Pepy II, whose reign is dated to ca. 2278–2184 BCE in the so-called consensus chronology (Shaw Reference Shaw2003:480–489). This paper presents new modeled radiocarbon dates obtained from samples from the burial of Djau himself. The results provide new dating evidence for the death of Djau, which can be linked on historical and archaeological grounds to the end of the reign of king Pepy II, and thus by extension, assist with dating the end of the historical 6th Dynasty.
MATERIALS AND METHODS
Deir el Gebrawi Necropolis—Djau Tomb
A study of the number of nomarchs who governed under Pepy II in some of the well documented provinces, like El-Hawawish, Deir el-Gebrawi and Meir, shows that three to four governors succeeded each other in each province during his reign. Among them, the careers of Djau, his father Djau/Shemai and grandfather Ibi have been extensively studied by Kanawati, based on textual analysis and re-excavation of their tombs at the site of Deir el-Gebrawi in Middle Egypt (Kanawati et al. Reference Kanawati, Alexakis, Ikram, McFarlane, Schultz, Shafik, Thompson, Victor and Walker2013).
Djau was one of Pepy II’s officials—overseer of Upper Egypt and nomarch (governor) of the 8th and 12th provinces. Djau’s titles indicate his position as one of Egypt’s most senior officials; as overseer of Upper Egypt, he reported directly to the king, with oversight of vast territory in southern Egypt (Kanawati et al. Reference Kanawati, Alexakis, Ikram, McFarlane, Schultz, Shafik, Thompson, Victor and Walker2013). Such offices were hereditary, and three generations of this family and their careers are known from archaeological and textual sources. As Djau’s biography and that of his grandfather, Ibi, mention the kings under whom they served, members of this family are historically well-dated (Sethe Reference Sethe1932–1933:142:8–12, 146:6–9; Strudwick Reference Strudwick2005:363:266, 365:267).
Djau, Djau/Shemai, and Ibi were buried in desert rock-cut tombs at Deir el-Gebrawi in Middle Egypt (Figure 1). The tombs were originally excavated in 1902, and not examined until an extensive campaign conducted by The Australian Centre for Egyptology (Macquarie University) from 2004–2008, led by Professor Naguib Kanawati. During this time the mummified body of Djau was discovered for the first time, still in his burial chamber (Figure 2). The tomb and his body were anciently robbed of most valuables, but the body was preserved to a high degree, enabling analysis of the remains from which conclusions could be drawn about the age and the physical condition of Djau when he died. The results concluded that Djau most likely died at 55–60 years of age, but an age between 50 and 65 years is also possible. The results were also assessed alongside archaeological and historical data about other family members and their service as officials during the late 6th Dynasty.
Map showing the location of Deir el Gebrawi.

The disturbed body of Djau in situ on discovery in the burial chamber. Note the wooden coffin base visible under the body. Photo © by E. Alexakis, Australian Centre for Egyptology.

Twenty years later, the study of Djau’s mummified remains represented a chance to test the historical chronology of Pepy II’s reign through radiocarbon dating. With the permission of the Ministry of Tourism and Antiquities, a small expedition retreived a number of samples in December 2019.
Sampling
Five samples were collected for radiocarbon dating from the mummified remains of Djau at Deir el-Gebrawi, under the supervision of the Center of Research and Conservation from the Ministry of Tourism and Antiquities. Samples were sent to the IFAO Laboratory in Cairo.
The samples comprised four linen textile wrappings from the body, and one wood piece from the coffin of Djau, with 20–29 g taken for each sample. Visually, the textile wrappings appeared clean, but it was impossible to identify the original position of the wrappings on the body, as they were all wrapped together in the storage unit (Ikram in Kanawati et al. Reference Kanawati, Alexakis, Ikram, McFarlane, Schultz, Shafik, Thompson, Victor and Walker2013). The wood sample comprised three separate pieces of the same wood from Djau’s coffin; the wood type was not identified.
Digital Microscopic Observation
In order to ensure the samples were not contaminated with organic chemicals related to previous embalming rituals or restoration work, observations on the textile samples were made using a portable digital microscope (DinoLite Edge) using visible and UV lights controlled by a flexible LED, with a magnification of 20–220×.
ATR-FTIR Control
ATR-FTIR (Attenuated Total Reflection – Fourier Transform InfraRed spectroscopy) analyses were carried out at the IFAO Laboratory, on a Nicolet Is5 instrument (Quiles et al. Reference Quiles, Lebon, Bellot-Gurlet and Bickel2022). Acquisition was done using the ATR-diamond module of the Nicolet (ThermoScientific), and absorbance was recorded between 4000 and 400 cm–1 with a resolution of 4 cm–1, by accumulating 128 scans for each spectrum. The band at 1030 cm–1, which is the most intensive one on a pure linen spectra, was used to set all spectrum at the same intensity and thus allows for normalization and comparison between spectra. For each sample, three analyses were carried out to check the repeatability of the result.
Cleaning Pretreatment
Samples were subjected to radiocarbon analysis using the routine protocol running at the IFAO Laboratory (Quiles et al. Reference Quiles, Sabri, Abd el-Fattah and Mounir2017). After physical cleaning, around 20 g of samples are chemically pretreated by AAA protocol [HCl, 8% (80°C); NaOH, 0.1–0.5N; HCl 8%] and then rinsed and cleaned using an automated ultrapure water system based on sand, bacteria, UV and resin filters.
Conventional Liquid Scintillation Counting
Combustions are performed using a combustion bomb. Samples are placed in a stainless-steel cup inside the bomb, in contact with a tungsten filament and in a stream of around 10 bars of oxygen, under an accurate vacuum (∼10–1 mbar). The CO2 gas is then purified using ethanol traps (–80°C) and collected in liquid nitrogen cooled traps (–196°C). A subsample of the purified CO2 is collected to measure the δ13C value by IRMS on a Thermo Delta V Plus at the Stratochem Laboratory in Cairo. CO2 is then slowly released into a furnace in the presence of molten lithium in stoichiometric quantity with an excess of 1 g to form lithium carbide (Li2C2). Once the lithium carbide is cooled, it is then slowly hydrolyzed into acetylene gas (C2H2) using tritium-free water. The acetylene gas is purified by passing successively through ethanol (–80°C) and orthophosphoric acid (H3PO4) bubble traps, and finally trimerized to benzene using an alumina-vanadium-chromium catalyst. Liquid benzene at atmospheric pressure is finally stored in glass vials in the refridgerator prior to being measured.
A cocktail of Bis-MSB and butyl-PBD scintillators dissolved in equal ratio in 4 mL benzene solution is then prepared to be measured on two Perkins Elmer Tricarb 3100 liquid scintillation counters. Each sample is measured around eight 1000 min run-times.
The 14C activity is calculated in percent relative to the activity of an international standard of oxalic acid NIST SRM 4990C (OxII), using the Libby half-life (5568 yr) and taking into account the isotopic fractionation normalised to –25‰ (versus VPDB) (Stuiver and Polach Reference Stuiver and Polach1977; Mook and van der Plicht Reference Mook and van der Plicht1999). Radiocarbon densities are converted into calendar ages using the IntCal20 calibration curve (Reimer et al. Reference Reimer, Austin, Bard, Bayliss, Blackwell and Bronk Ramsey2020) using the OxCal4.4 software (Bronk Ramsey Reference Bronk Ramsey1995).
Bayesian Modeling
Bayesian statistics were used to model the 14C results so as to simulate the accession date of king Pepy II, by also incorporating historical and textual information. All the modeling was done using OxCal 4.4 software (Bronk Ramsey Reference Bronk Ramsey1995, Reference Bronk Ramsey2009a, Reference Bronk Ramsey2009b, Reference Bronk Ramsey2017), using the IntCal20 calibration curve (Reimer et al. Reference Reimer, Austin, Bard, Bayliss, Blackwell and Bronk Ramsey2020).
RESULTS
Digital Microscopic Observations
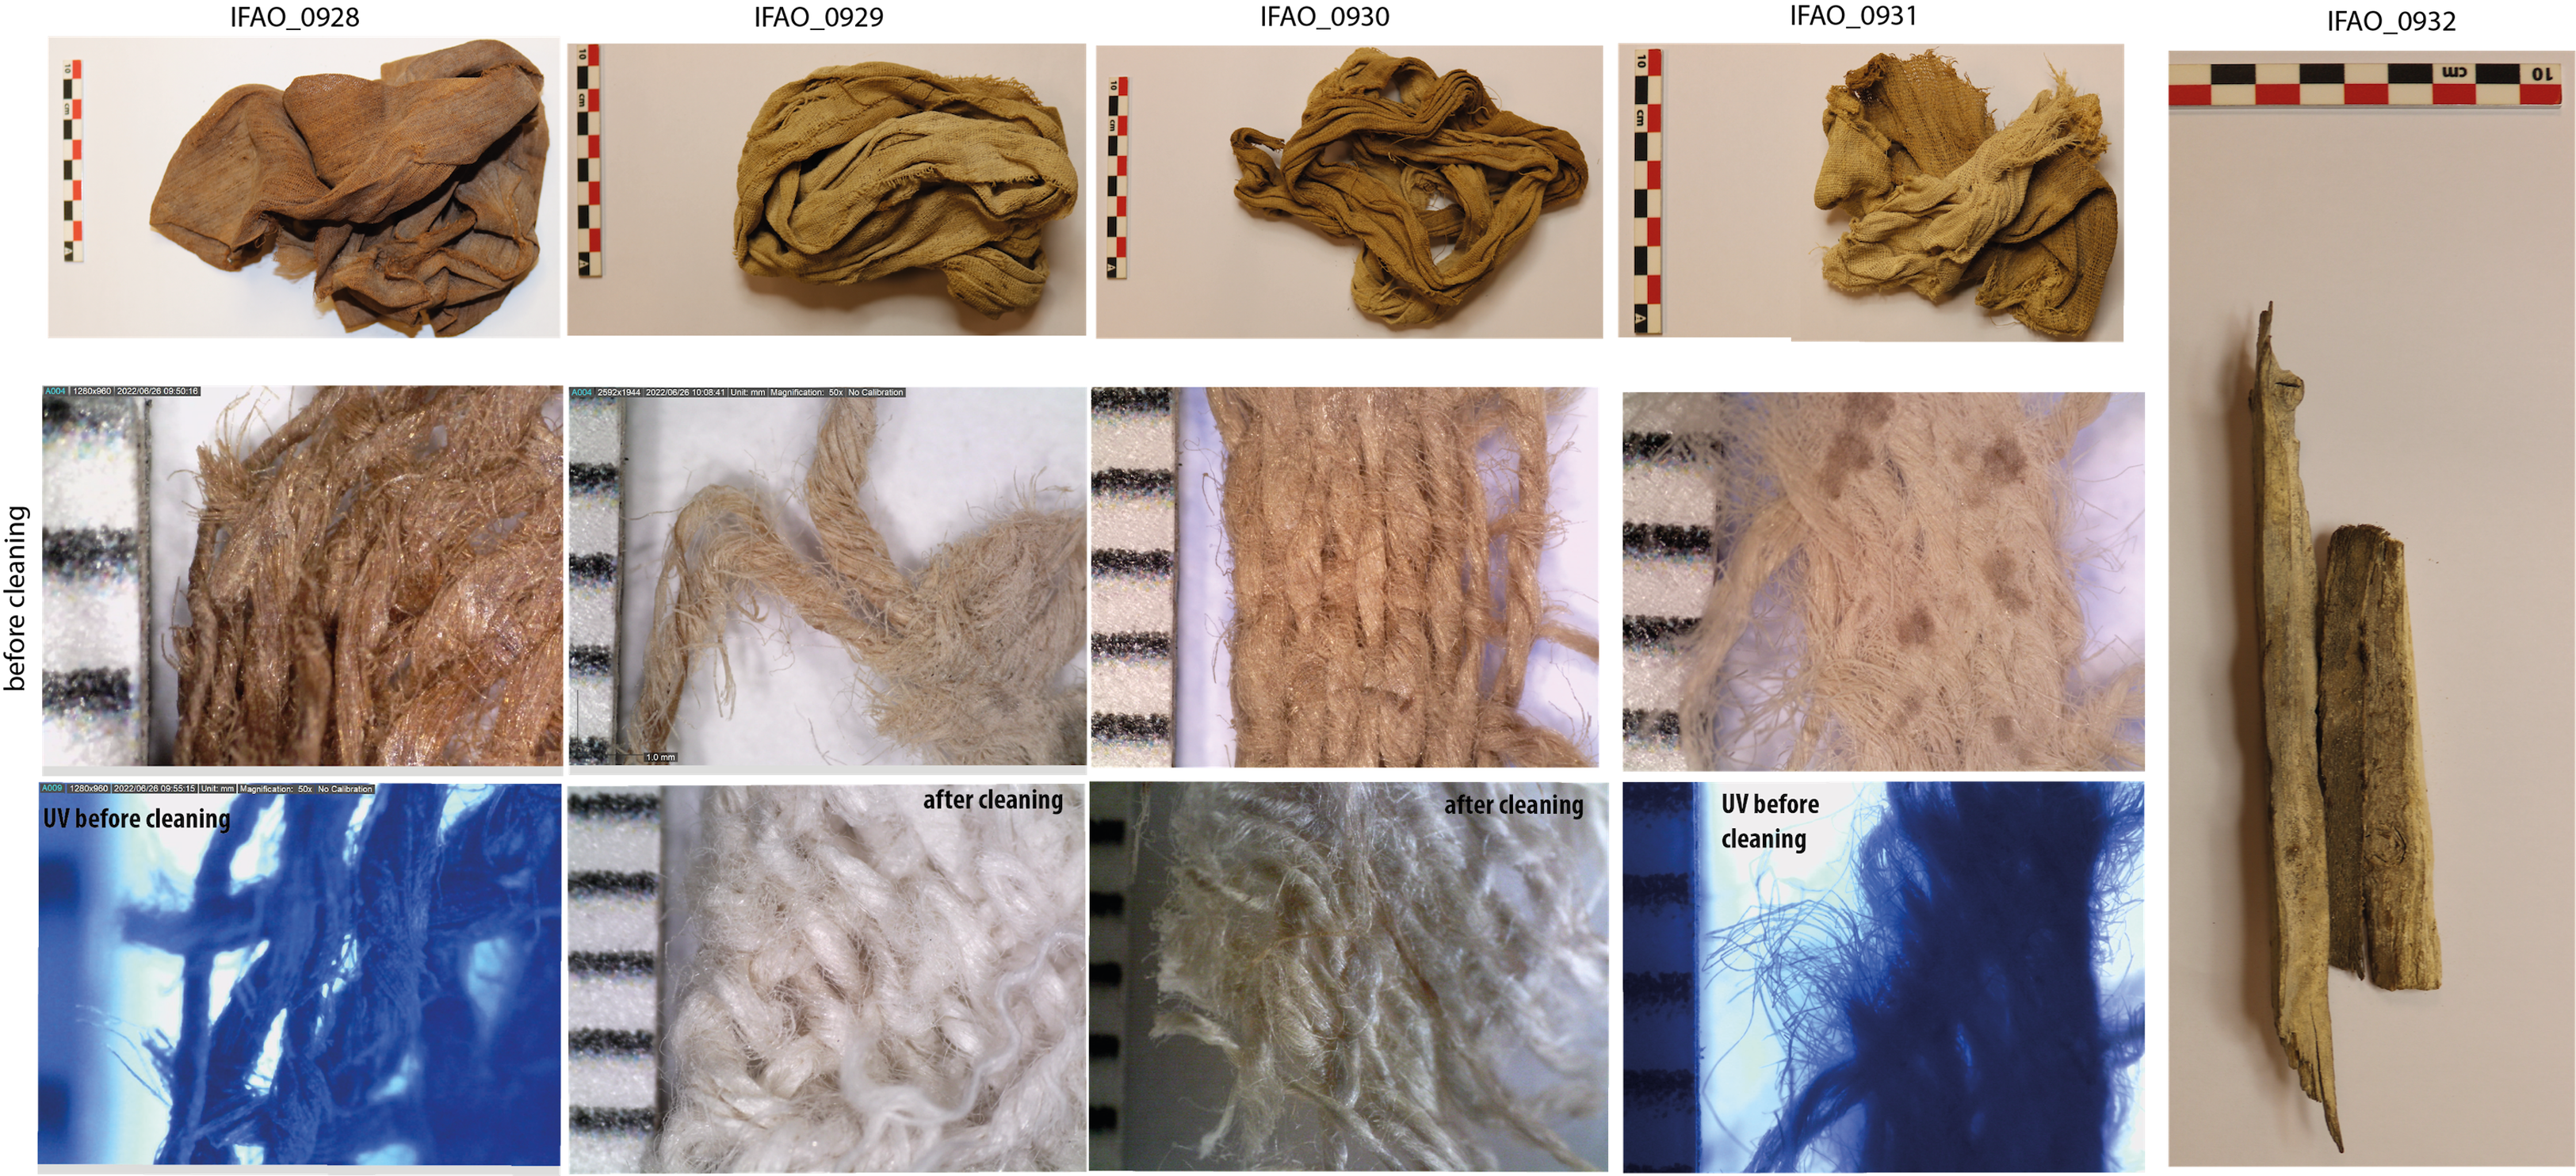
All four textile samples were observed with both visible and UV lights before cleaning began. In the case of contamination by resins or fossil residues such as bitumen, a strongly resistant black material was visible. Two samples seemed slightly darker (IFAO_0928 and IFAO_0930) than the others (Figure 3), but no clear contamination was identifiable. The same observations were made again after the pretreatment cleaning, and the samples appeared much whiter (Figure 3, bottom center).
Collected samples from Djau’s burial (above) digital microscopic (40×) observations of the four textile samples (IFAO_0928 to IFAO_0931) before cleaning using visible light (center), UV light (bottom, right and left), and after cleaning (IFAO_0929 and IFAO_0930, bottom, center). Photo by A. Quiles, IFAO.
ATR-FTIR Analyses
Given the possible challenge in dating textiles from Egyptian mummies, which could have been embedded by organic chemicals due to embalming process (Sowada et al. Reference Sowada, Jacobsen, Bertuch, Palmer and Jenkinson2011; Quiles et al. Reference Quiles, Delque-Kolic, Bellot-Gurlet, Comby-Zerbino, Ménager, Paris, Souprayen, Viellezcases, Andreu-Lanoe and Madrigal2014; Ferrant et al. Reference Ferrant, Caffy, Cortopassi, Delque-Količ, Guichard, Mathe, Thomas, Vieillescazes, Bellot-Gurlet and Quiles2022), ATR-FTIR analyses were performed both on the raw and the cleaned samples. This is a control step to evaluate the most efficient pretreatment protocol to be applied to the sample, but also to check that this protocol has removed all organic contaminants.
ATR-FTIR spectra of the four raw samples are gathered in Figure 4 and compared to the spectrum of modern linen.
ATR-FTIR spectra obtained on raw textile samples before cleaning, and comparison to a modern linen textile (in red). Bands linked to cellulose are identified (2917 and 2850 cm–1, 1735 cm–1 and 1640 cm–1). (Please see online version for color figures.)

The linen spectra displays the C-H bands at 2917 cm–1 and 2850 cm–1, the C=O/C=C area with the stretching carboxyl band at 1730 cm–1 and the more intense 1640 cm–1 band linked to adsorbed water and carbonyl function, as well as the C-O-C area for the glycosidic function which characterizes the cellulosic material, centred on 1030 cm–1. The latter is the most intense, which is the reason why all spectra were normalised at the 1030 cm–1 band to allow for quantification. The four spectra of ancient textiles display a close signature (IFAO_0928 to IFAO_0931, Figure 4).
In the case of contaminations by resins or fossil residues, as shown in Ferrant (Reference Ferrant2021), the presence of diterpenic or triterpenic resin is identified by the carbonyle C=O band respectively centred at 1695–1690 cm–1 and 1705–1700 cm–1. The FTIR spectra of bitumen is close to that for the resin, but could be differentiated by the presence of a vibrational band at 1602 cm–1, corresponding to the elongation of the aromatic C=C. None of these were identified (Figure 4), indicating the absence of such organic contamination.
The two bands at 2917 and 2850 cm–1, visible on the modern linen spectrum (Figure 4), are supplanted by a shoulder centered on 2900 cm–1 which shows the degradation of the hemicellulose due to thermal ageing (Ferrant Reference Ferrant2021). In addition, the band at 1730 cm–1 has disappeared on the four ancient samples, whereas the one at 1630 cm–1 has grown up. This band is more intense for sample IFAO_0928, which could suggest stronger thermal ageing, even if it seems quite inhomoegenous within this textile (Figure 4, blue spectra). For sample IFAO_0929, bands of calcite are identified (1420 cm–1, 873 cm–1, and 717 cm–1).
Besides, if the textile had been soaked in an organic contaminant (e.g., resin, bitumen), the CH shoulder (double band at 2900 and 2850 cm–1) and a double band in the CO/C-C region (1710 and 1700 cm–1) would be visible, but they are not present here (Figure 4; Ferrant Reference Ferrant2021). Thus the whole displays only natural degradation of the hemicellulose of wrapping samples but no additional organic contaminant is attested, therefore the A-B-A routine pretreatment has been applied.
Figure 5 compares the ATR-FTIR spectra obtained on samples IFAO_0929 and IFAO_0930 before and after cleaning, and compares them to that of a modern linen. No clear evolution is evidenced in the CH area (3000–2800 cm–1). The main variation is in the 1400–1300 cm–1 area. In the spectra of the two cleaned samples, the band at 1420 cm–1 is much less intense and has moved to the band at 1310 cm–1, which shows that sediment residues were removed (Ferrant Reference Ferrant2021). Unlike sample IFAO_0929, the spectrum of the cleaned sample is fully consistent with the others, and its extensive band at 1630 cm–1 is no longer present. In particular, the calcite bands are no longer present, showing that the calcite contamination has been fully removed.
Comparison of FTIR spectra on samples IFAO_0929 and IFAO_0930 before and after cleaning. Modern linen spectrum is in red.

These FTIR analyses prove that this pretreatment protocol was sufficient enough to ensure these textile samples are free of organic contamination and can therefore be safely radiocarbon dated.
14C Results
14C results extend from 3945 ± 30 BP to 3823 ± 30 BP (Table 1). Regarding δ13C values, wrapping samples are from –25.7 to –24.9‰ as expected for linen samples, and the wood sample reaches –26.1‰, consistent with a C3 organism. Calibrated densities were obtained using OxCal4.4, using the IntCal20 calibration curve (Figure 6a). Results for both textiles and the wood samples are fully consistent, their accumulated densities extend from 2569 to 2134 calBCE (Figure 6b). These results are consistant with the single 14C date of 3979 ± 29 BP obtained by the Oxford Chronology Project for the reign of a royal predecessor, king Pepy I-Meryre (Bronk Ramsey et al. Reference Bronk Ramsey, Dee, Rowland, Higham, Harris, Brock, Quiles, Wild, Marcus and Shortland2010).
Five 14C analyses were carried out at the IFAO laboratory on textile as well as wood samples from Djau’s burial.

Calibrated densities obtained on the five samples from Djau’s burial. Textiles are in black, except one in orange (possible outlier?), whereas the wood sample result is in red. (a) comparison of the five densities; (b) stack densities; (c) densities reported on the IntCal20 calibration curve.

Length of Pepy II’s Reign
The studied period—the end of the Old Kingdom—is chronologically problematic, not only due to the lack of radiocarbon dates, but owing to disputes over the exceedingly long reign of Pepy II. Indeed, the still-debated matter about the system of census years computed during the Egyptian Old Kingdom is a crucial point for safely estimating the length of kings’ reigns (Baud Reference Baud, Hornung, Krauss and Warburton2006; Nolan Reference Nolan, Vymazalová and Bárta2008; Verner Reference Verner, Vymazalová and Bárta2008). Under certain kings (or dynasties?), the counting of years, linked to the cattle census, was carried out not every year, but every two years. The computation of regnal years was therefore sometimes done with reference to a “year of the cattle census – rnpt zp –” or to a “year after the year of the cattle census – rpnt (m)-ḫt zp –”. The difficulty is knowing under which reigns this was effective, and whether it was a definitive rule, or a one-off within the reign itself. This is a crucial question in assessing the length of the reigns of Old Kingdom kings, as according to a biennial census system, reigns could be up to twice as long.
Manetho gives Pepy II 94 years, and the Turin Papyrus gives him 90+ years. The highest known census for this king is the year after the year 31 (rpnt (m)-ḫt zp 31, ȝbd 1 šmw sw 20), from a graffito found in Hatnub (Middle Egypt, Hatnub Gr. 7=CNW 6) (Gourdon and Enmarch Reference Gourdon and Enmarch2017:238; Baud Reference Baud, Hornung, Krauss and Warburton2006:156; Verner Reference Verner, Vymazalová and Bárta2008:38).
Yet whether these were biennial, annual or irregular, and whether there are no higher censuses, now lost, is very much disputed. If a regular annual census is impossible because several attestations of year after (rnpt (m)-ḫt zp) are documented, the regularity of the biennial census is not definitively demonstrated. Different systems – a regular biennial census as well as an annual census with sometimes post-census – have been suggested by scholars (Baud Reference Baud, Hornung, Krauss and Warburton2006). This clearly shows that Pepy II’s reign cannot have been shorter than 30+ years, and could have been as long as 62+ years, although it is not possible to say which of the two possibilities is more likely on current knowledge.
In three recent and authoritative studies of Egyptian chronology, Shaw suggestes Pepy II’s reign between 2278 and 2184 BCE (Shaw Reference Shaw2003), von Beckerath allocates Pepy II a reign of 60 years between 2279 and 2219 BCE, or between 2229 and 2169 BCE (von Beckerath Reference Von Beckerath1997:151–152). Conversely, Michel Baud gives him 34 years if the count was annual and 62/63 years if it was biennial, but concluded that Pepy II reigned between 2216 and 2153 (Baud Reference Baud, Hornung, Krauss and Warburton2006:156).
Ibi was probably appointed as nomarch of the 12th nome under the reign of Pepy II’s predecessor king Merenre, and later to the 12th nome under Pepy II; on historical evidence Ibi likely died before the middle of Pepy II’s reign (Kanawati et al. Reference Kanawati, Alexakis, Ikram, McFarlane, Schultz, Shafik, Thompson, Victor and Walker2013:23–24). On textual and archaeological grounds, the career of Djau/Shemai, father of Djau, appears to have been relatively short and did not extend much beyond the middle of Pepy II’s reign. He also appears to have been a man of mature years on succeeding his father, yet he still managed to accumulate many titles of office. Thus possibly Djau succeeded his father around the middle of Pepy II’s reign; if Djau/Shemai had his first son, Djau, in the first 5 to 10 years of Pepy II’s reign, Djau would have died 50–65 years after its commencement.
14C Modeling
Plotting the results on the calibration curve allows two important observations. The wood sample (IFAO_0932) provides a slightly older age than the other three textiles (Figure 6c). But this is understandable as the wood used to make the coffin of Djau was not cut at the time of the Djau’s death, but necessarily before. Of the four textiles, one result (IFAO_0930) appears slightly older than the others. This cannot be due solely to the method related to the plateau age at 2450–2250 calBCE, since the calibrated density is outside this plateau age. It is known that the textiles used for mummification may have been recycled, as most of them were not new when used for mummification, so had been made only a few years earlier. Thus, this sample is more likely an outlier and should be down-weighted in the modeling accordingly.
A previous study (Dee et al. Reference Dee, Brock, Harris, Bronk Ramsey, Shortland, Higham and Rowland2010) has suggested a variation of radiocarbon activity of 19 ± 5 14C yrs to the IntCal curve for the Nile valley due to a seasonal effect, revised to 16 ± 4 using IntCal20 (Manning et al. Reference Manning, Wacker, Büntgen, Bronk Ramsey, Dee, Kromer, Lorentzen and Tegel2020a, Reference Manning, Kromer, Cremaschi, Dee, Friedrich, Griggs and Hadden2020b). It is consistent with current investigations corroborating this offset for plants having grown up close to the Nile (Quiles et al. Reference Quiles, Invernón, Beck, Delque-Kolic, Gaudeul, Muller and Rouhan2021), and has been integrated in the modeling.
This set of results was then used to model the time of Djau’s death. Tests have been run to determine the most suitable tool for summarising the whole set of data, by comparing Sum and Kernel Density Estimate tools (Bronk Ramsey Reference Bronk Ramsey2017). The second one clearly enables the suppression of noise and provides more robustness compared to the Sum densities. The R_Combine tool was also tested to summarise the four textile samples into one density, since they come from wrappings derived from the same person. But this tool cannot be used to integrate the result of the wood sample as well.
In addition, Outlier distributions were modeled based on our observations. The four textiles were down-weighted using a symmetric Student’s t-distribution with 5% probability (General Outlier model) as defined in Bronk Ramsey (Reference Bronk Ramsey2009b), with a prior of 5% except IFAO_0930 which was set to 85%. The wood sample’s result was modeled using a Charcoal outlier density with a prior set to 100%. The resulting model using KDE_Model shows the death of Djau should not have occured later than 2200 BCE (Figure 7).
Estimated KDE_Model distribution integrating the 14C results of samples from Djau’s burial (in dark gray). The blue line and lighter blue band over it indicate the mean ±1σ for the snapshots of the KDE distribution generated during the MCMC process. The “Sum” distribution is shown in the light gray band for comparison (from Bronk Ramsey et al. Reference Bronk Ramsey2017). It shows how the KDE_Model considerably removes the noise.

DISCUSSION
The End of the Egyptian Old Kingdom
The death of Djau is a crucial piece of historical information because it is contemporany with the end of the Old Kingdom. Indeed, the examination of the human remains of Djau concluded that he most likely died at 55–60 years of age; an age between 50 and 65 years is also possible. He was an old man, and had presumably a reasonably long tenure as nomarch (see Schultz and Walker in Kanawati et al. Reference Kanawati, Alexakis, Ikram, McFarlane, Schultz, Shafik, Thompson, Victor and Walker2013:64–78).
Among the objects found under the coffin base was a schist tablet inscribed for Djau (Kanawati et al. Reference Kanawati, Alexakis, Ikram, McFarlane, Schultz, Shafik, Thompson, Victor and Walker2013:28, 57–58, Pls 35–37) (Figure 8). He is shown on the left, seated before an offering list. Depicting the tomb owner’s figure is significant, as following the introduction of animate figures, both humans and animals, in the decoration of burial chambers for a very short period at the end of the Fifth Dynasty, such figures were eliminated, to reappear towards the end of the Sixth Dynasty (Dawood Reference Dawood2005:107–127; Kanawati Reference Kanawati2006). Thus the inclusion in the burial chamber of such an object showing Djau’s figure among his funerary objects may support a very late period in Pepy II’s reign, or immediately after. This find helps underscore the temporal density associated with Djau’s death as a chronological marker for the death date of king Pepy II.
Offering tablet showing Djau on the left. Excavation Reg. No. DGS06:1. Photo © E. Alexakis, Australian Centre for Egyptology.

As a comparison with the result obtained from the KDE_Model (Figure 7), another model has been tested. It sequences a Phase surrounded by Boundaries, within which were gathered a R_Combine with the four textile results, and the wood sample’s result as a single date. This modeling is only authorized because the four samples come from wrappings on the same body, keeping in mind that the samples come from separate pieces of textile. However, since all the integrated results are associated with the death of Djau—a single, brief event—the two simulated boundaries are standing for the same historical event. Their overlap is therefore a good indicator of the most plausible time at which this event took place. The correlation plot between the two simulated boundaries (Figure 9) is consistent with the result of the KDE_Model density and shows the consistency of the modeling.
Correlation plot between the boundaries standing for the start and the end of the event “Death of Djau,” which can also be considered very close to the end of the Old Kingdom. The plot clearly shows it occurred no later than 2200 BCE.

From this, we can consider the death of Djau as a strong dating proxy for the end of the historical Old Kingdom and thus, the emergence of the First Intermediate Period, which should have occurred no later than 2200 BCE.
From Djau’s Death to Pepy II’s Accession Date
The time of Djau’s death can also be used to model the accession date of Pepy II. From historical information (see above), we know that Djau died late in the reign of Pepy II, thus his reign began from 15 to perhaps 60 years before Djau’s death. Indeed, depending on the regularity of the biennial census, his reign may have lasted from about 30 to 60 years. If we estimate that Pepy II’s reign lasted 30 years, it is certain that Djau did not die during the first 15 years (first half), but possibly between the 15th and 30th year. If his reign lasted 60 years, then Djau’s death most likely occurred between the years 30 and 60. If the lower limit is a strong constraint (we are certain that Djau did not die during the first 15 years of Pepy II’s reign, whatever the census method), the upper limit of this interval must remain slightly flexible. We have therefore decided to limit it from 15 to 55 years approximately, with more flexibility on the second interval (Figure 10a).
Modeling of the accession date of king Pepy II using results of samples from Djau’s burial. (a) modeled interval between the death of Djau and the start of king Pepy II’s reign; (b) modeling using KDE_Plot for summarizing the five 14C results; (c) modeling using R_Combine tool for summarizing the four textile samples.

Boundaries were added in sequence with the KDE_Plot distribution to simulate the start of Pepy II’s reign. The time interval between both events was simulated by combining tools After() and Before(), and by integrating a flexible Student law centered on 55 yrs (Figure 10a):
 $${{After\left( {15} \right)\ \& \ Before}\ (55 + 10*T(5))}$$
The accession date for Pepy II is thus modeled around 2492 to 2256 BCE with 95.4% probability, and from 2422 to 2297 BCE with 68.3% probability (Figure 10b).
The model was run again using the same comparison test as before. In the Sequence, the five samples were summarized within a Phase, the four textile ones being in a R_Combine tool, down-weighted using the Outlier_model Combine (Bronk Ramsey Reference Bronk Ramsey2009b). From it, the accession date for Pepy II is from 2457 to 2226 BCE with 95.4% probability and from 2366 to 2252 BCE with 68.3% probability (Figure 10c).
The modeling of the length of Pepy II’s reign remains quite flexible, especially on the upper limit. As a comparison, we have run again the KDE_Model by testing an estimated length of reign based on an annual census (from 15 to 30 yrs only), and then on a regular biennial census (from 30 to 60 yrs). As shown Table 2, simulated temporal ranges are not drastically different and the result does not change significantly.
Modeling Pepy II’s accession date depending on the years census modus.

In the present state of our knowledge, we do not have sufficient arguments to favour a regular or irregular biennial census, so the hypothesis we have retained seems the most accurate.
This result on the Pepy II accession date should be considered a preliminary result, not only because this model is based on only five radiocarbon dates and is therefore not fully convergent, but especially because the plateau age around 2450–2200 BCE on the calibration curve tends to extend the simulated densities slightly towards older ages. This is clearly supported by the result of the second model (using R_Combine), which is much more restrictive than the first (using KDE_Plot) and provides a slightly younger age density. For all these reasons, it seems reasonable to consider the youngest part of the density as the most plausible for the accession date of king Pepy II.
Compared to the historical chronologies, this result favours the consensus chronology and von Beckerath’s higher date more than the suggestions placing the beginning of Pepy II’s reign around 2220 BCE (Figure 11).
Comparison of the modeled density obtained for the accession date of king Pepy II, with suggested starting dates made by several scholars based on historical studies. (left) Shaw (Reference Shaw2003), (middle) von Beckerath (Reference Von Beckerath1997) made two suggestions according to a high or low chronology, (right) the lower chronology of Baud (Reference Baud, Hornung, Krauss and Warburton2006). The “consensus chronology” date from Shaw aligns with the higher date of von Beckerath. *The widths of the bars are approximate.

CONCLUSION
The importance of these results must be stressed, owing to the scarcity of the archaeological material studied, perfectly contextualised and dating from a historical period for which the availability of samples in museum collections is very low (Bronk Ramsey et al. Reference Bronk Ramsey, Dee, Rowland, Higham, Harris, Brock, Quiles, Wild, Marcus and Shortland2010). The same can be said for the analytical method involved (LSC), which requires collecting quantities of material that are sometimes difficult to gather and therefore makes its application challenging. By combining all the available historical, archaeological and radiocarbon data, we can suggest an age for the accession date of king Pepy II that brings together an updated and integrative state of our knowledge. Modeled radiocarbon dates obtained from textile samples of Djau’s mummified body and coffin from the site of Deir el Gebrawi in Middle Egypt, help define a date no later than ca. 2200 BCE for his death. When placed against historical, archaeological and bioarchaeological evidence for the life and career of Djau, and historical evidence for Pepy II, it is postulated that his reign ended at or before that time.
Further analysis will be needed to narrow these initial results. But in order to build a precise and robust model for the Old Kingdom, it is above all a question of integrating as many independent constraints as possible, linked to several different kings of the Old Kingdom. This will assist in establishing anchor points in a general model, making it possible to simulate age densities of the reigns for which we have no information. This is the objective of the MERYT programme (ANR-19-CE27-0010). Through various case studies, we are progressively modeling age densities associated with different kings of the Old Kingdom or just before (e.g., king Den, Quiles and Tristant Reference Quiles and Tristant2023). By working mostly on samples currently excavated in Egypt, and collected in discussion with the archaeologists responsible for the excavations, we maintain a dialogue that is essential to ensure the association between the historical data (the related king) and radiocarbon data. Then, we will assemble all the results in the Meryt chronological model, of which a first version is expected in 2024.
ACKNOWLEDGMENTS
The 2019 expedition to Deir el-Gebrawi and radiocarbon dating was conducted under the auspices of the Australian Centre for Egyptology (Macquarie University, Sydney) and the Institut Français d’Archéologie Orientale (IFAO, Cairo). It was funded by Australian Research Council Future Fellowship Grant FT170100288 “Pyramids, power and the dynamics of state in crisis” led by Dr Karin Sowada, Macquarie University and the French ANR (ANR-19-CE27-0010) MERYT led by Dr Anita Quiles. We warmly thank the Ministry of Tourism and Antiquities and the Centre for Research and Conservation in Cairo for permission to take the samples at Deir el-Gebrawi, and to the Director of the Assyut Inspectorate, Mr Mahmoud Mahdy, and his staff for their generous assistance in making this project possible.


 Open access

