

1. Introduction
Coronavirus (COVID-19) is one of the worst catastrophes across the world since 2019. As of 19 July 2020, about 14 million cases of COVID-19 and 0.6 million deaths have been reported across more than 188 countries. Developing COVID-19 policies has become an essential task for governments and decision makers to protect their citizen and the economy (see, for example, S. Chen et al., Reference Chen, Yang, Yang, Wang and Bärnighausen2020; Fang et al., Reference Fang, Nie and Penny2020; Hale et al., Reference Hale, Petherick, Phillips and Webster2020; Lin et al., Reference Lin, Zhao, Gao, Lou, Yang, Musa and He2020; Sebastiani et al., Reference Sebastiani, Massa and Riboli2020).
Countries and governments have put a lot of effort into protecting the public from the COVID-19 pandemic and into developing recovery plans (see, for example, Cao et al., Reference Cao, Li, Chen, Guo, Miao, Yang and Li2020; Collaborative et al., 2020; Ramanathan et al., Reference Ramanathan, Antognini, Combes, Paden, Zakhary, Ogino and Shekar2020; Shaker et al., Reference Shaker, Oppenheimer, Grayson, Stukus, Hartog, Hsieh and Chan2020; Shoenfeld, Reference Shoenfeld2020). For example, the European Council (2020) reports that EU leaders agreed on an overall budget of €1.824 trillion for 2021–2027, combining the multiannual financial framework (MFF) and an extraordinary recovery effort, and Next Generation EU (NGEU) to support EU citizens from the economic downturn caused by the COVID-19 pandemic.
Scholars have examined how COVID-19 plays an important role in human welfare and economic status (see, for example, Brodin, Reference Brodin2020; Jandrić, Reference Jandrić2020; Le et al., Reference Le, Andreadakis, Kumar, Roman, Tollefsen, Saville and Mayhew2020; Liu et al., Reference Liu, Zhou, Li, Garner, Watkins, Carter and Albaiu2020; Shereen et al., Reference Shereen, Khan, Kazmi, Bashir and Siddique2020). For instance, Hollander and Carr (Reference Hollander and Carr2020) highlight that an estimated basic reproduction number (R0) of 2.2 means that each infected person spreads the infection to an additional two persons, and so the outbreak will continue to spread until the reproduction number falls below 1.0. Fernandes (Reference Fernandes2020) reports that French GDP was previously forecasted to grow by 1.2% in 2020, whereas the estimated growth rate is –2% when taking into account the economic impact of the crisis.
However, prior studies have barely investigated how people communicate with each other to get information on COVID-19 in order to cope with the ongoing pandemic (see, for example, Bonaccorsi et al., Reference Bonaccorsi, Pierri, Cinelli, Flori, Galeazzi, Porcelli and Pammolli2020; Borges do Nascimento et al., 2020; Campbell, Reference Campbell2020; Chakraborty and Maity, Reference Chakraborty and Maity2020; Oliver et al., Reference Oliver, Lepri, Sterly, Lambiotte, Deletaille, De Nadai and Colizza2020). For instance, Karami et al. (Reference Karami, Bookstaver, Nolan and Bozorgi2021) employ frequency analysis to find highly frequent manifestations and therapeutic chemicals based on 9298 papers representing COVID-19 research. Understanding communication networks is very important, since governments and centres for disease control could provide valuable information about COVID-19 and spread government policies in a timely manner. In addition, previous articles have barely explored how people have different online networks according to the different countries in which they reside. We can assume that people have different communication systems according to their race, society, culture, and geography. Therefore, the research question of this study is how do people have different social networks for COVID-19 according to their countries?
To answer the question, this study explores the social networks for COVID-19 across countries by employing Social Network Analysis (SNA) for Twitter, which is one of the most popular Social Network Services (SNS). This study explores the social networks for COVID-19 in six European countries: the United Kingdom (UK), Spain, Italy, Germany, France, and Sweden (in descending order by patient numbers in Europe as of 19 July 2020) (see Table 1). To the best of the author’s knowledge, this is the first article exploring social networks with respect to COVID-19 for SNS across European regions.
COVID-19 in Europe as of July 19, 2020

Source: Google news
2. Literature Review
COVID-19 is a new disease caused by a strain of coronavirus. COVID-19 was first identified in December 2019 in Wuhan, China, and has become an ongoing global pandemic. The World Health Organization (WHO) declared the outbreak a Public Health Emergency of International Concern on 30 January 2020 and a pandemic on 11 March 2020.
The COVID-19 pandemic has had significant effects on European countries. As of 13 March 2020, when the number of new COVID-19 patients became greater than those in China, WHO considered Europe to be the active centre of the COVID-19 pandemic. As of 17 March 2020, all countries within Europe had confirmed cases of COVID-19. Among European countries, six countries (the UK, Spain, Italy, Germany, France, and Sweden) have experienced the most severe damage from COVID-19. According to the European Centre for Disease Prevention and Control. (2020a), as of 19 July 2020, 1,620,084 cases have been reported in the EU/EEA and the UK: United Kingdom (294,066), Spain (260,255), Italy (244,216), Germany (201,574), France (174,674), Sweden (77,281). In addition, 180,524 deaths have been reported in the EU/EEA and the UK: United Kingdom (45,273), Italy (35,042), France (30,152), Spain (28,420), Germany (9,084), and Sweden (5,619).
Many organizations and centres for disease control have tried their best to minimize the damage caused by COVID-19. For instance, the European Centre for Disease Prevention and Control (ECDC) (2020b) releases a weekly COVID-19 surveillance report, which presents the epidemiological characteristics of COVID-19 cases reported to the European Surveillance System (TESSy) and assesses the quality of the data. ECDC (2020) also releases a Communicable Disease Threats Report every week, which covers COVID-19, to help epidemiologists and health professionals reduce active public health threats.
Many scholars have also attempted to highlight how COVID-19 is severely affecting human welfare and environments in Europe (see, for example, Flaxman et al., Reference Flaxman, Mishra, Gandy, Unwin, Mellan, Coupland and Monod2020; Kinross et al., Reference Kinross, Suetens, Dias, Alexakis, Wijermans, Colzani and Monnet2020; Lechien et al., Reference Lechien, Chiesa-Estomba, De Siati, Horoi, Le Bon, Rodriguez and Chekkoury-Idrissi2020). For instance, Lechien et al. (Reference Lechien, Chiesa-Estomba, De Siati, Horoi, Le Bon, Rodriguez and Chekkoury-Idrissi2020) reported that 263 female patients of COVID-19 from 12 European hospitals experienced coughs, myalgia, and loss of appetite the most. Flaxman et al. (Reference Flaxman, Mishra, Gandy, Unwin, Mellan, Coupland and Monod2020) show that major non-pharmaceutical interventions have had a large effect on reducing transmission across 11 European countries for the period from the start of the COVID-19 epidemic until 4 May 2020. Kinross et al. (Reference Kinross, Suetens, Dias, Alexakis, Wijermans, Colzani and Monnet2020) highlight that the number of COVID-19 patients is sharply increasing in the European regions. The observed trends in the cumulative COVID-19 cases reveal that the COVID-19 pandemic is progressing at a comparable speed in all European countries. Koch et al. (Reference Koch, Plattfaut and Kregel2021) show that public institutions have a substantial demand for IT jobs in the public sector labour market in Germany.
On the other hand, SNA (Social Network Analyses) based on big data have become some of the most important tools in the academic field. Many scholars have employed SNA to understand how social networks play an important role in coping with the COVID-19 pandemic (see, for example, Nielsen et al., Reference Nielsen, Simonsen and Sneppen2021; Rufai and Bunce, Reference Rufai and Bunce2020; Yum, Reference Yum2020a). For example, Nielsen et al. (Reference Nielsen, Simonsen and Sneppen2021) report that superspreading sharply stimulates mitigations that reduce the overall personal contact number, and that social clustering increases this effect based on social network modulation. Yum (Reference Yum2020a) highlights that the US presidents, the World Health Organization (WHO) and its regional offices, Centers for Disease Control, and news channels play a significant role regarding news of COVID-19 in the US.
Some scholars criticize that SNA have weak theoretical contributions, but these can be further utilized for theoretical model development (see, for example, Grover et al., Reference Grover, Lindberg, Benbasat and Lyytinen2020; Kar and Dwivedi, Reference Kar and Dwivedi2020). For instance, methodological contributions of SNA contribute to developing theoretical models using social media data (see, for example, Grover et al., Reference Grover, Kar and Davies2018; Kar, Reference Kar2020). The findings of this study would explain more about how people respond differently to the COVID-19 pandemic according to their countries and groups, which could contribute to theory building in international information and health communication research. For example, the findings are expected to contribute towards communication and health literature, such as improving theoretical coverage, reducing interference of noise, improving validity and reliability of models, strengthening causality linkages, reducing methodological biases, and developing theory that works well within limitations (see, for example, Aguinis and Edwards, Reference Aguinis and Edwards2014; Kar and Dwivedi, Reference Kar and Dwivedi2020).
3. Research Methodology
This study employs Twitter, which is one of the most popular online platforms, to highlight the social networks with respect to COVID-19 in European regions. Social media have become research tools for scholars to understand how people get important news and information about COVID-19 (see, for example, Cinelli et al., Reference Cinelli, Quattrociocchi, Galeazzi, Valensise, Brugnoli, Schmidt and Scala2020; Cuello-Garcia et al., Reference Cuello-Garcia, Pérez-Gaxiola and van Amelsvoort2020; Hussain, Reference Hussain2020). Among various social media, Twitter has been widely used for big data analyses in academic research (see, for example, Chow-White et al., Reference Chow-White, Struve, Lusoli, Lesage, Saraf and Oldring2018; Gayo-Avello, Reference Gayo-Avello2013; Nambisan et al., Reference Nambisan, Luo, Kapoor, Patrick and Cisler2015). For example, Chakraborty and Kar (Reference Chakraborty and Kar2021) highlight a typology of COVID-19 impacts focused on the education sector based on user-generated content from Twitter.
This study employs SNA based on big data analyses for Twitter. In the health communication literature, government agencies around the world have enthusiastically utilized Twitter to deliver important news and information to the public in crisis situations (see, for example, Ahmad and Murad, Reference Ahmad and Murad2020; Q. Chen et al., Reference Chen, Min, Zhang, Wang, Ma and Evans2020; Gao et al., Reference Gao, Zheng, Jia, Chen, Mao, Chen and Dai2020). From the theoretical background of big data analyses, social media platforms can enhance the responsiveness of governments to communicate COVID-19 information efficiently and effectively to their citizens (see, for example, Q. Chen et al., Reference Chen, Min, Zhang, Wang, Ma and Evans2020; Li et al., Reference Li, Chandra and Kapucu2020; Liao et al., Reference Liao, Yuan, Dong, Yang, Fielding and Lam2020).
In addition, in recent years, SNA have been carried out using data collected from social interactions in online platforms (see, for example, Bonchi et al., Reference Bonchi, Castillo, Gionis and Jaimes2011; Borgatti and Everett, Reference Borgatti and Everett1992; Ennett et al., Reference Ennett, Bauman, Hussong, Faris, Foshee, Cai and DuRant2006; Mizruchi, Reference Mizruchi1994; Streeter and Gillespie, Reference Streeter and Gillespie1993). As SNA have been developed as a methodology for analysing social relations among people, governments can use SNA to play an important role in overcoming difficulties due to COVID-19 by exploring social network structures and important key players (see, for example, Burt, Reference Burt1978; Block et al., Reference Block, Hoffman, Raabe, Dowd, Rahal, Kashyap and Mills2020; Hung et al., Reference Hung, Lauren, Hon, Birmingham, Xu, Su and Lipsky2020; Yum, Reference Yum2020a).
To be specific, this study utilizes Twitter data to highlight the online communications of people about COVID-19 across key players such as the news media, politicians and organizations. This study observes the Twitter data stream between 13 July and 20 July 2020 based on the keywords ‘COVID-19’ and the various countries, and chooses the best data set for the analyses (18 July and 19 July) based on some important criteria (e.g. the number of Twitter users, communications, and suitable content).
This study employs NodeXL to highlight the social networks of European regions for COVID-19. NodeXL is a visualization software program that supports social networks and content analysis. NodeXL has been widely utilized to understand social network systems in academic fields (see, for example, Jagals and Van der Walt, Reference Jagals and Van der Walt2016). This study employs the in-degree centrality to capture public key players for Twitter users (the explanation for in-degree centrality follows). This study chooses the top 10 key players among all Twitter users based on the magnitude of the in-degree centrality (see Table 2 for descriptive statistics).
Descriptive statistics

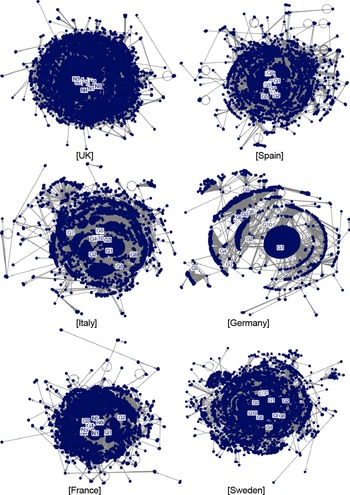
This study first calculates in-degree centrality, out-degree centrality, and closeness centrality to highlight social networks for COVID 19 in the European regions (see Figures 1–3). In-degree centrality measures the number of edges that point toward the vertex of interest. Out-degree centrality calculates the number of edges that the vertex of interest points toward (Hansen et al., Reference Hansen, Shneiderman and Smith2010). Closeness centrality measures the reciprocal of the mean geodesic distance, which is the shortest path between a node and all other reachable nodes (Freeman, Reference Freeman1978).

Out-degree centrality

Closeness centrality

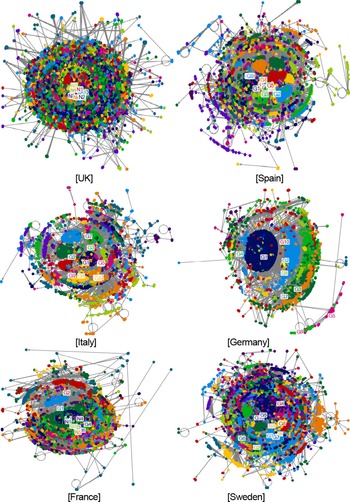
Next, this article explores the top 10 key players in European regions (see Tables 3–8: Table 3: the UK; Table 4: Spain; Table 5: Italy; Table 6: Germany; Table 7: France; and Table 8: Sweden). This study employs cluster analysis by utilizing the Clauset–Newman–Moore cluster algorithm (see Figures 4 and 5). Cluster analysis is a methodology for the task of assigning a set of objects into groups so that the objects in the same cluster are more similar to each other than those in other clusters. The Clauset–Newman–Moore cluster algorithm finds clusters of nodes that link to each other more frequently than outside the cluster (see, for example, Shneiderman and Dunne, Reference Shneiderman and Dunne2012). Figure 4 shows the social networks regarding COVID-19 for the typical case, and Figure 5 shows the social networks of six countries according to groups. This study considers hashtag analyses to understand people’s interests in COVID-19 across countries.
The top 10 key players in the UK

Note. ID: In-degree centrality, N: National key player, G: Global key player
The top 10 key players in Spain

The top 10 key players in Italy

The top 10 key players in Germany

The top 10 key players in France

The top 10 key players in Sweden

Social networks for the typical case

Social networks according to groups

The findings of this article will highlight the social network structures and the top public key players with regard to COVID-19 according to countries and groups, based on a multitude of centrality types, cluster analyses, and hashtag analyses. This can help theory building for big data-driven and social network research.
4. Results
Figures 1–3. highlight that social networks for COVID-19 are differentiated by countries and centrality types (Figure 1: in-degree centrality, Figure 2: out-degree centrality, and Figure 3: closeness centrality). For instance, all key players in the UK are concentrated in the central part of the networks, whereas those of Germany are dispersed across the whole network in in-degree centrality (see Figure 1). In addition, all key players in the UK are located more in the central part of the networks in the in-degree centrality, whereas they are more distributed in the networks in the out-degree centrality (see Figures 1 and 2).
In the UK networks, the most important characteristic is that the UK has all top 10 key players as national key players (see Table 3). The UK is the only country that has all national key players. This is the most different characteristic from other European countries, such as Spain, Italy, Germany, and Sweden, since they have all the top 10 key players as global key players. For example, The Telegraph, which is a national British daily broadsheet newspaper, ranks first. Public Health England, which is the executive agency of the Department of Health and Social Care in the UK, places second. Dominic Raab, who was the secretary of State for Foreign Affairs, takes third. Philip Lee, who is the doctor and consultant physician in acute medicine and medicine for the elderly ranks fourth. Jeremy Farrar who is the British medical researcher and director of the Wellcome Trust places fifth. Another remarkable characteristic is that the UK has many government key players in the top 10. For example, government key players place second, third, eighth, ninth and tenth (second: Public Health England, third: Dominic Raab, eighth: Yvette Cooper, ninth: Office for National Statistics, and tenth: Boris Johnson).
Nodes are heavily concentrated in the central circle, and some nodes are widely dispersed around the circle. All key players are highly placed in the centre of the circle (see Figure 4). The UK shows the most active communications across groups (see Figure 5). In addition, the UK is the only country that has all top key players within group 10. The result shows that key players exert a pivotal impact on large groups in the UK. For instance, Public Health England (N2) and Boris Johnson (N10) play a significant role in group 1. The finding highlights that government key players play a central role in the largest group in the UK. Jeremy Farrar (N5) and the Office for National Statistics (N9) have a crucial effect on Group 2. People are interested in ‘covid19’, ‘UK’, and ‘coronavirusoutbreak’, followed by ‘epidemic’ and ‘vaccine’ (see Table 9).
Hashtag analysis

In the Spanish networks, the most noticeable finding is that Spain is the only country that has WHO and Tedros Adhanom Ghebreyesus, who is the director general of the World Health Organization (WHO: ninth and Tedros Adhanom Ghebreyesus: tenth) (see Table 4). The result shows that the WHO only plays an important role in social networks for COVID-19 in Spain. In addition, channels of CNN, which is the American news-based pay television channel, play a significant role in social networks of Spain. For instance, CNN International ranks first, and CNN places third. Other news media exert a critical impact on the social networks of COVID-19. For instance, The Spectator Index, which is the online magazine website, takes second, and Reuters, the international news company, ranks fourth. ABC News, which is the American Broadcasting Company broadcast network, takes sixth, The Associated Press, which is the American news agency, ranks seventh, and BBC World News, which is the operational business division of the British Broadcasting Corporation, places eighth.
Nodes show more dispersed patterns, whereas key players are still concentrated in the central part of the circle (see Figure 4). Nodes in Spain tend to be concentrated as a circle in the groups (see Figure 5). CNN International (G1) is located in the centre of group 1, and The Spectator Index (G2) plays a crucial role in group 2. All key players are placed within group 10 except for the World Health Organization (G9) and Tedros Adhanom Ghebreyesus (G10). G9 and G10 exert a critical impact on the same group (group 14), and this result is reasonable since Tedros Adhanom Ghebreyesus is the Director General of the World Health Organization. People focus on ‘Spain’, ‘covid19’, and ‘nato’, ahead of ‘sciencesurprises’ and ‘china’.
In the Italian networks, the most significant finding is that news media play the most important role in the social networks for COVID-19 among all countries (see Table 5). For instance, eight out of the top 10 key players are news media, and they rank from first to eighth. For example, ABC News, which is the news division of American Broadcasting Company broadcast network, ranks first, and The Spectator Index places second. SkyNews, which is the British free-to-air television news, takes third, and The Daily Beast, which is the American news and opinion website, places fourth. NBC News NOW and NBC News, which are the channels of the American broadcast television network NBC, rank fifth and sixth, respectively.
Nodes show the most dispersed patterns, and ABC News (G1) is located in the centre of social networks (see Figure 4). All key players in Italy have their independent group except for NBC News NOW (G5) and NBC News (G6) (see Figure 5). They are located in the same group (group 9) since they are the channels of NBC News. ABC News (G1) plays an important role in group 1. Italy is the only country that has no key player in group 2 among six countries. Instead, The Spectator Index (G2) exerts a crucial impact on group 3. People add a hashtag to ‘covid19’, ‘beatcovid19’, ‘Italy’, ‘oceans’, and ‘china’ (see Table 9).
In the German networks, the critical finding is that people play an essential role in social networks for COVID-19 (see Table 6). For example, David Samadi, who is the board-certified urologist and the former chairman of urology and chief of robotic surgery at Lenox Hill Hospital, ranks first. Brian Klaas, who is the political scientist and columnist at the Washington Post, places third. Bernie Sanders, who is a US senator, takes fourth, and Max Roser, who is an economist, philosopher and media critic, and who focuses on large global problems, ranks ninth. Donald Trump, the US president, takes tenth.
Nodes reveal some layers, and key players exhibit the most diffuse patterns. For example, Financial Times (G5) and Max Roser (G9) are located in the outside of the main networks (see Figure 4). Nodes in Germany are heavily concentrated in group 1 (see Figure 5). In addition, Germany shows the least communication networks across the groups. People in Germany tend to communicate with each other within the groups. David Samadi (G1), The Spectator Index (G2), Brian Klaas (G3), and Bernie Sanders (G4) play important roles in group 1, group 2, group 3, and group 4, respectively. People use hashtag ‘Germany’, ‘covid19’ and ‘china’, followed by ‘schools’ and ‘studies’ (see Table 9).
In the French networks, the critical finding is that national key players have a more significant effect on social networks for COVID-19 than global key players (see Table 7). For example, France has six national key players, which is two more than global key players (four). To be specific, Conflits, which is the global news media in France for politics, terrorism, cyber security and health, ranks first. Le Parisien Infog (infographics) and Le Parisien, which are the French daily newspapers covering both international and national news, place sixth and seventh, respectively. Jean Messiha who is the French economist, senior civil servant and politician ranks eighth. Ouest-France, which is the daily French newspaper known for its emphasis on both local and national news, places ninth. LesNews, which is the latest information on Alert, Flash information, Breaking news in French, takes tenth.
Nodes are highly located in the South side of the circle, and key players are also placed in that part except for The Spectator Index (G2) (see Figure 4). Nodes in group 1 in France actively communicate with each other, not only within the group but also across groups (see Figure 5). Conflits (N1) has a high influence on the largest group (group 1), and The Spectator Index (G1) shows an important impact on the second-largest group (group 2). All key players have their independent group except for Le Parisien Infog (N2) and Le Parisien (N3). People have interests in ‘France’, ‘coronavirus’, and ‘masque’, which is a mask in English, and ‘encuesta’, which is a survey in English (see Table 9). The next hashtag is ‘caumes’, which is a department in northwest France named after the Mayenne River. For the sake of readers, the department of Mayenne in northwest France (Pays de la Loire) was on high vulnerability alert after new cases of Covid-19 were reported. The local authorities required masks to be mandatory in public. Mayenne was the first department in mainland France to be classed as a high vulnerability situation.
In the Swedish networks, websites and founders of health institutes, which do not rank in other countries, play a crucial role in social networks for COVID-19 (see Table 8). For instance, YouGov, which is the international internet-based market research and data analytics website, ranks second. Zerohedge, which is the news site for presenting staff-written articles and aggregating news and opinions from external sources, places fourth. STAT, which is the American health-oriented news website, takes seventh. Karol Sikora, who is the founder and medical director of Rutherford Health, ranks fifth, and Mike Galsworthy, who is the co-founder of Scientists for EU and Healthier IN, places sixth.
Nodes show a large circle, and key players reveal distributed patterns (see Figure 4). Nodes in Sweden exhibit active communication networks across the groups (see Figure 5). Karol Sikora (G5) plays an important role in group 1, and CBS News (G1) shows the central role in group 2. Zerohedge (G4) and Donald Trump (G8) have the same group (group 5), and Bloomberg and Bloomberg Politics are located in the same group as well (group 7). People type a hashtag ‘covid1’, ‘Sweden’, ‘fakenewsmedianarrative’, ahead of ‘herdimmunity’ and ‘lockdown’. Herd immunity occurs when the vast majority of people become immune to COVID-19, causing the spread of disease from person to person to become unlikely. As a result, it is possible the whole country becomes protected (see Table 9).
5. Discussion
COVID-19 has become the most important issue across the world since 2020. Understanding the COVID-19 pandemic has become one of the top priorities for governments and Centres for Disease Control and Prevention in order to protect their citizens’ lives. Against this background, this study sheds new light on understanding different social networks for COVID-19 across various European countries by employing SNA for Twitter.
This study has some important implications. It highlights how people develop their social networks to get important news and data, based on SNA and big data analyses. Scholars could develop theories for a new virus regarding social networks and big data, between the entities, the closeness of their association, the strength of ties, the structural holes or bridges, and the nature of directionality of interaction (Kar and Dwivedi, Reference Kar and Dwivedi2020; Zuo et al., Reference Zuo, Angelopoulos, Ou, Carol, Liu and Liang2020). Governments and Centres for Disease Control and Prevention would be able to understand social networks for COVID-19 to aid them in spreading important news and information to the public in a timely manner.
Next, this study finds that people build different social networks for COVID-19 on Twitter according to countries and groups. The findings of this study support the results of the prior literature (see, for example, Rufai and Bunce, Reference Rufai and Bunce2020; Yum, Reference Yum2020b; Yum, Reference Yum2021). For instance, Rufai and Bunce (Reference Rufai and Bunce2020) find that Twitter may represent a powerful tool for Group of Seven (G7) world leaders in response to COVID-19. This study and the prior studies suggest that governments and health practitioners can rapidly communicate public health information with citizens by understanding the social networks of SNS.
Third, this study suggests how people can find reliable information resources and important Twitter users for COVID-19 by considering the top public key players based on the in-degree centrality. Prior studies highlight that social media has become a home ground for misinformation during the COVID-19 pandemic (see, for example, Kouzy et al., Reference Kouzy, Abi Jaoude, Kraitem, El Alam, Karam, Adib and Baddour2020; Rosenberg et al., Reference Rosenberg, Syed and Rezaie2020; Shahi et al., Reference Shahi, Dirkson and Majchrzak2021). For example, 153 tweets (24.8%) include misinformation, and 107 (17.4%) include unverifiable information regarding the COVID-19 epidemic based on 673 tweets of the Twitter social media platform on 27 February 2020 (Kouzy et al., Reference Kouzy, Abi Jaoude, Kraitem, El Alam, Karam, Adib and Baddour2020). Therefore, this study provides important implications for social media and communication research.
This article suggests some crucial implications as follows: first, governments and decision makers should try to understand the characteristics of social networks in their country, since countries show different network systems for COVID-19. They should also explore the national and global key players of COVID-19 for their country in order to spread relevant information on COVID-19 as soon as possible. Second, governments and centres for disease control should investigate social networks according to groups, since people show different communication networks among groups according to countries. Third, heads of government should investigate the interests of people regarding COVID-19 because the public are interested in various topics according to countries. Exploring Twitter would be one of the most useful ways to understand the current interests and needs from governments to citizens.
6. Conclusions
COVID-19 is considered the worst disease so far in the twenty-first century. Developing COVID-19 policies has become one of the most important tasks for governments and decision makers. In order to release valuable information on COVID-19 and to deliver important news to the public on time, understanding social networks for COVID is necessary. In this sense, this study sheds new light on online communication systems for COVID-19 by employing SNA for Twitter across six countries in Europe.
This study finds some significant results as follows: first, European countries show different characteristics for social networks regarding COVID-19. For example, the UK has only national key players, France shows a majority of national key players, and other countries have all global key players. Donald Trump played an important role in the social networks of Italy (tenth), Germany (tenth), and Sweden (eighth), while he was the US president. To be specific, the UK has many important government key players. Spain is the only country in which the WHO plays an important role in social networks for COVID. Italy has news media as the most important key players. In contrast, Germany shows people as the most crucial key players. France exhibits national key players more than global key players. Sweden has some key players, such as websites and founders of health institutes, which do not rank in other countries.
Second, European countries also demonstrate different social networks of groups. For example, the UK shows the most active communications across groups. In addition, the UK is the only country that has all top key players within group 10. In contrast, Germany shows the least communication networks across the groups, and nodes are heavily concentrated in group 1. Finally, European countries reveal highly different interests for COVID-19. For example, the UK is more interested in the epidemic and vaccines, Germany focuses on schools and studies, and Sweden cares more about herd immunity and lockdown.
About the Author
Seungil Yum is PhD at the University of Florida who is examining urban economics, economic development, transportation, culture, environment, big data analysis, social network analysis, and creativity.


 Open access