

In the late 1970s and early 1980s Peru went through a classic “pacted” transition to democracy. After a period of military rule, moderates from the regime and opposition negotiated a return to democracy in a comprehensive national dialogue in 1979 followed by free and fair elections in 1980 and a peaceful transfer of power in the subsequent presidential election. By well-accepted metrics of electoral democracy, Peru’s transition was a full success.Footnote 1 Yet while the transition established democratic institutions: “vast sectors of the population were not included in the economic, political, social, and legal systems” (Espinosa, Janos, and Mac Kay Reference Espinosa, Janos, Kay, Albala and Natal2023, 218). Economic inequality and ethnic and gender discrimination soared (Glewwe and Hall Reference Glewwe and Hall1994). Peru soon found itself facing an armed insurgency whose rhetoric focused on the continuing exclusion of these populations.
In the same period, Uruguay also went through a democratic transition with many similar characteristics. In both countries, a military dictatorship negotiated a return to democracy with well-established political parties. Yet unlike in Peru, the transition in Uruguay was pushed forward by a mass civil resistance campaign by labor unions, student associations, and banned leftist political parties (Gillespie Reference Gillespie1985). A series of day-long national general strikes demonstrated the power of the democratizing forces, eventually drawing in even the legal political parties. When Uruguay held its first free and fair elections in 1985, the subsequent regime not only established democratic institutions, but was characterized by ongoing mobilization from historically excluded groups such as women (Espino Reference Espino, Ortenblad, Marling and Vasiljevic2017) and the Afro-Uruguayan population (López Reference López2022), which led to both recognition of historical discrimination and significant improvements in political inclusion.
These contrasting outcomes illustrate a puzzle: why do some transitions lead to significant advances for groups excluded from political power while others fail to do so? Countries may democratize, and even adopt de jure political inclusion for all, while still maintaining significant de facto barriers based on ethnicity, class, or gender. An emphasis on these de jure institutions in existing studies on democratization makes the current literature ill-equipped to solve this puzzle.
However, the key difference in these cases—the bottom-up resistance campaign in Uruguay—suggests one possible answer: the impact of civil resistance, in which ordinary citizens use tactics such as protests, strikes, and boycotts, to push for political change.Footnote 2 Several scholars have shown that civil resistance is a powerful tool for political transformation (Chenoweth and Stephan Reference Chenoweth and Stephan2011; Nepstad Reference Nepstad2011; Svensson and Lindgren Reference Svensson and Lindgren2011), and an extensive literature already shows that civil resistance advances de jure measures of democratization (Bayer, Bethke, and Lambach Reference Bayer, Bethke and Lambach2016; Celestino and Gleditsch Reference Celestino and Gleditsch2013; Chenoweth and Stephan Reference Chenoweth and Stephan2011; Fetrati Reference Fetrati2023; Kadivar Reference Kadivar2018, Reference Kadivar2022; Pinckney Reference Pinckney2020). Furthermore, many of the best-known civil resistance campaigns, such as the Anti-Apartheid struggle in South Africa, have focused on advancing the political inclusion of historically excluded groups.Footnote 3
Yet other work argues that civil resistance is a “weapon of the resourceful” (White et al. Reference White, Vidovic, González, Gleditsch and Cunningham2015), and less effective for historically excluded groups (Manekin and Mitts Reference Manekin and Mitts2022; Pischedda Reference Pischedda2020; Thurber Reference Thurber2018). Additional scholarship has claimed that civil resistance campaigns are particularly vulnerable to reneging and counterrevolution (Clarke Reference Clarke2023; de Vogel Reference de Vogel2024), suggesting that any gains they achieve may be ephemeral. Thus, current studies of civil resistance offer competing perspectives as to whether civil resistance in political transitions is likely to improve the inclusion of historically excluded groups.
This paper addresses both a gap in the democratization literature about when transitions lead to de facto inclusion as well as a debate in the civil resistance literature about whether civil resistance produces gains for historically excluded groups. We argue that three mechanisms—the elevation of an array of diverse leaders, the creation of social capital and repertoires conducive to continued mobilization, and the transformation of political norms—make transitions initiated through civil resistance like Uruguay’s more likely to result in greater advances in political inclusion than other political transitions. We expect this effect to hold across three of the most substantive dimensions of political exclusion: gender, ethnicity, and economic class.
We test this argument using data on political transitions globally from 1946 through 2014 (Pinckney Reference Pinckney2020), comparing before and after changes in political inclusion between transitions initiated primarily through civil resistance and those initiated through all other means. We use a variety of model specifications and conduct several sensitivity analyses to mitigate the risk of our results being driven by endogeneity or omitted variable bias. We find that civil resistance at the beginning of a transition has a strong statistically significant positive correlation with increases in gender, class, and ethnic inclusion, as well as on an aggregate index of overall inclusion at the transition’s end. While most political transitions on average have had minor improvements in inclusion, civil resistance transitions (CRTs) are followed by much greater advances than non-civil resistance transitions (non-CRTs).
We also find evidence supporting our leadership and mobilization mechanisms. Civil resistance campaigns are associated with increased female legislative participation and post-transition mobilization. Consistent with these mechanisms, we also find a relationship between visible participation by women and lower economic classes in civil resistance and subsequent advances in gender and class inclusion, respectively. We find partial evidence that the participation of excluded ethnic groups generates greater advances in inclusion.
These results suggest that, while not a panacea, civil resistance is a key force in bringing about more inclusive politics. Advances in inclusion are always difficult, incremental, and uncertain, and potentially subject to backlash and reversal. But transitions precipitated by civil resistance are likely to have advantages in producing gains for previously excluded groups relative to other types of transitions. While democracy may come about through a variety of avenues, advances in gender, ethnic, and class inclusion are propelled by civil resistance from below.
Democracy’s Failure to Promote Inclusion
Political exclusion based on identity is an enduring characteristic of most political systems. Democratic institutions are an imperfect solution for this problem. While such exclusion tends to be worse in authoritarian regimes, and public discourse in liberal democracies typically decries such exclusion, even advanced democracies systematically exclude groups from political power based on their gender, race, or class.Footnote 4
Despite few remaining official restrictions on women’s suffrage in most countries, women’s exclusion from meaningful political influence remains widespread. This is evidenced by a lack of political representation in most parliaments and almost no women in positions of executive leadership (Paxton, Hughes, and Barnes Reference Paxton, Hughes and Barnes2020; Wängnerud Reference Wängnerud2009). The position is significantly worse for gender and sexual minority groups (Flores Reference Flores2021; Magni and Reynolds Reference Magni and Reynolds2021; Reynolds Reference Reynolds2013).
Economic class is another enduring dimension of political exclusion. Despite the key role of the working class and organized labor in most democratization struggles (Collier Reference Collier1999; Pinckney, Butcher, and Braithwaite Reference Pinckney, Butcher and Braithwaite2022; Rueschemeyer, Stephens, and Stephens Reference Rueschemeyer, Stephens and Stephens1992), and the significant influence of redistributivist theories of democratization (Acemoglu and Robinson Reference Acemoglu and Robinson2005; Boix Reference Boix2003), most democracies suffer from major economic inequality. This inequality in turn undermines the capacity for the poor and working classes to meaningfully impact politics. The result is that, across most democracies, the preferences of the poor and working classes are systematically undervalued. For example, several studies have shown that political decisions in the United States systematically skew towards the rich (Bartels Reference Bartels2016; Gilens Reference Gilens2012).
Ethnic or racial identity is also a persistent avenue of political exclusion. The challenges of democracy in ethnically heterogeneous societies are a matter of long-standing scholarly debate (Fish and Brooks Reference Fish and Brooks2004; Horowitz Reference Horowitz1993; Lijphart Reference Lijphart1977). Political exclusion through enduring ethnic or racial hierarchies in turn “enervate democratic citizenship for all” (Morgan and Kelly Reference Morgan and Kelly2021, 2023) not just through directly excluding marginalized groups but through undermining faith in democracy across the population.
Changing these patterns of political exclusion belies easy solutions. Structures of exclusion are typically deeply embedded in longstanding political norms, undermining the will for change. Political leaders from privileged groups stand to lose out from greater inclusion, and thus have few incentives to advocate for change. And political exclusion often leads to a lack of resources among excluded groups to mobilize and advocate for themselves.
Polities may become gradually more inclusive over time in response to political mobilization and modernizing social norms (see, for example, Welzel, Norris, and Inglehart Reference Welzel, Norris and Inglehart2002). Yet political transitions—periods in which an old political regime has broken down and a new one has yet to be established (O’Donnell and Schmitter Reference O’Donnell and Schmitter1986)—offer a crucial moment in which more transformative advances are possible, since they represent a fundamental break in old political routines. The international community and historically excluded groups both frequently seize on transitions as times to push for greater inclusion (Acemoglu and Robinson Reference Acemoglu and Robinson2001; Haggard and Kaufman Reference Haggard and Kaufman2016).
Yet their efforts are often disappointed. Even transitions that end in democracy frequently result in new polities dominated by a majority or historically privileged ethnic group (Bertrand and Haklai Reference Bertrand, Haklai, Bertrand and Haklai2014; Snyder Reference Snyder2000). Similarly, political transitions have typically had little impact on patterns of gender inclusion. As Georgina Waylen (Reference Waylen2007, 522) writes: “the majority of transitions have been disappointing in gender terms, bringing few positive gender outcomes in their immediate aftermath.”Footnote 5 And even if a transition results in democratization, income inequality often endures or worsens (Acemoglu et al. Reference Acemoglu, Naidu, Restrepo, Robinson, Atkinson and Bourguignon2015; Dorsch and Maarek Reference Dorsch and Maarek2019). How might this problem of enduring political exclusion be resolved?
The Inclusionary Advantage of Civil Resistance
As we have mentioned briefly, our answer to this question centers the long-term political impacts of civil resistance. Civil resistance is a tactical repertoire that has been employed from the local to the international level, and for many diverse political objectives. We follow much of the literature in limiting the scope of our inquiry to “maximalist” campaigns that take place at the national level, have sustained mobilization of over a thousand participants for at least a week, and have goals that would fundamentally reshape their country’s political system.
There is abundant evidence that maximalist civil resistance campaigns have significant political impacts long after the campaign ends, particularly if the campaign is successful in achieving its short-term goals (Chenoweth and Stephan Reference Chenoweth and Stephan2011). In particular, a growing number of studies have identified a strong relationship between civil resistance and democratization. Ackerman and Karatnycky (Reference Ackerman and Karatnycky2005) were the first to specify this relationship quantitatively, finding that a set of transitions preceded by civic action and low levels of opposition violence from 1972 to 2004 were much more likely to democratize. Chenoweth and Stephan (Reference Chenoweth and Stephan2011) find that even failed civil resistance campaigns have a positive effect on levels of democracy five years after the campaign’s end. In a series of studies, Kadivar identifies a strong relationship between the length of mass mobilization before political transitions and the durability and quality of subsequent democratic regimes (Kadivar Reference Kadivar2018, Reference Kadivar2022; Kadivar, Usmani, and Bradlow Reference Kadivar, Usmani and Bradlow2020), and Pinckney (Reference Pinckney2020) finds that “civil resistance transitions” are roughly three times as likely to result in democratization as transitions initiated through any other means.Footnote 6
The literature to date, following the broader democratization literature, has focused mostly on the de jure institutional aspects of democracy.Footnote 7 We expand this focus to theorize on how civil resistance might impact political inclusion.
First, civil resistance tends to foster a greater culture of pluralism and accommodation for heterogeneous preferences (Ives Reference Ives2022). Civil resistance campaigns tend to be most effective when their movement structures and culture value and incorporate a wide range of perspectives (Ganz Reference Ganz2009; Polletta Reference Polletta2002). Marshall Ganz’s work in particular highlights how diverse movements tend to have heightened “strategic capacity” that enables them to put their resources to more efficacious use. Thus, while valuing pluralism may not be inherent in the practice of civil resistance, the advantages in a pluralistic approach are likely to create selection pressures. Those campaigns that can successfully initiate a political transition will be more likely to be those that have such values.
If they succeed in initiating a political transition, then their adoption of those values is likely in turn to shape the character of transitional institutions. For example, many civil resistance campaigns have been followed by comprehensive national dialogues that established more inclusive political institutions (Dudouet and Pinckney Reference Dudouet and Pinckney2021). Such institutions in turn can lock in more inclusive political arrangements when the transition comes to an end. As Robert Fishman (Reference Fishman2017, 392) writes, “the historically decisive interactions between civil society actors and political forces during the founding of a democratic regime forge cultural parameters of political life, which in turn have important consequences for the ability of social forces to influence agenda-setting, policy-making, and other political outcomes under democracy.” The values and practices of pluralism emerging from civil resistance may reshape the long-term political environment to be more inclusive.
Second, initiating a political transition through civil resistance is likely to diffuse organizing skills among historically excluded groups that will enable them to continue to mobilize for their interests in a new political regime. The act of participating in civil resistance creates both interpersonal ties between individuals as well as new organizational forms that bring people together over common political goals (Madestam et al. Reference Madestam, Shoag, Veuger and Yanagizawa-Drott2013). Once the campaign is “over” and the transition has begun, these forms of social capital remain. Organizations formed during civil resistance campaigns can form the basis of a strong civil society while new social ties facilitate political participation and mobilization (Fernandes Reference Fernandes2015). It is almost a truism among social movement scholars that, as Sidney Tarrow (Reference Tarrow1998) puts it, “activism begets future activism” (see also Giugni Reference Giugni, Snow, Soule and Kriesi2004; McAdam Reference McAdam1989). Participants from historically excluded groups who have activated as part of a civil resistance campaign to initiate a transition will be loath to return to political inaction and more likely to take the organizing skills they have learned to advocate for their interests during the transition and beyond. Civil resistance may thus reshape not just political norms but patterns of political behavior among the historically excluded, equipping them to mobilize against elite attempts to maintain old patterns of exclusion.
Examples of this dynamic abound. After participating in the successful 2006 popular revolution against the Nepalese monarchy, the long-disenfranchised Madheshi community was better equipped to organize their own subsequent series of movements demanding greater political inclusion in Nepal’s new constitutional arrangements (Jha Reference Jha2017). Women’s organizations in Brazil, after having participated in the movement for direct presidential elections in 1984, later repurposed that movement’s slogan of Diretas Ja (direct elections now!) to successfully call for “family planning now!” (Alvarez Reference Alvarez and Stepan1989, 221). In Tunisia, the 2011 “Jasmine Revolution” invigorated a “politics from below” regarding women’s rights that bore fruit in successful campaigns requiring gender parity on electoral lists, and to prevent women from being described as “complementary” to men in Tunisia’s post-revolution constitution (Charrad and Zarrugh Reference Charrad and Zarrugh2014).
This mechanism parallels and expands on mechanisms in the literature on democratization and inclusion after civil wars (Berry Reference Berry2018; Tripp Reference Tripp2015; Wood Reference Wood2000), in particular the work of Reyko Huang (Reference Huang2016). Huang shows that rebel governance in civil war leads to greater postwar democratization because it gives civilian populations the awareness, engagement, and expectation of political change. This in turn leads to greater mobilization in the post-civil war context that raises the costs of repression and holds new elites accountable. These mechanisms are likely to be supercharged in the context of civil resistance for three reasons. First, the broader tactical repertoire provides a larger set of potential avenues for popular engagement (Sharp Reference Sharp1973). Second, civil resistance campaigns on average tend to involve the political activation of a much larger proportion of the population than civil wars (Chenoweth and Stephan Reference Chenoweth and Stephan2011). Third, the lower relative levels of physical violence of civil resistance means that transitions after civil resistance campaigns should have fewer of the social and political traumas associated with civil war.
Finally, civil resistance transitions may advance inclusion by bringing to power a more diverse political leadership (Kadivar, Usmani, and Bradlow Reference Kadivar, Usmani and Bradlow2020). As described earlier, civil resistance campaigns have a strong strategic incentive to build diverse membership (Chenoweth and Stephan Reference Chenoweth and Stephan2011). Participation in the campaign may then result in members of historically excluded communities taking positions of leadership in the transition more frequently than in top-down or violent transitions. Such positions represent an advance in inclusion in and of themselves, yet their impact goes beyond this, as the individuals in these positions may then be able to use their offices to advance policies that promote greater inclusion for their constituency. For instance, in Chile many indigenous leaders participated in the campaign against dictator Augusto Pinochet, while maintaining their demands for land justice and political rights. In the subsequent political transition, many of these leaders participated in the Special Commission for Indigenous Peoples (Spanish acronym CEPI), which later resulted in the passage of a new indigenous law that institutionalized indigenous political participation (Rodriguez and Carruthers Reference Rodriguez and Carruthers2008).Footnote 8
We expect these mechanisms to apply across all three of our dimensions of interest: gender, class, and ethnicity. Civil resistance campaigns are often led by women, and provide significant opportunities for women’s inclusion (Chenoweth Reference Chenoweth2019). The “People Power” revolution in the Philippines in 1986 took place in response to the attempt by the Filipino government to deny the presidency to Corazon Aquino. When “People Power” was victorious, Aquino became the Philippines’ first female president (Reid and Guerrero Reference Reid and Guerrero1995). Unions and the working class are also key participants in many civil resistance campaigns (Butcher, Gray, and Mitchell Reference Butcher, Gray and Mitchell2018; Butcher and Svensson Reference Butcher and Svensson2016), and their participation tends to lead to greater subsequent democracy (Pinckney, Butcher, and Braithwaite Reference Pinckney, Butcher and Braithwaite2022). The UGTT labor union in Tunisia played an important role in the 2011 Tunisian revolution, and later became a central power player during the political transition, winning significant concessions for its members (Hartshorn Reference Hartshorn2019; Niazi Reference Niazi2021). And while ethnic marginalization may make civil resistance more challenging, many civil resistance campaigns have been organized by inter-ethnic coalitions. The 1989 “Velvet Revolution” in Czechoslovakia gave special positions of influence to the country’s marginalized Slovak minority, which they were later able to leverage to gain Slovakia’s independence.
For these reasons, we make the following hypotheses:
-
H1: Transitions initiated through civil resistance will lead to greater advances in inclusion than transitions initiated through other means.
-
H1a: Transitions initiated through civil resistance will lead to greater advances in gender inclusion than transitions initiated through other means.
-
H1b: Transitions initiated through civil resistance will lead to greater advances in economic inclusion than transitions initiated through other means.
-
H1c: Transitions initiated through civil resistance will lead to greater advances in ethnic inclusion than transitions initiated through other means.
Among civil resistance transitions, our proposed mechanisms suggest that we should be more likely to observe even greater advances in inclusion when members of marginalized groups participate in the campaign. CRTs may produce gains for marginalized groups even when members of those groups do not participate. For example, as described earlier, CRTs are more likely to espouse pluralist values irrespective of who participates. But the mechanisms will be amplified when marginalized groups do participate. In these cases, excluded groups are better able to bring their issues to the center of national debate. They can also build the social capital that can later be drawn upon to mobilize in support of their agenda. Finally, participation in a civil resistance campaign offers excluded groups an opportunity to forge coalitions with privileged actors that they can use to extract concessions for inclusive political reforms or to place their leaders in positions of power in the new regime. For these reasons, we make the following additional hypotheses that link the participation of specific classes of groups to advances in inclusion along those specific dimensions:
-
H2a: Civil resistance transitions will lead to greater gender inclusion when women have participated in the precipitating civil resistance campaign.
-
H2b: Civil resistance transitions will lead to greater socio-economic inclusion when marginalized socio-economic groups have participated in the precipitating civil resistance campaign.
-
H2c: Civil resistance transitions will lead to greater ethnic inclusion when marginalized ethnic groups have participated in the precipitating civil resistance campaign.
It is important to highlight that our hypotheses are both probabilistic and comparative: democratic transitions of any type will not inevitably produce advances in inclusion. However, transitions precipitated by civil resistance are likely to have advantages in producing gains for previously excluded groups relative to other types of transitions, especially when those civil resistance campaigns included members of marginalized communities. Unlike elite-driven “pacted” transitions, civil resistance transitions are driven “from below” and create a broader constituency to which elites must be held to account. And, while some transitions initiated through violence may also have high levels of mobilization that lead to democratization and possibly inclusion (Huang Reference Huang2016), the mechanisms through which this occurs are likely to be present to a much greater degree in transitions initiated through civil resistance.
Key Measures and Descriptive Comparisons
We test our hypotheses with an analysis of global cross-national data on political transitions from authoritarianism (Thurber et al. Reference Thurber, Pinckney, Bogati and Firawati2024). Our population of transitions is Pinckney’s (Reference Pinckney2020) list of 315 political transitions from 1945 to 2014. The transitions in this dataset are defined based on changes in regime type in the Geddes, Wright, and Frantz (Reference Geddes, Wright and Frantz2014) Authoritarian Regimes dataset with some cases added to move their original end-date of 2010 forward to 2014. Transitions in the dataset begin the year the old regime type ended according to the Authoritarian Regimes dataset and end when annual changes in the V-Dem Polyarchy score fall to below 0.05 for at least two years (Pinckney Reference Pinckney2020, 160). Our dataset includes all political transitions from authoritarian regimes, regardless of their level of democracy at the transition’s end.
From these 315 cases, 76 are coded as “civil resistance” transitions (CRTs), based on whether “civil resistance play[ed] a crucial role in breaking down the prior regime” (Pinckney Reference Pinckney2020, 16). This determination is based on a combination of examining overlap with civil resistance campaigns in the NAVCO 2.1 dataset (Chenoweth and Shay Reference Chenoweth2019) and original research into each of the transitions. All other transitions are coded as “non-civil resistance” transitions (non-CRTs). While this includes any type of transition that does not involve a civil resistance campaign, the majority are “top-down” or “pacted” transitions.Footnote 9 Since our hypotheses concern whether a transition was initiated through civil resistance, we directly employ this indicator of a civil resistance transition as our primary independent variable.
To assess the impacts of political transitions on inclusion, we draw on measures from the Varieties of Democracy (V-Dem) dataset (Coppedge et al. Reference Coppedge, Gerring, Knutsen, Lindberg, Teorell, Alizada, Altman, Bernhard, Cornell, Fish, Gastaldi, Gjerløw, Glynn, Hicken, Hindle, Ilchenko, Krusell, Luhrmann, Maerz, Marquardt, McMann, Mechkova, Medzihorsky, Paxton, Pemstein, Pernes, von Römer, Seim, Sigman, Skaaning, Staton, Sundström, Tzelgov, Wang, Wig, Wilson and Ziblatt2023). Specifically, we use V-Dem’s “Egalitarian Component Index,” which averages measures of equal protection, access to political power, and distribution of resources from 0 (least egalitarian) to 1 (most egalitarian).Footnote 10 We also analyze specific measures pertaining to exclusion based on gender, class (socioeconomic position), and ethnicity (social group). We subtract their levels from 1 so that they are scaled in the same direction as the egalitarian index, with 1 representing higher levels of inclusion.
It is important to note that these variables attempt to capture concepts related to political inclusion and exclusion that are not captured in traditional democracy scoring systems like the Polyarchy index. While democracy metrics might capture the extension of suffrage to women, they do not attempt to capture (either conceptually or operationally) the degree to which women have access to primary education, public services, or government jobs. The same can be said regarding ethnicity and class. The VDEM inclusion measures we use in this study capture exactly these dimensions of exclusion that are overlooked in studies of de jure democratization.Footnote 11
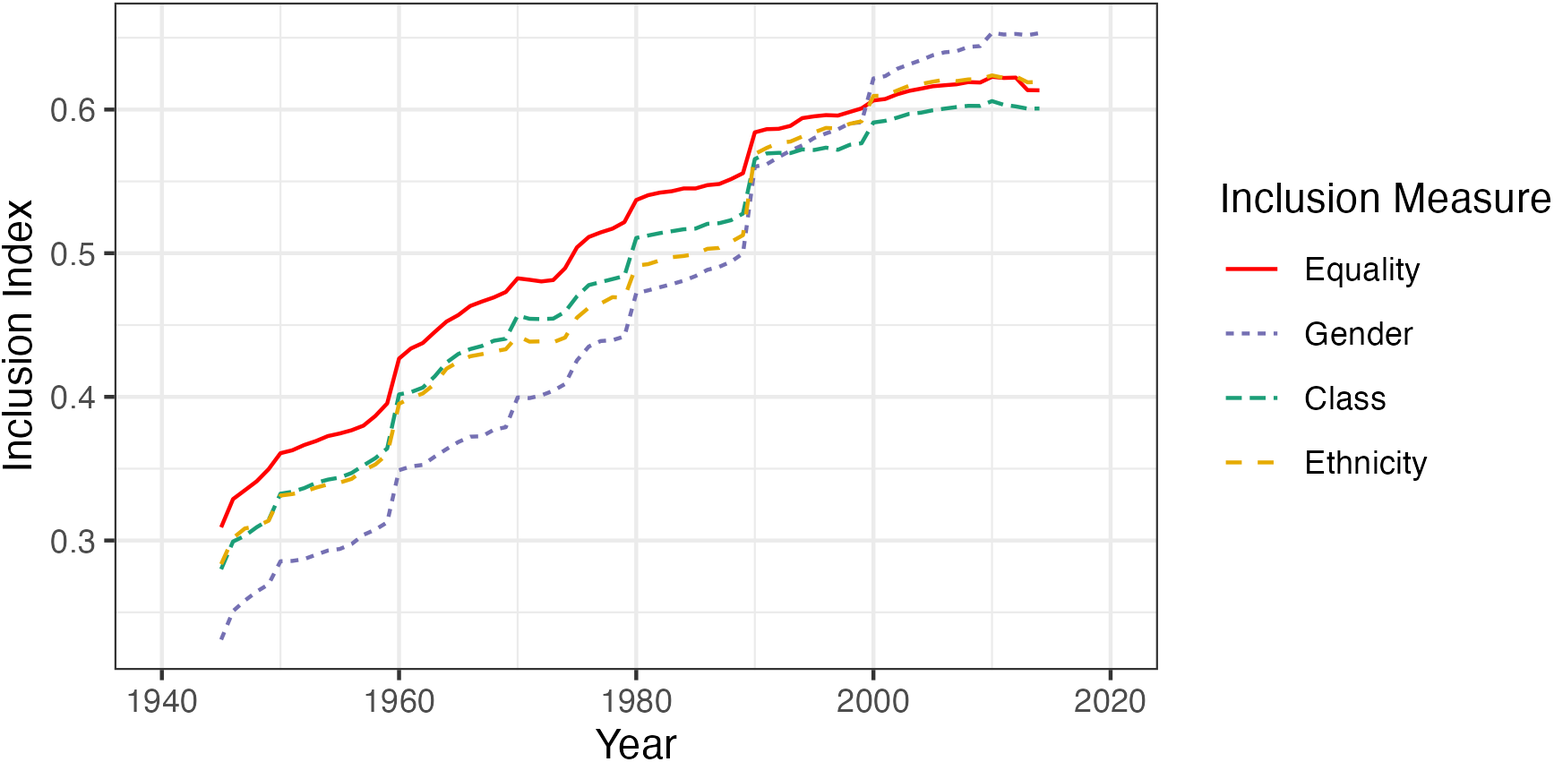
Figure 1 shows trends in the annual averages of each of these measures. They largely move together, increasing over the course of the late twentieth and early twenty-first centuries. Gender inclusion starts lower than the others, but also sees the greatest gains.
Trends in annual averages of VDem inclusion measures, 1945–2014
To assess the transition’s impact on inclusion, we compare the V-Dem inclusion measures in the year before the transition began, to those in the year after the end of the transition (Y1) as well as those five years after the transition (Y5). In other words, our dependent variable is the before/after change in the inclusion measure.
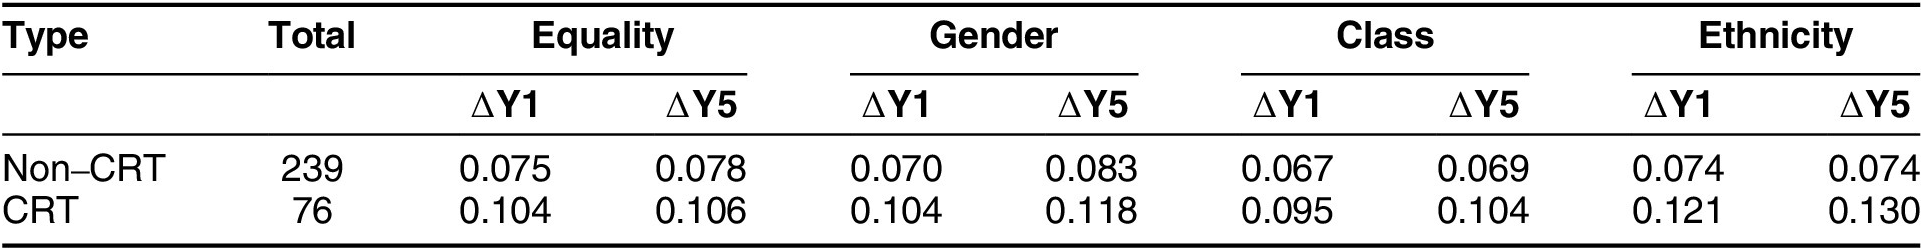
Table 1 presents the average changes in these inclusion measures across CRTs and non-CRTs. Both types of transition produce positive changes. However, the average changes are consistently higher for CRTs. For the overall equality index, civil resistance transitions resulted in an average increase of 0.099 while non-civil resistance transitions had an increase of 0.074. As a benchmark, the average annual change in the equality index across the timespan 1946–2014 was 0.004. The five-year averages show identical patterns, though the pace of advancement tapers off to levels closer to historical averages.
Average changes in inclusion measures one year and five years after transition
While this simple cross-tabulation provides initial support for our hypotheses, numerous factors may correlate both with civil resistance transitions and with greater advances in inclusion, necessitating multivariate regression analysis to attempt. We now turn to this analysis.
Regression Analysis
Since our dependent variables are continuous, our primary testing strategy is linear OLS regression. Our main models include standard state-level control variables, taken in the year before the transition. We include V-Dem’s Polyarchy score to account for whether civil resistance transitions occur in states that are already more democratic. We also include V-Dem’s measure of civil society participation. High levels of civil society participation could make civil resistance more likely as well as create pressure for inclusion in ways unrelated to the use of civil resistance. We include per capita GDP from the Maddison Project to control for possible effects of greater wealth. We also control for the duration of the transition in years. Because transitions range in length from 1 to 10 years, controlling for duration ensures that our results are not merely the artifact of some transitions being longer than others. Longer transitions create more years over which the inclusion measures have a chance to increase. To control for the impacts of violence that may be occurring alongside any type of transition, we create a binary indicator for the presence of such violence either during a transition or in the five years prior. This takes a positive value if there is any armed conflict in the UCDP/PRIO Armed Conflict Dataset (Gleditsch et al. Reference Gleditsch, Wallensteen, Eriksson, Sollenberg and Strand2002; Davies, Petterson & Öberg Reference Davies, Pettersson and Öberg2023) in the country during that time period, or if there is a campaign in the NAVCO 2.1 (Chenoweth and Shay Reference Chenoweth and Shay2022) dataset that is coded as primarily violent, with simultaneous violence, or with a violent flank. We also created a binary measure for any prior CRT in the country.
Finally, we include two measures to control for both absolute levels as well as trends in inclusion prior to the transition. The first measure is the country’s inclusion index (overall, gender, ethnicity, or class) in the year prior to the transition. The second is the annualized average change in the inclusion index in the country over the five years prior to the transition. This allows us to control for the possibility that civil resistance transitions emerge in polities that had already begun to experience increases in inclusion. In the online appendix, we present descriptive statistics of each of these control variables, disaggregated by transition type.
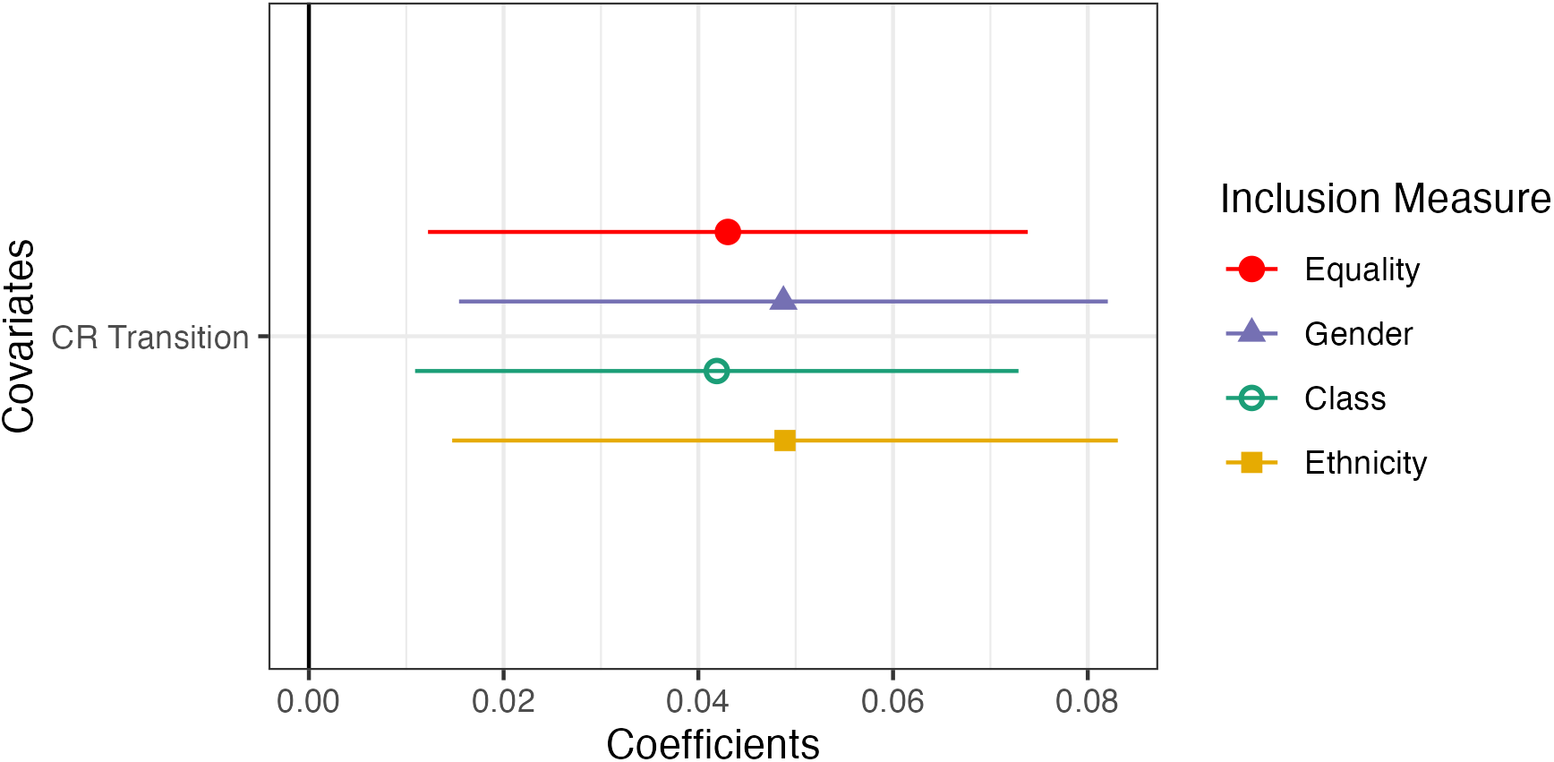
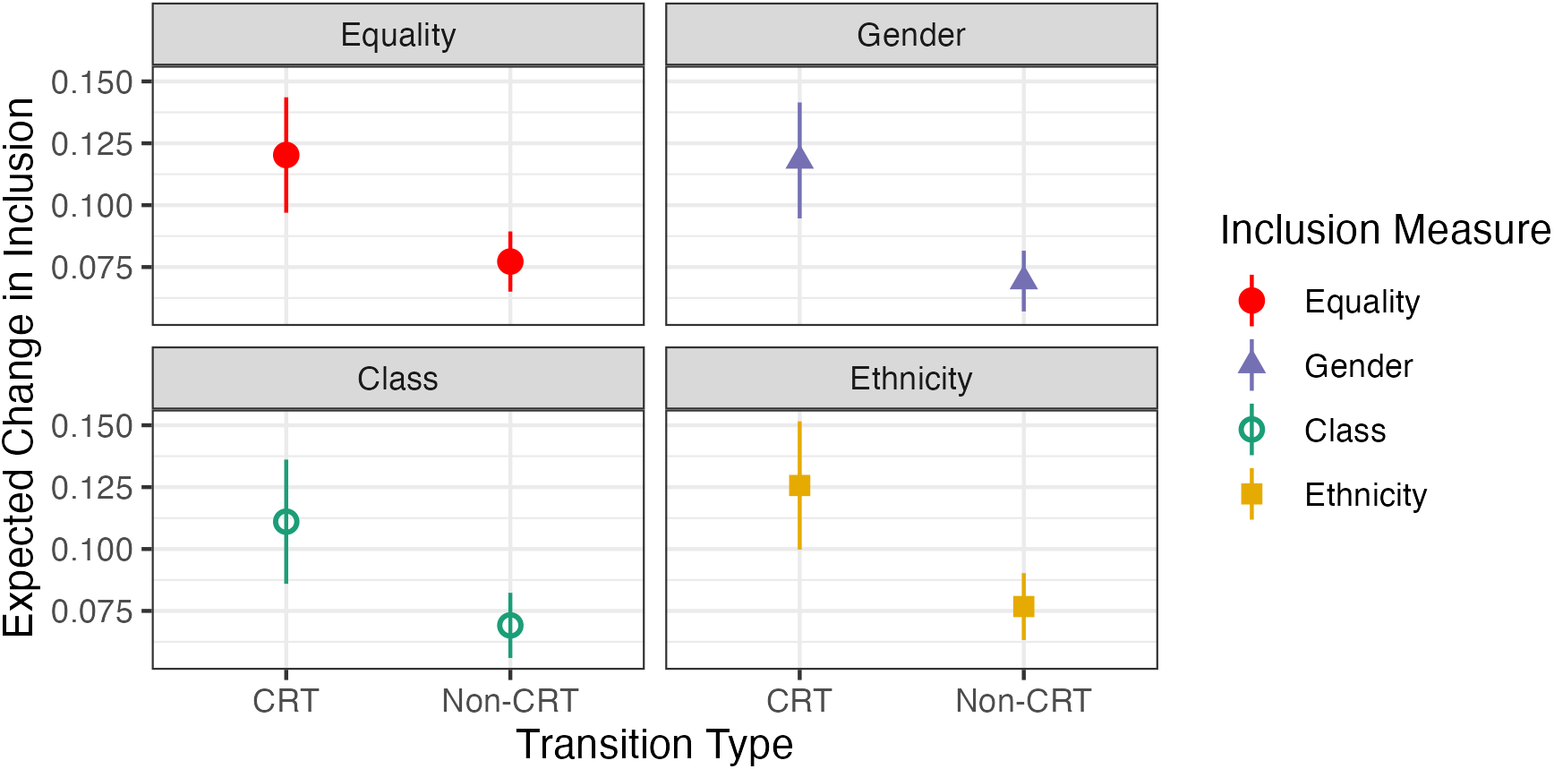
Table 2 presents the results of our primary regression models. Figure 2 shows the marginal effects of civil resistance transitions, while figure 3 shows the expected changes in inclusion for both civil resistance and non-civil resistance transitions. The results provide strong support for the positive relationship between civil resistance transitions and greater advances in inclusion. The coefficient for civil resistance transitions (compared to the reference category of non-CRTs) is consistently positive and statistically significant across all dimensions of inclusion. Figure 2 shows that across the four dependent variables, CRTs are correlated with increases in inclusion that are between 0.042 and 0.049 higher than the increases that accompany non-CRTs. Figure 3 provides greater overall context. It shows that across these dimensions, non-CRTs produce an expected increase of between 0.06 and 0.08. This is a substantively large increase given the overall 0–1 scale of the indices. But the increase after CRTs is even larger: between 0.11 and 0.13.
OLS regressions of effect of transition type on changes in inclusion, before versus one year after transition
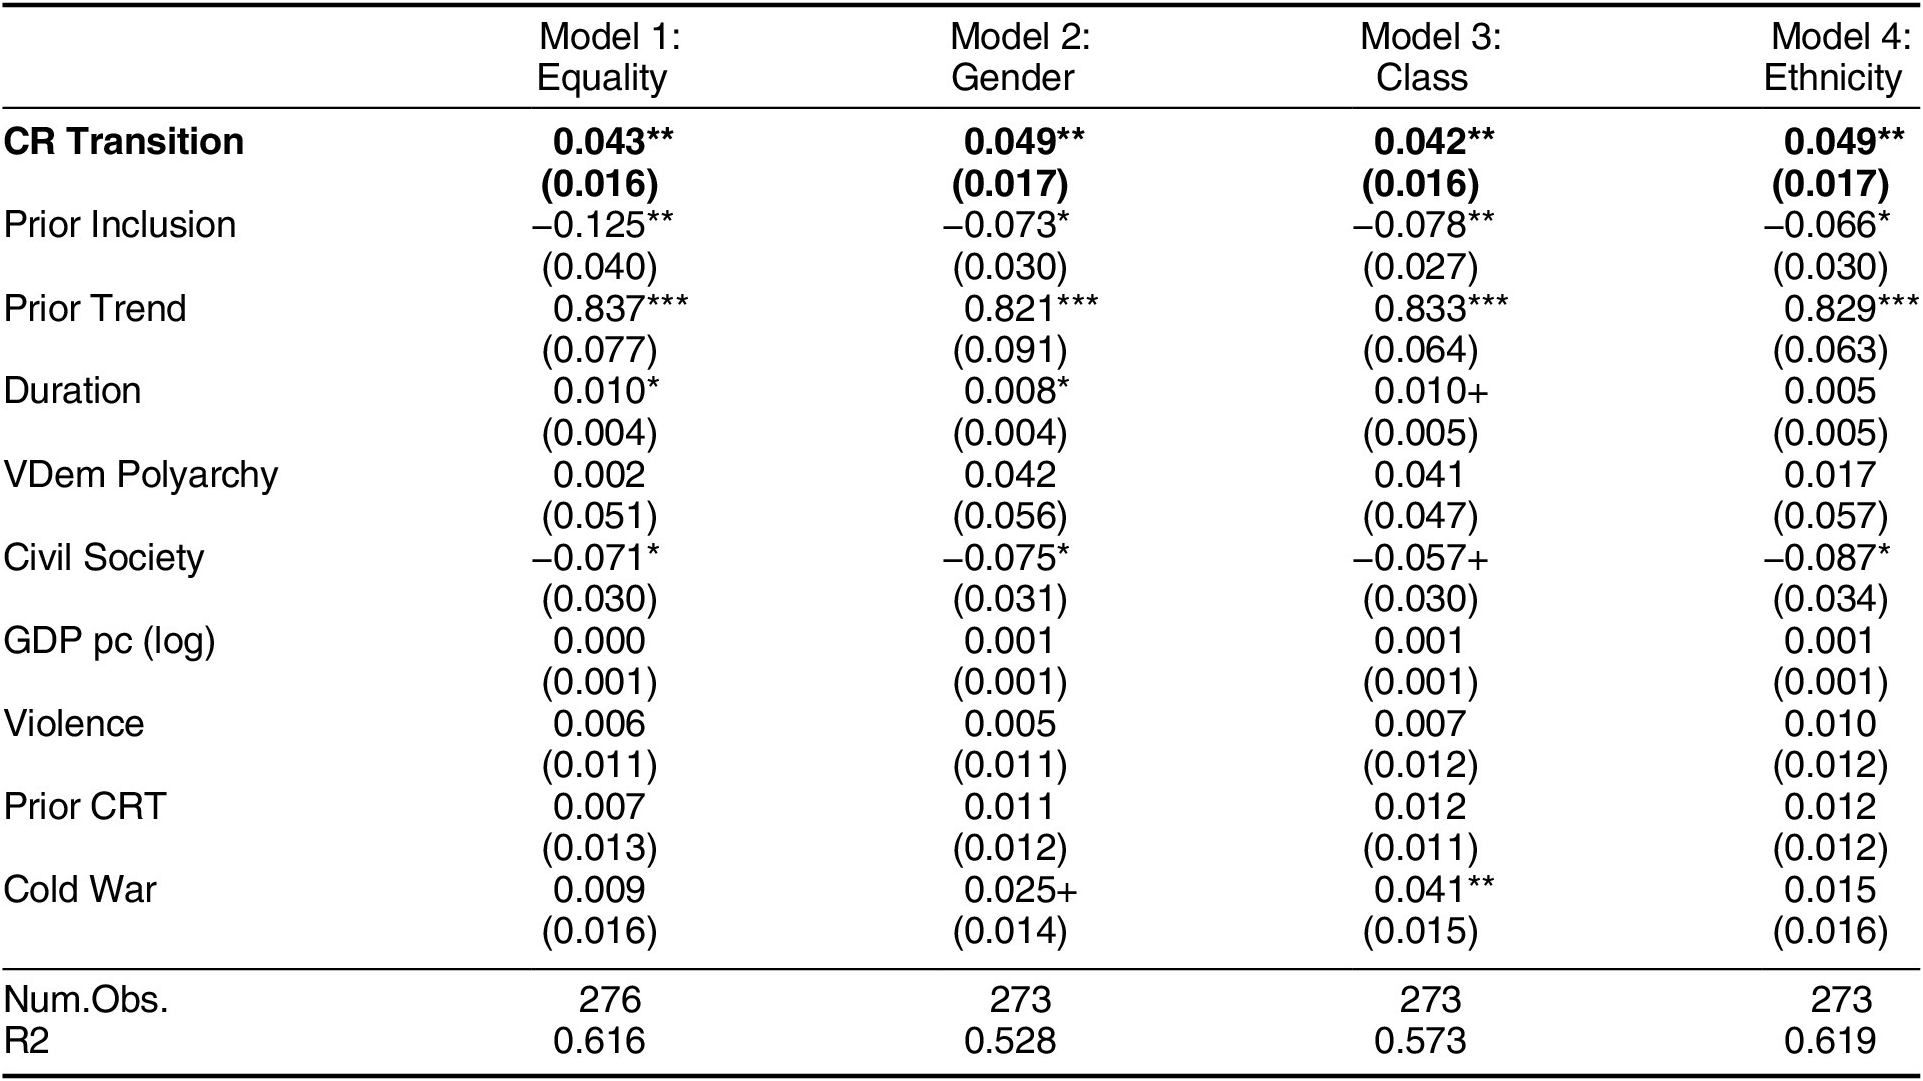
Notes: + p < 0.1, * p < 0.05, ** p < 0.01, *** p < 0.001
HC1 robust standard errors used across models. Prior Inclusion and Prior Trend covariates are specific to the inclusion measure DV and vary between models. CR Transition is a dichotomous variable indicating a Civil Resistance Transition (CRT) as compared to a non-Civil Resistance Transition (non-CRT).
Coefficient estimates for civil resistance transition
Note: Coefficient estimates come from Models 1–4 in table 2 and represent how much greater an increase in inclusion is expected from a CRT as compared to a non-CRT.
Expected changes in inclusion measures
Note: The values above represent the expected changes in inclusion measures for civil resistance and non-civil resistance transitions. Estimates come from Models 1–4 in table 2 with all other covariates in the models held at their means.
In the online appendix, we report models based on inclusion levels 5 years after the end of the transitions that show the inclusionary advantage of CRTs is maintained over five years. We also further explore the role of violence, disaggregating 33 non-CRTs in which the transition was directly precipitated by an armed insurgency (either through outright rebel victory or a negotiated peace settlement). We find that those “primarily violent” transitions experience higher average increases in inclusion than the other non-CRTs. However, the small number of cases results in high levels of uncertainty. This suggests that these violent transitions possibly activate some of the same mechanisms that CRTs do, such as bringing more diverse leaders into power or creating social capital for continued collective action.Footnote 12
Finally, we run models using a difference-in-difference (DiD) specification as well as country- and year-level fixed effects. We find similar results, increasing our confidence that our findings are not simply the result of pre-transition differences between countries that experience a CRT versus non-CRT or of the timing of when transitions occurred.
Mechanisms and Additional Observable Implications
Our theory proposed three mechanisms through which civil resistance transitions might produce greater gains in political inclusion: the elevation of leaders from historically excluded groups, increased mobilization of historically excluded groups, and more inclusive values and norms. In this section, we test for evidence consistent with the first two of these mechanisms.
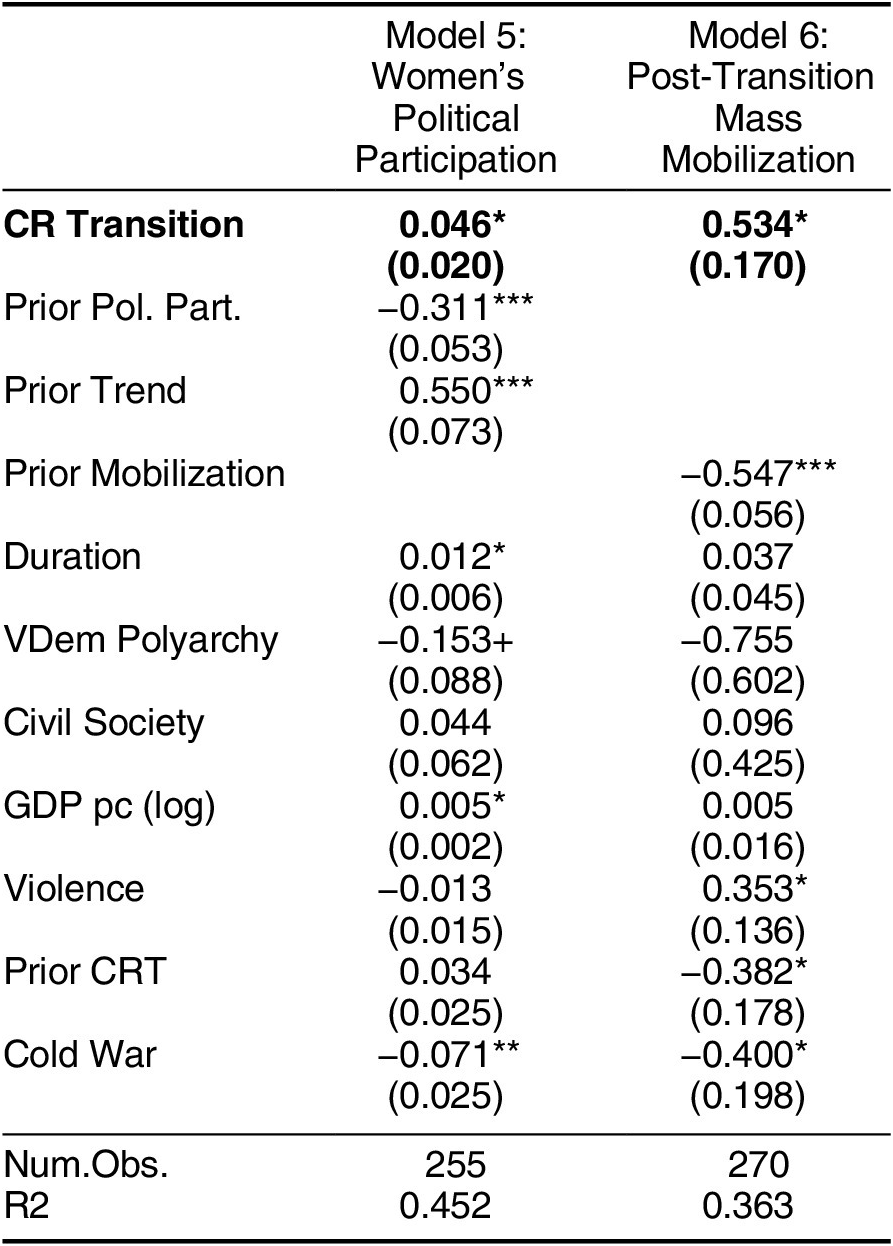
If the leadership mechanism is true, we should expect CRTs to result in more diverse governments than non-CRTs. We can measure this outcome on the gender dimension using V-Dem’s “Women’s political participation index,” which measures the degree to which women are descriptively represented in the legislature and overall distribution of power (Coppedge et al. Reference Coppedge, Gerring, Knutsen, Lindberg, Teorell, Alizada, Altman, Bernhard, Cornell, Fish, Gastaldi, Gjerløw, Glynn, Hicken, Hindle, Ilchenko, Krusell, Luhrmann, Maerz, Marquardt, McMann, Mechkova, Medzihorsky, Paxton, Pemstein, Pernes, von Römer, Seim, Sigman, Skaaning, Staton, Sundström, Tzelgov, Wang, Wig, Wilson and Ziblatt2023).Footnote 13 If the social capital and repertoires mechanism is true, we should expect more frequent protest in the aftermath of CRTs than non-CRTs. To capture this, we turn again to V-Dem, using their “Mass mobilization” scale that measures protest events such as demonstrations, strikes, and sit-ins. Unfortunately, we were not able to find an adequate way of measuring changes in norms for this study, or political participation beyond the gender dimension.Footnote 14
These variables employ the same 0 to 1 interval scale used in the earlier inclusion analyses, thus we use OLS regressions in a similar structure to our previous models. For women’s representation, we once again use as our dependent variable the difference in this measure one year after as compared to the year before the transition. For mobilization, we compare to five years before the transition, so as not to count mobilization that was part of the transition itself. In both cases, we use the same binary indicator of CRT and the same state-level control variables. For the women’s political representation model, as before, we control for the absolute level of women’s political representation in the year prior to transition, as well as the average change in this measure over the five years leading into the transition. In the mobilization model, we use the absolute level of mobilization five years prior to the start of the transition, for the same reasons described earlier, hoping to capture baseline levels of mobilization prior to the civil resistance campaign. We do not include any rolling average trend.
Table 3 presents the results of these two models. In both cases, we see correlations consistent with the proposed mechanisms. CRTs are associated with an increase in women’s political representation that is 0.046 greater than that associated with non-CRTs. Meanwhile, for countries that experience a CRT the model expects levels of mobilization 0.534 greater than for countries that experience a non-CRT.
OLS regressions of effect of transition type on changes in women’s political representation and mass mobilization, before versus one year after transition
Notes: + p < 0.1, * p < 0.05, ** p < 0.01, *** p < 0.001
HC1 robust standard errors used across models
The Importance of Minority Participation
An additional observable implication of our theory is that we should expect the greatest advances in inclusion to come when members of marginalized groups participate in the civil resistance campaign that drives a CRT, as we articulated in hypotheses 2a, 2b, and 2c. While theories of civil resistance posit that civil resistance campaigns are likely to attract participation from minority groups, the historical record shows that this is not always the case. For example, only 47% of civil resistance campaigns feature participation from more than one ethnic group (Thurber Reference Thurber2018, 260). There is also significant variation in the participation of workers and the economically disadvantaged in civil resistance (Dahlum, Knutsen, and Wig Reference Dahlum, Knutsen and Wig2019). And while some participation by women is prevalent in most civil resistance campaigns, this participation is most commonly occasional, rather than a regular part of the campaign (Chenoweth Reference Chenoweth2019).
To test the impacts of participation by excluded groups in civil resistance on future levels of inclusion, we disaggregate civil resistance transitions by whether they included participation by women, lower economic classes, and excluded ethnic groups. Data on female participation comes from the NAVCO 2.1 dataset’s “gender diversity” measure which takes the value of 1 when a campaign included significant observable participation by women (Chenoweth and Shay Reference Chenoweth and Shay2022). For class, we again use NAVCO 2.1’s parallel measure of “class diversity.” This takes the value of 1 when there is observed diversity in terms of class. Finally, for ethnicity, we use the Ethnic Groups in Contention dataset (Thurber Reference Thurber2018) to determine whether or not at least one politically excluded ethnic group participated in the campaign.
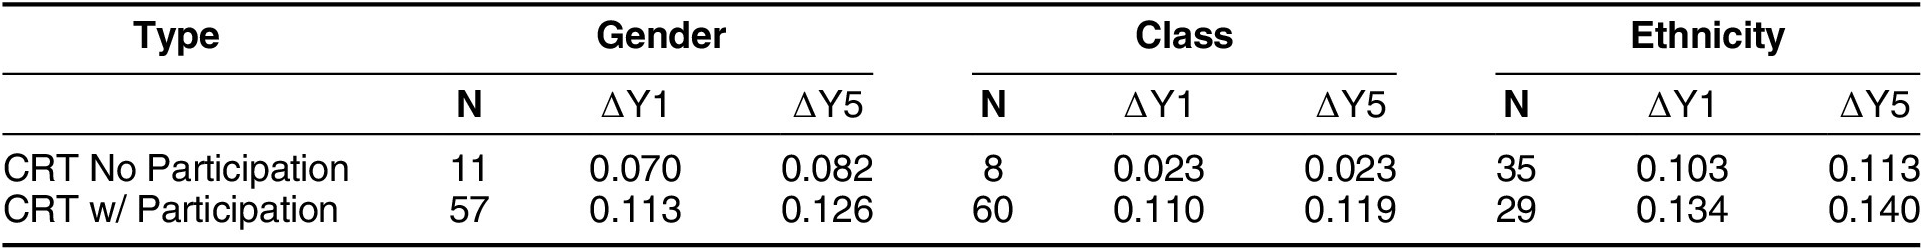
Table 4 breaks down the sample of CRTs by participation in terms of gender, class, and ethnicity, along with the average changes for the related measure of inclusion. We do not conduct any analysis using the overall equality index as there is no single specific type of participation to link it to. Most CRTs included participation by women and by diverse social classes. However, the CRTs that did not feature such participation experienced smaller average changes in inclusion. In the case of ethnicity, the breakdown of participation was more balanced. But, again, CRTs with participation by excluded ethnic groups experienced larger average gains in ethnic inclusion.
Average changes in inclusion measures by group participation
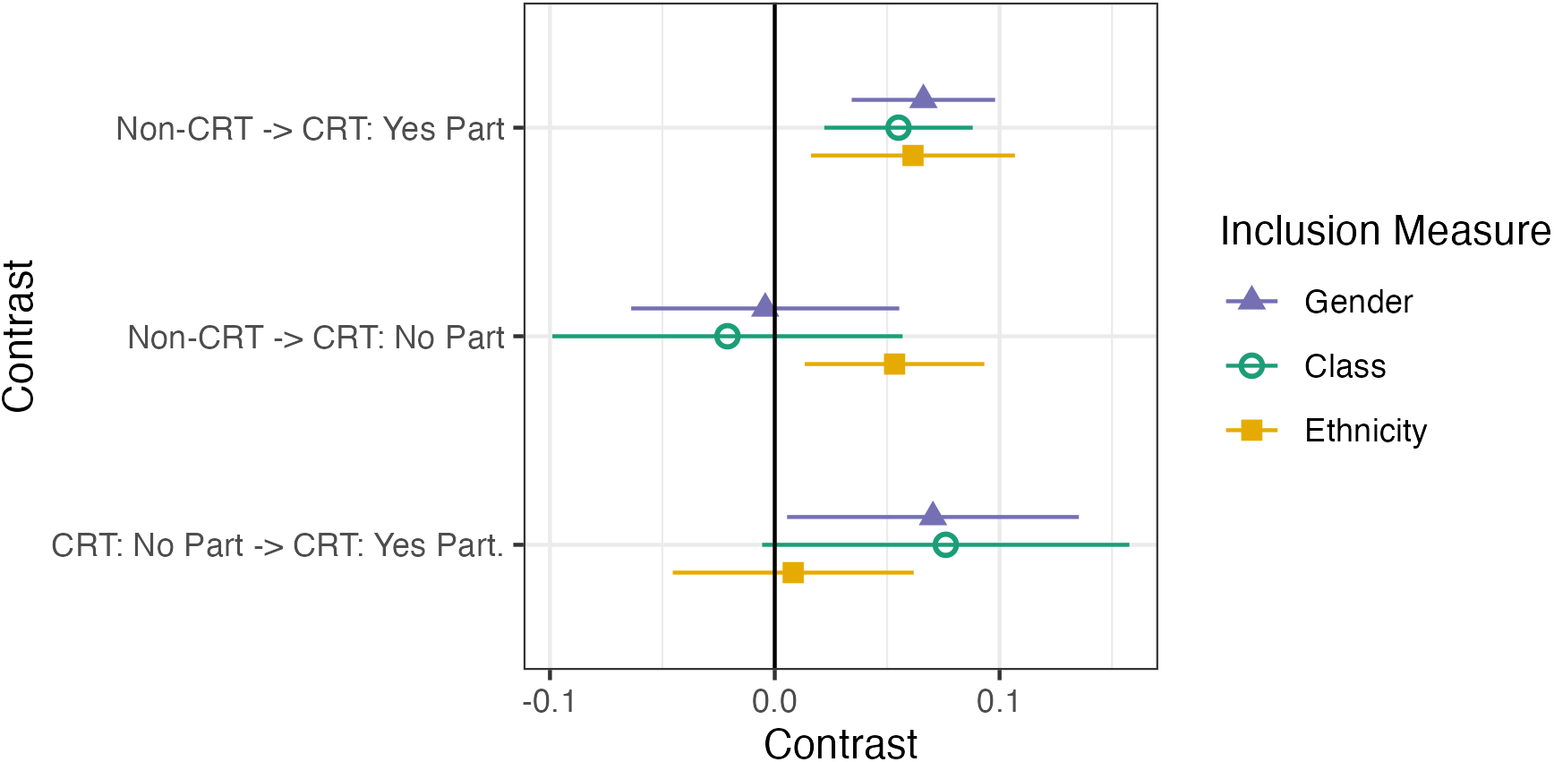
As before, we turn to regression analysis both to assess statistical significance as well as to control for confounding factors. In these models, our independent variable takes three levels: a non-CRT, a CRT with no participation from the excluded group, and a CRT with participation. The results are reported in table 5. Figure 4 presents a plot of pairwise marginal effects contrasting all three levels of the transition participation variable, while figure 5 presents expected values.
OLS Regressions of campaign participation and transition type
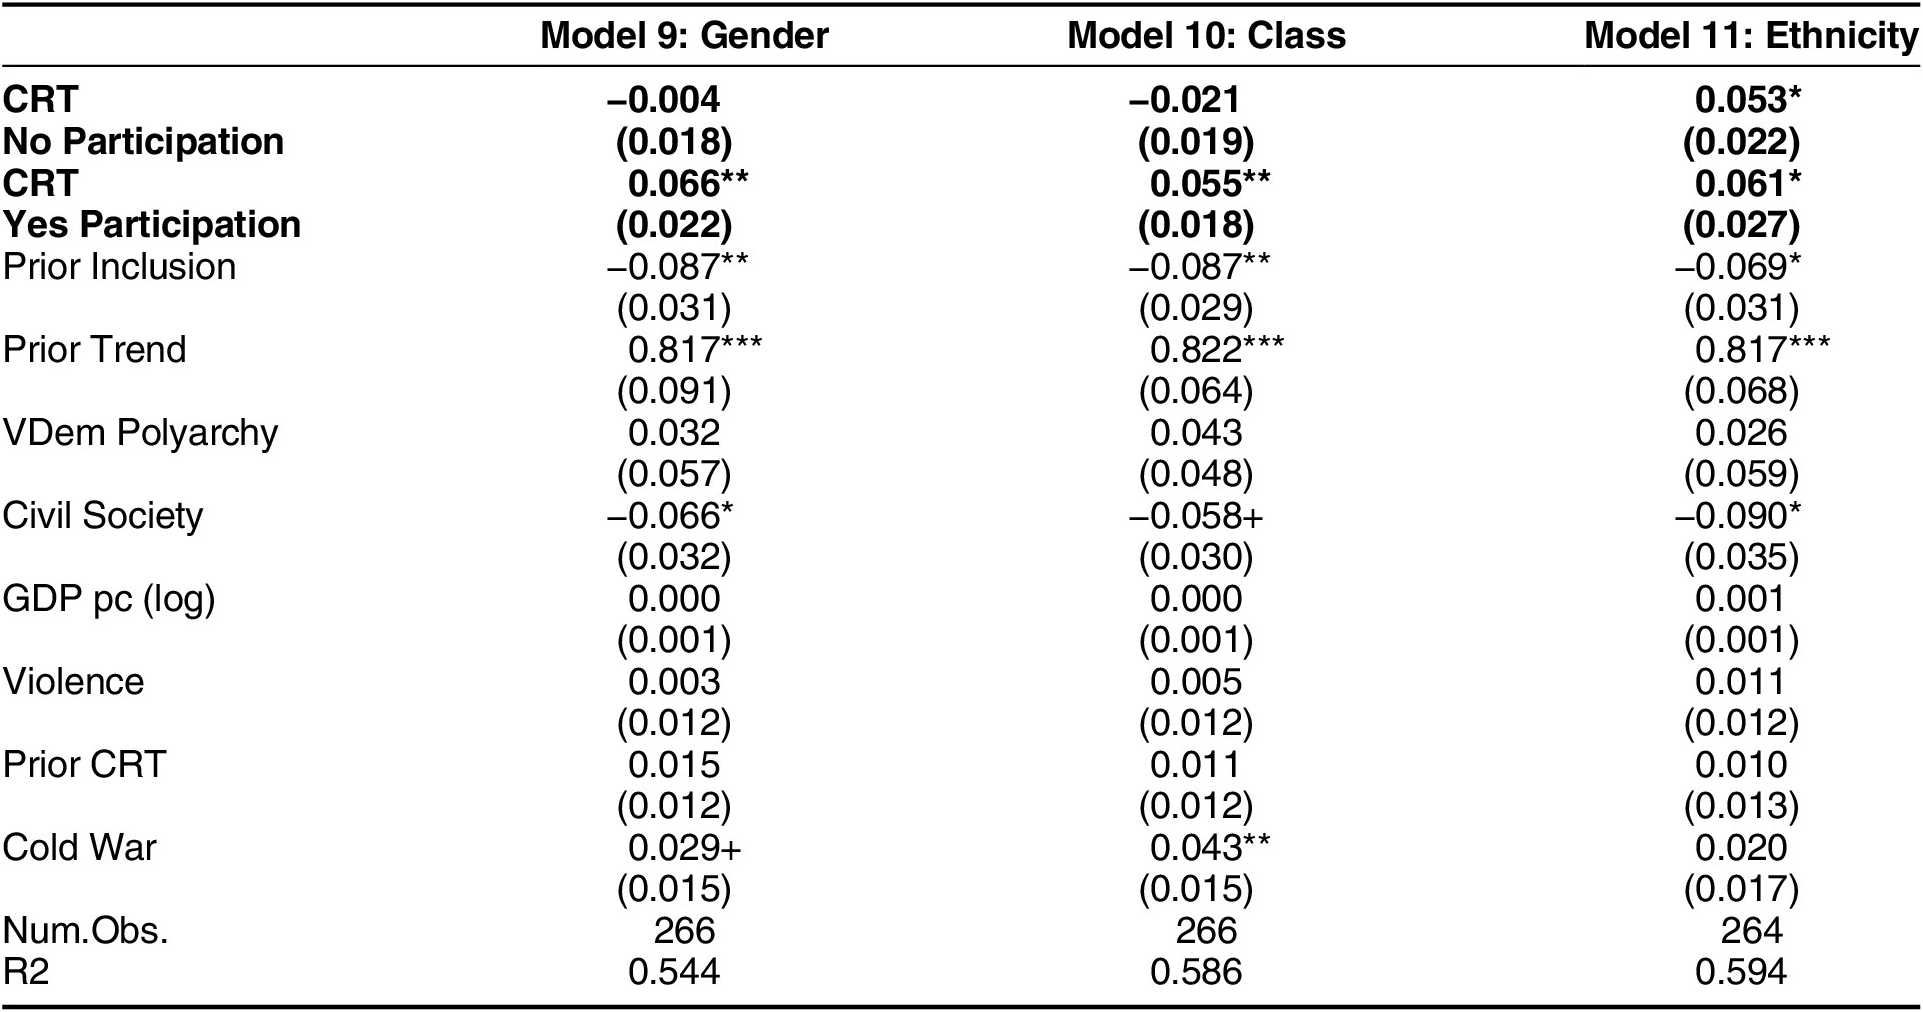
Notes: + p < 0.1, * p < 0.05, ** p < 0.01, *** p < 0.001
HC1 robust standard errors used across models. Prior Inclusion and Prior Trend covariates are specific to the inclusion measure DV and vary between models.
Pairwise contrasts of transition type and participation
Note: The pairwise contrasts reflect differences in the expected changes in the relevant dimension of inclusion between CRTs that included participation from members of each excluded group, CRTs that did not, and non-civil resistance transitions. Participation is specific to the dimension being evaluated: i.e. the “gender” model codes for the participation of women, the “ethnicity” model for the participation of excluded ethnic groups, and the “class” model for class diversity. Estimates come from Models 9-11 in table 5.]
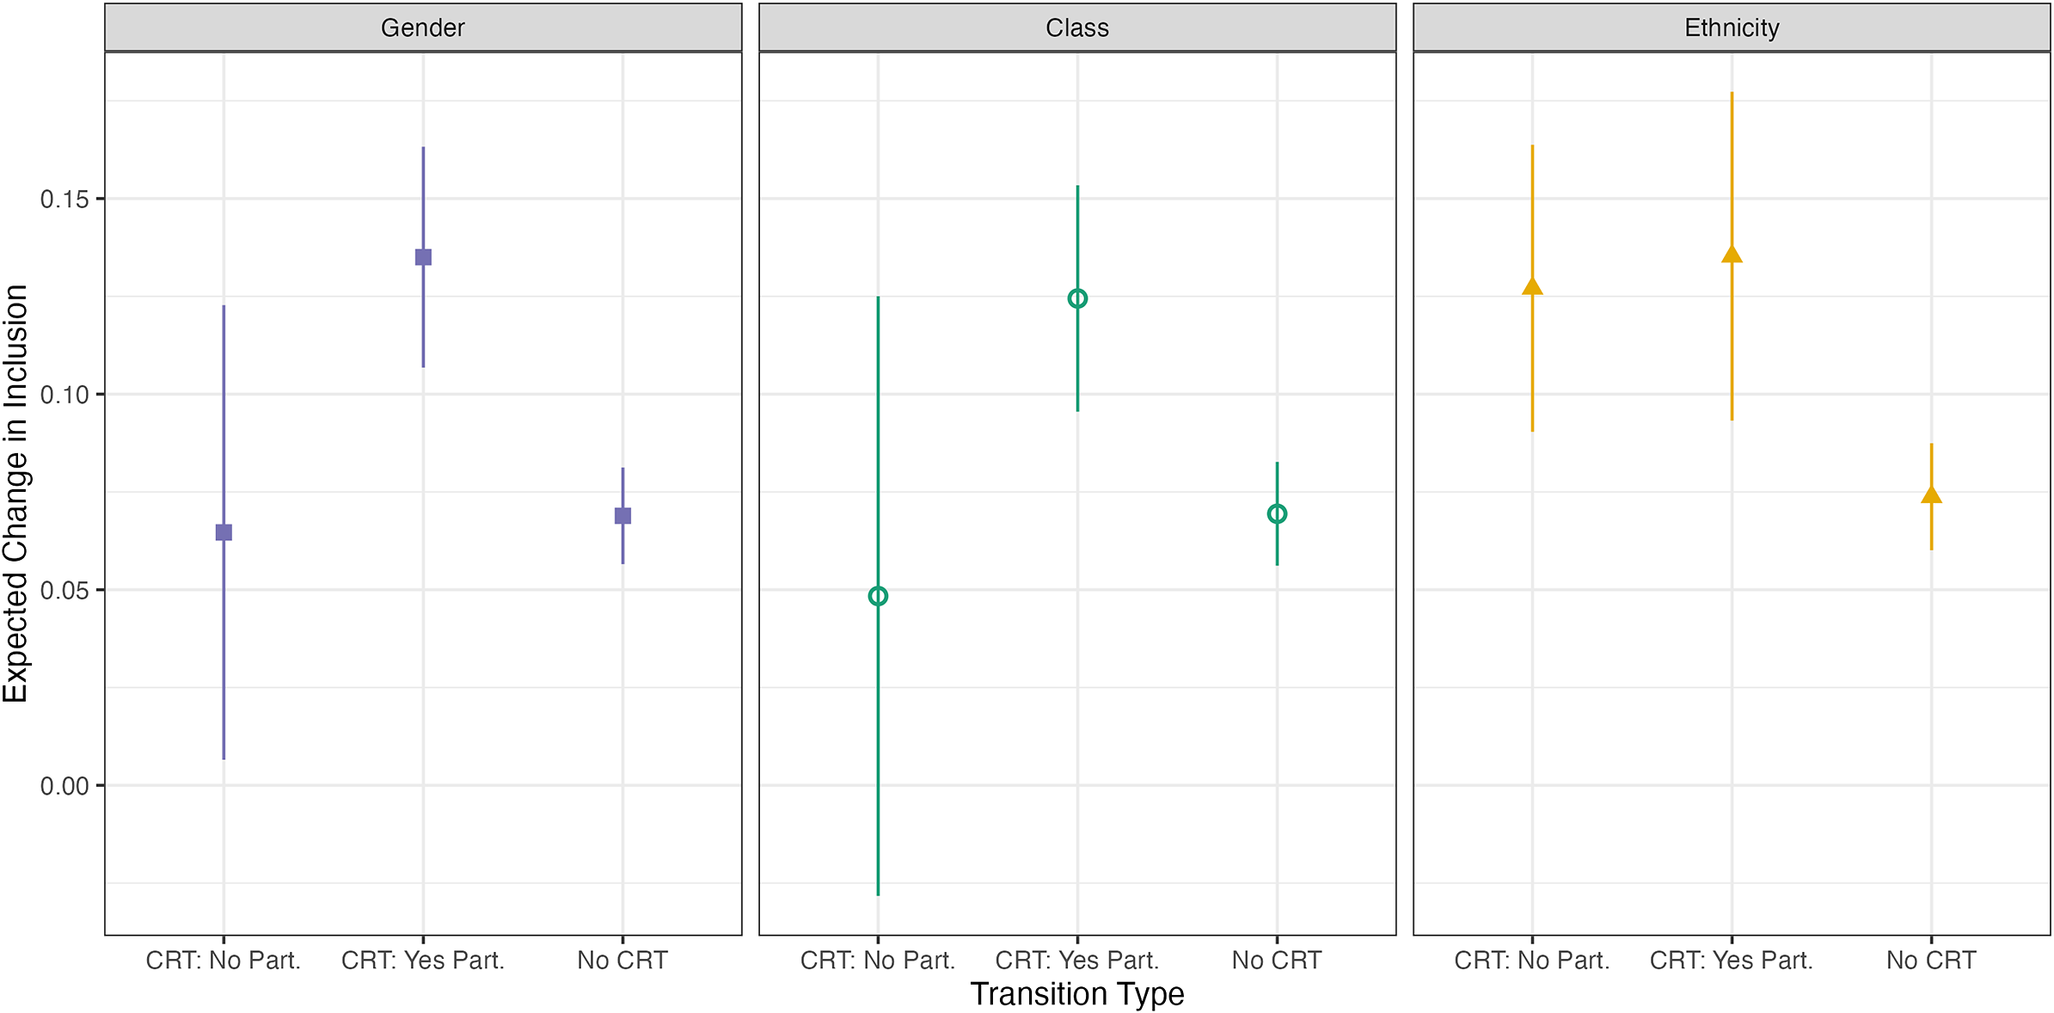
Expected changes in inclusion measures by participation
Note: The values above represent the expected changes in inclusion measures for CRTs with excluded group participation, CRTs without such participation, and non-CRTs. Participation again is specific to the dimension being evaluated. Estimates come from Models 9-11 in table 5 with all other covariates in the models held at their means.
Sensitivity analysis showing robustness to hypothetical confounding variables
Note: The sensitivity analysis illustrates how hypothetical missing confounders would alter the t-value for the main explanatory variable, civil resistance transition, in Model 1. It presents hypothetical confounders one, two, and three times as correlated with both civil resistance transition and inclusion as the lagged inclusion variable, showing that even in the presence of a confounder with levels of correlation three times as strong as the lagged dependent variable, the main finding would still be statistically significant.
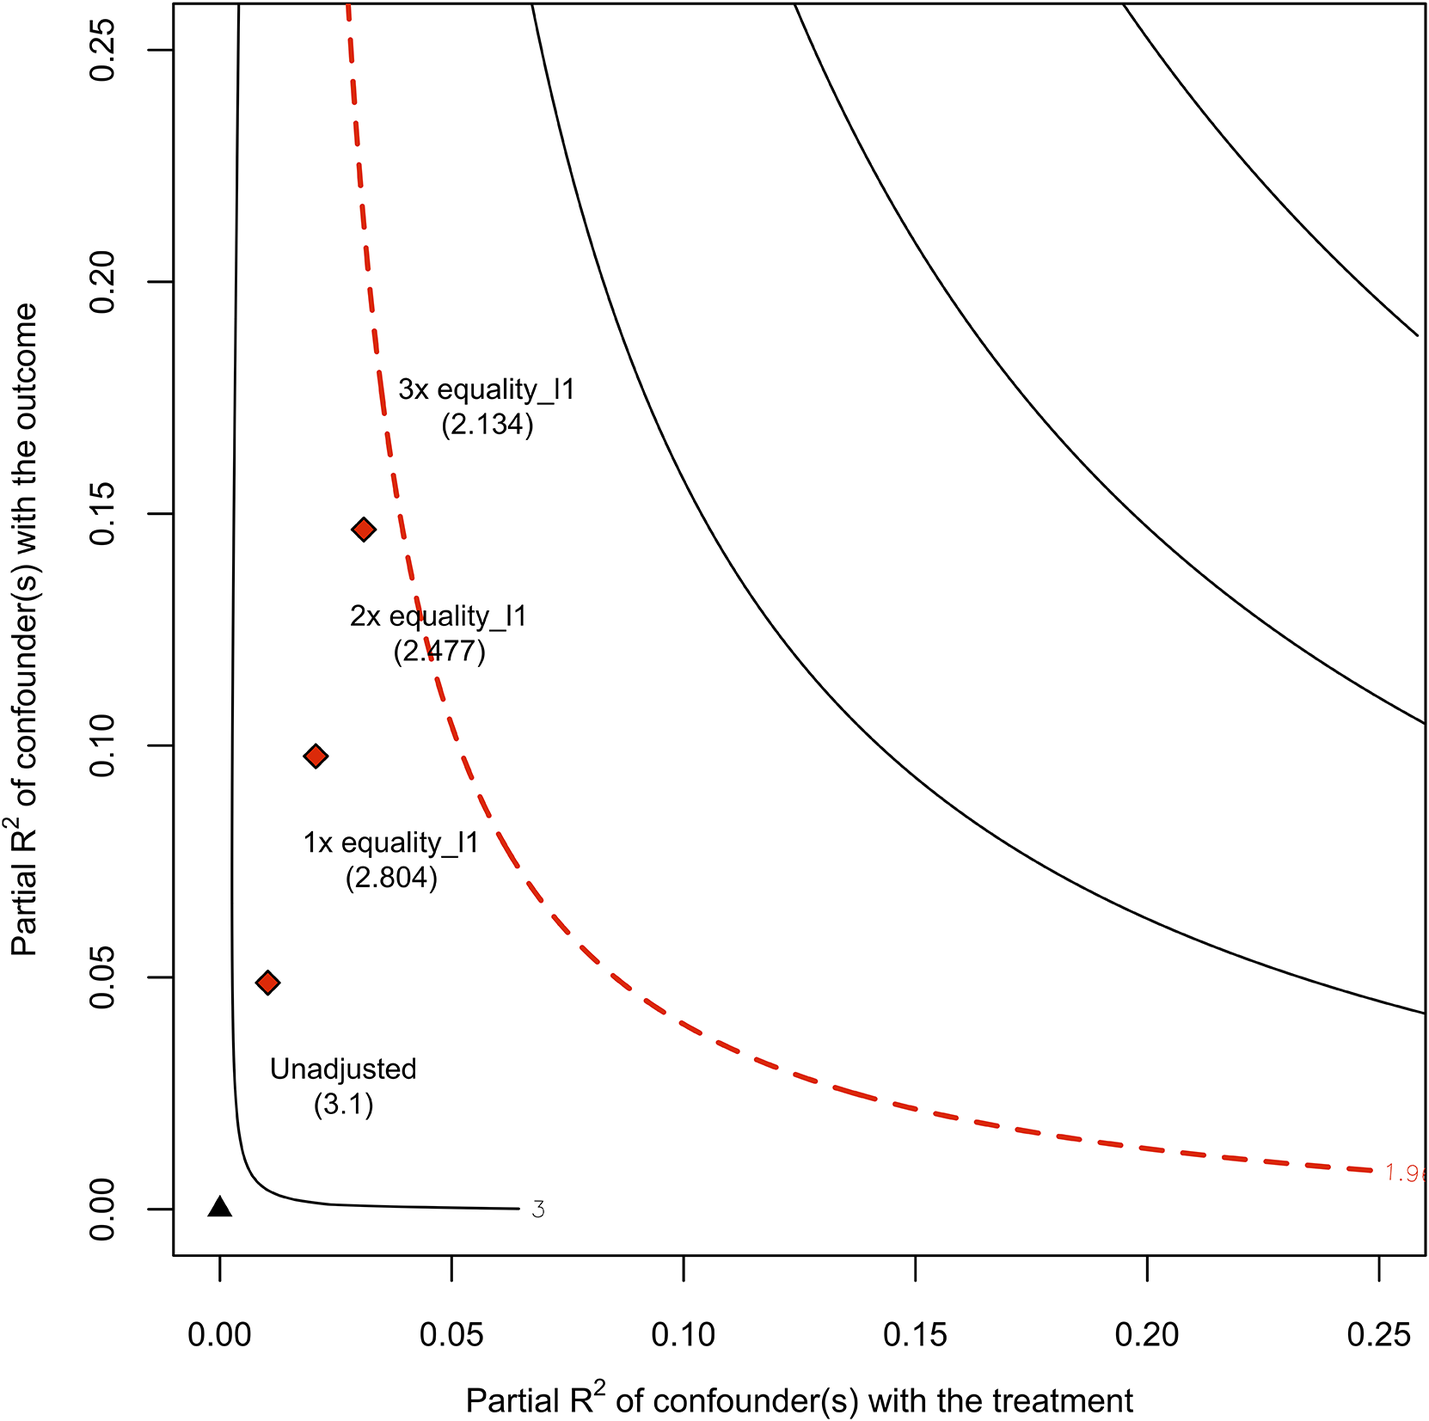
Figure 5 shows that when historically excluded groups participated in civil resistance campaigns, the subsequent transition produced advances in inclusion between 0.12 and 0.14 on the relevant V-Dem scale. By contrast, when CRTs did not include women or members of lower social classes, the increases were less than half that, 0.06 and 0.05, respectively, roughly similar to the gains achieved by non-civil resistance transitions. The one exception to the trend is ethnic participation, where campaigns that did not include members of excluded ethnic groups nevertheless produced advances in inclusion of 0.13, significantly outperforming non-civil resistance transitions. Campaigns that included participation from ethnic minorities still yielded similar advances of 0.14.
Figure 4 shows the pairwise marginal effects between non-CRTs, CRTs with no participation from historically excluded groups, and CRTs with participation from historically excluded groups. In particular, the bottom-most set shows that CRTs with participation by the excluded group achieved higher rates of inclusion across all three dimensions. However, this difference was only statistically significant in the case of gender. Overall, the results are consistent with our expectations about the importance of minority participation in a civil resistance movement to activate the mechanisms that yield post-transition advances in inclusion.
Robustness and Sensitivity
Our reliance on cross-national observational data makes our findings vulnerable to omitted variable bias. In particular, it is possible that civil resistance transitions are more likely in countries and at times that are otherwise ripe for advances in gender, class, and ethnic inclusion. Our basic regression approach tried to limit this risk by comparing only cases where a political transition took place, by controlling for several structural variables such as regime type, and including both lagged measures of the dependent variable as well as the preceding 5-year trend. To further test for possible temporal and geographic dependencies, we run additional models in the online appendix that include regional fixed effects as well as a continuous variable of the year of transition. We also conduct additional analysis to see if our results are driven by the duration of pre-transition mobilization, as with Kadivar’s (Reference Kadivar2018, Reference Kadivar2022) work on democratization, and we do not find significant effects.
Next, as briefly discussed earlier, we ran models using a difference-in-difference approach. Rather than use transitions as the unit of analysis, we used panel data comprised of the country-years from five years before through ten years after the transition.Footnote 15 Similar to our main analysis, our estimand is the difference in the before-versus-after change in equality between CRTs and non-CRTs. We conduct simple DiD models on all four equality measures, then add country-level fixed effects, and finally year-level (“two-way”) fixed effects. These approaches provide yet another way to account for pre-existing differences between countries that go on to experience a CRT versus a non-CRT as well as for temporally specific historical dynamics (e.g., if more CRTs occurred during a period of time in which equality was increasing globally). The results of these models are very similar to our main findings, giving us greater confidence that the CRT advantage is a product of processes unleashed by the mode of transition itself as opposed to other unmeasured properties of the given country or historical time period.
Finally, we conduct sensitivity analyses to assess how strong an omitted confounding variable it would take to overturn our findings from the main analyses. Using the “sensemakr” package in R (Cinelli and Hazlett Reference Cinelli and Hazlett2020), we find that in Model 1 (table 2), an unobserved confounder would have to explain 17.4% of the residual variance of both our independent and dependent variable in order to produce a coefficient estimate for civil resistance transitions of zero. An unobserved confounder that explained 6.8% of the residual variance in each would make our results drop below statistical significance at the p < 0.05 level. Such an omitted variable would also have to be orthogonal to our existing control variables, including the lagged dependent variable as well as the 5-year trend.
As a benchmark, we can compare a hypothetical unmeasured confounder to one of the covariates in our analysis, such as the lagged dependent variable for the equality index. We show in figure 6 that it would take an unmeasured confounder slightly more than three times as strong (in terms of its ability to explain residual variance in both X and Y) as the lagged equality term to produce a result that was no longer statistically significant (t < 1.97). In the online appendix, we present parallel analyses for Models 2-4 in table 3, yielding similar results.
Discussion and Conclusion
Dissidents from communities excluded based on their gender, ethnicity, or class have long recognized that achieving the visible markers of democracy is by no means a sufficient condition for ensuring a just and equal society. Even when leaders are chosen through free and fair elections, the leaders elevated through those elections to positions of power are most typically members of dominant identity groups and use their power to pursue the interests of those groups.
Our results indicate that one key way of changing this picture comes via the mechanism through which old regimes break down and new ones come into being. Transitions achieved through the mass popular mobilization of a maximalist civil resistance campaign result in systematically greater increases in inclusion across the dimensions of gender, class, and ethnicity, and these effects endure for years after the transition ends. This contradicts anecdotal examples and recent research that has suggested that civil resistance is particularly “ineffective” for marginalized groups, especially ethnic minorities. In fact, along the dimension of ethnicity, where prior literature would suggest that civil resistance transitions might struggle to produce gains, we find the greatest observed difference between transitions.
We find evidence as well that the impact of civil resistance campaigns on political transitions can at least in part be explained by civil resistance’s impact elevating leaders from historically excluded groups and diffusing civic mobilization more broadly throughout society. We theorize, based on anecdotal evidence and previous research, that civil resistance also significantly leads to more inclusive norms of political behavior, but we leave the direct testing of this mechanism for future research, as we lack systematic data with which to test it.
The evidence further suggests that participation in civil resistance by excluded groups has important effects on inclusion, though there is less certainty in these results due to small sample sizes. Much of the general effect of civil resistance transitions on inclusion can be explained by that subset of transitions that featured participation by women, lower social classes, and (to a lesser extent) excluded ethnic groups. This supports evidence from the examples cited earlier in our paper showing that participation in civil resistance by excluded groups can elevate leaders from those groups and diffuse social capital and organizing capacity in ways that promote greater inclusion.
Civil resistance is also by no means the only factor affecting patterns in political inclusion. Indeed, the strongest factor consistently predicting higher inclusion is the time trend. Improving global norms, including the general trend of better human rights protections (Fariss Reference Fariss2014), likely play a central role here. Yet despite the impact of these other factors, the effect of civil resistance remains substantive. For example, the marginal effect of a civil resistance transition on the gender inclusion index (0.04) is equivalent to Nepal’s improvement on gender inclusion following the legalization of abortion in 1999.
It is also important to consider the scope of these results in terms of the comparative baseline. We are examining political transitions, and the factors that shape the character of the political regimes that follow them. In this context, it appears that civil resistance has a significant positive effect. While we consider it reasonable to look at this as a piece of evidence for a broader effect of civil resistance on inclusion of excluded groups, these results do not directly show that such an effect obtains outside of the conditions of political transitions. Could civil resistance campaigns produce advances in inclusion even when they fail to precipitate regime change? How do the outcomes of civil resistance campaigns in terms of inclusion compare more generally to the outcomes of armed insurgencies? We leave such questions for further research. Future studies might also attempt to parse which of the specific explanatory mechanisms have the greatest effect.
In terms of practical and policy recommendations, we echo longstanding calls to take seriously the promise of civil resistance to achieve major political transformation. Policymakers, practitioners, and scholars have long been interested in post-civil war regime trajectories. This is understandable given the threat of reversion to violence. But post-war contexts represent a small percentage of cases of regime transition or democratization. Civil resistance transitions are both far more common and have yielded substantial advances in political inclusion.
Finally, the concept of inclusion is not merely academic. It represents meaningful improvements in the lives of members of historically excluded social groups. It also aligns with types of structural inequalities that are associated with an increased risk of political violence. Civil resistance is thus not simply a means of achieving regime change without violence; it has the potential to address the underlying grievances that fuel conflict.
Supplementary material
To view supplementary material for this article, please visit http://doi.org/10.1017/S1537592724000999.
Data Replication
Data replication sets are available in Harvard Dataverse at: https://doi.org/10.7910/DVN/H6DSYF
Acknowledgments
The authors wish to thank the United States Institute of Peace for generous financial support of this research, and Rebecca Aaberg, Luke Abbs, Reyko Huang, Madhav Joshi, Roman-Gabriel Olar, Maria Stephan, Peter White, and audiences for our presentations at the United States Institute of Peace, the International Foundation for Electoral Systems (IFES), and the annual meetings of the Conflict Research Society and International Studies Association for helpful comments on earlier drafts of this article.


 Open access