


1. Introduction
The (re)insurance industry has traditionally placed greater emphasis on modeling natural catastrophe perils with the highest loss potentials, such as earthquakes and cyclones, compared to the more frequent, small-to-mid-sized events sometimes termed “secondary perils,” such as thunderstorms, hail, and flash floods. This delineation has blurred in recent years, with secondary perils being the predominant driver of catastrophe insurance losses over the last decade (Aon, 2020) and causing over 70% of the $81 billion (USD) insured catastrophe losses in 2020 worldwide (Swiss Re Institute, 2021). As shifting weather and socioeconomic patterns continue generating larger property exposure (Changnon, Reference Changnon2009), increased modeling and monitoring for secondary perils offer opportunities for insurers to incorporate detailed weather and claims information to manage weather risk more effectively.
The purpose of our work is to provide a statistical method for insurers to predict the financial impact of spatially dependent property insurance losses arising out of convective storms. Since the 1970s, severe convective storms have been responsible for more insurance damage than any other secondary peril in the US, with significantly increasing insured losses throughout this period even after normalization (Barthel and Neumayer, Reference Barthel and Neumayer2012). Despite being short-lived and geographically smaller-scaled, convective storms can exhibit extreme intensity that can accumulate very large losses at the aggregate event level (Insurance Information Institute, 2020b). Their highly localized nature results in a setting where concentrated groups of properties are simultaneously affected by storms of varying intensity, inducing complicated dependence structures between claims.
The dependence between insured property losses from a storm can arise from two sources: the inherent spatial dependence between properties based on their physical proximity to each other and the dependence induced by the common shock of experiencing the same storm. To accommodate the distinctive features of insurance losses, we propose a copula-based regression model for replicated spatial data. The proposed method demonstrates two key advantages, aligning well with the goal of this study: first, it establish a predictive model for non-normal insurance claims data, mixed outcomes in our context, while incorporating heterogeneity from weather, property, and policy characteristics; second, it extends the model to the multivariate context in the spatial dimension, accommodating both spatial and aspatial dependence among insurance claims. It is notable that predictive modeling for replicated spatial data, particularly for non-normal data, has received limited attention in the literature. Our work builds on and further extends the copula-based regression literature. The central piece of our model is the spatial factor copula proposed by Krupskii et al. (Reference Krupskii, Huser and Genton2018), where the dependence structure is formulated as the copula extracted from a spatial factor process. The underlying factor process consists of a random field specifying location-based dependence and a latent factor jointly affecting all observations in a storm regardless of location. The resulting copula-based regression framework allows us to flexibly accommodate the unique features of insurance losses such as skew, excess zeros, and heavy tails, under well-studied univariate models incorporating rich covariate information, while retaining the interpretation of latent sources of dependence among the joint losses.
The particular type of convective storm event in our application focus is hail, the leading sub-peril comprising 50–80% of convective storm losses in any given year (Insurance Information Institute, 2020b). Hail and wind damage have consistently accounted for the most substantial portion of annual US homeowners insurance losses over the past two decades (Insurance Information Institute, 2020a). In 2021, the US experienced 20 weather and climate disasters where the damages exceeded $1 billion, 7 of which were related to hail damage (NOAA NCEI, 2022). We analyze a replicated spatial dataset of hail property claims that leverages hail radar maps to identify claims arising out of a given hailstorm. Incorporating rich weather, property, and policy characteristics, we demonstrate how insurers can harness the growing availability of detailed weather and claims information to enhance their claims management for hail and other storm perils.
There are limited studies in the literature assessing hail risk using property insurance claims, primarily due to the lack of data (Changnon, Reference Changnon1999). Recent studies are Brown et al. (Reference Brown, Pogorzelski and Giammanco2015), Shi et al. (Reference Shi, Fung and Dickinson2022), and Gao and Shi (Reference Gao and Shi2022). From a loss control perspective, Brown et al. (Reference Brown, Pogorzelski and Giammanco2015) evaluate the resilience of various roofing materials to hail by analyzing claims associated with a single large storm in the Dallas-Fort Worth area from multiple local insurers. Shi et al. (Reference Shi, Fung and Dickinson2022) study the arrival times of insurance claims, as well as their relationship with the subsequent loss amounts using a marked counting process. To support proactive insurer claims management, Gao and Shi (Reference Gao and Shi2022) predict the geographical distribution of insurance claim reports immediately after a hailstorm occurs by incorporating high-resolution weather information in a spatial point process framework. In contrast, our work emphasizes the dependence among joint insured losses from a storm that are particularly prone to concentration as a hazard and examines claim severity given the reporting of claims using methods for spatial modeling of geostatistical data. Our model allows insurers to decompose sources of dependence in hail property claims to make claims management decisions based on predictive distributions of the insured losses. For example, predicting the joint losses stemming from a hailstorm can inform insurers’ weather risk retention and transfer decisions, which we demonstrate with an application in the reinsurance context. We also supplement the literature on insurance claims modeling for other secondary perils and convective storm events. Recent settings include flooding (Lyubchich and Gel, Reference Lyubchich and Gel2017), water damage (Haug et al., Reference Haug, Dimakos, Vårdal, Aldrin and Meze-Hausken2011; Scheel et al., Reference Scheel, Ferkingstad, Frigessi, Haug, Hinnerichsen and Meze-Hausken2013; Spekkers et al., Reference Spekkers, Kok, Clemens and Ten Veldhuis2013), and thunderstorm winds in Hua et al. (Reference Hua, Xia and Basu2017).
More broadly, our work extends the actuarial literature on the role of statistical methods and predictive analytics in improving insurance operations. A comprehensive review on analytics in key operational areas of non-life insurance is given in Frees (Reference Frees2015), which emphasizes the value of adopting a micro-oriented view of individual insurance contract developments. Micro-level models using granular insurance data have been actively developing in the key functional areas of ratemaking (for example, Shi et al., Reference Shi, Feng and Boucher2016; Yang and Shi, Reference Yang and Shi2019; Henckaerts et al., Reference Henckaerts, Côté, Antonio and Verbelen2021, and Shi and Zhao, Reference Shi and Zhao2020) and loss reserving (for example, Pigeon et al., Reference Pigeon, Antonio and Denuit2013; Antonio and Plat, Reference Antonio and Plat2014; Wüthrich, Reference Wüthrich2018, and Badescu et al., Reference Badescu, Lin and Tang2016; Badescu et al., Reference Badescu, Chen, Lin and Tang2019). We contribute to the burgeoning literature on micro-level models supporting insurer claims management, particularly for insurance claims due to weather-related perils (for example, Shi et al., Reference Shi, Fung and Dickinson2022 and Gao and Shi, Reference Gao and Shi2022). As losses from secondary perils continue to increase, insurers are reevaluating their reinsurance protection, and aggregate excess-of-loss reinsurance is an effective way for insurers to manage the volatility in event severity (Aon, 2021). Our model allows insurers to capture the dependence in property claims stemming from a storm event and obtain predictive distributions of storm-level losses to better understand excess layers for retention and transfer decisions.
Finally, on the computational front, our contribution involves a two-stage estimation procedure to estimate the parameters in the proposed model. Existing literature on spatial modeling of insurance claims is sparse, with a few examples including Shi and Shi (Reference Shi and Shi2017) and Tufvesson et al. (Reference Tufvesson, Lindström and Lindström2019) in automobile insurance, Zhao et al. (Reference Zhao, Shi and Feng2021) in property insurance, and Huang et al. (Reference Huang, Zhang and Zhu2024) in crop insurance. To the best of our knowledge, our work is among the first to address the unique features posed by replicated spatially dependent insurance claims data. A number of characteristics unique to our context make existing estimation approaches, such as maximum likelihood estimation (Huang et al., Reference Huang, Zhang and Zhu2024) and Bayesian estimation (Shi and Shi, Reference Shi and Shi2017; Tufvesson et al., Reference Tufvesson, Lindström and Lindström2019) prohibitively expensive. First, unlike the repeated measurements taken at a low number of fixed locations, our replicated spatial data are unbalanced, where the number of claims in a storm may range from one to thousands at varying locations, leading to dimensionality concerns. Second, insurance losses often exhibit a probability mass at zero from coverage denials or modifications such as the deductible. The discreteness in the outcome greatly complicates the evaluation of the copula density in the likelihood function by introducing a numerical integration problem. At the intersection of these two challenges, a large number of zero-payment claims within a storm require computing high-dimensional multiple integrals with dimensions that may be in the hundreds or thousands. The proposed two-stage estimation, inspired by the multilevel composite likelihood method in Zhao et al. (Reference Zhao, Shi and Feng2021), extends its scope to the context of replicated spatial data.
The rest of the article proceeds as follows: Section 2 describes the property insurance hail claims data, Section 3 introduces our spatial factor copula regression model, Section 4 discusses the estimation procedure of our proposed model, Section 5 analyzes the hail damage claims using our model, Section 6 explores a claims management application, and Section 7 concludes.
2. Data
The severity of hail damage property insurance claims that arise from multiple hailstorms constitutes replicated spatial data, where the insurer observes the geographical locations of the reported claims associated with each hailstorm. Similar to the approach in Shi et al. (Reference Shi, Fung and Dickinson2022) and Gao and Shi (Reference Gao and Shi2022) examining the occurrence of claims, we construct the dataset of hail claims by overlaying hail radar maps on top of the insurer’s exposure map of in-force policies to study the dependence in the severity of the reported claims from each storm.
Our hail property insurance claims data consist of policyholder claims from a major U.S. insurer operating in the personal homeowners line of business in Kansas over 2011–2015. The radar maps of hail experience were obtained by the insurer from a third-party vendor. We define hailstorms based on hail event day within a county, which assumes that all hail experienced in a county on a given day belong to a distinct storm. We acknowledge that the definition of a hailstorm is a data limitation in this setting since the hail maps do not distinguish between different hail swaths on the same day, and only identify regions that experienced hail on a particular day. In total, we observe 839 hailstorms in Kansas producing 23,882 hail property claims over the sampling period.
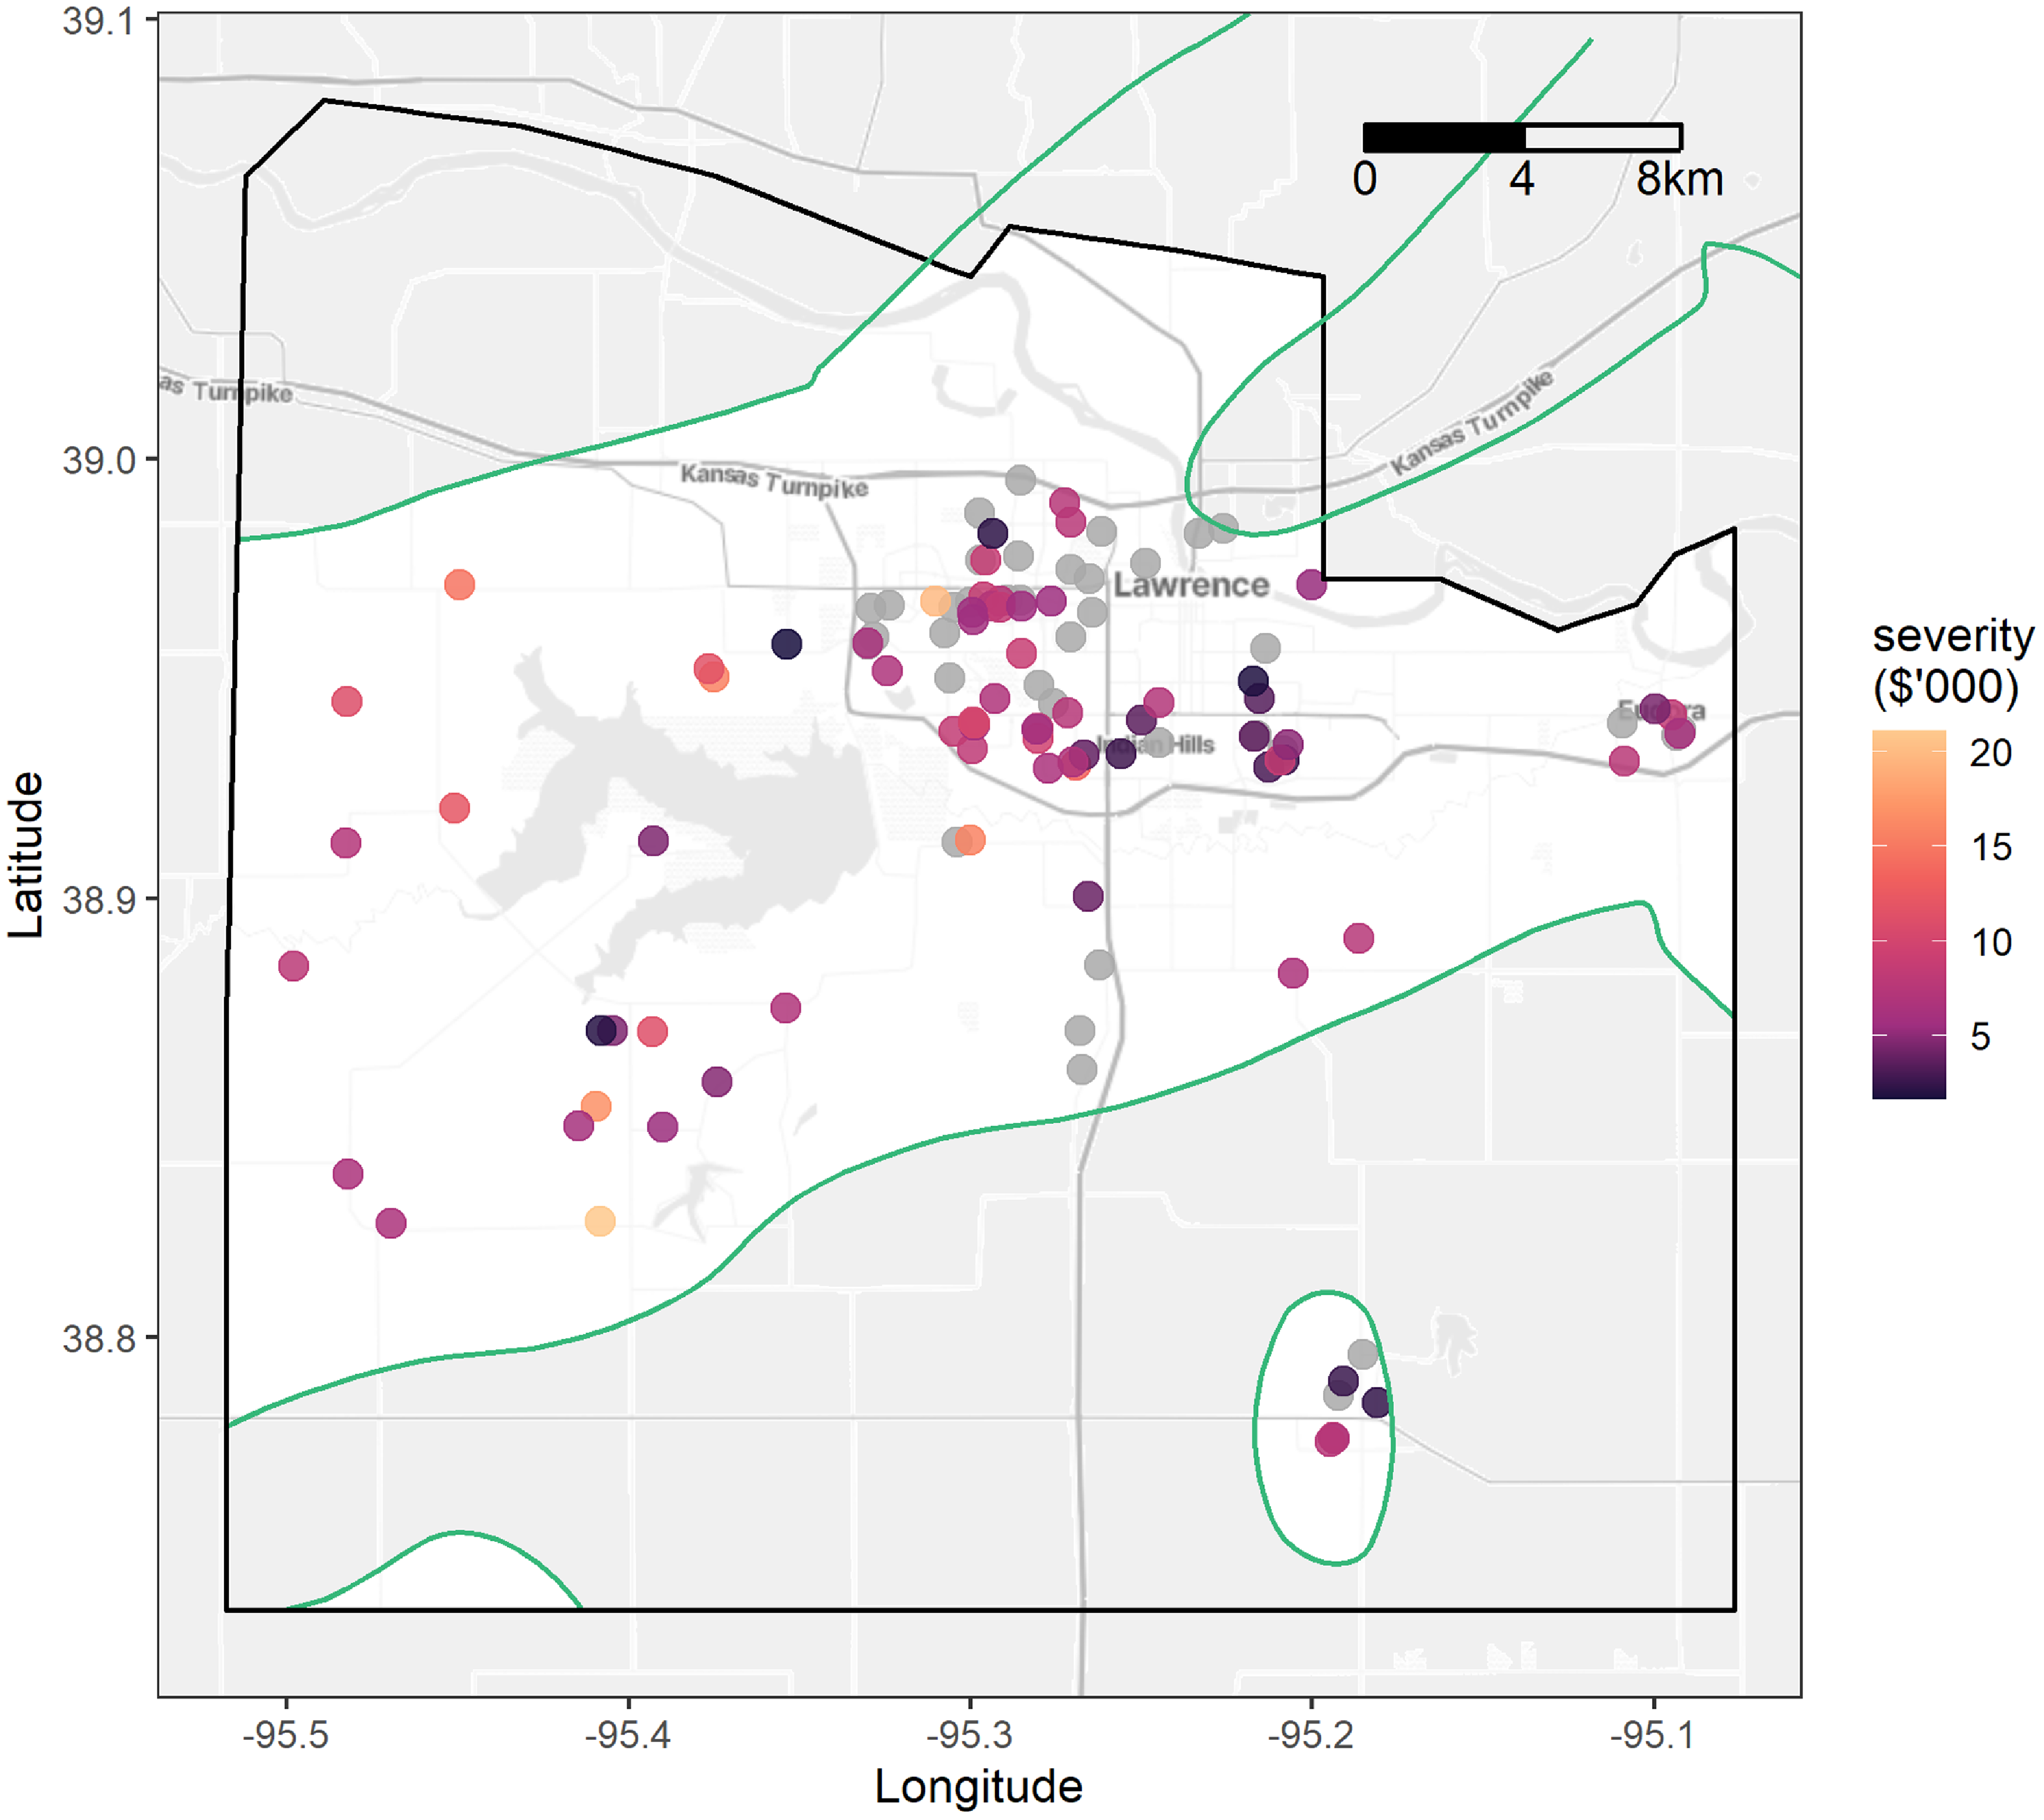
As an example, Figure 1 displays the locations and severity of the claims arising out of a hail event on April 3, 2011, as identified by the hail radar map (green) in Douglas County (black), with zero payment claims in gray. As foreshadowed by the figure, not all filed claims result in positive payments. There are filed claims with “denied coverage,” a general term we use to encompass any reason for zero payments, including, but not limited to, the case where the loss amount falls below the policy deductible. The hail claim severity outcomes are thus semicontinuous, with a discrete probability mass at zero and a positive continuous component. Figure 2 exhibits the distribution of the insured losses on the original scale in the left panel and on the log scale in the right panel. Notably, the distribution features inflated zero outcomes and heavy tails.
Locations and severity of hail claims from storm on April 3, 2011, in Douglas County (black) with hail radar outline (green). Claims with zero payment are in gray.
Distribution of claim severity following a hailstorm on the original scale (left) and log scale (right).

The observed heterogeneity at the claim locations for each hailstorm consists of traditional policyholder-level rating variables and claim characteristics, as well as event-level features that can be spatially invariant or spatially varying. At the policyholder level, property characteristics consist of the building age in years, construction type (frame, masonry, or other), roof type (asphalt, slate, metal, tile, wood, flat, or other), and property type (outbuilding, single family residence, or multi-family residence). Policy characteristics consist of the deductible and coverage amount, and claim characteristics consist of the reporting lag in days between the hailstorm occurrence and claim filing dates.
Event-level features are predictors that are uniquely measured for each hailstorm. As a result, these features are storm specific and may either be spatially varying or identical for all properties exposed to the same storm. In our analysis, event-level features include the season (winter, spring, summer, or fall), density of the insured properties affected by the storm (number of exposures per unit area of the radar-defined storm observation window), as well as spatially varying weather information on hail size, wind speed, and wind direction. Due to the data limitation of only observing the date of a hailstorm rather than the exact timestamp, corresponding weather information is also at a daily resolution. Hail sizes for individual hailstorms (measured as hailstone diameter in inches) are given in the hail radar maps from the insurer’s third-party vendor. We obtain wind information across each storm from daily U.S. weather data collected from land surface stations by the National Oceanic Atmospheric Administration (NOAA; see NOAA et al., 1998 for data collection details) and archived in the Global Historical Climatology Network (GHCN)-Daily database (Menne et al., Reference Menne, Durre, Vose, Gleason and Houston2012). We incorporate wind information from the 262 Kansas climate-monitoring stations on the days with hailstorm occurrences over 2011–2015. To illustrate our proposed method, we use ordinary kriging to interpolate wind measurements at the claim locations following Gao and Shi (Reference Gao and Shi2022), but note that spatial interpolation is a large topic in atmospheric science and statistical science literature. Wind speed measures the rate at which air is moving horizontally past a given point in meters per second and records the fastest consecutive 2-min average speed over the 24-h period ending at local midnight. Wind direction describes the prevailing direction from which the fastest 2-min wind is blowing, in tens of degrees from $10^{\circ}$
clockwise through
$10^{\circ}$
clockwise through $360^{\circ}$
, where
$360^{\circ}$
, where $360^{\circ}$
represents a north wind (i.e., blowing from the north to the south). As a circular predictor where
$360^{\circ}$
represents a north wind (i.e., blowing from the north to the south). As a circular predictor where $10^{\circ}$
is closer to
$10^{\circ}$
is closer to $360^{\circ}$
than to
$360^{\circ}$
than to $30^{\circ}$
, we decompose the wind direction into the sine and cosine (vertical and horizontal components respectively) prior to interpolation (Al-Daffaie and Khan, Reference Al-Daffaie and Khan2017).
$30^{\circ}$
, we decompose the wind direction into the sine and cosine (vertical and horizontal components respectively) prior to interpolation (Al-Daffaie and Khan, Reference Al-Daffaie and Khan2017).
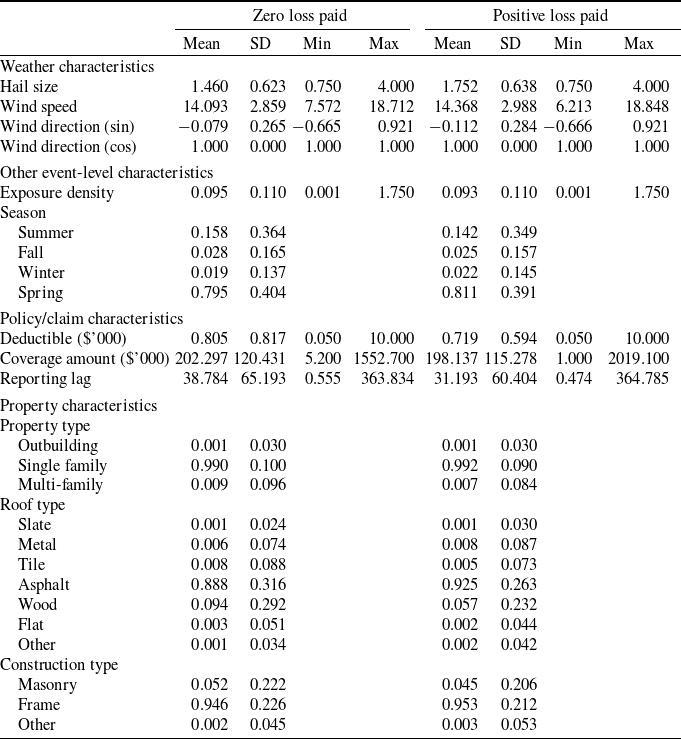
The event-level, policy/claim, and property characteristics at the claim locations from each hailstorm are summarized separately across claims that resulted in zero loss payment and claims that resulted in a positive loss payment in Table 1. On average, larger hail sizes and higher wind speed are observed in claims that resulted in positive loss payments compared to claims with no payment. In addition, there is a longer average reporting lag between the hailstorm occurrence and claim filing for claims with no payment, which may indicate that minor property damage takes longer to detect and is less likely to exceed the deductible. On average, relatively more claims from properties with asphalt roofing or frame construction resulted in positive payments. The observed heterogeneity from the policy-level and storm-level weather covariates, along with the spatial and aspatial dependence between claims from a given hailstorm, are characteristics that motivate our factor copula model.
Descriptive statistics for covariates by whether the claim paid was positive.
3. Methodology
We use a factor copula regression framework to jointly model the insured losses of property insurance claims that are filed following the occurrence of a hailstorm. Assume a hailstorm generates n property damage claims at locations $\{s_1,\ldots,s_n\} \in \mathbb{R}^2$
. Let
$\{s_1,\ldots,s_n\} \in \mathbb{R}^2$
. Let $\{Y(s_1),\ldots, Y(s_n)\}$
be the collection of corresponding claim payments and denote
$\{Y(s_1),\ldots, Y(s_n)\}$
be the collection of corresponding claim payments and denote $Y(s_j) = Y_j$
for
$Y(s_j) = Y_j$
for $j=1,\ldots,n$
, and
$j=1,\ldots,n$
, and $\boldsymbol{Y}=(Y_1,\ldots,Y_n)$
. Further, denote the set of predictors for the property located at s by
$\boldsymbol{Y}=(Y_1,\ldots,Y_n)$
. Further, denote the set of predictors for the property located at s by $\boldsymbol{X}(s)=(X_1(s),\ldots,X_p(s))$
, which may consist of a combination of weather information, property characteristics, and contract features. We similarly use the notation
$\boldsymbol{X}(s)=(X_1(s),\ldots,X_p(s))$
, which may consist of a combination of weather information, property characteristics, and contract features. We similarly use the notation $\boldsymbol{X}(s_j) = \boldsymbol{X}_j$
for
$\boldsymbol{X}(s_j) = \boldsymbol{X}_j$
for $j=1,\ldots,n$
, and
$j=1,\ldots,n$
, and $\boldsymbol{X}=(\boldsymbol{X}_1,\ldots, \boldsymbol{X}_n)$
. By Sklar’s theorem for conditional distributions (Patton, Reference Patton2006), the joint distribution of
$\boldsymbol{X}=(\boldsymbol{X}_1,\ldots, \boldsymbol{X}_n)$
. By Sklar’s theorem for conditional distributions (Patton, Reference Patton2006), the joint distribution of $\boldsymbol{Y}$
given
$\boldsymbol{Y}$
given $\boldsymbol{X}$
can be represented using a multivariate copula such as
$\boldsymbol{X}$
can be represented using a multivariate copula such as
 \begin{align} F_{\boldsymbol{Y}}(y_1,\ldots,y_n|\boldsymbol{X}) &= \textrm{Pr} (Y_1 \leq y_1,..., Y_n \leq y_n| \boldsymbol{X}) \nonumber \\ &= C(F_1(y_1|\boldsymbol{X}),..., F_n(y_n|\boldsymbol{X})| \boldsymbol{X}),\end{align}
where $F_j(\!\cdot\!|\boldsymbol{X})$
is the conditional distribution function for
$F_j(\!\cdot\!|\boldsymbol{X})$
is the conditional distribution function for $Y_j$
given
$Y_j$
given $\boldsymbol{X}$
and
$\boldsymbol{X}$
and $C(\!\cdot \!| \boldsymbol{X})$
is the conditional copula. We make two additional assumptions: (i)
$C(\!\cdot \!| \boldsymbol{X})$
is the conditional copula. We make two additional assumptions: (i) $F_j(\!\cdot \!|\boldsymbol{X}) = F_j(\!\cdot \!|\boldsymbol{X}_j)$
and (ii)
$F_j(\!\cdot \!|\boldsymbol{X}) = F_j(\!\cdot \!|\boldsymbol{X}_j)$
and (ii) $C(\!\cdot \!|\boldsymbol{X}) = C(\!\cdot \!|{\boldsymbol{D}})$
, where
$C(\!\cdot \!|\boldsymbol{X}) = C(\!\cdot \!|{\boldsymbol{D}})$
, where $\boldsymbol{D}$
is a nonstochastic symmetric matrix of pairwise spatial distances, that is,
$\boldsymbol{D}$
is a nonstochastic symmetric matrix of pairwise spatial distances, that is, $\boldsymbol{D} = \left[r_{ij} \right]_{i,j=1}^{n}$
with
$\boldsymbol{D} = \left[r_{ij} \right]_{i,j=1}^{n}$
with $r_{ij} = r_{ji}$
. The first assumption permits different sets of covariates to be used for each marginal distribution. In our application, it is reasonable to assume that, given the predictors measured at the location of the property, predictors at other locations carry no additional information on the insured losses. The second assumption is standard in spatial statistics literature; we assume second-order spatial stationarity, where conditional on the observed heterogeneity, the association between two observations is a function of their spatial distance.
$r_{ij} = r_{ji}$
. The first assumption permits different sets of covariates to be used for each marginal distribution. In our application, it is reasonable to assume that, given the predictors measured at the location of the property, predictors at other locations carry no additional information on the insured losses. The second assumption is standard in spatial statistics literature; we assume second-order spatial stationarity, where conditional on the observed heterogeneity, the association between two observations is a function of their spatial distance.
In our context, a policyholder may be denied payment due to contract features such as the deductible. As a result, the distribution of $Y_j$
features a probability mass at zero. For vector
$Y_j$
features a probability mass at zero. For vector $\boldsymbol{Y}$
, let
$\boldsymbol{Y}$
, let $I_{+}=\{i_1,\ldots,i_k\}$
be the indices for the positive payments. The joint density of (3.1) can be expressed as
$I_{+}=\{i_1,\ldots,i_k\}$
be the indices for the positive payments. The joint density of (3.1) can be expressed as
 \begin{align} f_{\boldsymbol{Y}}(y_1, \ldots, y_n | \boldsymbol{X}) = \begin{cases} C(F_1(y_1|\boldsymbol{X}_1), \ldots, F_n(y_n|\boldsymbol{X}_n) | {\boldsymbol{D}}), & k=0 \\ C^{(k)}( F_1(y_1|\boldsymbol{X}_1), \ldots, F_n(y_n|\boldsymbol{X}_n) |{\boldsymbol{D}}) \prod_{j \in I_{+}} f_j(y_j|\boldsymbol{X}_j), & 0 \unicode{x003C} k \unicode{x003C} n \\ c(F_1(y_1|\boldsymbol{X}_1), \ldots, F_n(y_n|\boldsymbol{X}_n) | {\boldsymbol{D}}) \prod_{j=1}^n f_j(y_j|\boldsymbol{X}_j), & k=n,\end{cases}\end{align}
where $C^{(k)}(u_1,...,u_n|{\boldsymbol{D}}) =$ $\displaystyle \frac{\partial^k C}{\partial u_{i_1} \cdots \partial u_{i_k}}$
and
$\displaystyle \frac{\partial^k C}{\partial u_{i_1} \cdots \partial u_{i_k}}$
and $c(\!\cdot \! |{\boldsymbol{D}})$
is the density of the conditional copula.
$c(\!\cdot \! |{\boldsymbol{D}})$
is the density of the conditional copula.
3.1. Marginal model for insured losses
We consider two strategies to accommodate the probability mass at zero in claim payments. The first strategy assumes that zero payment outcomes are a result of the policy deductible, that is the policyholder receives no indemnification if the ground-up loss is below the per-occurrence deductible. Let $Y^{*}_j$
be the ground-up loss for the claim at location
$Y^{*}_j$
be the ground-up loss for the claim at location $s_j$
, and
$s_j$
, and $d_j$
be the deductible that applies to the claim. The insured loss
$d_j$
be the deductible that applies to the claim. The insured loss $Y_j$
and ground-up loss
$Y_j$
and ground-up loss $Y_j^*$
satisfy the relation:
$Y_j^*$
satisfy the relation:
 \begin{align*}Y_{j} = (Y^\ast_{j}-d_{j})_+ = \max\{Y^\ast_{j}-d_{j}, 0\} = \begin{cases} 0, & Y^\ast_{j} \leq d_{j} \\ Y^\ast_{j} - d_{j}, & Y^\ast_{j} \unicode{x003E} d_{j}.\end{cases}\end{align*}
From the above, the distribution and density of claim payment $Y_j$
are
$Y_j$
are
 \begin{align}F_{j}(y | \boldsymbol{X}_j) = F_{j}^\ast(y+d_{j} | \boldsymbol{X}_j )\, \ y\geq 0\end{align}
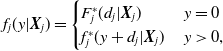 \begin{align} f_{j}(y | \boldsymbol{X}_j) = \begin{cases} F_{j}^\ast(d_{j} | \boldsymbol{X}_j )\, & y=0 \\ f_{j}^\ast(y+d_{j} | \boldsymbol{X}_j )\, & y\unicode{x003E}0,\end{cases}\end{align}
where $F_{j}^\ast(\!\cdot \!|\boldsymbol{X}_j)$
and
$F_{j}^\ast(\!\cdot \!|\boldsymbol{X}_j)$
and $f_{j}^{\ast}(\!\cdot \!|\boldsymbol{X}_j)$
are the distribution and density functions of the ground-up loss, respectively.
$f_{j}^{\ast}(\!\cdot \!|\boldsymbol{X}_j)$
are the distribution and density functions of the ground-up loss, respectively.
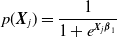
The second strategy models the claim payment directly. We consider a two-part mixture regression:
 \begin{align}F_j(y|\boldsymbol{X}_j) = p(\boldsymbol{X}_j) + (1-p(\boldsymbol{X}_j)) \ G(y|\boldsymbol{X}_j)\, \ y \geq 0\end{align}
 \begin{align} f_{j}(y | \boldsymbol{X}_j) = \begin{cases} p(\boldsymbol{X}_{j})\, & y=0 \\ (1-p(\boldsymbol{X}_{j}))\ g(y| \boldsymbol{X}_j)\, & y\unicode{x003E}0\end{cases}\end{align}
where $p(\boldsymbol{X}_j) = \Pr(Y_j=0|\boldsymbol{X}_j)$
and
$p(\boldsymbol{X}_j) = \Pr(Y_j=0|\boldsymbol{X}_j)$
and $G(\!\cdot\!)$
and
$G(\!\cdot\!)$
and $g(\!\cdot\!)$
are the distribution and density functions for a random variable defined on the positive real line. The approach of the two-part model is data driven and ignores the mechanism behind the zero-inflated outcomes; thus, it can be readily applied in settings other than the presence of a policy deductible. In addition, this strategy is consistent with the approximation method for pricing the deductible contract discussed in Lee (Reference Lee2017), where the deductible is treated as a predictor in the regression model.
$g(\!\cdot\!)$
are the distribution and density functions for a random variable defined on the positive real line. The approach of the two-part model is data driven and ignores the mechanism behind the zero-inflated outcomes; thus, it can be readily applied in settings other than the presence of a policy deductible. In addition, this strategy is consistent with the approximation method for pricing the deductible contract discussed in Lee (Reference Lee2017), where the deductible is treated as a predictor in the regression model.
3.2. Factor copula model for spatial dependence
The association among insurance claims from a storm could arise from two sources: the spatial dependence and the unobserved storm-specific effect. The former reflects a situation where outcomes observed at different locations are correlated with one another, with the correlation between two observations diminishing as their distance increases. The latter points to a special type of aspatial dependence where the unobserved storm-specific effect is a common shock inducing an exchangeable dependence structure among all observations affected by a particular storm.
To account for both the spatial and aspatial dependence, we employ the factor copula introduced by Krupskii et al. (Reference Krupskii, Huser and Genton2018). The factor copula is derived from a random spatial process Q(s) that varies by location $s \in \mathbb{R}^2$
:
$s \in \mathbb{R}^2$
:
 \begin{align} Q(s)=Z(s)+V_0,\end{align}
where Z(s) is a Gaussian random field and $V_0$
is an independent common factor that does not depend on location s. The Gaussian random field Z(s) in (3.7) captures the spatial dependence among observations in different locations in the correlation function. For instance, the Matérn class of spatial correlation functions characterizes the common empirical observation that the correlation between outcomes at two locations decreases as the distance r increases:
$V_0$
is an independent common factor that does not depend on location s. The Gaussian random field Z(s) in (3.7) captures the spatial dependence among observations in different locations in the correlation function. For instance, the Matérn class of spatial correlation functions characterizes the common empirical observation that the correlation between outcomes at two locations decreases as the distance r increases:
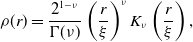 \begin{align*} \rho(r) = \frac{2^{1-\nu}}{\Gamma(\nu)} \left( \frac{r}{\xi} \right)^{\nu} K_{\nu}\left( \frac{r}{\xi} \right),\end{align*}
where $K_{\nu}(\!\cdot\!)$
is the modified Kessel function of order
$K_{\nu}(\!\cdot\!)$
is the modified Kessel function of order $\nu$
,
$\nu$
, $\nu\unicode{x003E}0$
is a shape parameter determining the smoothness of the process, and
$\nu\unicode{x003E}0$
is a shape parameter determining the smoothness of the process, and $\xi\unicode{x003E}0$
is a scale parameter for the range of the spatial dependence (see Matérn, Reference Matérn1986 and Guttorp and Gneiting, Reference Guttorp and Gneiting2006 for more details). In addition, the factor
$\xi\unicode{x003E}0$
is a scale parameter for the range of the spatial dependence (see Matérn, Reference Matérn1986 and Guttorp and Gneiting, Reference Guttorp and Gneiting2006 for more details). In addition, the factor $V_0$
accommodates the aspatial dependence among all observations within a storm due to the common shocks.
$V_0$
accommodates the aspatial dependence among all observations within a storm due to the common shocks.
For observations at n unique locations $s_1, \ldots, s_n$
, the finite-dimension representation of the spatial process (3.7) is
$s_1, \ldots, s_n$
, the finite-dimension representation of the spatial process (3.7) is
 \begin{align}Q_j = Z_j + V_0,\end{align}
for $j=1,\ldots, n$
, where
$j=1,\ldots, n$
, where $Q_j$
and
$Q_j$
and $Z_j$
denote
$Z_j$
denote $Q(s_j)$
and
$Q(s_j)$
and $Z(s_j)$
, respectively. Then
$Z(s_j)$
, respectively. Then $\boldsymbol{Z}=(Z_1, \ldots, Z_n)$
follows a zero-mean, unit-variance multivariate normal distribution
$\boldsymbol{Z}=(Z_1, \ldots, Z_n)$
follows a zero-mean, unit-variance multivariate normal distribution $\Phi_{\boldsymbol{\Sigma_Z}}(\!\cdot \!|\boldsymbol{\Sigma_Z})$
with correlation matrix
$\Phi_{\boldsymbol{\Sigma_Z}}(\!\cdot \!|\boldsymbol{\Sigma_Z})$
with correlation matrix $\boldsymbol{\Sigma_Z}$
and let
$\boldsymbol{\Sigma_Z}$
and let $V_0$
follow a distribution
$V_0$
follow a distribution $F_{V_0}(\!\cdot \! | \boldsymbol{\gamma}_0)$
with parameters
$F_{V_0}(\!\cdot \! | \boldsymbol{\gamma}_0)$
with parameters $\boldsymbol{\gamma}_0$
, independent of
$\boldsymbol{\gamma}_0$
, independent of $\boldsymbol{Z}$
. By Sklar’s theorem (Sklar, Reference Sklar1959), we extract the dependence structure of the spatial process Q(s) via the copula implied by the joint distribution of
$\boldsymbol{Z}$
. By Sklar’s theorem (Sklar, Reference Sklar1959), we extract the dependence structure of the spatial process Q(s) via the copula implied by the joint distribution of $\boldsymbol{Q}=(Q_1, \ldots, Q_n)$
at locations
$\boldsymbol{Q}=(Q_1, \ldots, Q_n)$
at locations $s_1, \ldots, s_n$
. Thus, we obtain the factor copula C as
$s_1, \ldots, s_n$
. Thus, we obtain the factor copula C as
 \begin{align} C(u_1, \ldots, u_n | \boldsymbol{\Sigma_Z}, \boldsymbol{\gamma}_0) = F_{\boldsymbol{Q}}\left( (F_{Q,1})^{-1}(u_1 | \boldsymbol{\gamma}_0), \ldots, (F_{Q,n})^{-1}(u_n | \boldsymbol{\gamma}_0) | \boldsymbol{\Sigma_Z}, \boldsymbol{\gamma}_0 \right),\end{align}
where $\displaystyle F_{\boldsymbol{Q}}(q_1, \ldots, q_n|\boldsymbol{\Sigma_Z}, \boldsymbol{\gamma}_0) = \int_{-\infty}^\infty \Phi_{\boldsymbol{\Sigma_Z}}( q_1-v_0, \ldots, q_n-v_0 |\boldsymbol{\Sigma_Z}) dF_{V_0}(v_0|\boldsymbol{\gamma}_0)$
is the multivariate distribution function of
$\displaystyle F_{\boldsymbol{Q}}(q_1, \ldots, q_n|\boldsymbol{\Sigma_Z}, \boldsymbol{\gamma}_0) = \int_{-\infty}^\infty \Phi_{\boldsymbol{\Sigma_Z}}( q_1-v_0, \ldots, q_n-v_0 |\boldsymbol{\Sigma_Z}) dF_{V_0}(v_0|\boldsymbol{\gamma}_0)$
is the multivariate distribution function of $\boldsymbol{Q}$
. In addition,
$\boldsymbol{Q}$
. In addition, $F_{Q,j}(q | \boldsymbol{\gamma}_0) = \int_{-\infty}^{\infty} \Phi(q-v_0) \, dF_{V_0}(v_0 | \boldsymbol{\gamma}_0)$
is the marginal distribution function of
$F_{Q,j}(q | \boldsymbol{\gamma}_0) = \int_{-\infty}^{\infty} \Phi(q-v_0) \, dF_{V_0}(v_0 | \boldsymbol{\gamma}_0)$
is the marginal distribution function of $Q_j$
, where
$Q_j$
, where $\Phi(\!\cdot\!)$
is the univariate standard normal distribution function.
$\Phi(\!\cdot\!)$
is the univariate standard normal distribution function.
Factor copulas arise from factor models, where latent random variables are employed to induce dependence among observed variables. These models provide a highly flexible framework for capturing complex dependence structures and are particularly well-suited to high-dimensional settings, where traditional methods may struggle with scalability or interpretability. The development of various factor copulas in the literature has been driven by the need to address unique structural characteristics of different data types across a range of disciplines, including time series data (e.g., Krupskii and Joe, Reference Krupskii and Joe2013; Oh and Patton, Reference Oh and Patton2017), spatiotemporal data (e.g., Krupskii and Genton, Reference Krupskii and Genton2017; Krupskii et al., Reference Krupskii, Huser and Genton2018), mortality data (e.g., Chen et al., Reference Chen, MacMinn and Sun2015), and ordinal data (e.g., Nikoloulopoulos and Joe, Reference Nikoloulopoulos and Joe2015), among others.
Lastly, it is worth noting that the joint distribution $F_{\boldsymbol{Q}}$
is only used to extract the dependence structure of the factor spatial process (3.7) and construct the factor copula C, whereupon C joins the marginal models discussed in Section 3.2. The spatial factor copula thus allows us to flexibly accommodate various features of insurance claim payments such as skewness, heavy tails, and excess zeros, as well as incorporate the rich covariate information in the marginal models, while retaining the interpretation of the association arising from spatial and aspatial sources in the dependence model.
$F_{\boldsymbol{Q}}$
is only used to extract the dependence structure of the factor spatial process (3.7) and construct the factor copula C, whereupon C joins the marginal models discussed in Section 3.2. The spatial factor copula thus allows us to flexibly accommodate various features of insurance claim payments such as skewness, heavy tails, and excess zeros, as well as incorporate the rich covariate information in the marginal models, while retaining the interpretation of the association arising from spatial and aspatial sources in the dependence model.
3.3 Model specification
In this section, we discuss the detailed specification of the marginal models and the factor copula for our hail property damage claims application. The marginal claim payments are modeled based on the generalized beta of the second kind (GB2) distribution, a four-parameter family that flexibly accommodates the skew and heavy tails commonly exhibited by insurance claims data. The GB2 distribution is well studied in the context of insurance claims modeling (see Shi, Reference Shi, Edward, Meyers and Derrig2014 for a review). For a GB2 distributed variable Y with location parameter $\mu$
, scale parameter
$\mu$
, scale parameter $\sigma$
, and shape parameters
$\sigma$
, and shape parameters $\alpha_1$
and
$\alpha_1$
and $\alpha_2$
, the density is defined on
$\alpha_2$
, the density is defined on $y\unicode{x003E}0$
:
$y\unicode{x003E}0$
:
 \begin{align}g(y | \boldsymbol{X} ) = \frac{\exp(z)^{\alpha_1}}{y |\sigma| B(\alpha_1, \alpha_2) (1+\exp(z))^{\alpha_1 + \alpha_2}}, \nonumber\end{align}
where $z=\left(\log(y)-\mu(\boldsymbol{X}) \right)/ \sigma$
and
$z=\left(\log(y)-\mu(\boldsymbol{X}) \right)/ \sigma$
and $B(\cdot, \cdot)$
is the beta function.
$B(\cdot, \cdot)$
is the beta function.
In Section 3.1, we presented two strategies for accommodating the probability mass at zero in claim payments. For the first strategy, we assume the ground-up loss $Y_j^\ast$
follows a GB2 distribution and is left-censored at the per-occurrence policy deductible
$Y_j^\ast$
follows a GB2 distribution and is left-censored at the per-occurrence policy deductible $d_j$
. The covariates
$d_j$
. The covariates $\boldsymbol{X}_j$
are linearly incorporated in the GB2 location parameter
$\boldsymbol{X}_j$
are linearly incorporated in the GB2 location parameter $\mu$
, so that
$\mu$
, so that $Y_j^\ast \sim GB2(\mu(\boldsymbol{X}_j), \sigma, \alpha_1, \alpha_2)$
, where
$Y_j^\ast \sim GB2(\mu(\boldsymbol{X}_j), \sigma, \alpha_1, \alpha_2)$
, where $\mu(\boldsymbol{X}_j) = \boldsymbol{X}_j \, \boldsymbol{\beta}$
for coefficients
$\mu(\boldsymbol{X}_j) = \boldsymbol{X}_j \, \boldsymbol{\beta}$
for coefficients $\boldsymbol{\beta}$
. The marginal model parameters for the first strategy are
$\boldsymbol{\beta}$
. The marginal model parameters for the first strategy are $\boldsymbol{\theta}_{1, \text{cens}}=(\boldsymbol{\beta}, \sigma, \alpha_1, \alpha_2)$
. For the second strategy of directly modeling the claim payment, we specify
$\boldsymbol{\theta}_{1, \text{cens}}=(\boldsymbol{\beta}, \sigma, \alpha_1, \alpha_2)$
. For the second strategy of directly modeling the claim payment, we specify $p(\boldsymbol{X}_j)$
using a generalized linear model with a logit link so that
$p(\boldsymbol{X}_j)$
using a generalized linear model with a logit link so that
 \begin{align*}p(\boldsymbol{X}_j) = \frac{ 1 }{1 + e^{\boldsymbol{X}_j \boldsymbol{\beta}_1}}\end{align*}
for covariates $\boldsymbol{X}_j$
, where
$\boldsymbol{X}_j$
, where $\boldsymbol{\beta}_1$
are the coefficients associated with whether a claim has a positive payment. Then
$\boldsymbol{\beta}_1$
are the coefficients associated with whether a claim has a positive payment. Then $G( \!\cdot \! )$
and
$G( \!\cdot \! )$
and $g( \!\cdot \!)$
defined on the positive real line are the distribution and density functions of the
$g( \!\cdot \!)$
defined on the positive real line are the distribution and density functions of the $GB2(\mu(\boldsymbol{X}_j), \sigma, \alpha_1, \alpha_2)$
describing the positive payments, where
$GB2(\mu(\boldsymbol{X}_j), \sigma, \alpha_1, \alpha_2)$
describing the positive payments, where $\mu(\boldsymbol{X}_j) = \boldsymbol{X}_j \, \boldsymbol{\beta}_2$
for coefficients
$\mu(\boldsymbol{X}_j) = \boldsymbol{X}_j \, \boldsymbol{\beta}_2$
for coefficients $\boldsymbol{\beta}_2$
. The marginal model parameters for the second strategy are
$\boldsymbol{\beta}_2$
. The marginal model parameters for the second strategy are $\boldsymbol{\theta}_{1, \text{2pt}}=(\boldsymbol{\beta}_1, \boldsymbol{\beta}_2, \sigma, \alpha_1, \alpha_2)$
. Note that the covariate set in the two-part model contains the policy deductible, while that of the censored regression does not.
$\boldsymbol{\theta}_{1, \text{2pt}}=(\boldsymbol{\beta}_1, \boldsymbol{\beta}_2, \sigma, \alpha_1, \alpha_2)$
. Note that the covariate set in the two-part model contains the policy deductible, while that of the censored regression does not.
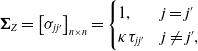
In our factor copula specification, we assume the correlation matrix of $\boldsymbol{Z} \sim N(\boldsymbol{0}, \boldsymbol{\Sigma_Z})$
corresponding to the Gaussian random field Z(s) takes the form
$\boldsymbol{Z} \sim N(\boldsymbol{0}, \boldsymbol{\Sigma_Z})$
corresponding to the Gaussian random field Z(s) takes the form
 \begin{align}\boldsymbol{\Sigma_Z} = \left[ \sigma_{jj'} \right]_{n\times n} = \begin{cases} 1, & j=j' \\ \kappa \tau_{j j'} & j\neq j',\end{cases}\end{align}
for $j, j' \in \{1, \ldots, n\}$
, where
$j, j' \in \{1, \ldots, n\}$
, where $\kappa \in (0, 1)$
captures the nugget effect for microscale variation and measurement error. Let
$\kappa \in (0, 1)$
captures the nugget effect for microscale variation and measurement error. Let $r_{jj'}=||s_j-s_{j'}||$
denote the distance between locations
$r_{jj'}=||s_j-s_{j'}||$
denote the distance between locations $s_j$
and
$s_j$
and $s_{j'}$
. In addition,
$s_{j'}$
. In addition, $\tau_{jj'}=\exp\{ -3 r_{jj'}/\psi \}$
is the exponential spatial correlation function, a special case of the Matérn family where the correlation between
$\tau_{jj'}=\exp\{ -3 r_{jj'}/\psi \}$
is the exponential spatial correlation function, a special case of the Matérn family where the correlation between $Y_j$
and
$Y_j$
and $Y_{j'}$
decreases as the distance
$Y_{j'}$
decreases as the distance $r_{jj'}$
between their locations increases. The parameter
$r_{jj'}$
between their locations increases. The parameter $\psi$
controls how quickly the spatial correlation decays with distance and is parameterized to represent the practical range, the distance at which the correlation is 0.05 (Diggle and Ribeiro, Reference Diggle and Ribeiro2007). We further assume
$\psi$
controls how quickly the spatial correlation decays with distance and is parameterized to represent the practical range, the distance at which the correlation is 0.05 (Diggle and Ribeiro, Reference Diggle and Ribeiro2007). We further assume $V_0 \sim N(0, \sigma_0^2)$
for simplicity, which results in a tractable special case of a structured Gaussian factor copula. Note that
$V_0 \sim N(0, \sigma_0^2)$
for simplicity, which results in a tractable special case of a structured Gaussian factor copula. Note that $\boldsymbol{Q}$
follows a multivariate normal distribution with correlation matrix
$\boldsymbol{Q}$
follows a multivariate normal distribution with correlation matrix
 \begin{align} \boldsymbol{\Sigma_Q} = (1-\rho) \boldsymbol{\Sigma_Z} + \rho \boldsymbol{J}_{n},\end{align}
where $\rho = \sigma_0^2/(1+\sigma_0^2) \in (0,1)$
can be interpreted as the correlation introduced due to the unobserved storm-specific effect and
$\rho = \sigma_0^2/(1+\sigma_0^2) \in (0,1)$
can be interpreted as the correlation introduced due to the unobserved storm-specific effect and $\boldsymbol{J}_n$
is an n-dimensional square matrix of ones. The resulting factor copula is thus the Gaussian copula
$\boldsymbol{J}_n$
is an n-dimensional square matrix of ones. The resulting factor copula is thus the Gaussian copula
 \begin{align} C(u_1, \ldots, u_n | {\boldsymbol{D}} ) = \Phi_{\boldsymbol{\Sigma_Q}}\left( \Phi^{-1}(u_1), \ldots, \Phi^{-1}(u_n) | {\boldsymbol{D}} \right),\end{align}
where $\Phi_{\boldsymbol{\Sigma_Q}}$
is the zero-mean, unit-variance multivariate normal distribution function with correlation matrix
$\Phi_{\boldsymbol{\Sigma_Q}}$
is the zero-mean, unit-variance multivariate normal distribution function with correlation matrix $\boldsymbol{\Sigma_Q}$
. Denote the association parameters by
$\boldsymbol{\Sigma_Q}$
. Denote the association parameters by $\boldsymbol{\theta}_{2} = (\kappa, \psi, \rho)$
. If the distance
$\boldsymbol{\theta}_{2} = (\kappa, \psi, \rho)$
. If the distance $r_{jj'}\rightarrow 0$
, then the spatial correlation equals
$r_{jj'}\rightarrow 0$
, then the spatial correlation equals $\kappa$
, reflecting the nugget effect, while the overall correlation is
$\kappa$
, reflecting the nugget effect, while the overall correlation is $(1-\rho)\kappa + \rho$
. If the distance
$(1-\rho)\kappa + \rho$
. If the distance $r_{jj'} \rightarrow \infty$
, then the spatial correlation approaches 0 and the overall dependence approaches
$r_{jj'} \rightarrow \infty$
, then the spatial correlation approaches 0 and the overall dependence approaches $\rho\unicode{x003E}0$
, reflecting the positive contribution of the aspatial dependence in the severity of claims from the same storm regardless of their locations.
$\rho\unicode{x003E}0$
, reflecting the positive contribution of the aspatial dependence in the severity of claims from the same storm regardless of their locations.
The Gaussian factor copula is also particularly convenient for our replicated spatial data and prediction application. Due to the heterogeneity in claim frequency and geographical distribution, the factor copula dimensionality n can vary substantially across storms. The marginal consistency of the Gaussian copula allows us to easily adapt the correlation matrix under changing dimensions while maintaining the same underlying factor covariance structure.
4. Statistical estimation
The parameters in the spatial factor copula regression model are estimated using a fully parametric likelihood-based approach. Assume that for m total hailstorms, the ith hailstorm $(i=1, \ldots, m)$
is observed to have
$(i=1, \ldots, m)$
is observed to have $n_i\unicode{x003E}0$
claims at locations
$n_i\unicode{x003E}0$
claims at locations $\{s_{i1}, \ldots, s_{i n_i} \}$
. Let
$\{s_{i1}, \ldots, s_{i n_i} \}$
. Let $\boldsymbol{y}_i=(y_{i1},\ldots,y_{i n_i})$
be the observed claim payments from storm i at the corresponding claim locations for our point-referenced data. Let
$\boldsymbol{y}_i=(y_{i1},\ldots,y_{i n_i})$
be the observed claim payments from storm i at the corresponding claim locations for our point-referenced data. Let $\boldsymbol{x}_i = (\boldsymbol{x}_{i1}, \ldots, \boldsymbol{x}_{i n_i})$
be the corresponding covariates associated with the claims from hailstorm i, where
$\boldsymbol{x}_i = (\boldsymbol{x}_{i1}, \ldots, \boldsymbol{x}_{i n_i})$
be the corresponding covariates associated with the claims from hailstorm i, where $\boldsymbol{x}_{ij}=(x_{i,1}(s_{ij}), \ldots, x_{i, p}(s_{ij}))$
is the covariate vector for claim j in storm i for
$\boldsymbol{x}_{ij}=(x_{i,1}(s_{ij}), \ldots, x_{i, p}(s_{ij}))$
is the covariate vector for claim j in storm i for $j=1, \ldots, n_i$
. The data are summarized by
$j=1, \ldots, n_i$
. The data are summarized by $\{\boldsymbol{y}_i, \boldsymbol{x}_i: i=1, \ldots, m \}$
. Let
$\{\boldsymbol{y}_i, \boldsymbol{x}_i: i=1, \ldots, m \}$
. Let $\boldsymbol{\theta}=(\boldsymbol{\theta}_{1}, \boldsymbol{\theta}_{2})$
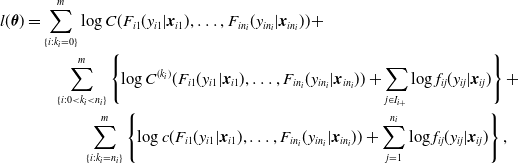
be the vector of model parameters containing the unknown parameters in the marginal distributions and the factor copula dependence. The log-likelihood of the data can be expressed as
$\boldsymbol{\theta}=(\boldsymbol{\theta}_{1}, \boldsymbol{\theta}_{2})$
be the vector of model parameters containing the unknown parameters in the marginal distributions and the factor copula dependence. The log-likelihood of the data can be expressed as
 \begin{align} l(\boldsymbol{\theta}) &= \sum_{ \{i:k_i=0\} }^{m} \log C(F_{i1}(y_{i1}|\boldsymbol{x}_{i1}), \ldots, F_{i n_i}(y_{i n_i} | \boldsymbol{x}_{i n_i})) + \nonumber \\ & \ \ \ \ \ \ \ \sum_{ \{i: 0 \unicode{x003C} k_i \unicode{x003C} n_i \}}^m \left\{ \log C^{(k_i)}(F_{i1}(y_{i1} | \boldsymbol{x}_{i1}), \ldots, F_{i n_i}( y_{i n_i} |\boldsymbol{x}_{i n_i})) + \sum_{j \in I_{i+}} \log f_{ij}(y_{ij} | \boldsymbol{x}_{ij}) \right\} + \nonumber \\ & \ \ \ \ \ \ \ \ \ \ \ \ \ \ \sum_{ \{i: k_i=n_i\} }^m \left\{ \log c(F_{i1}(y_{i1} | \boldsymbol{x}_{i1}), \ldots, F_{i n_i}(y_{i n_i} |\boldsymbol{x}_{i n_i})) + \sum_{j=1}^{n_i} \log f_{ij}(y_{ij} | \boldsymbol{x}_{ij}) \right\},\end{align}
based on the joint density defined in (3.2). The discreteness in the claim payment outcome and the high dimensionality of the Gaussian factor copula in our insurance claims context offer a more general setting that greatly complicates the traditional maximum likelihood estimation presented in Krupskii et al. (Reference Krupskii, Huser and Genton2018). In particular, directly evaluating the data likelihood based on the joint density (3.2) involves an $(n_i-k_i)$
-dimensional integration where
$(n_i-k_i)$
-dimensional integration where $k_i \leq n_i$
is the number of claims with positive payments as defined in (3.2). As discussed in Section 2, the number of zero components in a hailstorm can be several hundred, which is not computationally viable. Motivated by the computational challenges associated with the high dimensionality of the factor copula and exacerbated by the discreteness in the outcome, we propose a two-stage estimation procedure for this more general setting. The first stage estimates parameters in the marginal models assuming working independence and the second stage estimates parameters in the dependence model via a composite likelihood approach.
$k_i \leq n_i$
is the number of claims with positive payments as defined in (3.2). As discussed in Section 2, the number of zero components in a hailstorm can be several hundred, which is not computationally viable. Motivated by the computational challenges associated with the high dimensionality of the factor copula and exacerbated by the discreteness in the outcome, we propose a two-stage estimation procedure for this more general setting. The first stage estimates parameters in the marginal models assuming working independence and the second stage estimates parameters in the dependence model via a composite likelihood approach.
4.1. Stage I: Estimating parameters in marginals
In the first stage, we estimate the parameters in the marginal models in the spirit of the inference functions for margins method (Joe and Xu, Reference Joe and Xu1996). Specifically, the log-likelihood function under the working independence assumption is
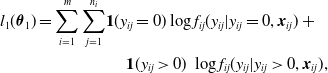 \begin{align} l_1(\boldsymbol{\theta}_{1}) = \sum_{i=1}^m \sum_{j=1}^{n_i} &{\boldsymbol{1}( y_{ij}=0) } \log f_{ij}(y_{ij} | y_{ij}=0, \boldsymbol{x}_{ij}) \ + \nonumber \\ & \ \ \ \ \ {\boldsymbol{1} (y_{ij}\unicode{x003E}0)} \ \log f_{ij}(y_{ij} | y_{ij}\unicode{x003E}0, \boldsymbol{x}_{ij}), \end{align}
where $f_{ij}(\!\cdot \!| \boldsymbol{x}_{ij}, \boldsymbol{\theta}_{1})$
is the marginal density (under (3.4) or (3.6) for the censored and two-part mixture GB2 strategies, respectively) and
$f_{ij}(\!\cdot \!| \boldsymbol{x}_{ij}, \boldsymbol{\theta}_{1})$
is the marginal density (under (3.4) or (3.6) for the censored and two-part mixture GB2 strategies, respectively) and $\boldsymbol{1}(\!\cdot\!)$
is the indicator function. The estimators for the parameters
$\boldsymbol{1}(\!\cdot\!)$
is the indicator function. The estimators for the parameters $\boldsymbol{\theta}_{1}$
are obtained by
$\boldsymbol{\theta}_{1}$
are obtained by
 \begin{align} \tilde{\boldsymbol{\theta}}_{1} = \mathrm{arg\,max}_{\boldsymbol{\theta}_1} l_1(\boldsymbol{\theta}_{1}).\end{align}
4.2. Stage II: Estimating parameters in dependence
In the second stage, we estimate parameters in the factor copula fixing the estimates for parameters in the marginal regression. The discreteness and lack of balance in the data make the inference functions for margins challenging to implement. To further improve computational efficiency, we consider the composite likelihood method for dependence parameter estimation (Lindsay, Reference Lindsay1988). Composite likelihood methods have been prevalent in spatial analysis for reducing the computational burden in estimation (see Varin et al., Reference Varin, Reid and Firth2011 for a survey). The composite likelihood function results from the product of a collection of component likelihoods, with the responses within a component assumed to be dependent, but orthogonal across components. We consider the special case of pairwise composite likelihood, which takes the form:
 \begin{align} l_2(\boldsymbol{\theta}_{2}) = \sum_{i=1}^{m} \sum_{j=1}^{n_i} \sum_{j \unicode{x003C} j'} w(y_{ij}, y_{ij'}) \ \log f(y_{ij}, y_{ij'} | \boldsymbol{x}_{i}, \tilde{\boldsymbol{\theta}}_{1}),\end{align}
where $\tilde{\boldsymbol{\theta}}_{1}$
are the marginal parameter estimates in the first stage,
$\tilde{\boldsymbol{\theta}}_{1}$
are the marginal parameter estimates in the first stage, $f(y_{ij}, y_{ij'})$
denotes the bivariate likelihood function for
$f(y_{ij}, y_{ij'})$
denotes the bivariate likelihood function for $(Y_{ij}, Y_{ij'})$
, and w is the weight given to the pair. The bivariate joint density is
$(Y_{ij}, Y_{ij'})$
, and w is the weight given to the pair. The bivariate joint density is
 \begin{align} f(y_{ij}, y_{ij'} | \boldsymbol{x}_i, \tilde{\boldsymbol{\theta}}_{1}) = \begin{cases} C(F_{ij}(y_{ij}| \tilde{\boldsymbol{\theta}}_{1}), F_{ij'}(y_{ij'}| \tilde{\boldsymbol{\theta}}_{1})), & y_{ij}=0, y_{ij'}=0 \\ C^{(1)}(F_{ij}(y_{ij}| \tilde{\boldsymbol{\theta}}_{1}), F_{ij'}(y_{ij'} | \tilde{\boldsymbol{\theta}}_{1})) \ f_{ij}(y_{ij}| \tilde{\boldsymbol{\theta}}_{1}), & y_{ij}\unicode{x003E}0, y_{ij'}=0 \\ C^{(2)}(F_{ij}(y_{ij}| \tilde{\boldsymbol{\theta}}_{1}), F_{ij'}(y_{ij'}; \tilde{\boldsymbol{\theta}}_{1})) \ f_{ij'}(y_{ij'}| \tilde{\boldsymbol{\theta}}_{1}), & y_{ij}=0, y_{ij'}\unicode{x003E}0 \\ c(F_{ij}(y_{ij}| \tilde{\boldsymbol{\theta}}_{1}), F_{ij'}(y_{ij'}| \tilde{\boldsymbol{\theta}}_{1})) \ f_{ij}(y_{ij}| \tilde{\boldsymbol{\theta}}_{1}) f_{ij'}(y_{ij'}| \tilde{\boldsymbol{\theta}}_{1}), & y_{ij}\unicode{x003E}0, y_{ij'}\unicode{x003E}0, \end{cases}\end{align}
where $C^{(h)}(u_1, u_2) =$ $\displaystyle \frac{\partial}{ \partial u_{h}}$ $C(u_1, u_2)$
for
$C(u_1, u_2)$
for $h=1, 2$
is the partial derivative of the bivariate copula with respect to the h-th component. Thus, the dependence parameter estimates are computed as
$h=1, 2$
is the partial derivative of the bivariate copula with respect to the h-th component. Thus, the dependence parameter estimates are computed as
 \begin{align} \tilde{\boldsymbol{\theta}}_{2} = \mathrm{arg\,max}_{\boldsymbol{\theta}_2} \ l_2(\boldsymbol{\theta}_{2}).\end{align}
The pairwise formulation (4.4) is critical to our application in two aspects. First, it lowers the computational burden via dimension reduction. Notably, the high-dimensional integration due to the discreteness in the loss payments within a storm is reduced to a maximum of two dimensions. Second, regardless of the computational burden, the likelihood method is not straightforward to implement due to the lack of balance in the number of claims across storms. The pairwise formulation avoids this issue since all multivariate distributions have a dimension of two.
The above two-stage estimator is an extension of the multilevel composite likelihood in Zhao et al. (Reference Zhao, Shi and Feng2021) to the context of replicated spatial data. The estimator is consistent and asymptotically normal, where the asymptotic covariance is given by the inverse of the Godambe information matrix (Godambe, Reference Godambe1960). In many cases, including ours, the asymptotic covariance cannot be solved analytically, although consistent estimates can be obtained via jackknife (Joe and Xu, Reference Joe and Xu1996) or other subsampling techniques (Heagerty and Lumley, Reference Heagerty and Lumley2000).
In implementing the composite likelihood method, an efficient weight can improve both statistical and computational efficiency (see, for instance, Joe and Lee, Reference Joe and Lee2009 and Bai et al., Reference Bai, Song and Raghunathan2012). Denote by $d(s_{ij}, s_{ij'})$
the Euclidean distance between observations
$d(s_{ij}, s_{ij'})$
the Euclidean distance between observations $y_{ij}$
and
$y_{ij}$
and $y_{ij'}$
. We use the weight defined below for (4.4):
$y_{ij'}$
. We use the weight defined below for (4.4):
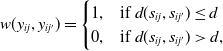 \begin{align*} w(y_{ij},y_{ij'}) = \begin{cases} 1, & \text{if } d(s_{ij}, s_{ij'}) \leq d \\ 0, & \text{if } d(s_{ij}, s_{ij'}) \unicode{x003E} d, \end{cases}\end{align*}
for a fixed spatial lag d. In data analysis, the optimal value of d is selected to result in the most informative set of estimating equations by minimizing the trace of the inverse of the Godambe information matrix, so as to minimize the asymptotic variance of the estimator (Bevilacqua et al., Reference Bevilacqua, Gaetan, Mateu and Porcu2012). Numerical experiments have also suggested that shorter distances often result in greater efficiency (Varin et al., Reference Varin, Reid and Firth2011; Bai et al., Reference Bai, Song and Raghunathan2012).
5. Data analysis
We implement the proposed spatial factor copula regression model to analyze the hail property insurance claims data described in Section 2. We use the hailstorms in 2011–2014 as the training data for model development and hold out the hailstorms in 2015 for model validation and prediction. There are 709 and 130 storms (with 21,937 and 1945 corresponding claims) in the training and hold-out data, respectively.
5.1. Estimation results
We fit the factor copula regression model using the proposed two-stage estimation. To summarize, we incorporate the covariates from Section 2 in GB2 marginal claim payment distributions and consider both the deductible-censored and two-part mixture model strategies for accommodating the excess zeros from Section 3.1. Due to insufficient variability in the cosine of the wind direction (see Table 1), we exclude it in the model fitting. Pairwise spatial distances between locations are taken as the great-circle distance in kilometers under the haversine method assuming a spherical earth. Thus, the parameter $\psi$
representing the practical range and the spatial lag d are also interpreted in kilometers.
$\psi$
representing the practical range and the spatial lag d are also interpreted in kilometers.
The tuning parameter d in the composite likelihood weight function is selected based on the criterion of minimizing the trace of the inverse of the Godambe information matrix. We estimate the Godambe information matrix using a delete-subset jackknife approach to alleviate the computational burden (Joe, Reference Joe2014). Specifically, we randomize the in-sample storms into 18 subsets and re-estimate the full model parameters on each delete-subset dataset. We consider 35 different candidate values for d ranging from 0.25 to 25 km. The optimal spatial lag d selected is 1 and 1.25 km for the censored and two-part mixture GB2 marginal models, respectively.
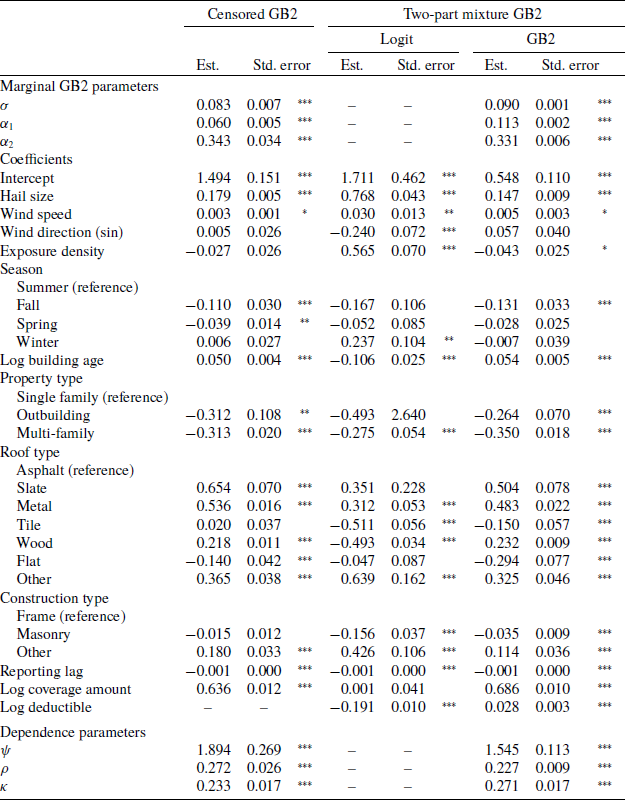
Table 2 presents the parameter estimates, with standard errors estimated via the delete-subset jackknife. The hail size and wind speed weather characteristics are significant and positively associated with claim payments. Several property characteristics are statistically significant, with older properties experiencing higher claim payments (while exhibiting a lower probability of positive payment in the two-part model). Outbuildings and multi-family properties are both associated with lower claim payments compared to single-family properties. In addition, properties with metal and wood roofing experience higher claim payments compared to the commonly used asphalt (while wood roofing is associated with a lower probability of positive payment in the two-part model). Masonry construction, considered to be sturdier than frame construction, is also associated with lower insurance losses. The association parameters under both models indicate significant correlation introduced due to the unobserved storm-specific effect, with $\rho$
estimates of 0.27 and 0.23 under the censored and two-part models, respectively. In addition, the respective practical range estimates of 1.89 and 1.55 km indicate that the spatial correlation between claimants within a hailstorm is low beyond those distances. The
$\rho$
estimates of 0.27 and 0.23 under the censored and two-part models, respectively. In addition, the respective practical range estimates of 1.89 and 1.55 km indicate that the spatial correlation between claimants within a hailstorm is low beyond those distances. The $\kappa$
nugget effect estimates suggest that there remains short-scale variability in the losses.
$\kappa$
nugget effect estimates suggest that there remains short-scale variability in the losses.
Estimation results for the proposed factor copula regression model with two alternative strategies for zero inflation.
* $p\unicode{x003C}0.05$
, **
$p\unicode{x003C}0.05$
, ** $p\unicode{x003C}0.01$
, ***
$p\unicode{x003C}0.01$
, *** $p\unicode{x003C}0.001$
.
$p\unicode{x003C}0.001$
.
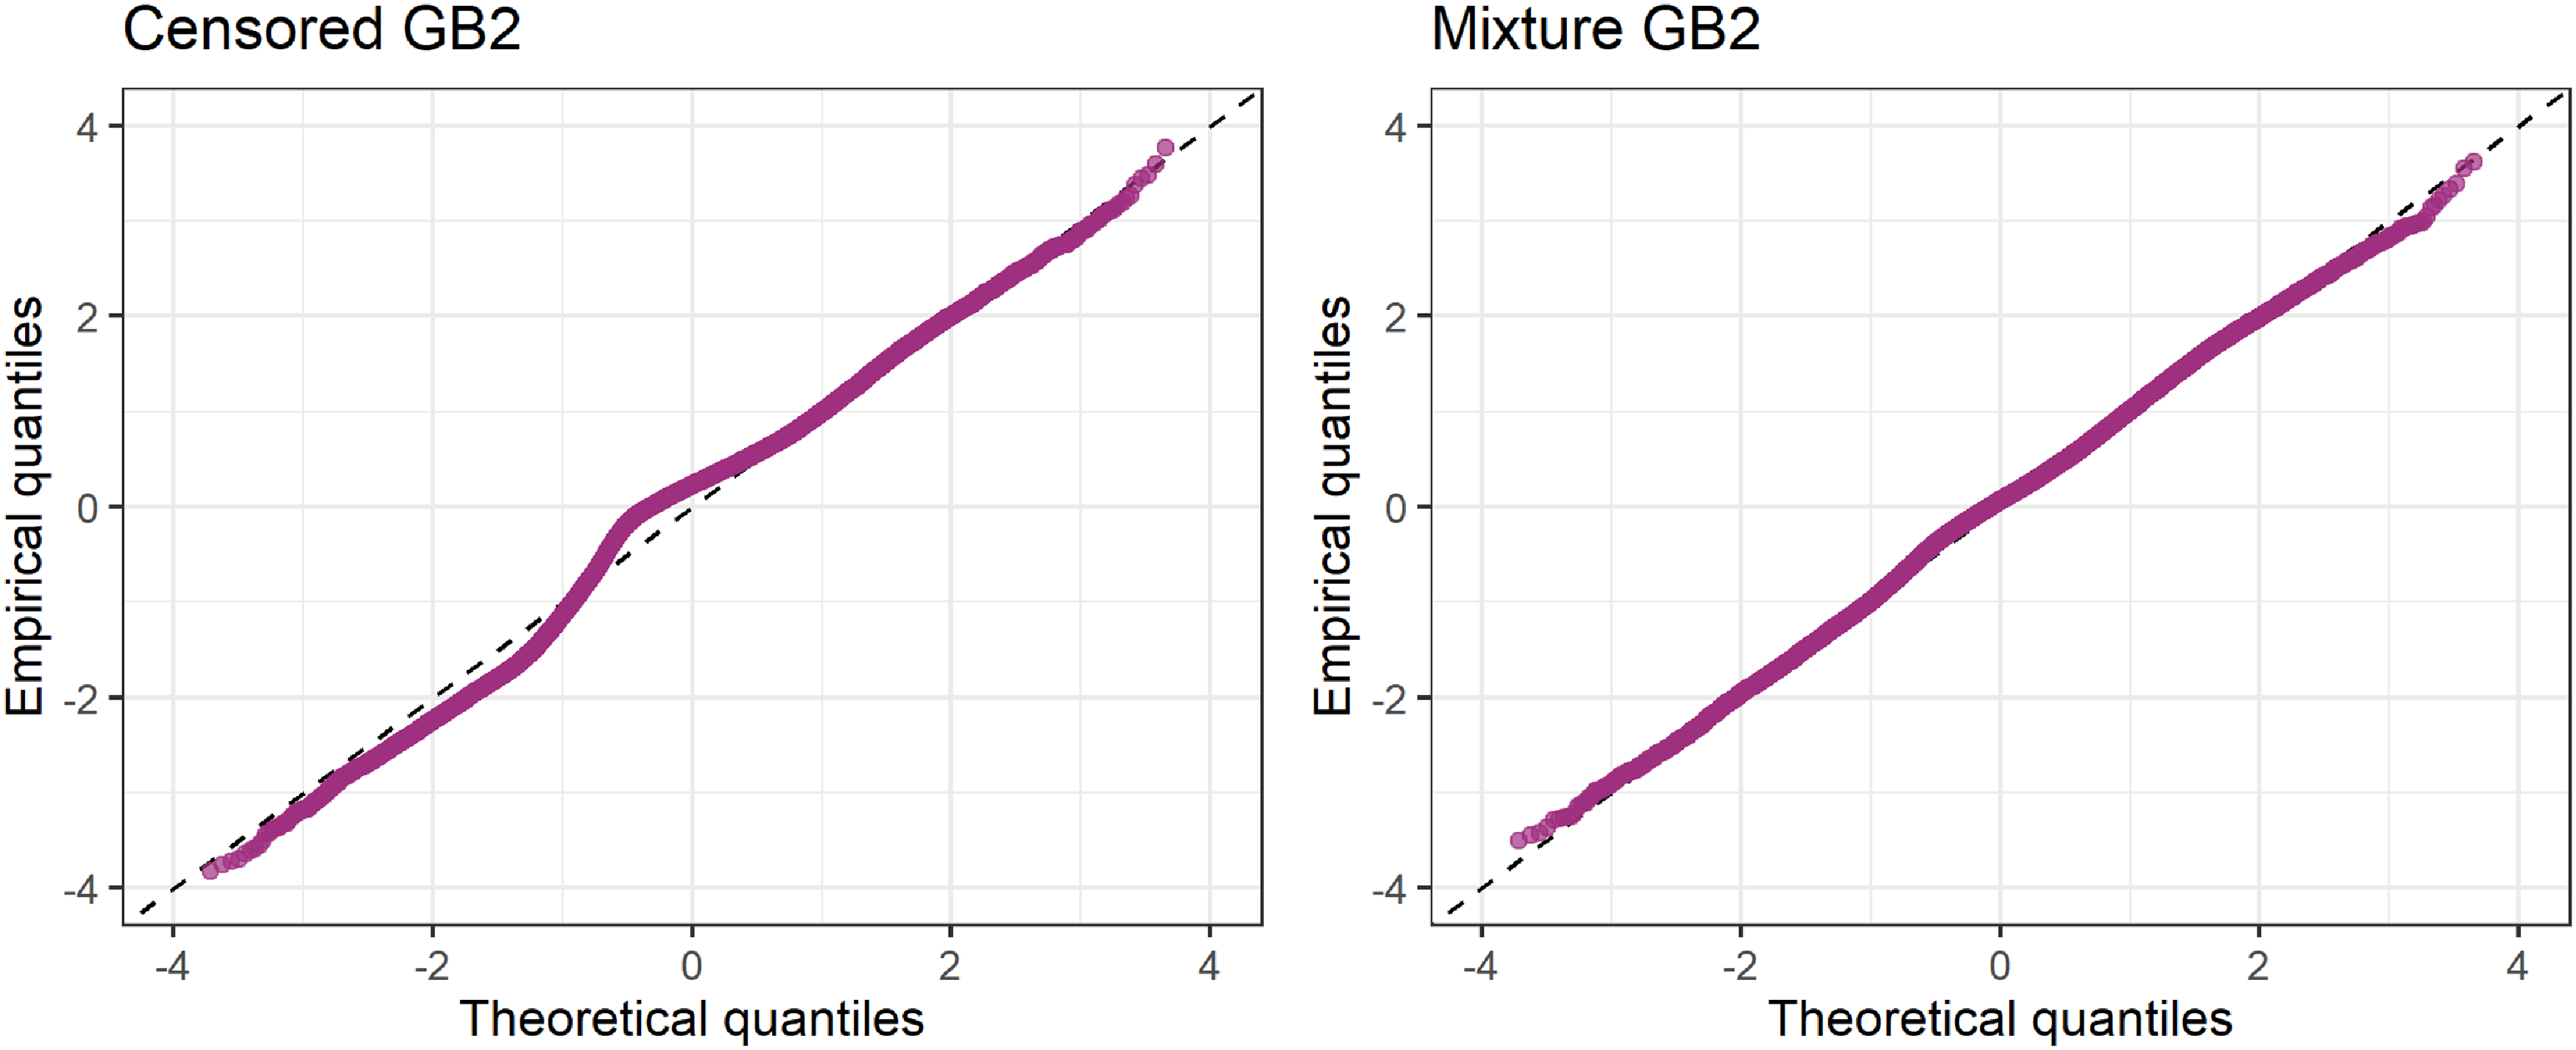
To assess the fit of the marginal models, we consider the Cox–Snell residuals (Cox and Snell Reference Cox and Snell1968) based on the probability integral transform (PIT) (Dawid Reference Dawid1984) of the response using their fitted distributions. In particular, due to the probability mass at zero in the claim payments, the standard PIT is not uniformly distributed. We instead consider the more general randomized PIT approach (Czado et al. Reference Czado, Gneiting and Held2009; Rüschendorf Reference Rüschendorf2009) and use the transformation in Yang and Shi (Reference Yang and Shi2019) for semicontinuous observations. Figure 3 displays the Q-Q plots of the generalized Cox–Snell residuals for the censored and two-part mixture models. The Q-Q plots follow the 45-degree line closely, suggesting that GB2 regressions flexibly capture the skewed, heavy-tailed losses. The slight hump near the zero quantile in the censored model suggests that the distributional assumptions of the more flexible two-part mixture marginal better reflects the training data compared to the censored marginal model.
Q-Q plots of Cox–Snell residuals for the censored (left) and two-part mixture (right) marginal models.
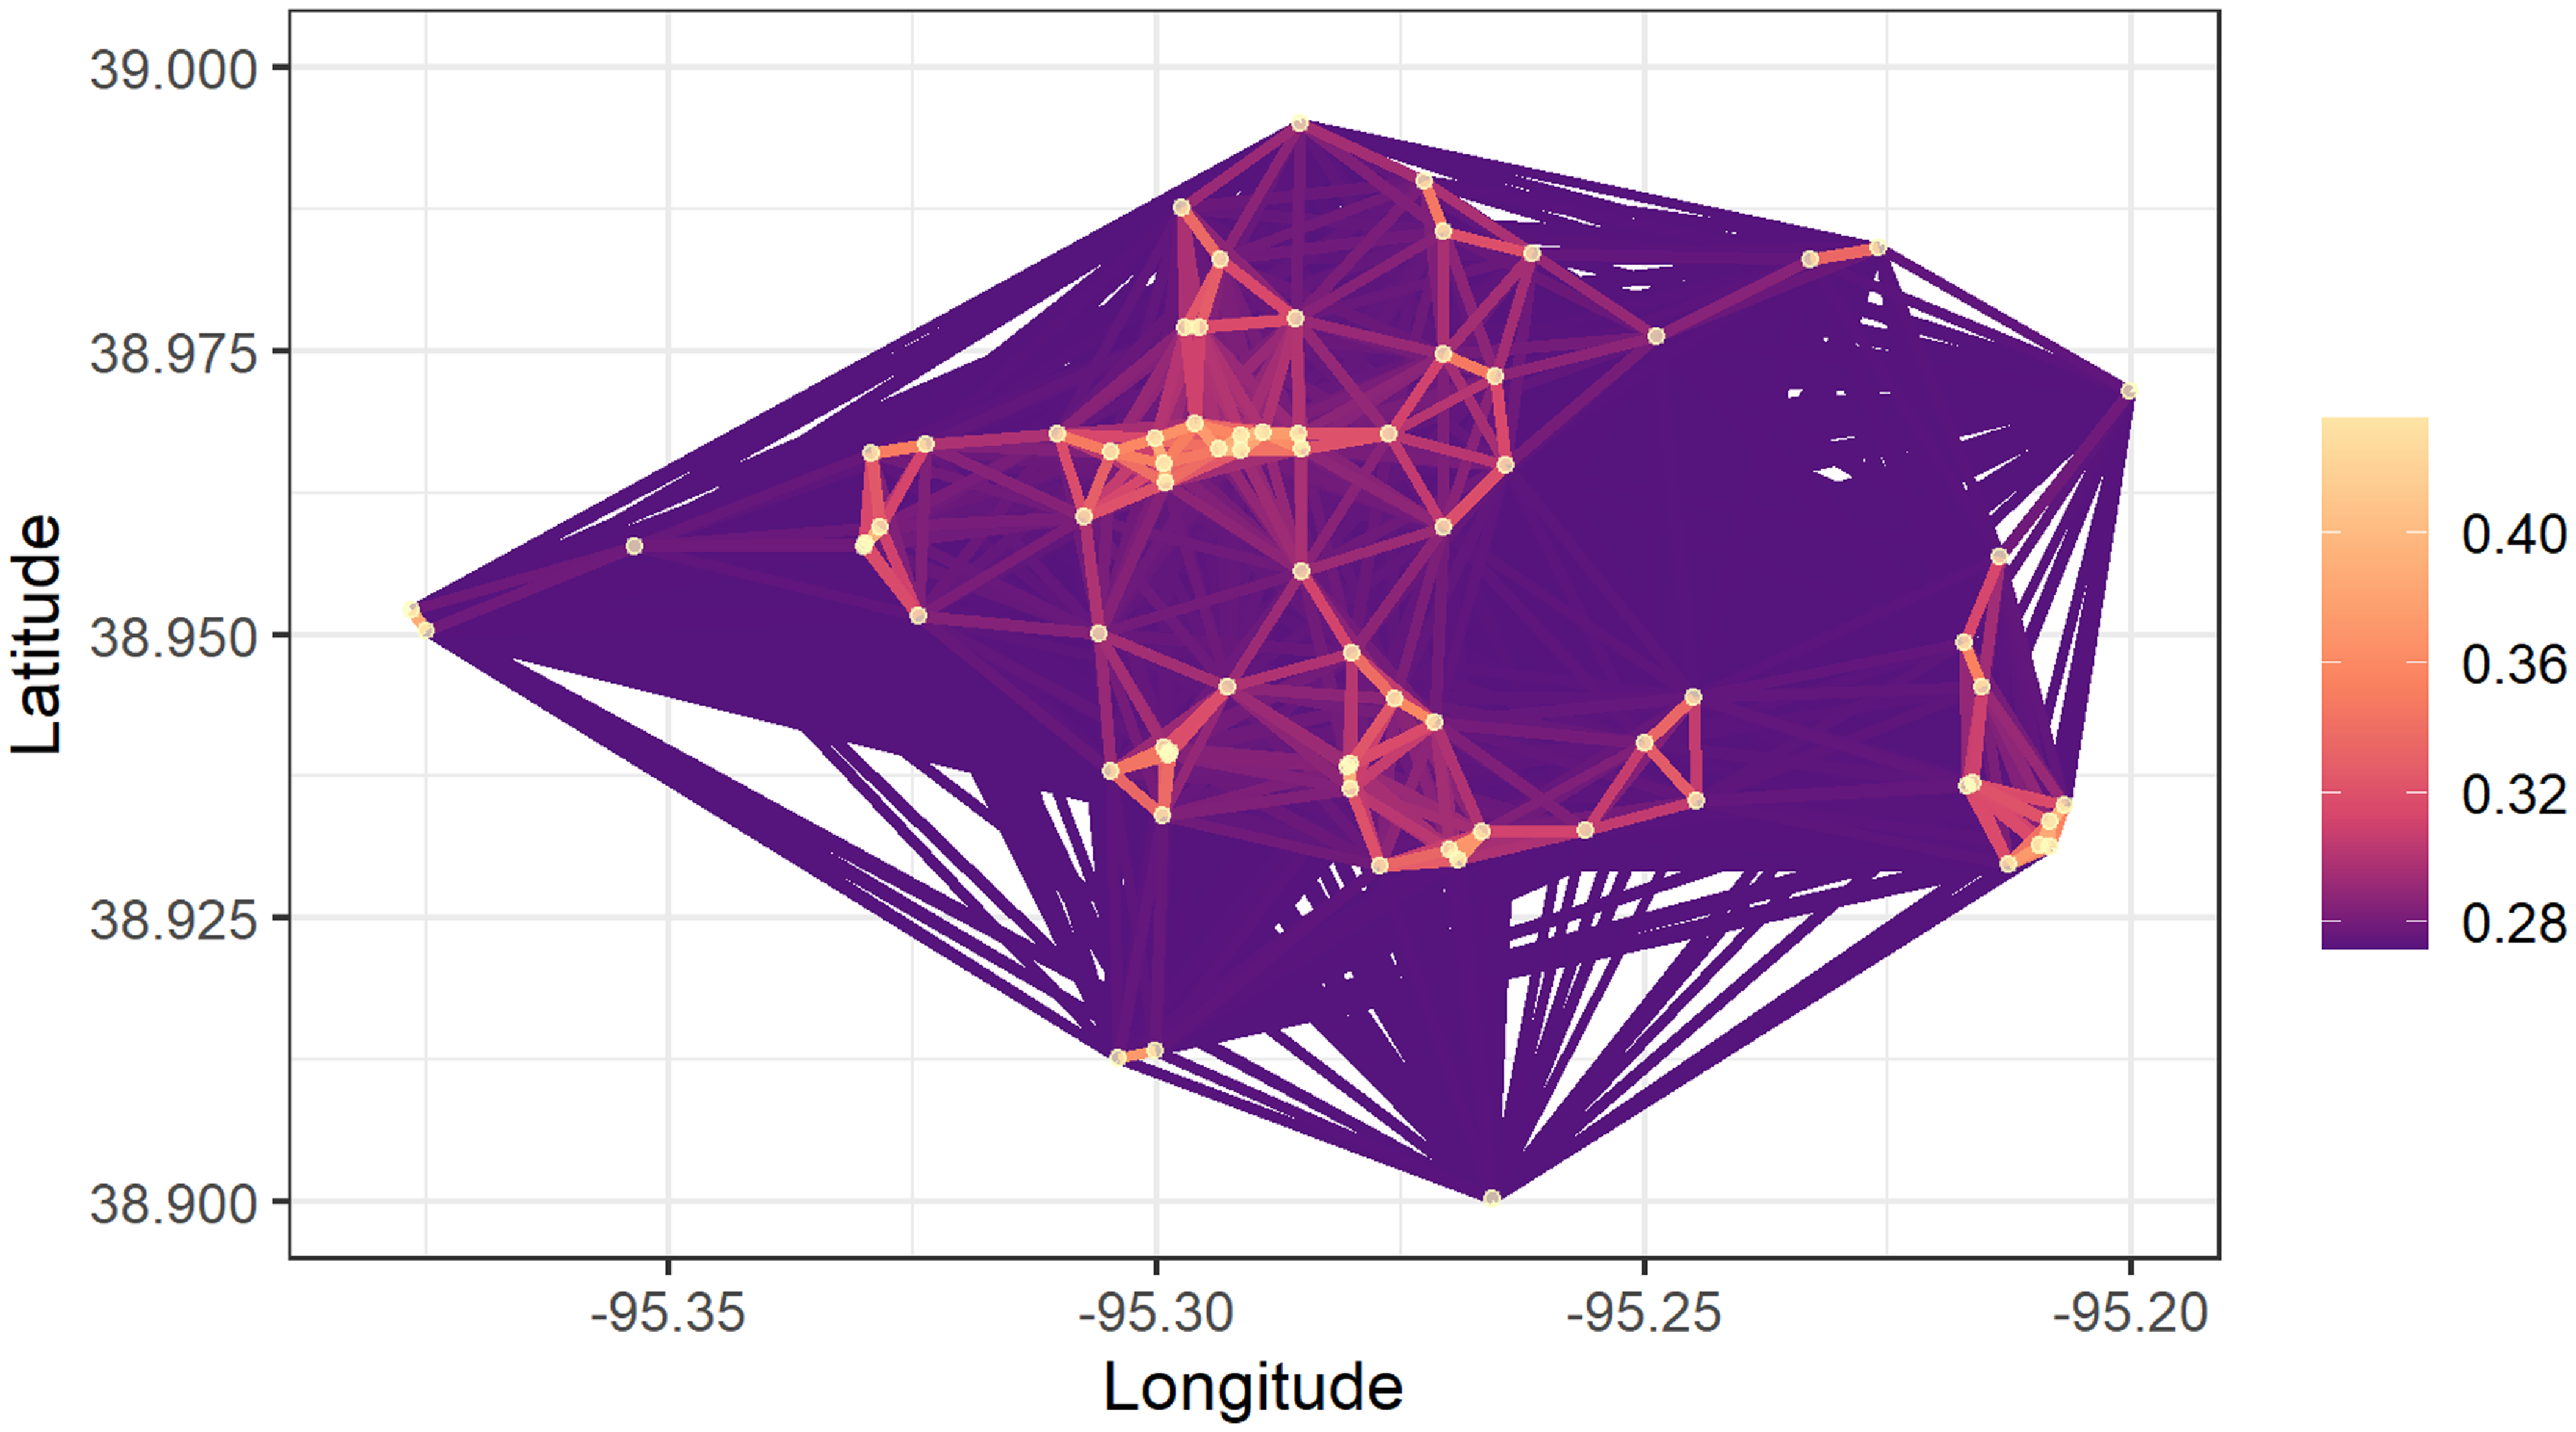
To visualize the calibrated dependence based on the fitted copula parameters in Table 2, Figure 4 maps an example for a group of claims within the storm depicted in Figure 1. The claim locations are plotted as a connected graph, where the colored edges indicate the strength of the fitted pairwise correlations. Correlations are stronger between claims that are geographically closer to each other, although claims within the storm still exhibit low positive correlation at any distance.
Example of calibrated dependence illustrated on claims from the storm in Figure 1 as a connected graph, where the colored edges indicate the strength of the pairwise correlations.
5.2. Prediction
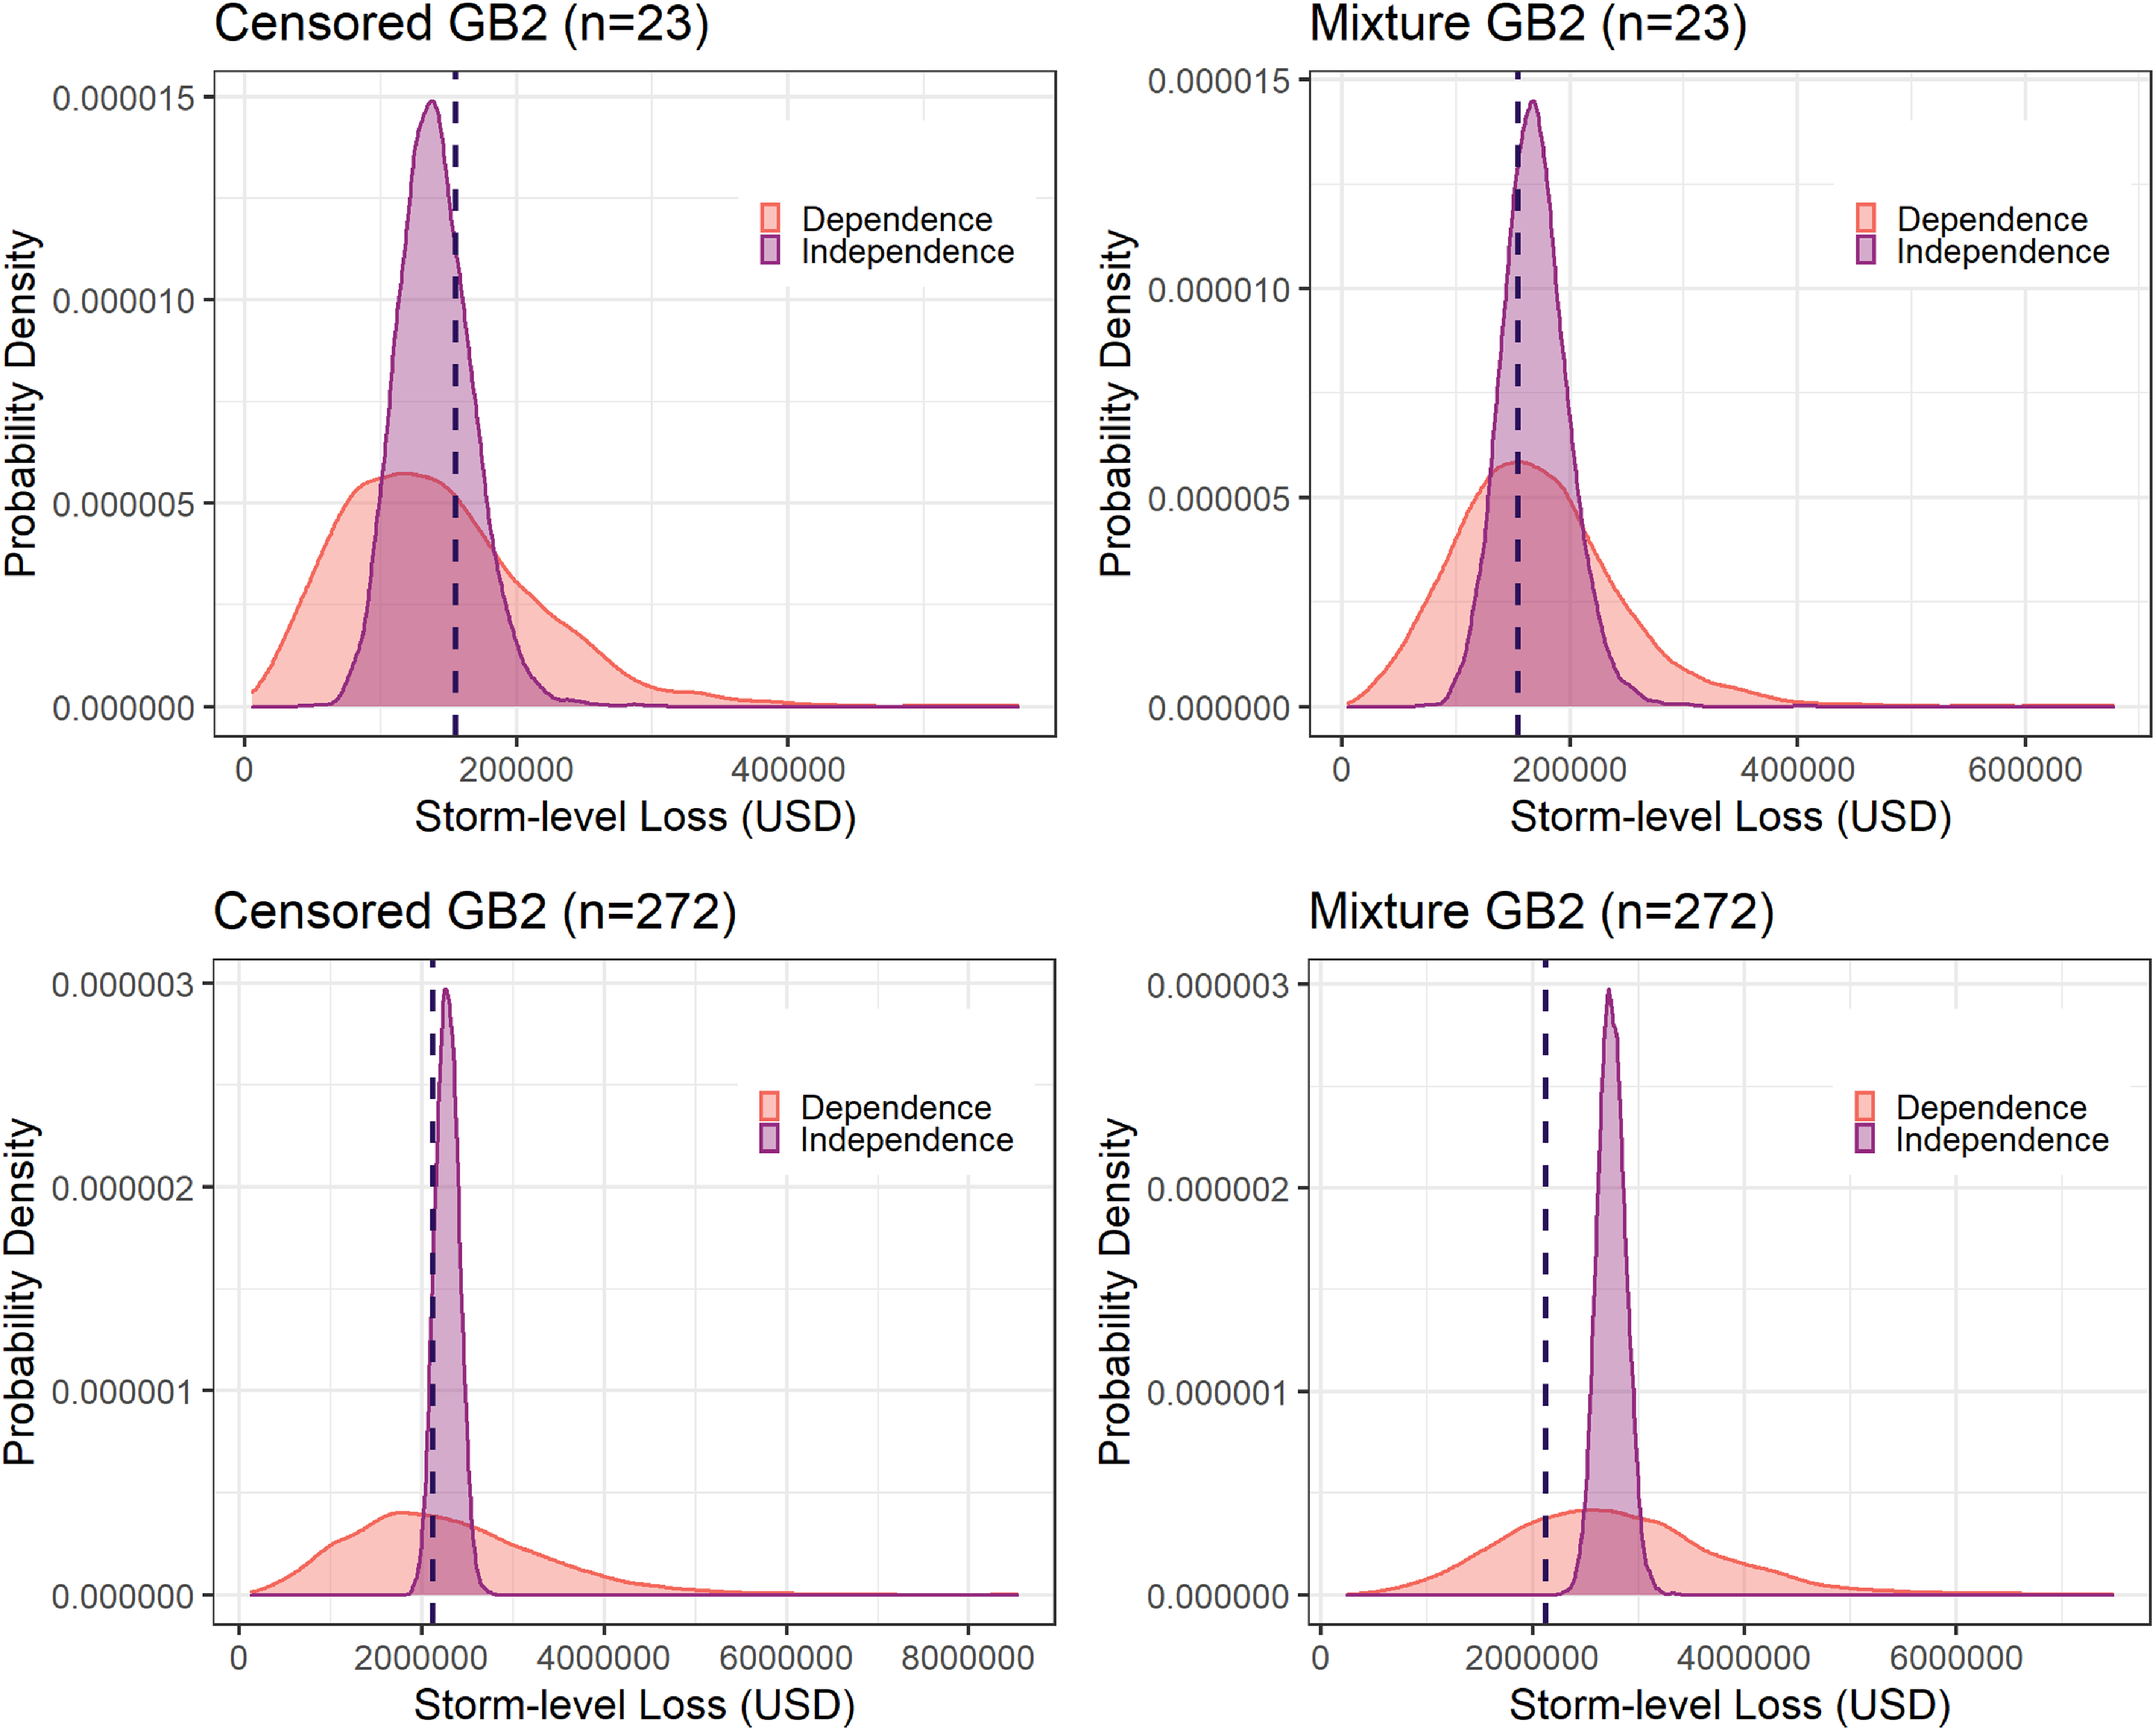
We evaluate the dependence assumptions of the proposed factor copula model using the hold-out hailstorms and their associated claims by simulating their predictive distributions. To demonstrate the value of the factor copula, we compare the predictive distributions from the factor copula regression model to those from the corresponding regression models assuming independence between claims. Specifically, based on the fitted model estimates in Table 2, we simulate 5000 realizations of the joint losses for each hold-out storm under the factor copula and under the independence copula to obtain predictive distributions of storm-level losses. For example, Figure 5 displays the predictive distributions of the storm-level losses for two hold-out hailstorms with different numbers of claims n under the factor copula dependence (orange) and independence (purple) models for the censored (left) and the two-part mixture (right) strategies of handling the probability mass at zero. The predictive distributions of storm-level losses under the factor copula have heavier tails and exhibit more right skew compared to those under independence, with the effect becoming more pronounced with higher claim frequency.
Predictive distributions of storm-level losses under dependence and independence models for the censored (left) and two-part mixture (right) models, with the observed loss in black.
To assess the distributional assumptions of the full factor copula model on the hold-out hailstorms, we examine the PIT of the storm-level losses and the coverage probabilities of the prediction intervals. Denote the storm-level losses by $S_i = \sum_{j=1}^{n_i} Y_{ij}$
. Based on the simulated predictive distributions, the empirical distribution function of
$S_i = \sum_{j=1}^{n_i} Y_{ij}$
. Based on the simulated predictive distributions, the empirical distribution function of $S_i$
is
$S_i$
is $\hat{H}_i(s) = (1/b) \sum_{k=1}^b \boldsymbol{1}({s}_{ik} \leq s)$
, where
$\hat{H}_i(s) = (1/b) \sum_{k=1}^b \boldsymbol{1}({s}_{ik} \leq s)$
, where $s_{ik}$
are the simulated realizations of
$s_{ik}$
are the simulated realizations of $S_i$
for
$S_i$
for $k=1, \ldots, b$
and
$k=1, \ldots, b$
and $b=5000$
replications in our setting. The predictive distribution is probabilistically calibrated if the PIT
$b=5000$
replications in our setting. The predictive distribution is probabilistically calibrated if the PIT $\hat{H}_i(S_i)$
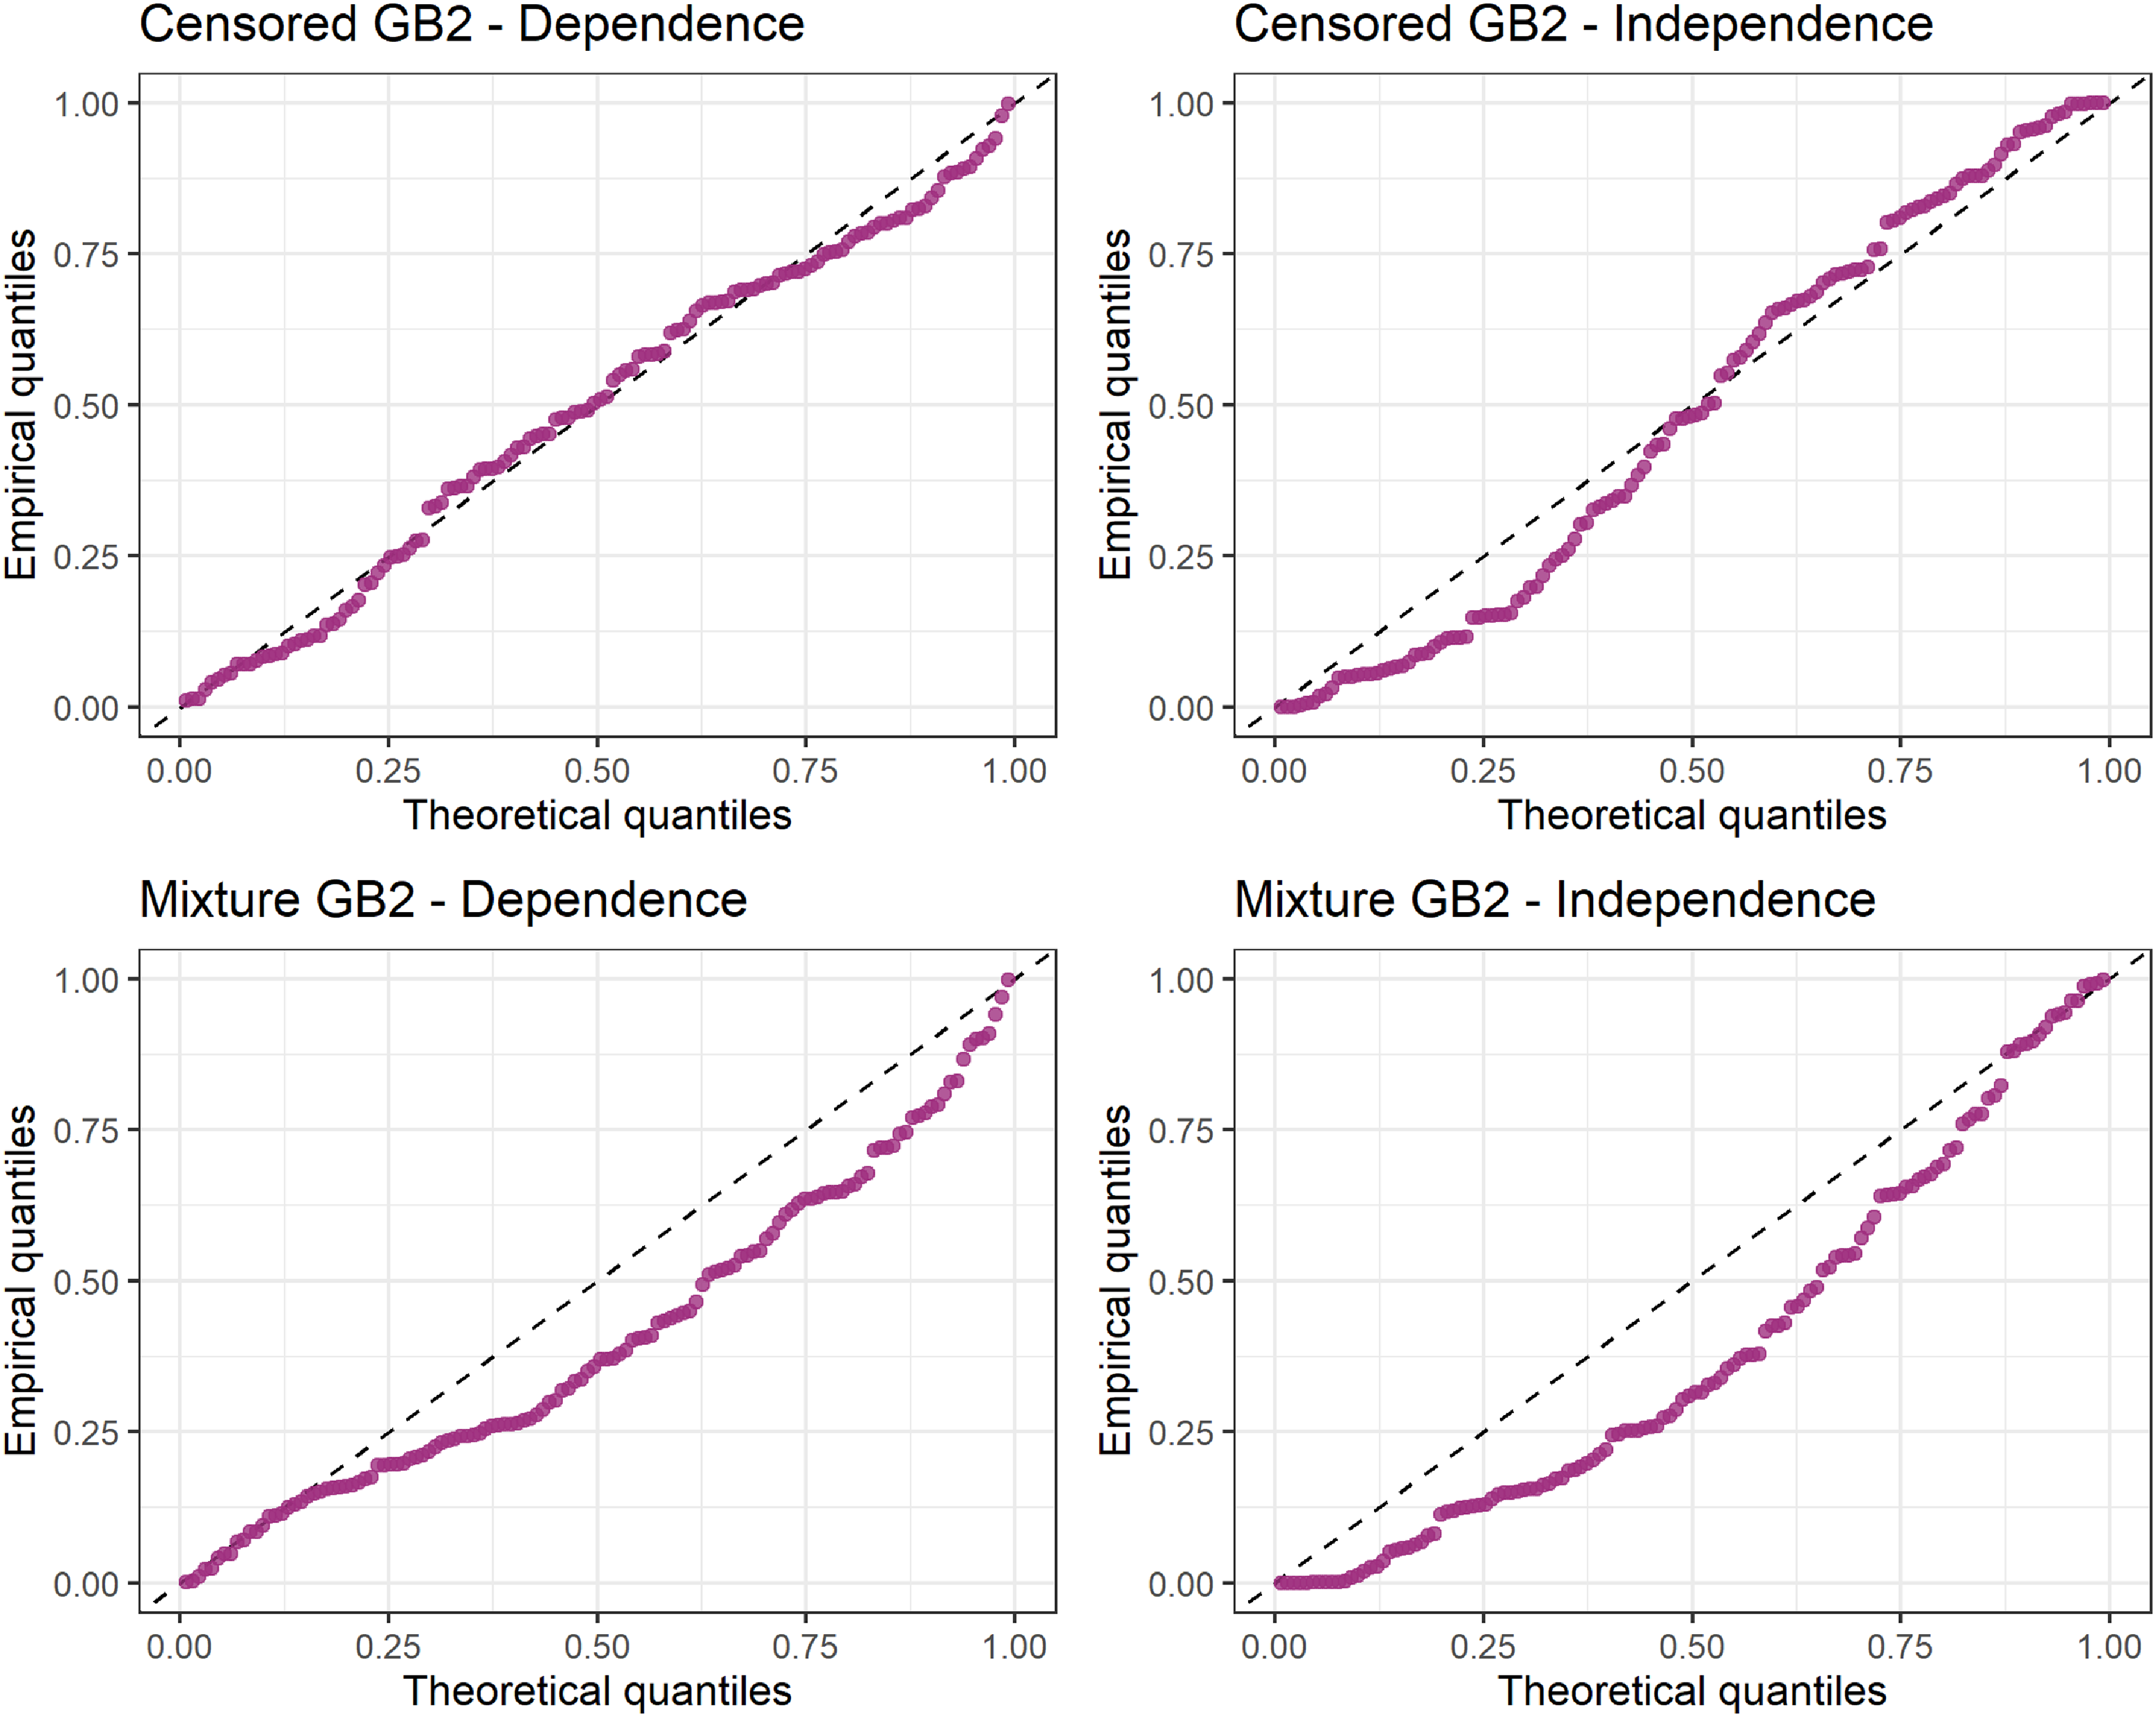
has a standard uniform distribution. Figure 6 displays the uniform Q-Q plots of the PIT of the hold-out storm losses for the censored (top) and two-part mixture (bottom) factor models (left), compared to their counterparts under independence (right). The Q-Q plots suggest that the independence assumption does not capture the storm-level loss distributions effectively. The two-part mixture GB2 dependence model similarly does not appear appropriate, showing departures from the 45-degree line. Thus, the censored GB2 factor copula model is better probabilistically calibrated to the hold-out sample compared to the two-part mixture GB2, which may have overfitted the marginal distribution on the training data in Section 5.1.
$\hat{H}_i(S_i)$
has a standard uniform distribution. Figure 6 displays the uniform Q-Q plots of the PIT of the hold-out storm losses for the censored (top) and two-part mixture (bottom) factor models (left), compared to their counterparts under independence (right). The Q-Q plots suggest that the independence assumption does not capture the storm-level loss distributions effectively. The two-part mixture GB2 dependence model similarly does not appear appropriate, showing departures from the 45-degree line. Thus, the censored GB2 factor copula model is better probabilistically calibrated to the hold-out sample compared to the two-part mixture GB2, which may have overfitted the marginal distribution on the training data in Section 5.1.
Q-Q plots of PIT of storm-level losses on hold-out sample for the censored (top) and two-part mixture (bottom) dependence models (left), compared to the independence case (right).
We further assess out-of-sample calibration by examining the coverage probabilities of the prediction intervals for storm-level losses. We build prediction intervals for a range of levels based on the predictive distributions of $S_i$
. For
$S_i$
. For $\alpha \in (0,1)$
, let
$\alpha \in (0,1)$
, let $L_{i, PI}(\alpha)$
and
$L_{i, PI}(\alpha)$
and $U_{i, PI}(\alpha)$
be the lower and upper bounds of the
$U_{i, PI}(\alpha)$
be the lower and upper bounds of the $100(1-\alpha)$
% prediction interval of
$100(1-\alpha)$
% prediction interval of $S_i$
. Then
$S_i$
. Then $\hat{L}_{i, PI}(\alpha) = \hat{H}_i^{-1}(\alpha/2)$
and
$\hat{L}_{i, PI}(\alpha) = \hat{H}_i^{-1}(\alpha/2)$
and $\hat{U}_{i, PI}(\alpha) = \hat{H}_i^{-1}(1-\alpha/2)$
so that
$\hat{U}_{i, PI}(\alpha) = \hat{H}_i^{-1}(1-\alpha/2)$
so that $\Pr(\hat{L}_{i, PI}(\alpha) \unicode{x003C} S_i \unicode{x003C} \hat{U}_{i, PI}(\alpha)) \approx 1-\alpha$
with approximately
$\Pr(\hat{L}_{i, PI}(\alpha) \unicode{x003C} S_i \unicode{x003C} \hat{U}_{i, PI}(\alpha)) \approx 1-\alpha$
with approximately $\alpha/2$
probability in each tail. The coverage probability is the probability that the observed storm-level loss lies in its prediction interval, which we estimate empirically across the hold-out hailstorms. If the distributional assumptions of the model are appropriate, the
$\alpha/2$
probability in each tail. The coverage probability is the probability that the observed storm-level loss lies in its prediction interval, which we estimate empirically across the hold-out hailstorms. If the distributional assumptions of the model are appropriate, the $100(1-\alpha)$
% prediction interval should achieve a coverage probability of at least
$100(1-\alpha)$
% prediction interval should achieve a coverage probability of at least $1-\alpha$
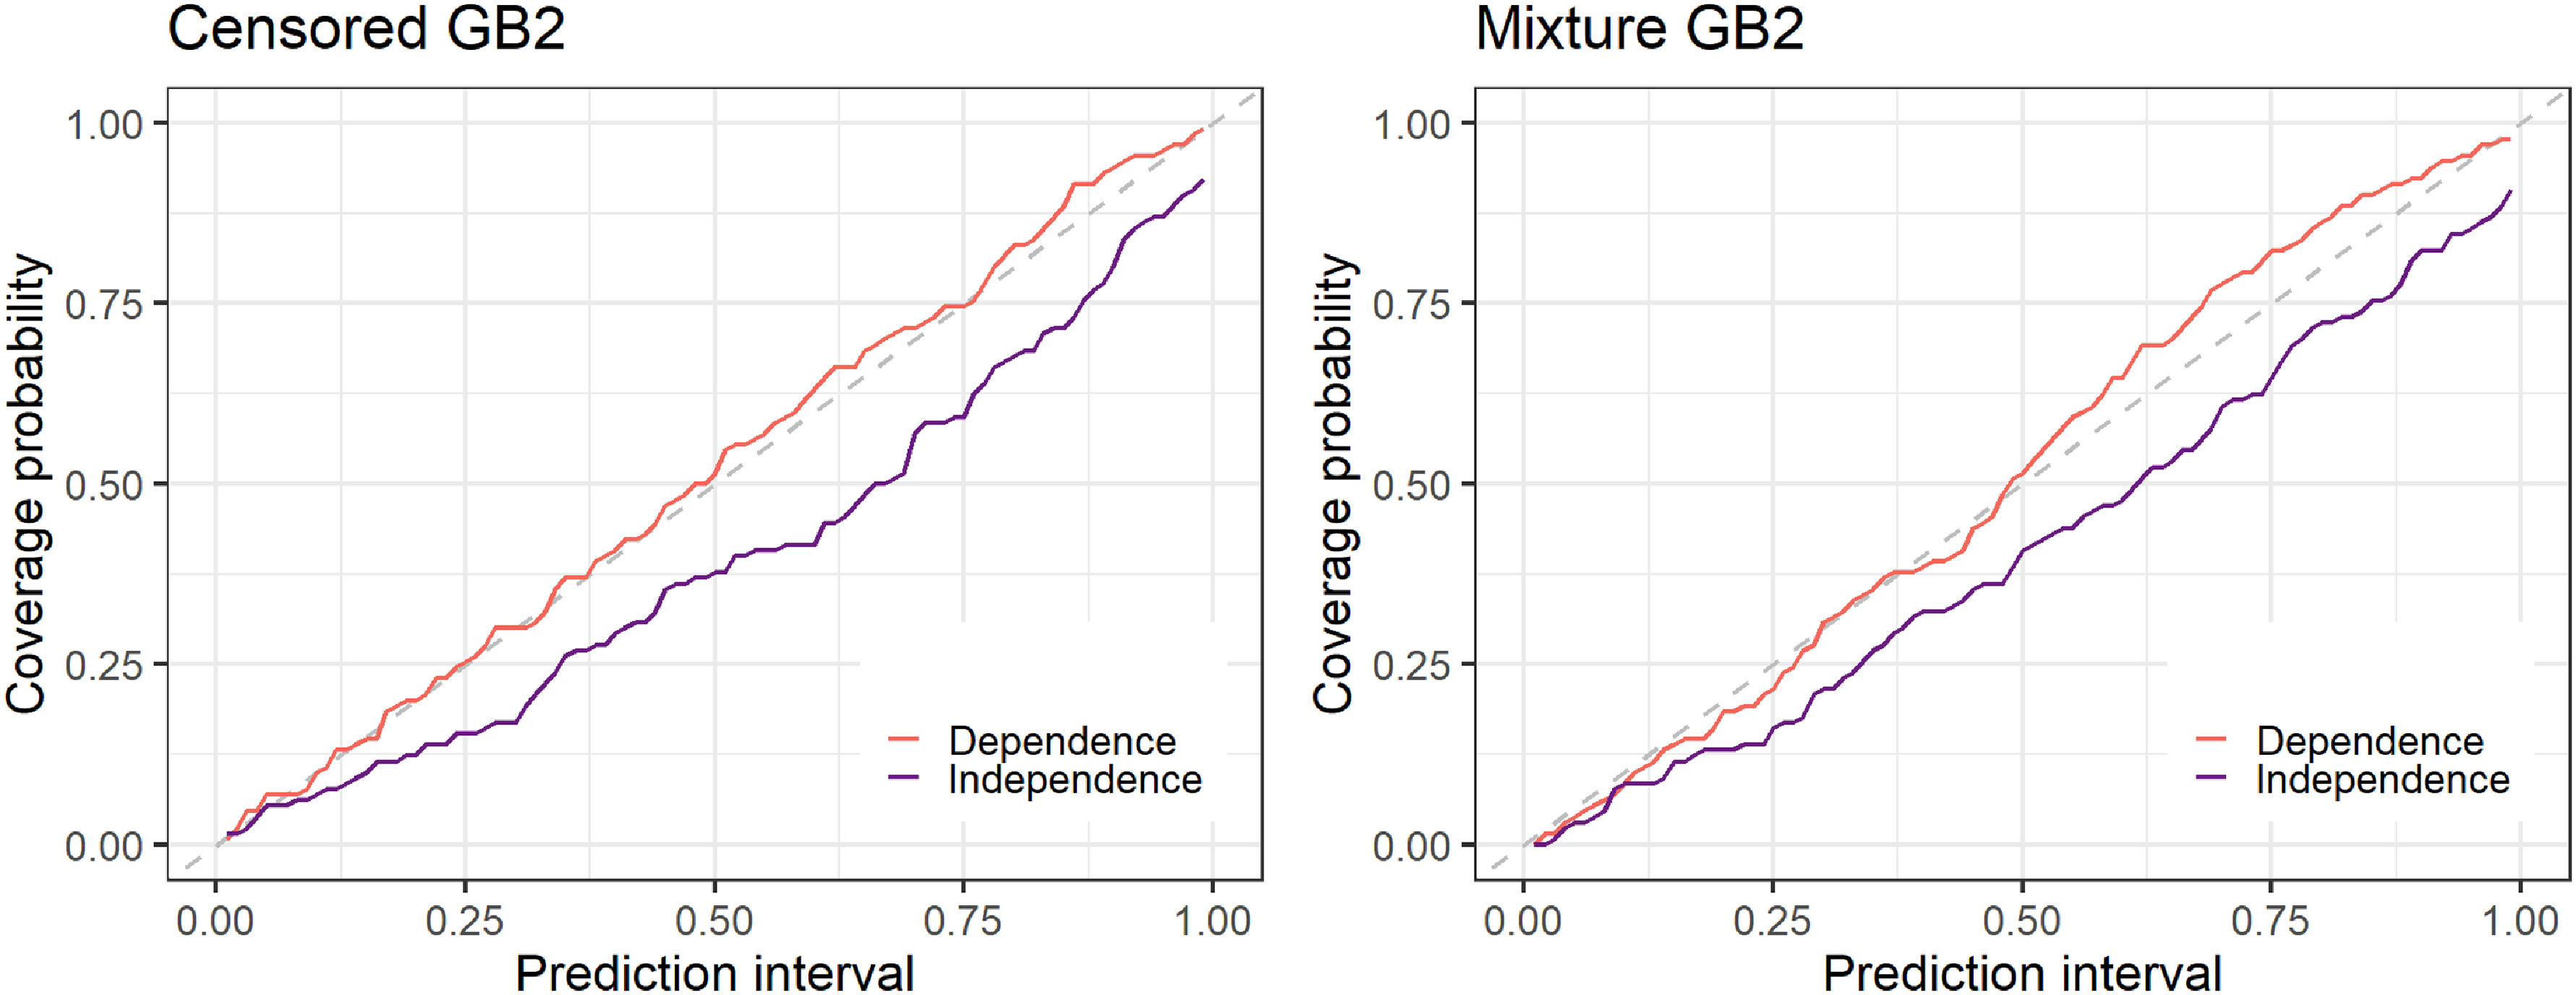
. Figure 7 summarizes the coverage probabilities for the prediction intervals for the censored (left) and two-part mixture (right) models. The dependence models appear to obtain the desired coverage probabilities near the 45-degree line, compared to the lower coverage probabilities of the independence models. The censored GB2 dependence model coverage probabilities follow the 45-degree line more closely than the two-part GB2 dependence model, suggesting that, similar to the PIT Q-Q plots, the censored GB2 factor copula model is more distributionally appropriate for the hold-out sample. We proceed with the censored GB2 factor copula model in the applications.
$1-\alpha$
. Figure 7 summarizes the coverage probabilities for the prediction intervals for the censored (left) and two-part mixture (right) models. The dependence models appear to obtain the desired coverage probabilities near the 45-degree line, compared to the lower coverage probabilities of the independence models. The censored GB2 dependence model coverage probabilities follow the 45-degree line more closely than the two-part GB2 dependence model, suggesting that, similar to the PIT Q-Q plots, the censored GB2 factor copula model is more distributionally appropriate for the hold-out sample. We proceed with the censored GB2 factor copula model in the applications.
Prediction interval coverage probabilities under dependence and independence models.
6. Application
Characterizing the dependence between insured losses stemming from a common storm allows insurers to make efficient claims management decisions, especially when claims in a concentrated area are spatially correlated. We demonstrate an application in the context of a treaty reinsurance contract on hail property damage claims. In particular, we consider an aggregate excess-of-loss (XL) contract, a non-proportional arrangement where the treaty covers all accumulated losses consequential to a given event that exceed the attachment point (aggregate reinsurance deductible). Aggregate XL reinsurance is particularly well suited for managing property claims from weather-related events as it protects insurers from the accumulation of risks whose individual losses may not be very large, but whose total payout may be substantially amplified by positive correlation. The spatial and aspatial association in our hail property claims exemplify the positive correlation in this setting. In fact, special cases of aggregate XL with high cover are a common method for insurers to manage natural catastrophe-related property losses for primary perils such as earthquakes (Parodi, Reference Parodi2014).
In the presence of an aggregate XL reinsurance treaty that covers event-level losses, insurers are interested in predicting their retained losses to provide claims management insights. Following an observed storm, the insurer can leverage the weather, property, and policy information to obtain a predictive distribution of their retained losses to support their financial planning activities, such as setting case reserves and making risk retention and transfer decisions.
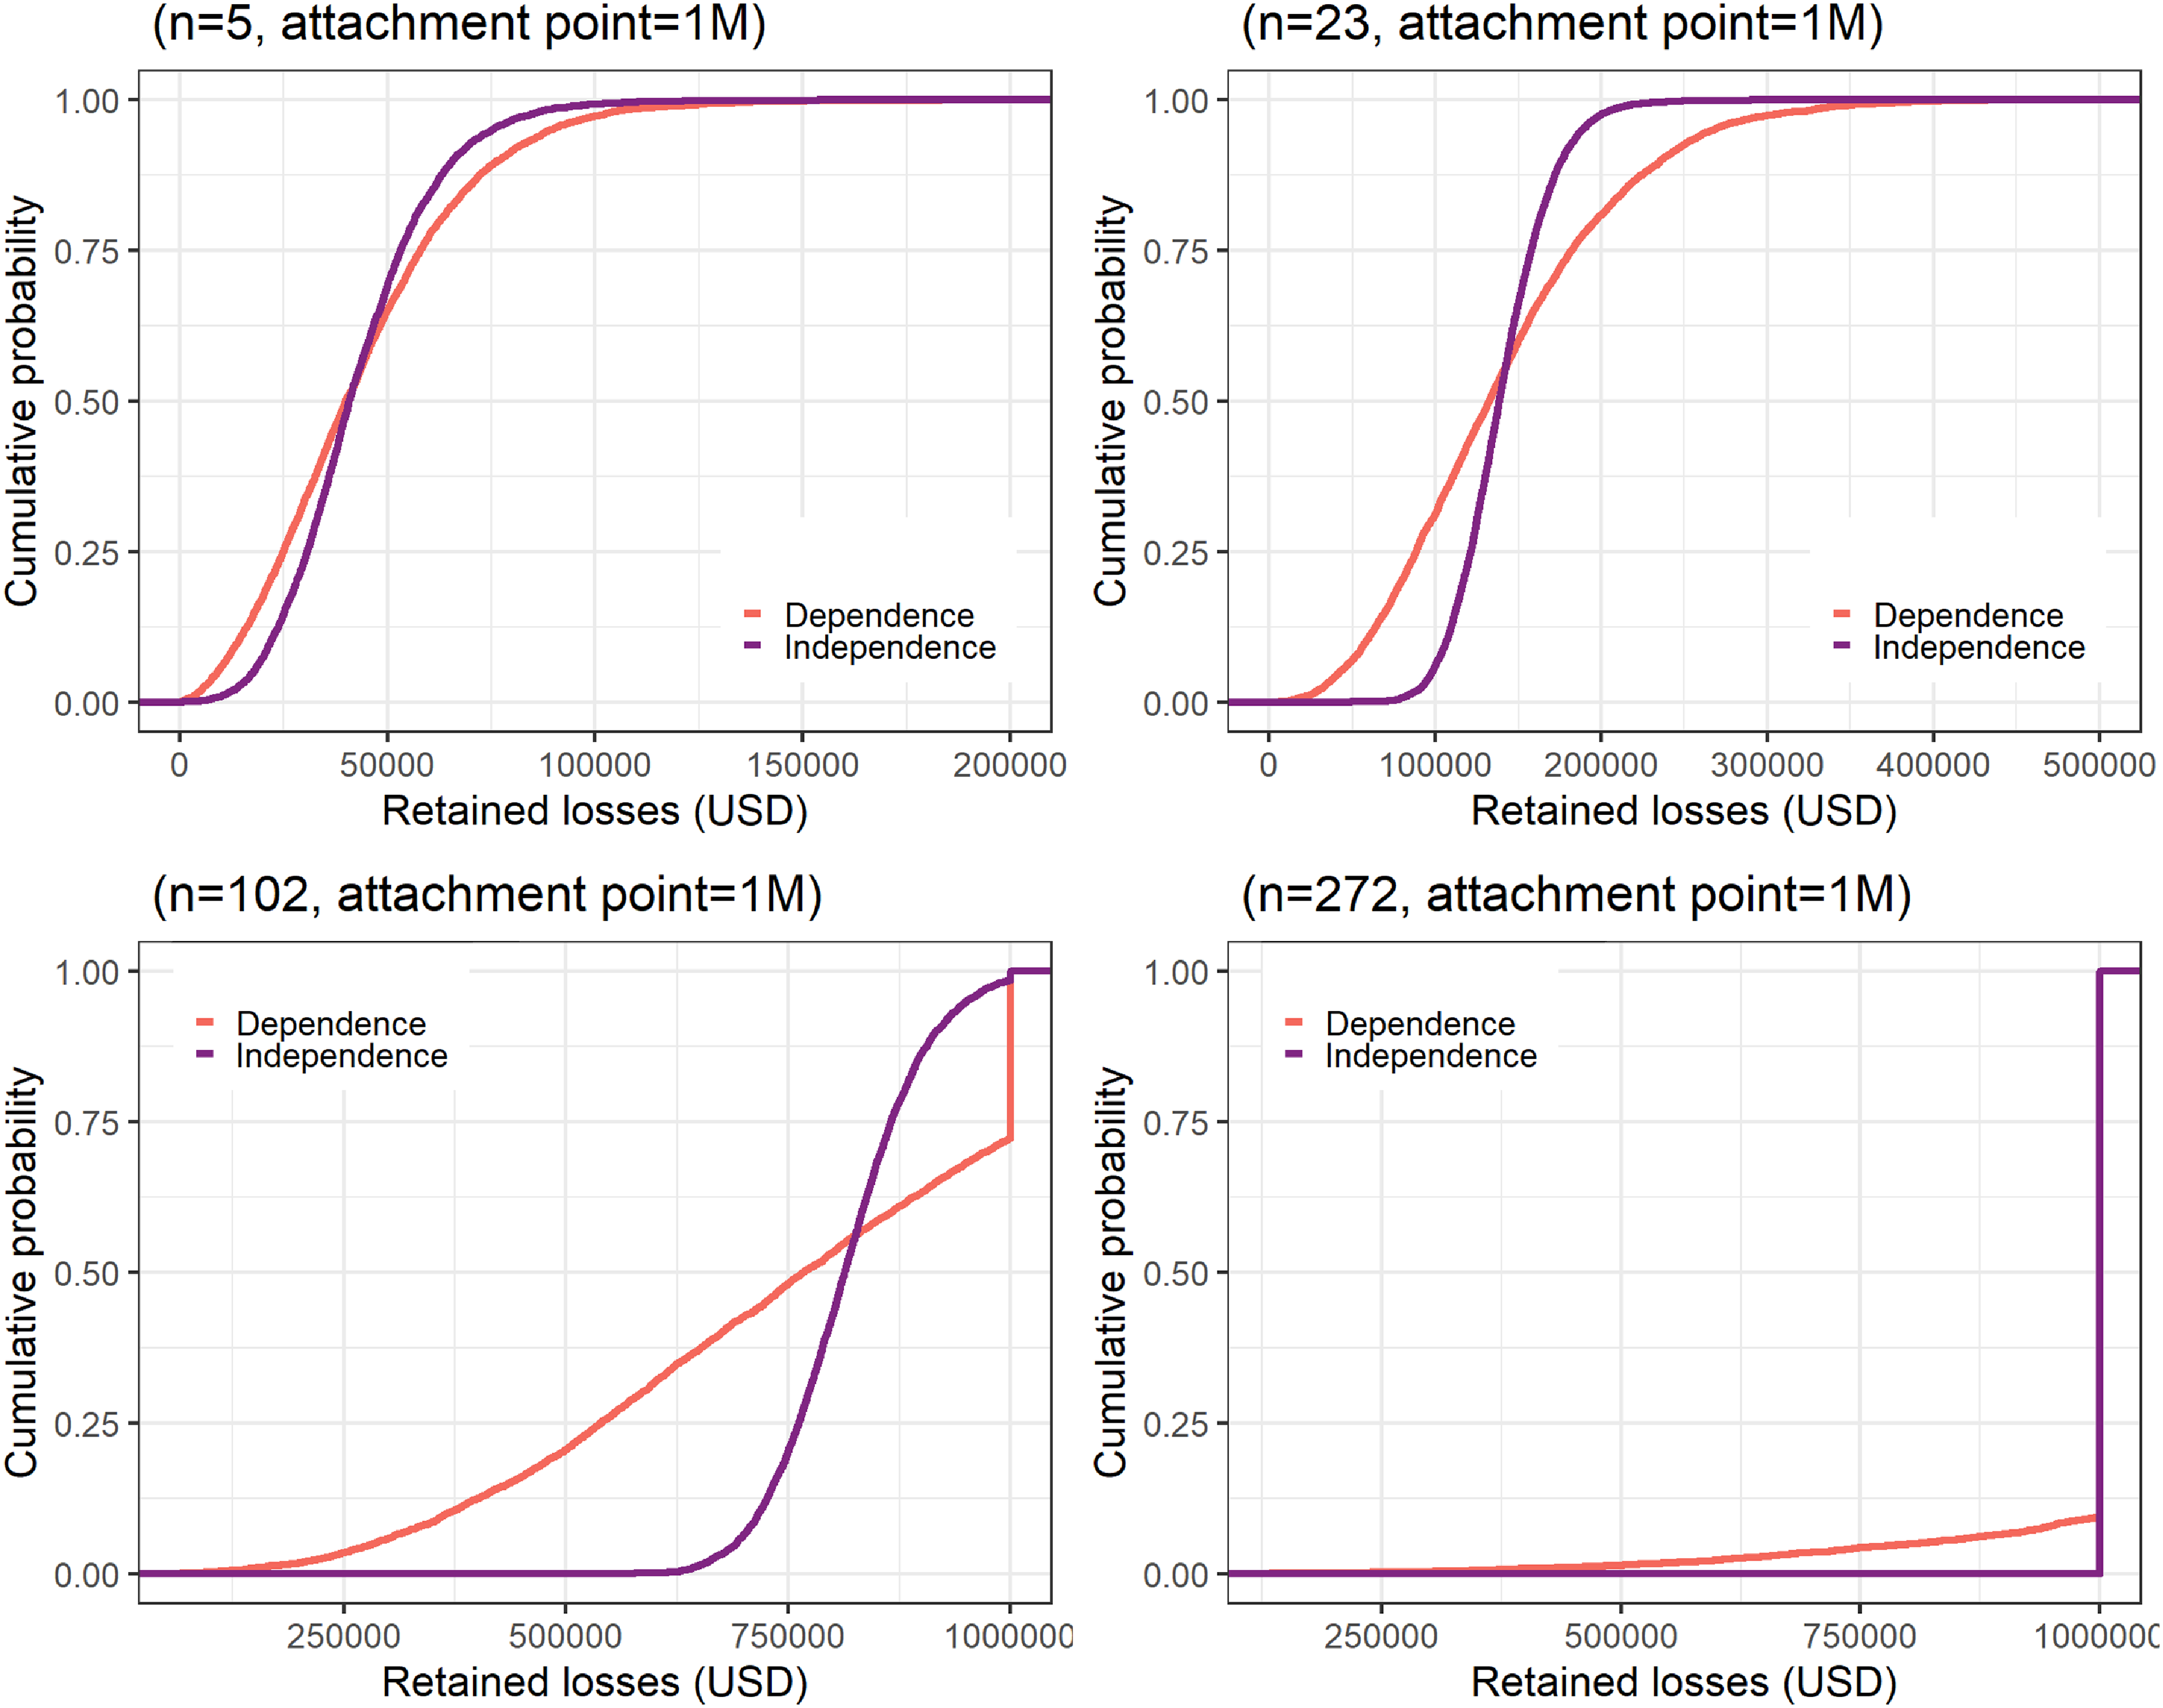
Using the predictive distributions of the hold-out hailstorms in 2015, we compare the factor copula model that captures the spatial and aspatial dependence among losses to the independence assumption for the aggregate XL contract. As an example, for an attachment point of $1 million, Figure 8 shows the cumulative distribution functions of the predictive distributions of the storm-level losses that are retained by the insurer under the dependence and independence models for four storms with varying numbers of claims n, two of which were previously shown in Figure 5. Insurers setting case reserves based on predictive distributions of their retained losses would substantially underestimate the risk if assuming independence, leading to potentially insufficient reserves. To illustrate, consider an insurer that sets the case reserves for each storm equal to the 75% value-at-risk of their retained losses. Based on the distributions in Figure 8, the dependence model implies a $4734 (8.9%) higher case reserve than the independence model for the storm with $n=5$
claims, a $24,517 (15.5%) higher reserve for the storm with
$n=5$
claims, a $24,517 (15.5%) higher reserve for the storm with $n=23$
claims, and a $134,366 (15.5%) higher reserve for the storm with
$n=23$
claims, and a $134,366 (15.5%) higher reserve for the storm with $n=102$
claims. There is no difference for the storm with
$n=102$
claims. There is no difference for the storm with $n=272$
claims due to both of the models predicting a very high (at least 75%) probability of the storm-level loss exceeding the $1 million attachment point.
$n=272$
claims due to both of the models predicting a very high (at least 75%) probability of the storm-level loss exceeding the $1 million attachment point.
Predictive distributions of retained losses for a common attachment point of $1 million under dependence and independence models. Storms include those shown in Figure 5.
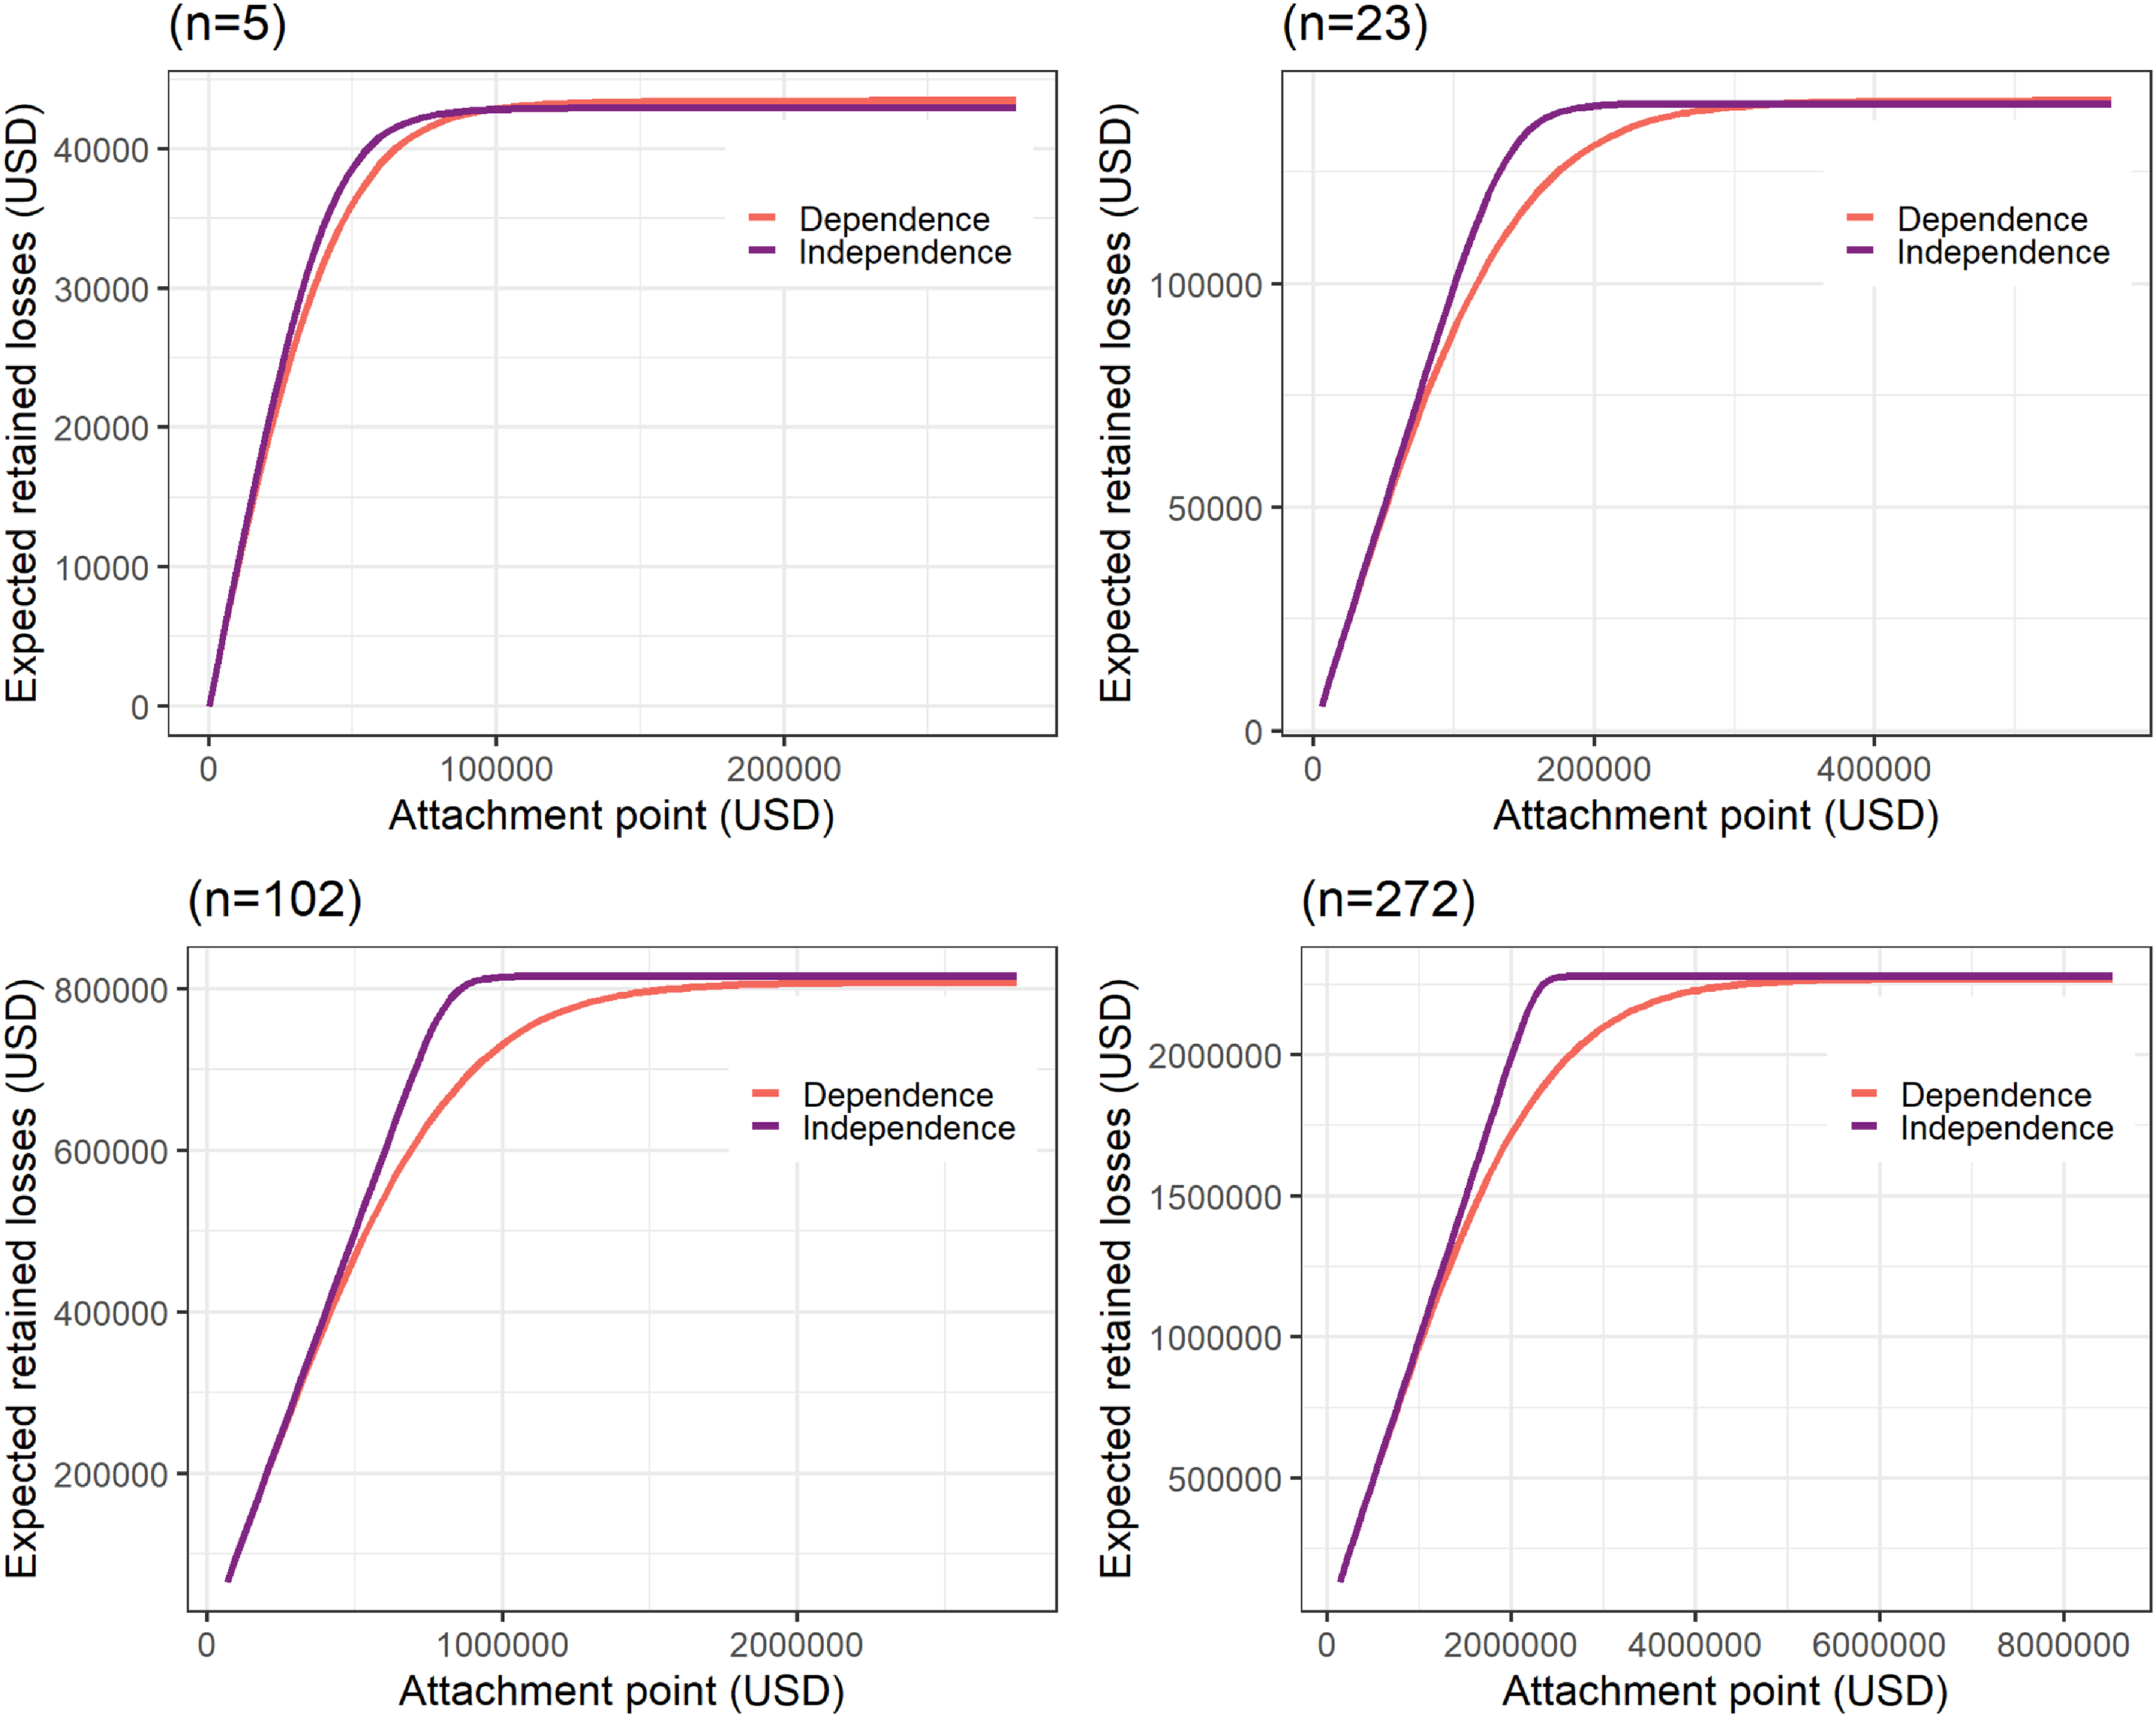
Considering a range of attachment points, Figure 9 displays the expected retained losses under the dependence and independence models for the same storms as those shown in Figures 5 and 8. At a given attachment point, the dependence model suggests lower expected retained losses (i.e., reinsurance deductible cost) than the independence model. Thus, for a given level of desired retention by the insurer, the dependence model suggests selecting a higher attachment point than under the independence model to manage claim costs. Even when incorporating the same rich covariate information, insurers must account for the dependence between losses arising from the same storm in their claims management decisions.
Expected retained losses for a range of attachment points under dependence and independence models. Storms correspond to those shown in Figure 8.
Our application involving an aggregate XL reinsurance treaty reveal several implications for insurers’ claims management and risk transfer decisions involving excess layers of coverage. First, ignoring the spatial and aspatial dependence among losses originating from a common storm greatly mischaracterizes the distributions of the insurer’s retained and ceded losses, which impacts financial planning decisions such as setting case reserves. Second, for a desired level of retention by the insurer, the dependence model suggests that the insurer can seek a higher attachment point than under the independence model.
7. Conclusion
Property damage from hail and other severe convective storm perils is responsible for a substantial portion of US weather-related insurance losses against the backdrop of changing weather and socioeconomic patterns and growing property exposure. The intense, localized nature of convective storms produces a concentration of spatially correlated claim outcomes whose dependence must be characterized to support effective claims management and reinsurance decisions.
We provide a method for insurers to predict the financial impact of spatially dependent property insurance claims arising out of a common storm event. Our copula-based regression for replicated spatial data features a spatial factor copula that captures the spatial dependence between properties that decays with distance, as well as the aspatial dependence from being jointly affected by the same storm irrespective of location. While retaining the interpretation of latent sources of dependence, the framework also allows us to flexibly leverage the suite of well-studied univariate methods of incorporating granular weather and claim information to model skewed, heavy-tailed insurance losses. We propose a likelihood-based estimation procedure to relieve the computational burden associated with high dimensionality and exacerbated by the zero-inflated loss outcomes. To demonstrate the estimation and prediction, we analyze a unique hail claims dataset constructed with hail radar maps and property exposures. We further highlight the implications of the spatial and aspatial dependence on insurer claims management decisions through an application involving an aggregate excess-of-loss reinsurance treaty.
While our proposed method focuses on the analysis of replicated spatial data to model joint property losses, we recognize the importance of combining actuarial models of claim occurrence (e.g., frequency, location, timing, and severity) with climate science models of storm occurrence and weather scenarios to support a broader array of actuarial applications. Our spatial factor copula framework assumes that losses from different storms are independent conditional on the occurrence of claims and the observed heterogeneity. Future work may explore the potential relationship between the frequency and geographical distribution of claims with their severity. Potentially evolving hail patterns due to climate change suggest further consideration of temporal trends across storms. In addition, while the Gaussian factor copula has the ability to accommodate flexible correlation specifications and unbalanced numbers of claims, it is restricted by its symmetry and lack of tail dependence. Growing concern about managing risk associated with the highest loss potentials suggests that future work should explore more flexible dependence characterization.
Our application setting involves hail property loss data, although our model is more broadly applicable to other severe storm settings where a concentrated group of properties are simultaneously affected by an event that introduces potential for positively correlated losses to rapidly accumulate. Our work demonstrates how data and analytics can support our understanding of the dependence in claims arising from common weather events, as well as their effects on claims management decisions. As (re)insurers focus on modeling and monitoring a growing range of natural catastrophe perils, the increasing availability of detailed weather and claims information offer continual opportunities to expand their capacity to accept and manage weather and climate risk.
Supplementary material
The supplementary material for this article can be found at https://doi.org/10.1017/asb.2025.7.
Acknowledgements
The authors would like to thank the anonymous referees and the Editor for their thoughtful comments and suggestions that improved the paper. Lisa Gao acknowledges financial support from the Natural Sciences and Engineering Research Council of Canada (RGPIN-03389-2023).
Competing interests
The authors have no potential competing or conflicting interests to declare.


 Open access

