


Introduction
Over the past twenty-five years, climate change has attracted growing interest—and alarm—across corporate America. As a result, boards of directors increasingly use their authority to address climate change through private and collective corporate governance and political action. However, corporate climate action remains contested, especially for firms that do not profit directly from decarbonization. These tensions highlight the attitudes of individual corporate board members toward climate change and whether private commitments to the environment might lead board members to advocate for climate action at the firms they oversee. Can the origins of corporate climate policies be traced to board members’ personal beliefs?
Corporate boards of directors, composed of executives and experienced outsiders charged with representing the interests of shareholders, are the locus of strategic leadership in the American corporation. Directors propose and vote on high-profile corporate initiatives and strategic plans, make important executive appointments, and wield enormous social capital and discursive power. As such, boards have been important sites for the creation of corporate climate policies, which the literature has mostly explained in terms of the economic interests of corporations and the influence of outside social and political actors.
However, corporate directors are economic and social elites practiced in the exercise of political power, and organizational decision-making depends just as much on the beliefs, interests, and interactions of individuals as on collective and external considerations. Accordingly, we argue that corporations led by pro-environment or “green” directors are more likely to undertake actions to address climate change. This may occur because green directors are more cognizant of, or susceptible to, arguments that the corporation’s interests are threatened by climate change or corporation inaction; because they have green professional networks in which corporate climate action has become a norm; or because green directors strategically use their positions of influence to advance their personal views.
In testing this argument, our first step is to develop a measure of the extent to which corporate directors support green politics. To do this, we match 88,000 board members from America’s public companies to data on individual campaign contributions from 1990 to 2023. Thirty-nine percent of board members donate to political campaigns, and some have given predominantly to pro-environment politicians. We propose that directors who undertake this private behavior are likely to hold pro-environment views themselves. Using this approach, we show that green board members are widespread across corporate America, even at heavily polluting firms. Their numbers grew sharply from 1990 to 2005 and gradually since then. There is typically significant variation in the number of green directors among companies within the same industry, providing an opportunity to examine the implications of board composition between otherwise similar firms.
We examine whether board members who personally value environmental protection serve at corporations that are more likely to undertake climate action. In a panel analysis, we examine two internal policies to reduce a firm’s climate impact: the submission of reports to the CDP, the preeminent platform for the voluntary disclosure of corporate greenhouse gas emissions, and the appointment of an executive-level chief sustainability officer (CSO). We also consider two forms of external climate policy engagement: membership in an ad hoc group supporting climate action and membership in an ad hoc group opposing climate action. We analyze these data at the firm-year level using a variety of linear models. We further extend our analysis by conducting a cross-sectional analysis of six types of corporate emissions reduction commitments, such as commitments to net-zero carbon dioxide emissions.
We find a robust conditional association between the presence of green directors and the adoption of pro-climate policies. For internal policies, firms that move from the 10th percentile to the 90th percentile of pro-climate directors increase their predicted percentage chance of reporting to the CDP by 1.2 percent and their percentage change of appointing an executive-level CSO by 1.1 percent. Externally, green directors raise the predicted percentage chance of a firm joining a pro-climate coalition by 0.7 percent. These conditional associations are meaningful in relative terms, as less than 10 percent of firms in our sample undertake these activities. We also find that firms are more likely to make ambitious carbon reduction commitments if they are run by directors with strongly pro-environmental attitudes.
Our analysis makes three contributions to the study of corporate political behavior and the politics of climate change. First, we contribute to recent literature that breaks down the constituent parts of the corporation—including its shareholders, internal scientists, and workforceFootnote 1—and to literature showing how outside influences (other corporations’ behaviors, non-governmental organizations (NGOs), and public opinion)Footnote 2 shape corporate behavior. We fuse elements of each of these because, in our telling, corporate boards are important venues for shaping climate action, not just because of their institutional responsibilities but also because corporate directors bring their personal environmental commitments into the boardroom. Our second, and related, contribution is to demonstrate the flexible meaning of “fiduciary responsibility” in the current era.Footnote 3 Directors’ views of their responsibility to the corporation seem to be shaped by their personal political views, reflecting the politicization of corporate policies on issues of public importance, from environmental protection to diversity, free speech to labor rights. In so doing, we focus on personal motives for corporate “self-regulation,” previously explained as a consequence of government incentives, regulatory preemption, and market motives.Footnote 4 Finally, our study adds nuance to the literature on board elections, which have become a site of contestation over the environment and climate change.Footnote 5 Our findings illustrate not only why these elections are so important, but also why fully understanding board candidates’ views and eventual impact may include learning about their personal political values.
Theory
Corporate climate policies
The activities of individual companies and entire industries are fundamental drivers of climate change. In 2022, the industrial, commercial, and agricultural sectors accounted for 55.8 percent of US greenhouse gas emissions (measured as CO $ {\mathrm{}}_{2}$
equivalents and including electricity consumption). Residential emissions were only 15.3 percent. The remaining emissions, 28.5 percent of the US total, arise from transportation and are split among business, government, and the public.Footnote 6 A reasonable estimate is therefore that at least two-thirds of all US greenhouse gas emissions arise from the activities of private enterprises. And, of course, nearly all greenhouse gas emissions originate ultimately in the activity of business and industry, since residential and governmental use of electricity, oil, and gas relies on the electricity generation and fossil fuel industries.
$ {\mathrm{}}_{2}$
equivalents and including electricity consumption). Residential emissions were only 15.3 percent. The remaining emissions, 28.5 percent of the US total, arise from transportation and are split among business, government, and the public.Footnote 6 A reasonable estimate is therefore that at least two-thirds of all US greenhouse gas emissions arise from the activities of private enterprises. And, of course, nearly all greenhouse gas emissions originate ultimately in the activity of business and industry, since residential and governmental use of electricity, oil, and gas relies on the electricity generation and fossil fuel industries.
As a result, constructive action, policies, and political behavior by companies and industries will be essential to any successful effort to address climate change. Companies have responded to this responsibility through a variety of policies of varying impact. Some have made commitments to green production practices or products, while others have adopted emissions or efficiency targets, all forms of private governance or self-regulation.Footnote 7 They have backed these individual initiatives with time, money, and attention, as well as dedicated sustainability leadership and staff who define and implement their commitments.Footnote 8 In a collective but still private mode, corporations have worked together to develop shared standards and made commitments to disclose and reduce greenhouse gas emissions, including plans to zero out their carbon emissions.Footnote 9 Corporations also strongly shape public regulation through their political behavior, both individual (in notice and comment, campaign activities, and lobbying) and collective (memberships in climate and environmental organizations, and industry and business associations).Footnote 10 Their behavior also determines the impact of public regulation, since they might choose to comply, evade, or resist in response to regulatory action.
The literature offers three classes of explanations for corporate climate policies. First, it has been argued that corporations choose their climate actions based on economic interests. These interests center on the extent to which their profits are vulnerable to effective climate regulation or decarbonization (as with heavy polluters or firms that rely on polluters as suppliers or customers)Footnote 11 or whether their business can be strengthened by these policies (as in green tech industries).Footnote 12 Second, corporations may be subject to external pressure from societal forces pushing for climate action, such as environmental NGOs, the public, or other corporations and peer institutions.Footnote 13 Third, a significant part of the literature has examined forces within the corporation calling for change, including executives,Footnote 14 shareholders,Footnote 15 and employees and unions.Footnote 16 We fuse elements of each of these literatures by focusing on corporate boards of directors.
Corporate boards and corporate climate policies
Boards of directors, also called corporate boards, are groups of usually five to twelve leaders at corporations that shape overall strategy, with particular emphasis on executive hiring, governance, finance and acquisitions, and public affairs. Boards are charged with big-picture thinking and addressing long-term challenges. They are sites where primarily the economic interests of the corporation, but also social and political stances and activities, are formulated and debated.
Boards typically consist of “inside” or managing directors, drawn from the corporation’s executive ranks, and “outside” or supervisory directors, who are usually experienced corporate leaders, former public officials, entrepreneurs, lawyers, or other professionals. Boards are elected by shareholders, and their composition is strongly shaped by nominations from top executives and existing board members.Footnote 17 Board members hold regular and ad hoc meetings, which may include quarterly or monthly meetings of the entire board, special committee meetings, and corporate functions or retreats. Board members also communicate bilaterally or in small groups intensively. These board communications are important opportunities for persuasion and socialization, as well as gathering information and learning.
Company charters, board norms and traditions, and leadership styles all influence the board’s decision-making procedures. In larger companies, boards often create functionally differentiated committees that focus on particular issues like auditing, compensation, corporate strategy, or public and governmental affairs. In core areas of board policymaking, these committees may make proposals for the entire board’s approval. The board also votes on proposals from the executive leadership. Thus, board members may leverage their supervisory or proposal powers to set the corporate policy agenda, or they can be reactive, primarily acting as final approvers or veto players. Board voting is generally by majority rule.
Corporate boards of directors have been key sites—possibly the most important site—for recent debates about corporations’ environmental, social, and governance (ESG) activities, particularly around climate change. Climate change implicates core business operations (production processes, electricity consumption, transportation) for nearly all firms but also raises questions of corporate governance and governmental and public relations. Climate change also requires long-term strategic thinking. These are the classic domains of board influence, and, naturally, management, shareholders, and employees have asked boards to weigh in on these matters. NGOs, business media, and academics have also encouraged board involvement on climate issues. Opposition to board candidates motivated by environmental concerns has grown, and in a few dramatic cases, directors have lost their seats over climate change policies.Footnote 18 Many boards have responded to these concerns by undertaking various forms of engagement. Some have established committees on sustainability and climate change. Others have integrated climate considerations into decisions over hiring and appointments, strategic guidance, corporate policy design and oversight, and governmental affairs.
The role of boards in ESG is controversial. Some have argued that ESG concerns go beyond the traditional remit of board powers, encouraging a narrow focus on profit and other traditional measures of business success. In this view, voluntary environmental governance risks diminishing corporate profits contrary to directors’ fiduciary duty to stockholders. As a result, the question of how corporate climate policies contribute to business success over the short- and long-run, and the use of various theories and metrics of corporate success, has become politically contested.
The impact of corporate boards on corporate social responsibility, ESG, or corporate climate policies has received attention in five strands of academic literature. A first strand examines the structural features of boards, for example, the impact of size and decision-making procedures on ESG performance.Footnote 19 A second strand focuses on boards’ autonomy from management, particularly the extent to which board seats are held by corporate executives or outsiders.Footnote 20 A third literature considers board members’ demographic characteristics, including diversity in gender, age, background, and personality.Footnote 21 A fourth literature investigates the interactions and mutual influences of board members across different companies, particularly “interlocking” directors that appear on multiple boards.Footnote 22 A final literature, which is closest to our own contribution, examines the role of board member partisanship on ESG.Footnote 23 We find no literature that examines the personal environmental attitudes of board members and their impact on corporate environmental policies.
These debates, active among both academics and practitioners, raise critical questions about corporate boards and climate governance. First, how prevalent are green corporate directors in the United States? While it seems clear that some board members are strongly pro-climate, a clear conceptualization and measurement of this basic idea is not yet available. Describing variation in boards’ greenness over time, as well as across firms and industries, would be particularly valuable. Second, are board members pressing their corporations to shape policies in ways consistent with their personal green political beliefs, or are board members checking their beliefs at the door, in line with strict theories of fiduciary duty? Finally, if corporate boards do have green members who are seeking to shape corporate climate activity, is their influence visible in the policies and political actions of the corporations they supervise? If so, then green board members may represent critical players in fights over decarbonization and climate change mitigation.
Green directors
Corporate directors are economic and social elites who are likely to have at least some strongly held opinions on the political role of the corporation in public life. These might be ideological positions, interests in particular issue areas, or even a commitment to apolitical behavior. In particular, we think it probable that corporate board members have views on climate change. Some board members may be highly interested or even specialists on the issue. In part, this is because climate change is among the most pressing challenges facing the United States and corporate America. Discussion of climate change is common in American society, particularly among elites. Movements for and against ESG have also been a particular interest of the corporate class over the past decade or more, making discussion of climate change all but unavoidable in business settings. Corporations, governments, universities, and other institutions with which board members tend to have experience also face significant exposure to climate change and climate policy, making it likely that board members have considered views on the matter.
Given board members’ enormous power in setting the strategic agenda of American firms, it would be valuable to ascertain how many board members hold pro-environment or pro-climate action views. However, identifying the political views of board members is not easy, especially for a specific issue like the environment and environmentalism. To make progress on this, we need public indicia of board members’ political views. Contributions to political campaigns supply a potential proxy for these views with several desirable properties. Most importantly, campaign contributions to federally registered campaigns are publicly reported, so we can observe this form of board members’ political behavior directly. Fortunately, campaign contributions are not so public as to disinhibit them as a form of political engagement, at least for most people. Indeed, 39.3 percent of the approximately 88,500 board members in our data gave at least one direct campaign contribution to a candidate for federal office between 1990 and 2023, a vastly higher rate than the public as a whole. Campaign contributions are also literally and figuratively costly signals of preference, since they have obvious monetary costs and because subsidizing candidates would only make sense if those candidates hold sufficiently aligned political views.
Accordingly, we measure board members’ green attitudes using their contributions to pro-environment political candidates. To do so, we first determine which candidates are “green” by examining the support they received from environmental groups. We count a candidate as green if at least half of the environmental groups’ contributions were in support of their campaign or their candidate political action committee (PAC). Analogously, we classify candidates as anti-environment, or “grey,” if environmental groups primarily spent against their campaigns.Footnote 24 Candidates may be neither green nor grey if environmental groups did not contribute for or against their candidacies.
Our approach to classifying “green” and “grey” candidates is precise and holds strong criterion validity. Among incumbent candidates, green politicians receive far higher scores from the League of Conservation Voters than grey politicians (Figure 1). By classifying candidates according to environmental group support and opposition, we capture a latent attitude distinct from party affiliation (Figure A1) and ideological liberalism (Figure A2). For example, while green candidates tend to be Democrats, most Democratic candidates between 1990 and 2022 did not receive support from environmental groups. Similarly, more than 90 percent of Grey candidates are Republican, but more Republicans are classified as green than grey in our panel.Footnote 25
Density of year-specific League of Conservation Voters scores for Members of Congress from 1990 to 2023 (N = 18,098), by Green and Grey politician classifications. See Appendix A for more information on Green and Grey politician classifications.

We note that although we expect environmental groups to be sincere in their support for or opposition to a candidate, they may opt to ignore certain candidates according to their organizational resources and the broader electoral context. For example, environmental groups might believe spending in support of their preferred candidates is more effective than purchasing communications attacking undesirable candidates. Such bias would lead our measure to be relatively conservative, as directors’ contributions to genuinely pro- or anti-environmental candidates would be misclassified as neither green nor grey.Footnote 26
We deduce the views of corporate directors on the environment by calculating the proportion of their publicly reported individual campaign contributions directed to green candidates.Footnote 27 We apply two classification thresholds: one that is more expansive and another that is more restrictive. The more expansive threshold classifies a director as “Light Green” if they give 50 percent or more of their direct political contributions to green candidates (40 percent of all contributing director-years). The more restrictive threshold creates a subset of “Dark Green” directors, defined as those who allocate 100 percent of direct political contributions to green candidates (27 percent of all contributing director-years). Note that this measure can change over time, as a director’s green contributions might exceed the 50 or 100 percent threshold in one campaign and fall below it in another.
We illustrate the prevalence of green directors across firms in Figure 2. The population in the figure is publicly traded American firms for each year from 1990 to 2023 (the unit of analysis is the firm-year). The stacked bar graph on the left-hand side shows the distribution of the number of Light Green directors across firm-years. The modal firm-year has zero Light Green directors, but a majority of firm-years have at least one Light Green director in any given year. It is fairly common for firms to have multiple Light Green directors (in 41 percent of observations, 27 percent for Dark Green directors) though having five or more Light Green directors is rare, occurring in only 5 percent of cases (1 percent for Dark Green directors).
Prevalence of green directors at publicly traded firms, 1990–2023 (N = 124,178 firm-years). Left panel shows the distribution of firm-years by # Light Green directors $ {\mathrm{}}_{i,t}$
. Top-right panel shows the average # Light Green directors
$ {\mathrm{}}_{i,t}$
. Top-right panel shows the average # Light Green directors $ {\mathrm{}}_{i,t}$
and # Dark Green directors
$ {\mathrm{}}_{i,t}$
and # Dark Green directors $ {\mathrm{}}_{i,t}$
per firm by year.
$ {\mathrm{}}_{i,t}$
per firm by year.

The right-hand side of Figure 2 illustrates the change in the number of green directors over time. Using a count of green directors, we see an increase in the number of green directors from 1990 to 2005 and then a relatively steady number of such directors thereafter. The average firm-year after 2005 has 1.77 Light Green directors, although there is substantial variation among firms. Similar trajectories can be seen for the count of Dark Green directors over time.
The presence of green directors also varies across industrial sectors. In examining the average number of Light Green directors by sector (Figure 3),Footnote 28 several interesting patterns emerge. First, variation across sectors is noticeable, but not extreme. Almost all sectors have firm averages of between 1.3 and 1.8 Light Green directors. Second, the number of green directors shows some potential correlation with the sector’s environmental footprint, although this linkage is not overwhelming. Unsurprisingly, the mining, oil, and gas industries have the fewest green directors. However, other industries that are significant polluters, like intermediate manufacturing or construction, have numbers of green directors close to the economy-wide average. Firms in the utilities sector, which includes electricity generation and distribution, have the highest number of green directors on average. Third, and notwithstanding the previous observation, there is still significant variation in the number of green directors among firms within industries.Footnote 29
Distribution of green directors by industry. Points represent average # Light Green directors $ {\mathrm{}}_{i,t}$
per firm by two-digit NAICS industry. Bars represent 95% confidence intervals.
$ {\mathrm{}}_{i,t}$
per firm by two-digit NAICS industry. Bars represent 95% confidence intervals.

Directors’ policy views and corporate green activities
We have established that a significant number of corporate directors engage in their private political activity in a manner that strongly suggests that they support environmentalism. Could these private political beliefs influence their behavior as board members, leading their corporations to adopt greener policies, particularly around climate change? Here, we discuss board members’ sources of power, as well as their motivation to see green policies enacted.
Corporate directors are generally highly experienced and highly compensated professionals at or near the top of their professional fields. They are used to accumulating and wielding power within corporations and other large and complex institutions. Many board members will not shy away from contention or from practicing internal politics.
Board members’ power within corporations rests on four foundations. First, board members hold “constitutional” powers owing to corporate charters or bylaws that grant them voting rights on key issues before the board. Board members also perform a legislative function, giving them proposal power for new initiatives. Second, board members are responsible for many of the most significant executive appointments within the corporation. These appointments may be made to select corporate executives holding particular stances, who are then supervised by the board and subject to termination if they do not follow the board’s wishes. Third, board members hold enormous social capital in the form of professional, political, and friendship networks that can be employed to influence actions within the corporation, including actions by other board members and executive leaders. Finally, board members have significant discursive power in defining the interests and identity of the corporation.
Board members who are concerned about environmental protection may use their power to catalyze corporate action to address climate change for a variety of reasons. Pro-environment board members may be more aware of climate change and its negative effects on the company, and the economy and society writ large. Because they are concerned about the issue, they have likely invested more time in understanding climate change’s trajectory and likely effects. If green board members are more knowledgeable about the business risks posed by climate change, they will be more likely to support corporate climate action. Similarly, they may also be more aware of the benefits to the corporation of green action. Green board members may also weigh environmental concerns more highly in their decision functions given their existing knowledge base and attitudes. So even if they share the same fact set as less green board members, they may view environmental considerations as more important or impactful on the corporation’s well-being.
While the above mechanism emphasizes green board members’ correct apprehension of the risks of climate change or benefits of climate action, it is also possible that green board members might succumb to motivated reasoning and unduly weigh the impact of climate change and climate policy on the corporation’s profitability. Driven by their pre-existing views and biases, they would then come to sincerely believe that corporate actions aligned with their green beliefs are best for the corporation. Even highly experienced business people can be vulnerable to this form of cognitive bias because motivated reasoning and confirmation bias are widespread human traits. In light of their fiduciary duty to the corporation and its shareholders, as well as their financial stake in the corporation via stock ownership or options, green directors may believe the corporation must undertake pro-climate actions of various sorts.
Green board members may also be influenced by the views of corporate green action prevalent in their social networks. For example, it is plausible that pro-environment board members are more likely to be professional or personal acquaintances with other pro-environment business elites. Among these cohorts, credible efforts on ESG could be viewed as socially normative—essentially a requirement for any serious corporation. Similarly, board members are often involved in business networking and social events. In those contexts, at least in some milieus, it could be surprising and embarrassing to admit that their firm is not pursuing meaningful ESG efforts. Green board members would seem to be especially susceptible to this view given the potential cognitive dissonance between their personal attitudes and their firm’s inaction. Thus, green board members might be induced to push for green corporate action due to social learning and pressure.
Finally, it is also possible that board members do not sincerely believe that green actions are in the interest of their corporation over the short or long term, yet they still might argue in favor of doing so. They might do so if proposed corporate climate policies are rationalizable as only moderately costly to the company, but with a relatively large social or public benefit. Some board members may also take a broader view of corporate social responsibility than others and so justify counter-profitable policies, a normative question that has seen lively debate over the past decade. Some green board members may simply view the stakes of effective climate change mitigation as too high to abjure green corporate climate policies. It is important to note that advocating a policy that reduces short- or long-term profitability can be a serious breach of fiduciary duty.Footnote 30
These arguments about green board members’ power and their sincere or strategic belief in green corporate action lead to our main hypothesis:
Hypothesis. Firms with greater numbers of green board members will be more likely to undertake corporate policies that support climate action and less likely to undertake actions opposing climate action.
Data and empirical strategy
We examine the relationship between the pro-environmental attitudes of corporate directors and the climate actions of the firms they lead. To do so, we develop two datasets. The first is a panel of publicly traded firms $ i$
across years
$ i$
across years $ t$
, which we use to analyze a variety of internal and external corporate climate actions at the firm-year level (
$ t$
, which we use to analyze a variety of internal and external corporate climate actions at the firm-year level ( $ i,t$
). The second is a cross-section of publicly traded firms
$ i,t$
). The second is a cross-section of publicly traded firms $ i$
, which we use to study emissions reduction commitments at the firm level (
$ i$
, which we use to study emissions reduction commitments at the firm level ( $ i$
). Descriptive statistics for all analysis variables are provided in Tables D1 and D2.
$ i$
). Descriptive statistics for all analysis variables are provided in Tables D1 and D2.
Data on firms
Our panel dataset is derived from the union of firms in the “BoardEx - North America” and Compustat-Capital IQ “Fundamentals Annual” firm-level datasets, provided by Wharton Research Data Services (WRDS).Footnote 31 We begin with the entire Compustat dataset from 1987 to 2023 and retain firms with known trading tickers and data on firm revenues (a core covariate). We use only firms located in the United States due to their coherence as a sample, as well as the existence of well-measured data on firm characteristics and climate policy outcomes unavailable for non-US firms.
We then employ a multistep process to link the Compustat firm data to the BoardEx data on corporate directors. First, we use high-quality links from the WRDS “BoardEx CRSP Compustat Link” crosswalk (links marked “preferred” and with a matching score of 3/10 or lower; lower scores are better matches). For unmatched firms, we then apply Markov network clustering of firm name variants from LinkedIn.org via the LinkOrgs R package.Footnote 32 Through this procedure, we match 89 percent of firms (9,027 of 10,237 firms) in the BoardEx dataset to their corresponding entry in the Compustat data. Due to lags used for other variables (described below), we use 7,471 of the matched BoardEx firms in our panel analysis.
Outcomes: corporate climate policies
We examine five types of corporate climate policies, all of which are decisions highly proximate to the board’s direct control.Footnote 33 The first two outcomes are internal decisions that develop key organizational infrastructure facilitating emissions reductions: the public reporting of its greenhouse gas emissions and the appointment of a chief sustainability officer (CSO). For the greenhouse gas reporting variable, CDP $ {\mathrm{}}_{i,t}$
, we measure whether a firm
$ {\mathrm{}}_{i,t}$
, we measure whether a firm $ i$
voluntarily reports its CO
$ i$
voluntarily reports its CO $ {\mathrm{}}_{2}$
and other greenhouse gas emissions to the CDP in year
$ {\mathrm{}}_{2}$
and other greenhouse gas emissions to the CDP in year $ t$
. Using the CDP Investor database, we measure CDP
$ t$
. Using the CDP Investor database, we measure CDP $ {\mathrm{}}_{i,t}$
as a binary variable between 2006 and 2019, the most recent year available to the authors. For the CSO variable, CSO
$ {\mathrm{}}_{i,t}$
as a binary variable between 2006 and 2019, the most recent year available to the authors. For the CSO variable, CSO $ {\mathrm{}}_{i,t}$
, we examine senior corporate leadership, via the “BoardEx - North America: Composition of Officers, Directors, and Senior Managers” database, to determine whether the board of directors of firm
$ {\mathrm{}}_{i,t}$
, we examine senior corporate leadership, via the “BoardEx - North America: Composition of Officers, Directors, and Senior Managers” database, to determine whether the board of directors of firm $ i$
established a CSO or equivalent climate and environment-focused position at the executive level in year
$ i$
established a CSO or equivalent climate and environment-focused position at the executive level in year $ t$
. We measure CSO
$ t$
. We measure CSO $ {\mathrm{}}_{i,t}$
as a binary variable from 2004, the year DuPont created the first executive-level CSO position at a publicly traded company, to 2022.Footnote 34 We expect both CSO
$ {\mathrm{}}_{i,t}$
as a binary variable from 2004, the year DuPont created the first executive-level CSO position at a publicly traded company, to 2022.Footnote 34 We expect both CSO $ {\mathrm{}}_{i,t}$
and CDP
$ {\mathrm{}}_{i,t}$
and CDP $ {\mathrm{}}_{i,t}$
to be positively associated with the number of green directors on a firm’s board.
$ {\mathrm{}}_{i,t}$
to be positively associated with the number of green directors on a firm’s board.
The third and fourth types of corporate climate policies relate to how firms participate in climate change-related public coalitions. A common way firms engage in external climate change politics is by joining an ad hoc coalition of like-minded corporations (and sometimes other organizations, such as trade associations, unions, and NGOs) in favor of or against action to mitigate climate change.Footnote 35 The variable Pro-climate coalition $ {\mathrm{}}_{i,t}$
equals 1 if firm
$ {\mathrm{}}_{i,t}$
equals 1 if firm $ i$
is a member of any pro-climate action coalition in year
$ i$
is a member of any pro-climate action coalition in year $ t$
, and 0 otherwise. The variable Anti-climate coalition
$ t$
, and 0 otherwise. The variable Anti-climate coalition $ {\mathrm{}}_{i,t}$
equals 1 if firm
$ {\mathrm{}}_{i,t}$
equals 1 if firm $ i$
is a member of any coalition opposed to climate action in year
$ i$
is a member of any coalition opposed to climate action in year $ t$
. Both variables are measured from 1995 to 2019 using data gathered in Cory et al. (Reference Cory, Lerner and Osgood2021).Footnote 36 As the number of green directors on a firm’s board increases, we expect the probability of joining a pro-climate coalition to increase and the probability of joining an anti-climate coalition to decrease.
$ t$
. Both variables are measured from 1995 to 2019 using data gathered in Cory et al. (Reference Cory, Lerner and Osgood2021).Footnote 36 As the number of green directors on a firm’s board increases, we expect the probability of joining a pro-climate coalition to increase and the probability of joining an anti-climate coalition to decrease.
We measure the fifth and final type of corporate climate policy as a cross-section: public commitments to reduce or eliminate a firm’s greenhouse gas emissions. Using data from the Net Zero Tracker,Footnote 37 we construct the following outcomes reflecting different aspects of these commitments:
-
1. Defined target $ {\mathrm{}}_{i}$
$ \left(\right\{\mathrm{0,1}\left\}\right)$
: whether a firm has a defined target level of greenhouse gas emissions of any kind;Footnote 38
$ {\mathrm{}}_{i}$
$ \left(\right\{\mathrm{0,1}\left\}\right)$
: whether a firm has a defined target level of greenhouse gas emissions of any kind;Footnote 38 -
2. Net-zero
$ {\mathrm{}}_{i}$
$ \left(\right\{\mathrm{0,1}\left\}\right)$
: whether a firm has committed to a target of net-zero (or net-negative) emissions;Footnote 39 -
3. Commitment-level
$ {\mathrm{}}_{i}$
$ \left(\right\{\mathrm{0,1},\mathrm{2,3},4\left\}\right)$
: the ambition of a firm’s emissions reduction commitment;Footnote 40 -
4. Race to Zero
$ {\mathrm{}}_{i}$
$ \left(\right\{\mathrm{0,1}\left\}\right)$
: whether a firm has joined the United Nations Race to Zero initiative; -
5. Scope 3
$ {\mathrm{}}_{i}$
$ \left(\right\{\mathrm{0,1},2,\left\}\right)$
: the extent to which a firm’s emissions reduction commitment encompasses Scope 3 emissions;Footnote 41 -
6. Target year
$ {\mathrm{}}_{i}$
: among firms with an emissions reduction commitment (Commitment-level
$ {\mathrm{}}_{i}\ne 0$
), the year by which a firm intends to attain their emissions target.


These variables are a cross-sectional sample of the 535 largest publicly listed firms in the United States.Footnote 42 It includes both firms that have and have not made an emissions reduction commitment. We expect all of the cross-sectional outcomes to be positively associated with the number of green directors on a firm’s board except Target year $ {\mathrm{}}_{i}$
, for which we expect a negative association. For ease of interpretation, we center and scale Target year
$ {\mathrm{}}_{i}$
, for which we expect a negative association. For ease of interpretation, we center and scale Target year $ {\mathrm{}}_{i}$
from zero to one.
$ {\mathrm{}}_{i}$
from zero to one.
We caution that none of these outcomes, on their own, are a perfectly reliable signal of a pro-climate corporate orientation.Footnote 43 It is also entirely possible for firms to hedge, or simultaneously adopt pro-climate and anti-climate corporate policies.Footnote 44 Even so, each policy is an example of what a corporation would do if it were to sincerely and meaningfully promote climate mitigation. Moreover, these pro-climate policies can accumulate and raise the cost of reneging on commitments. These costs could be direct, such as the increased risk of attracting climate litigation.Footnote 45 The indirect costs may be even larger, however. For example, the existence of an executive-level CSO provides a coordinating device for constituencies within the firm to mobilize in favor of climate action. Similar dynamics may take place externally, as corporate pro-climate policies may lead governments to adopt ambitious public decarbonization policies.Footnote 46
Explanatory variable: Green directors. As described above, we measure our primary explanatory variable in two ways. The more expansive # Light Green directors $ {\mathrm{}}_{i,t}$
is the count of Executive and Supervisory Directors of firm
$ {\mathrm{}}_{i,t}$
is the count of Executive and Supervisory Directors of firm $ i$
in year
$ i$
in year $ t$
who allocate 50 percent or more of their direct political contributions to supporting the electoral campaigns of green political candidates. The more restrictive # Dark Green directors
$ t$
who allocate 50 percent or more of their direct political contributions to supporting the electoral campaigns of green political candidates. The more restrictive # Dark Green directors $ {\mathrm{}}_{i,t}$
requires 100 percent direct political giving to be allocated to green political candidates.
$ {\mathrm{}}_{i,t}$
requires 100 percent direct political giving to be allocated to green political candidates.
Our analysis measures green directors as a count: # Light Green directors $ {\mathrm{}}_{i,t}$
and # Dark Green directors
$ {\mathrm{}}_{i,t}$
and # Dark Green directors $ {\mathrm{}}_{i,t}$
. This is a conservative choice because directors who give no political contributions are counted as non-green by default. Moreover, many electoral races do not feature a green candidate to whom directors can make contributions. If, as we expect, pro-environment directors have a positive effect on corporate climate policy, then undercounting their prevalence should make it harder to detect an effect.Footnote 47
$ {\mathrm{}}_{i,t}$
. This is a conservative choice because directors who give no political contributions are counted as non-green by default. Moreover, many electoral races do not feature a green candidate to whom directors can make contributions. If, as we expect, pro-environment directors have a positive effect on corporate climate policy, then undercounting their prevalence should make it harder to detect an effect.Footnote 47
Comparing the two measures, # Light Green directors $ {\mathrm{}}_{i,t}$
offers better recall at the expense of precision, as it includes directors who give a minority of their contributions to non-green candidates. However, it potentially misclassifies directors who hold political attitudes correlated with climate attitudes but unrelated to corporate climate policy (e.g., attitudes on LGBTQ+ rights), resulting in estimates biased toward a null effect. In contrast, # Dark Green directors
$ {\mathrm{}}_{i,t}$
offers better recall at the expense of precision, as it includes directors who give a minority of their contributions to non-green candidates. However, it potentially misclassifies directors who hold political attitudes correlated with climate attitudes but unrelated to corporate climate policy (e.g., attitudes on LGBTQ+ rights), resulting in estimates biased toward a null effect. In contrast, # Dark Green directors $ {\mathrm{}}_{i,t}$
measure provides a more precise classification of directors with green attitudes but relatively worse recall, ruling out pro-environment directors who give any money at all to a non-green politician. If these overlooked directors support pro-climate corporate policies, the Dark Green measure risks biasing estimates toward a null effect. Since neither approach is definitively more conservative than the other, we conduct our analyses using both in parallel.
$ {\mathrm{}}_{i,t}$
measure provides a more precise classification of directors with green attitudes but relatively worse recall, ruling out pro-environment directors who give any money at all to a non-green politician. If these overlooked directors support pro-climate corporate policies, the Dark Green measure risks biasing estimates toward a null effect. Since neither approach is definitively more conservative than the other, we conduct our analyses using both in parallel.
To construct # Light Green directors $ {\mathrm{}}_{i,t}$
and # Dark Green directors
$ {\mathrm{}}_{i,t}$
and # Dark Green directors $ {\mathrm{}}_{i,t}$
, we use a combination of algorithmic matching and manual inspection to link directors to direct election contributions reported to the Federal Election Commission for each electoral cycle between 1990 and 2022 (for more details, see Appendix B). Through this procedure, we identify at least one direct political contribution from 39 percent (34,800 of 88,508) of the directors in the BoardEx dataset. We then designate each director as Light (Dark) Green if at least 50 percent (100 percent) of their aggregate direct contributions in a given two-year political cycle went to green political candidates. Since we believe directors’ political beliefs are typically slow-moving, we interpolate missing and off-election years using the last observation carried forward and, if needed, backward extrapolation using the oldest available observation. Finally, we count the number of green directors at each firm. To mitigate the risk of selection bias, we lag the count of green directors by two years (one electoral cycle) and count only directors who continued to serve on the board from the previous year (85 percent of director-firm-years).
$ {\mathrm{}}_{i,t}$
, we use a combination of algorithmic matching and manual inspection to link directors to direct election contributions reported to the Federal Election Commission for each electoral cycle between 1990 and 2022 (for more details, see Appendix B). Through this procedure, we identify at least one direct political contribution from 39 percent (34,800 of 88,508) of the directors in the BoardEx dataset. We then designate each director as Light (Dark) Green if at least 50 percent (100 percent) of their aggregate direct contributions in a given two-year political cycle went to green political candidates. Since we believe directors’ political beliefs are typically slow-moving, we interpolate missing and off-election years using the last observation carried forward and, if needed, backward extrapolation using the oldest available observation. Finally, we count the number of green directors at each firm. To mitigate the risk of selection bias, we lag the count of green directors by two years (one electoral cycle) and count only directors who continued to serve on the board from the previous year (85 percent of director-firm-years).
Control variables
We include a range of additional variables that could plausibly confound the relationship between green directors and corporate climate policies.
First, we control for the other political attitudes of board members. We measure # Light Grey directors $ {\mathrm{}}_{i,t}$
as the count of directors whose direct political contributions were primarily allocated to candidates opposed by environmental groups. This allows us to account for the relative balance of pro- and anti-environmental attitudes on a firm’s board. We also account for the partisan orientations of directors without strong environmental attitudes via the number of directors who gave predominantly to non-green and non-grey Democratic candidates (# Non-Light Green/Grey Dem. directors) and to non-green and non-grey Republican candidates (# Non-Light Green/Grey Rep. directors). As with green directors, these measures count only directors who served on a firm’s board in the previous year and lag contributions by two years (one electoral cycle). In light of increasing party polarization on climate and ESG issues over the past several decades,Footnote 48 the partisan controls appear highly relevant to corporate climate policymaking.Footnote 49
$ {\mathrm{}}_{i,t}$
as the count of directors whose direct political contributions were primarily allocated to candidates opposed by environmental groups. This allows us to account for the relative balance of pro- and anti-environmental attitudes on a firm’s board. We also account for the partisan orientations of directors without strong environmental attitudes via the number of directors who gave predominantly to non-green and non-grey Democratic candidates (# Non-Light Green/Grey Dem. directors) and to non-green and non-grey Republican candidates (# Non-Light Green/Grey Rep. directors). As with green directors, these measures count only directors who served on a firm’s board in the previous year and lag contributions by two years (one electoral cycle). In light of increasing party polarization on climate and ESG issues over the past several decades,Footnote 48 the partisan controls appear highly relevant to corporate climate policymaking.Footnote 49
Second, we control for changing firm characteristics. Using data from Compustat, we measure firm size using annual firm revenues (Revenue $ {\mathrm{}}_{i,t}$
) and total number of employees (Employees
$ {\mathrm{}}_{i,t}$
) and total number of employees (Employees $ {\mathrm{}}_{i,t}$
). We account for climate “hedging”Footnote 50 by indicating whether, for all pro-climate outcomes, a firm was a member of a public coalition opposed to climate action in the previous year (Anti-climate coalition
$ {\mathrm{}}_{i,t}$
). We account for climate “hedging”Footnote 50 by indicating whether, for all pro-climate outcomes, a firm was a member of a public coalition opposed to climate action in the previous year (Anti-climate coalition $ {\mathrm{}}_{i,t-1}$
).Footnote 51 We also incorporate the corporate climate policies of peer firms as per Lerner and Osgood (Reference Lerner and Osgood2022), calculating Interlock wtd. outcome
$ {\mathrm{}}_{i,t-1}$
).Footnote 51 We also incorporate the corporate climate policies of peer firms as per Lerner and Osgood (Reference Lerner and Osgood2022), calculating Interlock wtd. outcome $ {\mathrm{}}_{i,t}$
as the propensity of firms
$ {\mathrm{}}_{i,t}$
as the propensity of firms $ j\in J$
to adopt the outcome variable under consideration in year
$ j\in J$
to adopt the outcome variable under consideration in year $ t-1$
weighted by the number of director interlocks between firms
$ t-1$
weighted by the number of director interlocks between firms $ i$
and
$ i$
and $ j$
. Additionally, we calculate the total number of interlocks firm
$ j$
. Additionally, we calculate the total number of interlocks firm $ i$
shares with all other firms
$ i$
shares with all other firms $ j\in J$
(Num. interlocks
$ j\in J$
(Num. interlocks $ {\mathrm{}}_{i,t}$
).
$ {\mathrm{}}_{i,t}$
).
In some models, we include three further variables relating to firm characteristics that have more limited coverage. The first, Env. risk disclosure $ {\mathrm{}}_{i,t}$
, represents directors’ perceptions of a firm’s environment-specific political risk. As measured by Hassan et al. (Reference Hassan, Hollander, Van Lent and Tahoun2019), Env. risk disclosure
$ {\mathrm{}}_{i,t}$
, represents directors’ perceptions of a firm’s environment-specific political risk. As measured by Hassan et al. (Reference Hassan, Hollander, Van Lent and Tahoun2019), Env. risk disclosure $ {\mathrm{}}_{i,t}$
is the average share of quarterly earnings calls firm
$ {\mathrm{}}_{i,t}$
is the average share of quarterly earnings calls firm $ i$
devotes in year
$ i$
devotes in year $ t$
to discussing political risk relating to environmental topics. This measure is available from 2002 to 2022. The second variable, Worker climate attitudes
$ t$
to discussing political risk relating to environmental topics. This measure is available from 2002 to 2022. The second variable, Worker climate attitudes $ {\mathrm{}}_{i,t}$
, captures the pro-climate attitude of a firm’s employees. As measured by Cory et al. (Reference Cory, Lerner and Osgood2021), Worker climate attitudes
$ {\mathrm{}}_{i,t}$
, captures the pro-climate attitude of a firm’s employees. As measured by Cory et al. (Reference Cory, Lerner and Osgood2021), Worker climate attitudes $ {\mathrm{}}_{i,t}$
is the predicted average score from the Climate Change Policy Index for a given firm’s primary three-digit North American Industrial Classification System (NAICS) code (derived from Compustat data) at the state-year level. This measure is available from 2008 to 2022. The third and final variable is Sector CO
$ {\mathrm{}}_{i,t}$
is the predicted average score from the Climate Change Policy Index for a given firm’s primary three-digit North American Industrial Classification System (NAICS) code (derived from Compustat data) at the state-year level. This measure is available from 2008 to 2022. The third and final variable is Sector CO $ {}_{2}$
intensity
$ {}_{2}$
intensity $ {\mathrm{}}_{i}$
, which measures the cost exposure to climate policy in terms of a firm
$ {\mathrm{}}_{i}$
, which measures the cost exposure to climate policy in terms of a firm $ i$
’s greenhouse gas emissions intensity at the industry level. This is a cross-sectional measure derived from data published by the US Economics and Statistics AdministrationFootnote 52 and, since it does not vary over time, it is absorbed by fixed effects for firm and industry-year.
$ i$
’s greenhouse gas emissions intensity at the industry level. This is a cross-sectional measure derived from data published by the US Economics and Statistics AdministrationFootnote 52 and, since it does not vary over time, it is absorbed by fixed effects for firm and industry-year.
We transform Revenue $ {\mathrm{}}_{i,t}$
, Employees
$ {\mathrm{}}_{i,t}$
, Employees $ {\mathrm{}}_{i,t}$
, Interlock wtd. outcome
$ {\mathrm{}}_{i,t}$
, Interlock wtd. outcome $ {\mathrm{}}_{i,t}$
, Num. interlocks
$ {\mathrm{}}_{i,t}$
, Num. interlocks $ {\mathrm{}}_{i,t}$
, and Sector CO
$ {\mathrm{}}_{i,t}$
, and Sector CO $ {}_{2}$
intensity
$ {}_{2}$
intensity $ {\mathrm{}}_{i}$
using an inverse hyperbolic sine transformation to adjust for the right-skew of these variables. We also adjust Env. risk disclosure
$ {\mathrm{}}_{i}$
using an inverse hyperbolic sine transformation to adjust for the right-skew of these variables. We also adjust Env. risk disclosure $ {\mathrm{}}_{i,t}$
by applying an inverse hyperbolic sine transformation and scaling from zero to one.
$ {\mathrm{}}_{i,t}$
by applying an inverse hyperbolic sine transformation and scaling from zero to one.
Finally, we control for many unobserved features of industries and firms using fixed effects in our panel models. We employ industry-year fixed effects to capture changing industry trends over time, such as secular increases in market, regulatory, and social pressure for pro-climate corporate behavior. Note that the industry-year fixed effects effectively act as both year fixed effects and industry fixed effects, too. Using $ s$
to denote a firm’s primary three-digit NAICS code, we refer to fixed effects by industry-year as
$ s$
to denote a firm’s primary three-digit NAICS code, we refer to fixed effects by industry-year as $ {\mu }_{s,t}$
and fixed effects by firm as
$ {\mu }_{s,t}$
and fixed effects by firm as $ {\mu }_{i}$
. In our cross-sectional models, we use industry fixed effects
$ {\mu }_{i}$
. In our cross-sectional models, we use industry fixed effects $ {\mu }_{s}$
.
$ {\mu }_{s}$
.
Empirical strategy
We seek to identify robust empirical associations between the presence of green directors and subsequent corporate climate policies and political activity. These associations can be directly interpreted as conditional correlations for which we have partialed out obvious confounding factors that might generate a positive association between green directors and corporate climate policies, including an array of measured covariates and high-dimensional fixed effects. We probe the robustness of these correlations in various ways described below. Lacking a systematic exogenous source of variation in corporate board membership, a causal interpretation of our estimates is not warranted. Robustly positive conditional associations would be consistent with the causal processes we describe in our theoretical section, but we cannot fully rule out unmeasured confounding factors. We therefore employ sensitivity testing below to gauge the vulnerability of our core findings to such unmeasured factors.
An additional concern in our empirical testing is reciprocal causation: perhaps green-oriented firms tend to hire green board members, thereby driving an empirical association between corporate climate policies and green board members. As an empirical matter, we reduce the impact of any such relationship by lagging our explanatory variable—the count of green board members—by one year. We also examine robustness checks with lagged dependent variables that partial out prior policies. Our measurement of board members’ green attitudes also likely mitigates this issue, since detailed patterns of prospective board members’ campaign contributions to members of Congress (as a function of those members’ environmental voting records) are unlikely to be legible to nominating committees or shareholders. As a theoretical matter, board members are likely to be selected for a wide variety of appealing attributes. The impact of board members on corporate environmental policies is plausibly much larger than any impact of a corporation’s green orientation on the selection of green board members because corporations must consider so many other desiderata in selecting boards. Board members present a bundle of many important attributes, whereas corporate green policies are a single issue area.
All of our outcomes are either dichotomous or ordered factors (except Target year $ {\mathrm{}}_{i}$
), which typically suggests the use of generalized linear models with nonlinear link functions (e.g., logit or ordered logit models). However, our research design relies critically on high-dimensional fixed effects, which induce bias in nonlinear models.Footnote 53 Accordingly, the models we present here are all linear regression models.
$ {\mathrm{}}_{i}$
), which typically suggests the use of generalized linear models with nonlinear link functions (e.g., logit or ordered logit models). However, our research design relies critically on high-dimensional fixed effects, which induce bias in nonlinear models.Footnote 53 Accordingly, the models we present here are all linear regression models.
Panel models
In our panel analysis, our most stringent model specification is the following, which has been written as if the dependent variable is CDP $ {\mathrm{}}_{i,t}$
and the explanatory variable is # Light Green directors
$ {\mathrm{}}_{i,t}$
and the explanatory variable is # Light Green directors $ {\mathrm{}}_{i,t}$
:
$ {\mathrm{}}_{i,t}$
:
 $$\eqalign{ & {\rm{CD}}{{\rm{P}}_{it}} = {\beta _0} + {\beta _1} \cdot \# {\rm{Light}}\;{\rm{Green}}\;{\rm{director}}{{\rm{s}}_{i,t}} + {\beta _2} \cdot \# {\rm{Light}}\;{\rm{Grey}}\;{\rm{director}}{{\rm{s}}_{i,t}} + {\beta _3} \cr & \quad \cdot \# {\rm{Non - ightGreen}}/{\rm{GreyDem}}.{\rm{director}}{{\rm{s}}_{i,t}} + {\beta _4} \cdot \# {\rm{Non - Light}}\;{\rm{Green}}/{\rm{GreyRep}}.{\rm{director}}{{\rm{s}}_{i,t}} + {\beta _5} \cr & \quad \cdot {\rm{Anti - climate}}\;{\rm{coalitio}}{{\rm{n}}_{i,t - 1}} + {\beta _6} \cdot {\rm{Employee}}{{\rm{s}}_{i,t}} + {\beta _7} \cdot {\rm{Revenu}}{{\rm{e}}_{i,t}} + {\beta _8} \cdot {\rm{Num}}.{\rm{interlock}}{{\rm{s}}_{i,t}} + {\beta _9} \cr
& \quad \cdot {\rm{Interlock}}\;{\rm{wtd}}.{\rm{CD}}{{\rm{P}}_{i,t}} + {\mu _{s,t}} + {\mu _i} + {\varepsilon _{i,t}} \cr} $$
$$\eqalign{ & {\rm{CD}}{{\rm{P}}_{it}} = {\beta _0} + {\beta _1} \cdot \# {\rm{Light}}\;{\rm{Green}}\;{\rm{director}}{{\rm{s}}_{i,t}} + {\beta _2} \cdot \# {\rm{Light}}\;{\rm{Grey}}\;{\rm{director}}{{\rm{s}}_{i,t}} + {\beta _3} \cr & \quad \cdot \# {\rm{Non - ightGreen}}/{\rm{GreyDem}}.{\rm{director}}{{\rm{s}}_{i,t}} + {\beta _4} \cdot \# {\rm{Non - Light}}\;{\rm{Green}}/{\rm{GreyRep}}.{\rm{director}}{{\rm{s}}_{i,t}} + {\beta _5} \cr & \quad \cdot {\rm{Anti - climate}}\;{\rm{coalitio}}{{\rm{n}}_{i,t - 1}} + {\beta _6} \cdot {\rm{Employee}}{{\rm{s}}_{i,t}} + {\beta _7} \cdot {\rm{Revenu}}{{\rm{e}}_{i,t}} + {\beta _8} \cdot {\rm{Num}}.{\rm{interlock}}{{\rm{s}}_{i,t}} + {\beta _9} \cr
& \quad \cdot {\rm{Interlock}}\;{\rm{wtd}}.{\rm{CD}}{{\rm{P}}_{i,t}} + {\mu _{s,t}} + {\mu _i} + {\varepsilon _{i,t}} \cr} $$
We calculate clustered standard errors at the firm level to account for correlated residuals across firm-years.
We run several variants of the above model in our analysis. First, we replace CDP $ {\mathrm{}}_{i,t}$
and Interlock wtd. CDP
$ {\mathrm{}}_{i,t}$
and Interlock wtd. CDP $ {\mathrm{}}_{i,t}$
with the relevant measures for each panel outcome. Second, we estimate models using both the {# Light Green directors
$ {\mathrm{}}_{i,t}$
with the relevant measures for each panel outcome. Second, we estimate models using both the {# Light Green directors $ {\mathrm{}}_{i,t}$
, # Light Grey directors
$ {\mathrm{}}_{i,t}$
, # Light Grey directors $ {\mathrm{}}_{i,t}$
, # Non-Light Green/Grey directors
$ {\mathrm{}}_{i,t}$
, # Non-Light Green/Grey directors $ {\mathrm{}}_{i,t}$
} and the {# Dark Green directors
$ {\mathrm{}}_{i,t}$
} and the {# Dark Green directors $ {\mathrm{}}_{i,t}$
, # Dark Grey directors
$ {\mathrm{}}_{i,t}$
, # Dark Grey directors $ {\mathrm{}}_{i,t}$
, # Non-Dark Green/Grey directors
$ {\mathrm{}}_{i,t}$
, # Non-Dark Green/Grey directors $ {\mathrm{}}_{i,t}$
} measures.
$ {\mathrm{}}_{i,t}$
} measures.
Cross-sectional models
In our cross-sectional analysis of emissions reduction commitments, our most stringent model specification is the following, which has been written as if the dependent variable is Defined target $ {\mathrm{}}_{i}$
:
$ {\mathrm{}}_{i}$
:
 $$\eqalign{ & {\rm{Defined}}\;{\rm{targe}}{{\rm{t}}_i} = {\beta _0} + {\beta _1} \cdot \# {\rm{Light}}\;{\rm{Green}}\;{\rm{director}}{{\rm{s}}_i} + {\beta _2} \cdot \# {\rm{Light}}\;{\rm{Grey}}\;{\rm{director}}{{\rm{s}}_i} + {\beta _3} \cr & \quad \quad \quad \quad \quad \quad \quad \quad \quad \cdot \# {\rm{Non - Light}}\;{\rm{Green}}/{\rm{GreyDem}}.{\rm{director}}{{\rm{s}}_i} + {\beta _4} \cr & \quad \quad \quad \quad \quad \quad \quad \quad \quad \cdot \# {\rm{Non - Light}}\;{\rm{Green}}\;{\rm{Grey}}\;{\rm{Rep}}.{\rm{director}}{{\rm{s}}_i} + {\beta _5} \cdot {\rm{Anti - climatecoalitio}}{{\rm{n}}_i} + {\beta _5} \cr & \quad \quad \quad \quad \quad \quad \quad \quad \quad \cdot {\rm{Employee}}{{\rm{s}}_i} + {\beta _6} \cdot {\rm{Revenu}}{{\rm{e}}_i} + {\beta _7} \cdot {\rm{Num}}.{\rm{interlock}}{{\rm{s}}_i} + {\beta _8} \cr & \quad \quad \quad \quad \quad \quad \quad \quad \quad \cdot {\rm{Interlockwtd}}.{\rm{Definedtarge}}{{\rm{t}}_i} + {\mu _s} + {\varepsilon _i} \cr} $$
The above model includes fixed effects by industry ( $ {\mu }_{s}$
). We calculate clustered standard errors at the two-digit NAICS industry level to account for correlated residuals within industry groups. The outcome variables for the cross-sectional models are as of 2024 and the controls are from 2022, the last year of our panel dataset.
$ {\mu }_{s}$
). We calculate clustered standard errors at the two-digit NAICS industry level to account for correlated residuals within industry groups. The outcome variables for the cross-sectional models are as of 2024 and the controls are from 2022, the last year of our panel dataset.
As with the panel analysis, we run several iterations of the model described above. First, we replace Defined target $ {\mathrm{}}_{i}$
and Interlock wtd. Defined target
$ {\mathrm{}}_{i}$
and Interlock wtd. Defined target $ {\mathrm{}}_{i}$
with the relevant measures for each panel outcome. Second, we estimate models using both the {# Light Green directors
$ {\mathrm{}}_{i}$
with the relevant measures for each panel outcome. Second, we estimate models using both the {# Light Green directors $ {\mathrm{}}_{i,t}$
, Light Grey directors
$ {\mathrm{}}_{i,t}$
, Light Grey directors $ {\mathrm{}}_{i,t}$
, # Non-Light Green/Grey directors
$ {\mathrm{}}_{i,t}$
, # Non-Light Green/Grey directors $ {\mathrm{}}_{i,t}$
} and the {# Dark Green directors
$ {\mathrm{}}_{i,t}$
} and the {# Dark Green directors $ {\mathrm{}}_{i,t}$
, # Dark Grey directors
$ {\mathrm{}}_{i,t}$
, # Dark Grey directors $ {\mathrm{}}_{i,t}$
, # Non-Dark Green/Grey directors
$ {\mathrm{}}_{i,t}$
, # Non-Dark Green/Grey directors $ {\mathrm{}}_{i,t}$
} measures.
$ {\mathrm{}}_{i,t}$
} measures.
Model presentation and interpretation
We focus on substantive predicted effects on outcomes of interest, not changes in linear predictors. We calculate percentage chance for our dichotomous outcomes, ranging from 0 to 100. An estimate of 1.00 in our main results for CDP $ {\mathrm{}}_{i,t}$
means that an increase in the number of green board directors from zero to one increases the percentage chance of a firm reporting to the CDP by 1 percent in absolute terms. For our ordinal and continuous variables, an estimate of 1.00 means an average increase of 1.00 on the relevant scale.
$ {\mathrm{}}_{i,t}$
means that an increase in the number of green board directors from zero to one increases the percentage chance of a firm reporting to the CDP by 1 percent in absolute terms. For our ordinal and continuous variables, an estimate of 1.00 means an average increase of 1.00 on the relevant scale.
Results
We discuss the results of our analysis by first presenting simple descriptive relationships before moving on to our main models, robustness checks, and several extensions of our core findings.
Unconditional descriptive findings
Figure 4 displays the variation in our panel and cross-sectional variables by the count of Light Green and Dark Green directors. Starting with our panel variables (top-left facet), we see that the percentage of firm-years reporting to the CDP rises from about 3 percent when there are no green directors to about 26 percent when there are five or more green directors on a corporate board. Similar trajectories can be seen for appointing an executive-level CSO, rising from 3 percent to about 20 percent of firm-years, and membership in a pro-climate coalition, growing from 1 percent to around 9 percent of firm-years. We see a null or weakly positive association between the number of green directors and membership in an anti-climate coalition (from less than 1 percent to a maximum of 2 percent). This is contrary to our expectations, and we investigate this relationship further in our complete models below.
Outcomes by # Light Green directors
$ {\mathrm{}}_{i,t}$
(light green) and # Dark Green directors
$ {\mathrm{}}_{i,t}$
(dark green). Ribbons show 95% confidence intervals.

Turning to the cross-sectional variables on corporate emission reduction commitments, we see that the percentage of firms with a defined emissions reduction target increases from around 60 percent when there are no green directors to around 85 percent when there are five or more green directors on the board. Similar trajectories can be seen for net-zero targets (from 40 percent to 60 percent) and Race to Zero membership (10 percent to 40 percent). We also see more ambitious emissions reduction commitments at firms led by green directors, rising from an average of less than 1.5/4 when there are no green directors to more than 2.1/4 when there are five or more directors. However, there is only a weak relationship between the specification of Scope 3 emissions (from an average of 0.65/2 to about 0.8/2) and the end target year (from an average of 2038 to 2039).
Overall, we observe two clear patterns. First, firms are more likely to adopt pro-climate corporate policies as the number of green directors increases. These increases are especially notable for the outcomes CDP $ {\mathrm{}}_{i,t}$
, CSO
$ {\mathrm{}}_{i,t}$
, CSO $ {\mathrm{}}_{i,t}$
, and Pro-climate coalition
$ {\mathrm{}}_{i,t}$
, and Pro-climate coalition $ {\mathrm{}}_{i,t}$
, with risk ratios of 12, 7, and 10, respectively. Second, the cross-sectional outcomes have positive relationships with the number of green directors, but typically at shallower slopes and with greater variation than the panel outcomes. This may reflect, in part, the small size of the cross-sectional dataset (N = 535 firms) relative to the panel dataset (N = 99,117 firm-years).
$ {\mathrm{}}_{i,t}$
, with risk ratios of 12, 7, and 10, respectively. Second, the cross-sectional outcomes have positive relationships with the number of green directors, but typically at shallower slopes and with greater variation than the panel outcomes. This may reflect, in part, the small size of the cross-sectional dataset (N = 535 firms) relative to the panel dataset (N = 99,117 firm-years).
Of course, these findings may relate to confounders, such as firm size and secular industry and temporal trends. In the next set of results, we control for these factors.
Main results
We present the results of our panel analysis visually, plotting regression coefficients and predicted outcomes in Figure 5.Footnote 54 For expositional purposes, we focus our discussion on the results and predicted values for the # Dark Green directors $ {\mathrm{}}_{i,t}$
measure.
$ {\mathrm{}}_{i,t}$
measure.
Estimates and predicted outcomes for the panel analysis. Dots are coefficient estimates, rectangles are average predicted values, thick bars are 90% confidence intervals, and thin bars are 95% confidence intervals. Outcomes are measured as predicted percentage change of enacting the relevant climate policy. Bottom plot compares predicted outcomes increasing green directors from the 10th percentile to the 90th percentile for # Light Green directors
$ {\mathrm{}}_{i,t}$
(L, light green) and for # Dark Green directors
$ {\mathrm{}}_{i,t}$
(D, dark green).

We find that firms led by green directors are more likely to report their greenhouse gas emissions to the CDP. Increasing the number of Dark Green directors on a board from the 10th percentile to the 90th percentile changes the predicted chance of reporting to the CDP by 1.18 percent. As shown in the left-most bars of Figure 5b, this represents an increase from 7.26 percent to 8.44 percent for a typical firm in the chances of reporting to the CDP. This increase is relatively large, substantively meaningful, and consistent with our expectations.Footnote 55
Firms led by green directors are also substantially more likely to appoint an executive-level CSO. The predicted effect of increasing the number of Dark Green directors from the 10th to 90th percentile is 1.14 percent. For a typical firm, this means the chances of appointing a CSO rise from 8.12 percent to 9.26 percent.
For the coalition membership outcomes, we find that firms led by green directors are more likely to join a pro-climate coalition. This result is consistent with our hypothesis and relatively large, with the change in predicted percentage chance of joining a pro-climate coalition rising from 2.13 percent at the 10th percentile of Dark Green directors to 2.83 percent at the 90th percentile, an absolute increase of 0.70 percent. However, contrary to our expectations, we do not observe a systematic difference in the percentage chance of joining an anti-climate coalition when a firm is led by green directors. While the point estimates for Green and Dark Green directors are in the expected direction, they are not significant at the 90 percent confidence level.
We similarly present the results of our cross-sectional analysis in Figure 6.Footnote 56 As expected, we find that firms led by Dark Green directors are more likely to make a net-zero commitment, make a more ambitious emissions reduction commitment, and include Scope 3 emissions in their commitments. Changing the number of Dark Green directors on a typical firm’s board from the 10th percentile to the 90th percentile leads to predicted increases of 13.53 percent in the percentage change of making a net-zero commitment, 0.33 in the predicted level of the emissions reduction commitment, and 0.25 in the predicted level of Scope 3 specification. Contrary to our hypothesis, firms led by Dark Green directors are not systematically more likely to set a defined target for emissions reductions, join the Race to Zero initiative, or a more ambitious target year.
Estimates and predicted outcomes for the cross-sectional analysis. Dots are coefficient estimates, rectangles are average predicted values, thick bars are 90% confidence intervals, and thin bars are 95% confidence intervals. Outcomes are measured as predicted percentage change of enacting the relevant climate policy. Bottom plot compares predicted outcomes increasing green directors from the 10th percentile to the 90th percentile for # Light Green directorsi (L, light green) and # Dark Green directorsi (D, dark green).

An important caveat for these cross-sectional results is that they only hold for # Dark Green directors $ {\mathrm{}}_{i}$
, the more restrictive measure of directors’ pro-environmental attitudes. Models using # Light Green directors
$ {\mathrm{}}_{i}$
, the more restrictive measure of directors’ pro-environmental attitudes. Models using # Light Green directors $ {\mathrm{}}_{i}$
, the less restrictive measure, lose statistical significance at the 95 percent confidence level for all cross-sectional outcome variables, although they retain the same direction. This continues a pattern across all of our results, in which models counting the number of Dark Green directors yield larger estimates in the anticipated direction. This may reflect the greater precision of the Dark Green directors measure.
$ {\mathrm{}}_{i}$
, the less restrictive measure, lose statistical significance at the 95 percent confidence level for all cross-sectional outcome variables, although they retain the same direction. This continues a pattern across all of our results, in which models counting the number of Dark Green directors yield larger estimates in the anticipated direction. This may reflect the greater precision of the Dark Green directors measure.
In summary, we observe firms to be significantly more likely to adopt pro-climate corporate policies when more green directors serve on their boards of directors. While each of these outcomes has its limitations in terms of practical consequences, they collectively represent a meaningful attempt by firms to influence both their own contribution to climate change and broader discussions of climate change in society. We caution again that our argument is causal—green directors change their corporations’ climate policies—but our evidence is associational.
Robustness
To characterize the robustness of our findings, we first assess the sensitivity of our core results to omitted variable bias by calculating robustness values. A robustness value is the minimum association that an unobserved confounder would need to have, both with the explanatory variable and the outcome, to change the research conclusions.Footnote 57 We then examine a variety of alternative model specifications to evaluate the plausibility of having omitted sufficiently strong confounders to overturn our core results.
We begin by considering the sensitivity of our panel results, again focusing on the # Dark Green directors $ {\mathrm{}}_{i,t}$
(Appendix F.1). We estimate that the most stringent specification of our models for CDP reporting appointment has a robustness value of 0.3 percent. This means an unobserved confounder would have to explain more than 0.3 percent of the residual variance of both # Dark Green directors
$ {\mathrm{}}_{i,t}$
(Appendix F.1). We estimate that the most stringent specification of our models for CDP reporting appointment has a robustness value of 0.3 percent. This means an unobserved confounder would have to explain more than 0.3 percent of the residual variance of both # Dark Green directors $ {\mathrm{}}_{i,t}$
and CDP
$ {\mathrm{}}_{i,t}$
and CDP $ {\mathrm{}}_{i,t}$
before our estimate of the positive relationship between green directors and CDP reporting lost significance at the 95 percent confidence level. Such a hypothetical unobserved confounder would need to be more than 4.2 times the strength of annual firm revenues (Employees
$ {\mathrm{}}_{i,t}$
before our estimate of the positive relationship between green directors and CDP reporting lost significance at the 95 percent confidence level. Such a hypothetical unobserved confounder would need to be more than 4.2 times the strength of annual firm revenues (Employees $ {\mathrm{}}_{i,t}$
), the strongest observed confounder in our analysis. Similarly, an unobserved confounder would need to be 2.1 and 4.2 times the strength of Employees
$ {\mathrm{}}_{i,t}$
), the strongest observed confounder in our analysis. Similarly, an unobserved confounder would need to be 2.1 and 4.2 times the strength of Employees $ {\mathrm{}}_{,t}$
, respectively, to overturn our results for CSO appointment and Pro-climate coalition membership.
$ {\mathrm{}}_{,t}$
, respectively, to overturn our results for CSO appointment and Pro-climate coalition membership.
To show how difficult it would be to find such a confounder, we examine alternative model specifications for our panel analysis. In Table E1, we vary controls and fixed effects across models. These consist of (1) no controls and no fixed effects, (2) controls and no fixed effects, (3) controls and fixed effects by industry and year, (4) controls and fixed effects by industry-year ( $ {\mu }_{s,t}$
). In variants (1) and (2), we also include Sector CO
$ {\mu }_{s,t}$
). In variants (1) and (2), we also include Sector CO $ {}_{2}$
intensity
$ {}_{2}$
intensity $ {\mathrm{}}_{s}$
as a control, which is absorbed by the industry fixed effects
$ {\mathrm{}}_{s}$
as a control, which is absorbed by the industry fixed effects $ {\mu }_{s}$
in variant (3). Our results retain their sign throughout and attain statistical significance at the 90 percent confidence level for 23 of 24 estimates (29 of 32 counting the anti-climate coalition membership outcome).
$ {\mu }_{s}$
in variant (3). Our results retain their sign throughout and attain statistical significance at the 90 percent confidence level for 23 of 24 estimates (29 of 32 counting the anti-climate coalition membership outcome).
We then add additional control variables to our primary model specification (Figure F4). Our results retain their sign and significance in models that incorporate a lagged dependent variable. Our results are similarly robust if we only examine firms that attain more than $1 billion in annual revenue or include sector CO $ {\mathrm{}}_{2}$
intensity (estimated without firm fixed effects), with the exception of the CSO appointment outcome, which loses statistical significance at the 90 percent confidence level in some specifications. The results for CDP reporting and CSO appointment are robust to including environmental risk disclosure and worker climate attitudes, although our estimates for Pro-climate coalition membership lose significance in these shorter panels. We also consider models that replace the count of green directors with directors’ total amount of green political contributions. These yield directionally similar results, but no estimate attains significance at the 95 percent confidence level.
$ {\mathrm{}}_{2}$
intensity (estimated without firm fixed effects), with the exception of the CSO appointment outcome, which loses statistical significance at the 90 percent confidence level in some specifications. The results for CDP reporting and CSO appointment are robust to including environmental risk disclosure and worker climate attitudes, although our estimates for Pro-climate coalition membership lose significance in these shorter panels. We also consider models that replace the count of green directors with directors’ total amount of green political contributions. These yield directionally similar results, but no estimate attains significance at the 95 percent confidence level.
We conduct the same sensitivity exercise for our cross-sectional results (Appendix G.1). Focusing on # Dark Green directors $ {\mathrm{}}_{i,t}$
, we estimate that the most stringent specification of our models for adopting a net-zero commitment has a robustness value of 1.3 percent. This means an unobserved confounder would need to have an association with both the outcome and the treatment (# Dark Green directors
$ {\mathrm{}}_{i,t}$
, we estimate that the most stringent specification of our models for adopting a net-zero commitment has a robustness value of 1.3 percent. This means an unobserved confounder would need to have an association with both the outcome and the treatment (# Dark Green directors $ {\mathrm{}}_{i,t}$
) that is 10.4 times the strength of our benchmark of total number of employees (Employees
$ {\mathrm{}}_{i,t}$
) that is 10.4 times the strength of our benchmark of total number of employees (Employees $ {\mathrm{}}_{i,t}$
). Similarly, an unobserved confounder would have to have an association of 4.9 times and 208 times the strength of Revenue
$ {\mathrm{}}_{i,t}$
). Similarly, an unobserved confounder would have to have an association of 4.9 times and 208 times the strength of Revenue $ {\mathrm{}}_{i,t}$
to overturn the result for Commitment level and Scope 3 specification at the 95 percent confidence level, respectively.
$ {\mathrm{}}_{i,t}$
to overturn the result for Commitment level and Scope 3 specification at the 95 percent confidence level, respectively.
We now turn to alternative model specifications for our cross-sectional analysis. As before, we vary controls and fixed effects across models in Table E3, first with (1) no controls and no fixed effects and then (2) controls and no fixed effects. In variants (1) and (2), we also include Sector CO $ {}_{2}$
intensity
$ {}_{2}$
intensity $ {\mathrm{}}_{s}$
as a control, but it is absorbed by industry fixed effects
$ {\mathrm{}}_{s}$
as a control, but it is absorbed by industry fixed effects $ {\mu }_{s}$
in variant (3). Our results retain their sign and statistical significance at the 90 percent confidence level throughout.
$ {\mu }_{s}$
in variant (3). Our results retain their sign and statistical significance at the 90 percent confidence level throughout.
The relationship between # Dark Green directors $ {\mathrm{}}_{i,t}$
and the outcomes of adopting a net-zero commitment, commitment level, and Scope 3 specification remains substantively unchanged for models that include environmental risk disclosure and models that include worker climate attitudes (Figure G4). Models that use total director contributions to green candidates do not yield statistically significant results, with the exception of Target year
$ {\mathrm{}}_{i,t}$
and the outcomes of adopting a net-zero commitment, commitment level, and Scope 3 specification remains substantively unchanged for models that include environmental risk disclosure and models that include worker climate attitudes (Figure G4). Models that use total director contributions to green candidates do not yield statistically significant results, with the exception of Target year $ {\mathrm{}}_{i}$
, which is negatively associated with higher levels of director contributions to green candidates.
$ {\mathrm{}}_{i}$
, which is negatively associated with higher levels of director contributions to green candidates.
In summary, both our panel and cross-sectional analyses are sensitive only to relatively large hypothetical confounders. Our results are largely robust to the inclusion of additional control variables. In light of the overall stability of our results, we believe unmeasured confounders of sufficient size to overturn our results are unlikely to be present.
Green director influence under (un)favorable conditions
In the final portion of our analysis, we explore whether the influence of green directors over corporate climate policy choices depends on their broader context. Directors may be more empowered and effective in acting on their climate attitudes when they anticipate that their opinions will attract support from their peers and the firm’s top leadership. Conversely, pro-climate directors may keep their attitudes to themselves if doing so seems likely to receive a cold reception from other directors or if the firm’s business model is more carbon-intensive. We focus here on our panel outcomes (Figure 7; see Appendix F.3 for tables).
Interaction estimates from models with # Green Directors interacted with Env. committee, Green leader, (# Green directors)2, Green tenure, # Grey directors, and sector CO2 intensity (Tables F1–F6). Thick bars are 90% confidence intervals, and thin bars are 95% confidence intervals. Standard errors are clustered by firm. Light green indicates estimates from models using # Light Green directors
$ {\mathrm{}}_{i,t}$
, and dark green indicates estimates from models using # Dark Green directors
$ {\mathrm{}}_{i,t}$
.

First, we consider the effect of green directors in conditions seemingly favorable to their influence. We find that the effect of a green director does not systematically change when the board has a committee dedicated to environmental issues (Figure 7a) or when the CEO or chairperson personally holds green attitudes (Figure 7b). These results suggest that green directors contribute to a firm’s pro-climate policies beyond the influence of its leader or environment committee. We also do not find evidence that our estimates systematically change according to a polynomial of the number of green directors on a board (Figure 7c) or by the years of experience held by green directors (Figure 7d). Overall, the relationship between the number of green directors and the adoption of pro-climate policies does not appear to be stronger (nor weaker) when green directors would seem to be more empowered and effective. One possible explanation is that policies like CDP reporting and CSO appointment may be relatively uncontentious and, once proposed, do not require directors to access political resources like committees, authority, voting blocs, and experience.
Next, we examine whether the effect of green directors varies in contexts where climate action is more controversial. For example, it may be more controversial to take climate action when other directors on the board hold hostile attitudes toward environmental protection. However, the interaction terms between # Green directors $ {\mathrm{}}_{i,t}$
by # Grey directors
$ {\mathrm{}}_{i,t}$
by # Grey directors $ {\mathrm{}}_{i,t}$
are not statistically significant at the 90 percent confidence level (Figure 7e). Alternatively, firms in carbon-intensive sectors may have more to lose from climate action. However, we similarly find that the effect of green directors on the pro-climate actions of firms in more carbon-intensive sectors is similar to their effect on firms in less carbon-intensive sectors (Figure 7f). Taken together, these results indicate that firms with green directors are more likely to take pro-climate action, even in difficult contexts.
$ {\mathrm{}}_{i,t}$
are not statistically significant at the 90 percent confidence level (Figure 7e). Alternatively, firms in carbon-intensive sectors may have more to lose from climate action. However, we similarly find that the effect of green directors on the pro-climate actions of firms in more carbon-intensive sectors is similar to their effect on firms in less carbon-intensive sectors (Figure 7f). Taken together, these results indicate that firms with green directors are more likely to take pro-climate action, even in difficult contexts.
Conclusion
We conclude by summarizing our main findings and discussing their implications for climate politics. Our first set of findings describes the prevalence of board directors with pro-environment attitudes, as evidenced by their personal political campaign donations to green political candidates. We find that green board members are common, with at least one present at 61 percent of publicly traded companies between 1990 and 2023. One-third of companies have multiple green directors at any given point. Their numbers grew quickly from 1990 to 2005 and continued to grow in the years since, albeit at a more moderate pace. Green directors are common across industries, even in highly polluting industries. There is substantial variation in the number of green directors, both across and within industries. This variation motivates our investigation of whether green directors influence their firms’ climate policies, holding constant economic interests and outside pressures.
We find a robust association between a company’s number of green directors and their likelihood of adopting a wide variety of pro-climate corporate policies. In terms of collective private governance, companies with more green directors are more likely to contribute reports of their greenhouse gas emissions to the CDP and to announce Net Zero commitments. In terms of individual private governance, they are more likely to appoint an executive responsible for leading corporate sustainability efforts. Firms with green board members are also more likely to join political coalitions that support public climate action, meaning green directors also contribute indirectly to the promotion of proactive public climate governance.
Although the details of corporate institutions, as well as private governance and corporate political influence, vary across the world, our core findings could travel to other locations because corporate board governance is widely used in Europe and the large Asian economies. Blockholder ownership patterns prevalent in the EU might limit board member discretion, though it could also empower board members compared to the more dispersed ownership and stronger role of management on the boards of many US firms. Some countries in Europe and East Asia divide board functions based on managerial and supervisory tasks, which might also shape the individual influence of board members. Future work ought to investigate the link between corporate board institutional design and the scope for board members’ personal beliefs to influence corporate environmental governance.
Our findings make three broad contributions. First, we advance the study of corporate political behaviors and governance policies in the area of climate change. Corporations and other businesses are major emitters of greenhouse gases, so understanding what influences their climate policies is imperative. A recent trend in the literature has been to break up these (sometimes enormously large) institutions to understand how different stakeholders and institutions within the corporation interact to form policy. Here, we theorize and provide suggestive evidence of the power of board members over corporate policy, an argument that could easily apply beyond climate change and into other areas of ESG, corporate policies, or political engagement.
Second, our findings demonstrate how private political preferences may shape the behavior of ostensibly apolitical economic decisionmakers. One way of viewing this is that we trace out a new mechanism for thinking about why public opinion—in this case of an elite segment of the public—matters. Privately held political preferences, which are the product of public political debates, appear to shape the behavior of corporate elites. In turn, corporate elites drive the private governance and public political activity of the corporations where they work. These actions then impact public policy and policy outcomes. Thus, the corporation may act as an important mediator between public opinion and public policy, albeit one that amplifies some voices over others.
Finally, board elections have always been fundamentally important for corporate climate policies, but they have attracted a newfound appreciation in recent years.Footnote 58 Activist shareholders, in alliance with major investment companies and mutual fund issuers, have successfully engineered the election of pro-climate action members to the boards of directors of several major polluters, including ExxonMobil, since 2021.Footnote 59 Our paper validates the underlying logic driving these actors’ focus on board elections. In finding that the beliefs of board members affect corporate climate policy, we show that efforts to increase the prevalence of pro-climate attitudes among directors may well spur firms to act on climate change.
Supplementary material
The supplementary material for this article can be found at https://doi.org/10.1017/bap.2025.6
Acknowledgments
The authors wish to thank the participants at the London Environment and Public Policy workshop, the Grantham Institute on Climate Change and the Environment workshop, and the Environmental Politics and Governance conference.
Competing interests
The author(s) declare none.


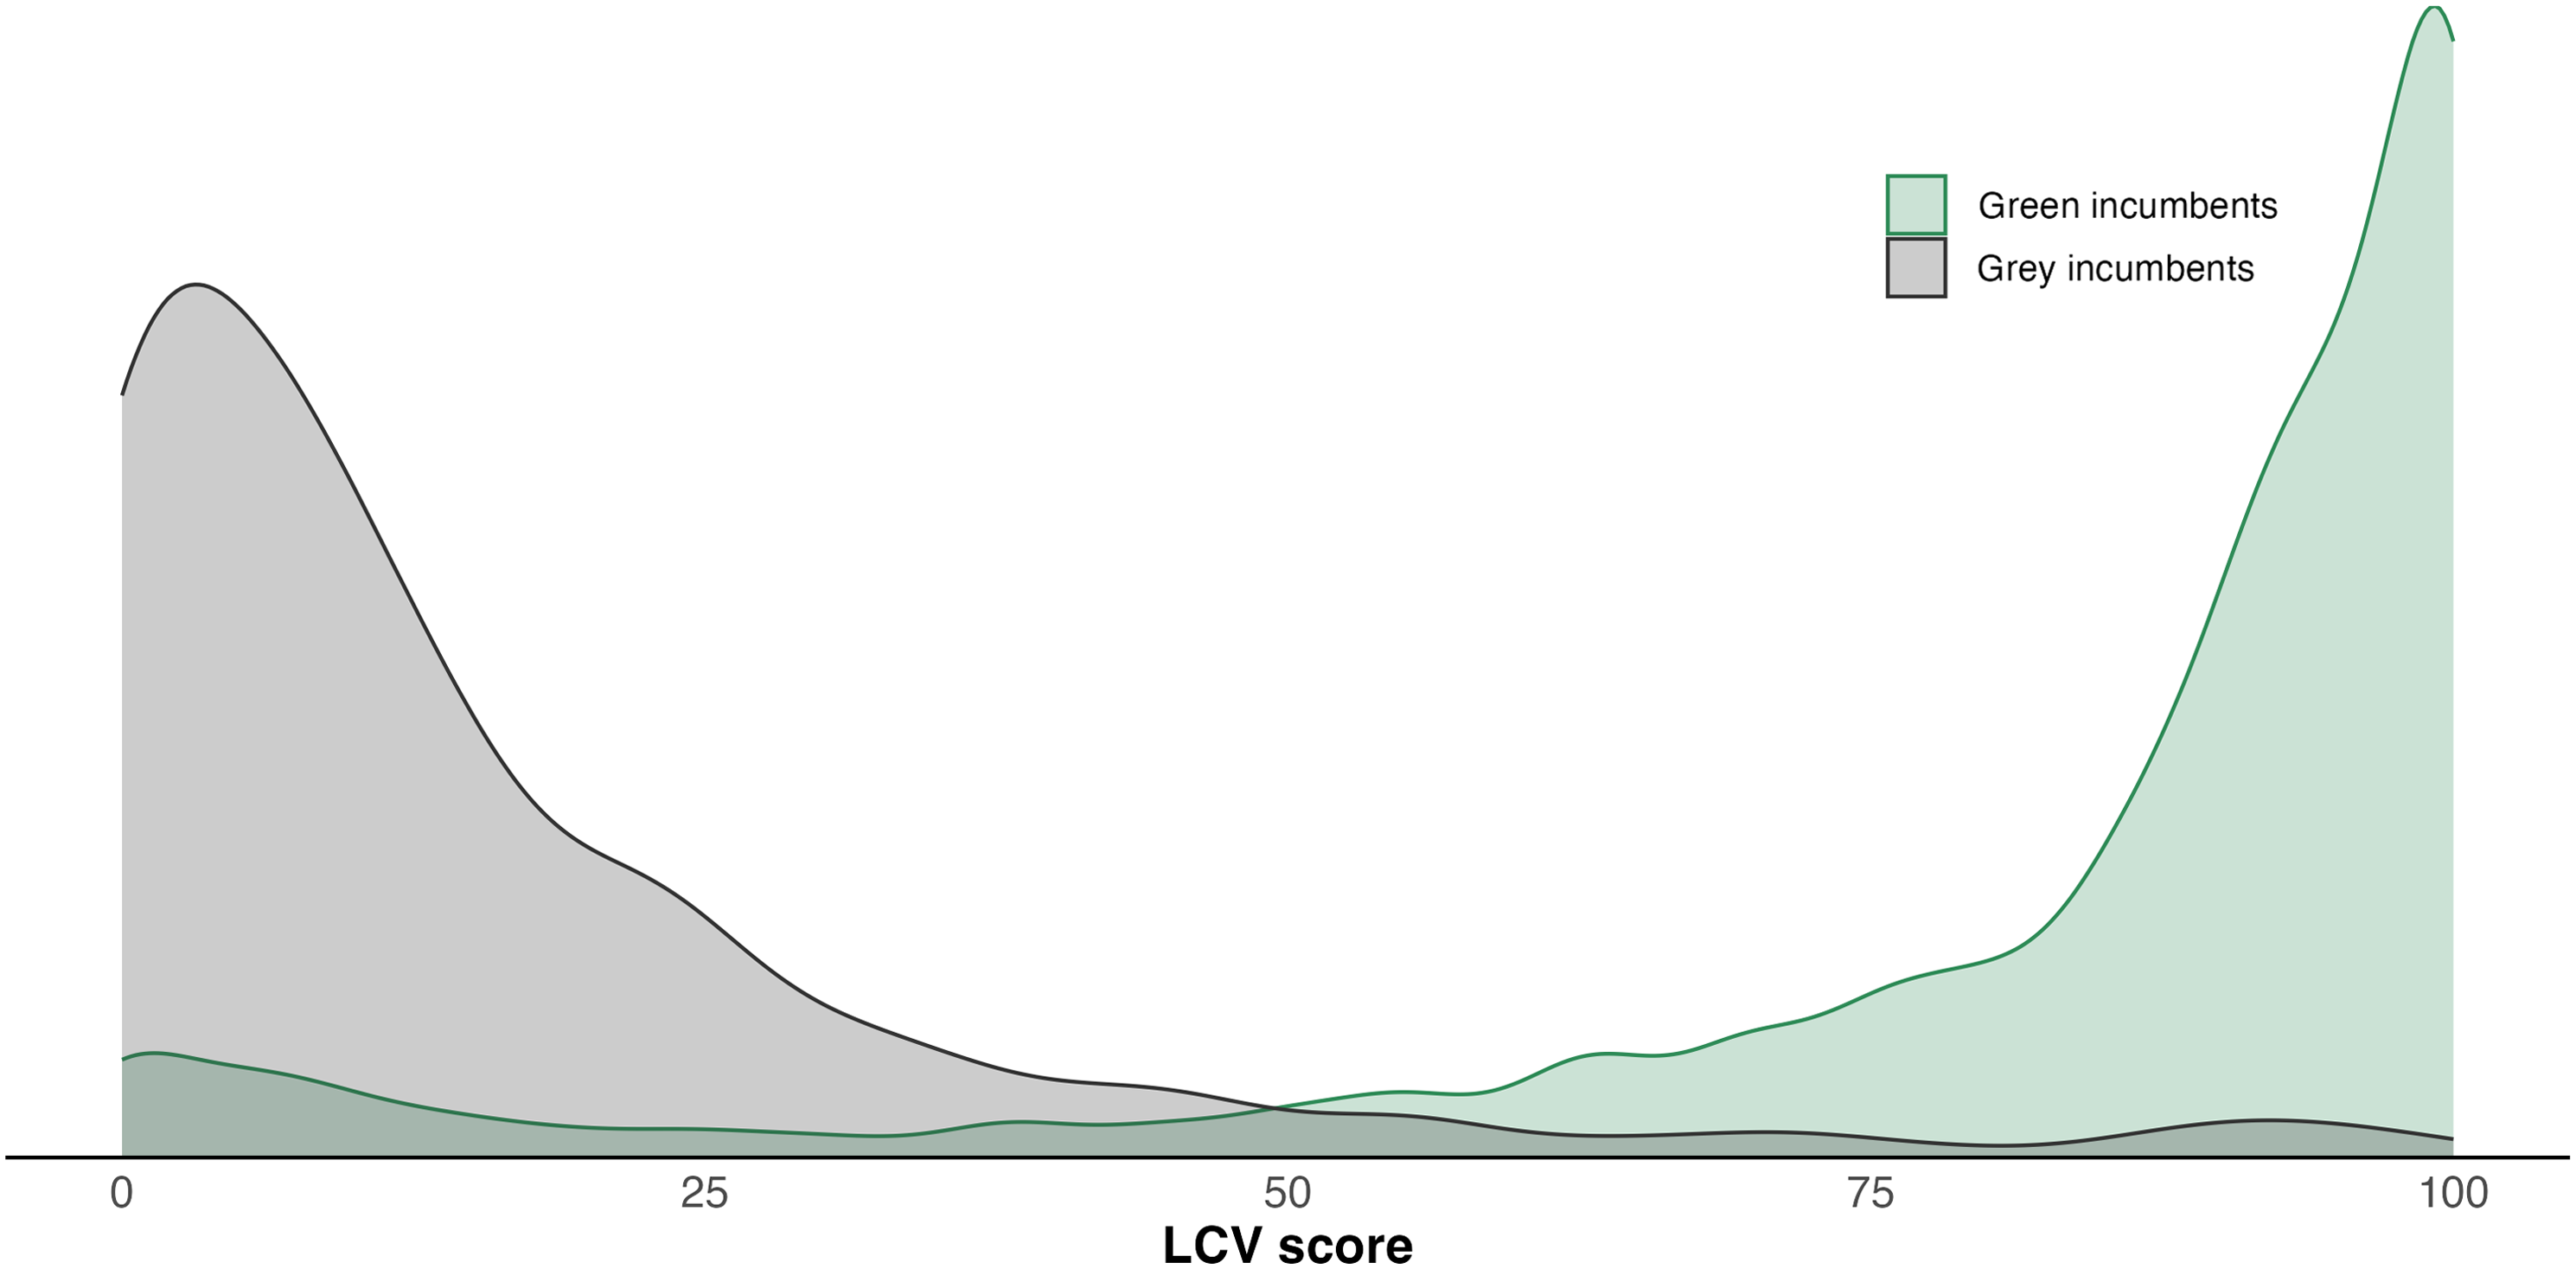


 Open access