


Public opinion polling is seemingly in a crisis (Shapiro Reference Shapiro2019). Costs are increasing, response rates are declining (Keeter et al. Reference Keeter, Hatley, Kennedy and Lau2017), and there are growing concerns about inaccuracy (Clinton et al. Reference Clinton2021a; Clinton, Lapinski, and Trussler Reference Clinton, Lapinski and Trussler2022; Kennedy et al. Reference Kennedy2018). At the same time, polls are necessary tools to assess and address growing concerns about polarization and democratic backsliding (Graham Reference Graham2023; Waldner and Lust Reference Waldner and Lust2018). When done well, public opinion polls allow scholars, policymakers, and journalists to assess the opinions of the whole public—not just those who are the most active, willing, and able to express their opinions through more costly means like direct appeals, protests, and donations.
Given the rising expense and difficulty of interviewing respondents, researchers increasingly turn to other methods of characterizing public opinion and sentiment, such as relying on non-survey data (Beauchamp Reference Beauchamp2017; Tucker Reference Tucker2017) or implementing sophisticated weighting methods (Bisbee Reference Bisbee2019; Caughey and Warshaw Reference Caughey and Warshaw2015; Gelman Reference Gelman1997; Ghitza and Gelman Reference Ghitza and Gelman2013; Goplerud Reference Goplerud2024; Lax and Phillips Reference Lax and Phillips2009).
Large language models (LLMs) that synthesize vast corpora of human-generated text might look like the new frontier in characterizing public opinion without the expense of traditional polling. Social scientists have already used LLMs to label political data (Gilardi, Alizadeh, and Kubli Reference Gilardi, Alizadeh and Kubli2023; Törnberg Reference Törnberg2023), estimate politicians’ ideology (Wu et al. Reference Wu, Tucker, Nagler and Messing2023), and generate synthetic samples for pilot testing (Argyle et al. Reference Argyle, Busby, Fulda, Gubler, Rytting and Wingate2023; Horton Reference Horton2023). At least one start-up in private industry suggests that “synthetic users” can supplement or replace human respondents in development and marketing,Footnote 1 and there is a growing interest among polling companies to explore the opportunities promised by synthetic data.Footnote 2 But can a pretrained LLM produce synthetic opinions for respondent personas that accurately mirror what similar human respondents would say on a real survey?Footnote 3
We evaluate this question by prompting ChatGPT 3.5 TurboFootnote 4 (OpenAI 2021) to first adopt various personas defined by demographic and political characteristicsFootnote 5 and then answer a battery of questions about feelings toward social and political groups. We refer to these responses as “synthetic data,” which is occasionally referred to in related research as “silicon samples” (Argyle et al. Reference Argyle, Busby, Fulda, Gubler, Rytting and Wingate2023).Footnote 6 To facilitate comparison to widely used public opinion data, the characteristics defining each persona in our synthetic data are taken from real respondents in the 2016 and 2020 American National Election Study (ANES), and our survey questions closely mirror the ANES’s feeling thermometer questions.
Our primary analysis compares the distribution of responses from synthetic ChatGPT personas to matching corresponding respondents in the ANES. We focus on three metrics of interest to social scientists: (1) how well ChatGPT recovers the overall mean and variance of feelings toward various groups, (2) how closely the (conditional) correlations between persona characteristics and survey responses mirror the inferences we would draw from the ANES, and (3) the sensitivity of our comparisons to changes in the prompt, the LLM, and the timing of data collection.Footnote 7
At the coarsest level of analysis, synthetic ChatGPT opinions look remarkably similar to human ANES respondents. However, even when we compare overall average responses, we find problems with how well ChatGPT recovers the distribution of public opinion, both in terms of conditional averages and in terms of precision. The synthetic sample fares worse when we examine higher-order relationships. When we regress feeling thermometer scores on respondents’ demographic attributes—the type of analysis common in public opinion research—the synthetic sample would frequently lead us to draw different inferences than if we relied on human respondents. 48% of coefficients estimated from the ChatGPT responses are statistically significantly different from their ANES-derived counterpart; among these cases, the sign of the effect flips 32% of the time. Simply put, researchers cannot take for granted that responses from a pretrained LLM will match traditional survey data.
Beyond statistical mismatches, we also demonstrate that synthetic data fail even the most basic requirements for replication. The most concerning of these is that the distribution of responses to the same prompt changed between our initial run in April 2023 and a rerun in July 2023 due to changes in the underlying algorithm. This is a key illustration of how closed-source generative models pose a threat to the reproducibility norms of contemporary social science (Spirling Reference Spirling2023). Besides these reproducibility issues, we also find that the distribution of results is sensitive to small differences in the prompt, raising concerns about researcher degrees of freedom and the issues associated with making data-dependent analytical decisions (Gelman and Loken Reference Gelman and Loken2014).
Our findings raise serious questions about the use and performance of LLMs for the characterization of public opinion and the creation of synthetic data, connecting with a growing body of research that asks similar questions (Bender et al. Reference Bender, Gebru, McMillan-Major and Shmitchell2021; Spirling Reference Spirling2023) and documents similar issues (Abdulhai et al. Reference Abdulhai, Serapio-Garcia, Crepy, Valter, Canny and Jaques2023; Cao et al. Reference Cao, Zhou, Lee, Cabello, Chen and Hershcovich2023; Motoki, Pinho Neto, and Rodrigues Reference Motoki, Pinho Neto and Rodrigues2023; Rozado Reference Rozado2023). When we prompt LLMs to adopt personas matching actual ANES respondents, the resulting data largely fail to replicate our best estimates of the correlates of human opinion.Footnote 8
1 Research Design and Data
An LLM is a prediction algorithm optimized to predict the next token in a sequence of text data. When prompted to take on a persona with a set of attributes and answer a question from that perspective, contemporary LLMs can provide convincingly coherent responses. The largest models have demonstrated remarkable emergent abilities well outside the text-sequencing tasks at the core of their training (Wei et al. Reference Wei, Tay, Bommasani, Raffel, Zoph, Borgeaud, Yogatama, Bosma, Zhou, Metzler and Chi2022). The uncanny coherence of LLM responses to a wide variety of prompts have generated considerable excitement about the possibility of using these models to generate responses that are representative of public opinion. For example, Argyle et al. (Reference Argyle, Busby, Fulda, Gubler, Rytting and Wingate2023) conclude that “by conditioning the model on thousands of socioeconomic backstories from real human[s],” LLMs are able to generate synthetic opinions that “reflect[] the complex interplay between ideas, attitudes, and sociocultural context that characterize human attitudes.”Footnote 9
But does this imply that we can replace human samples altogether? If we ask an LLM to act as though it were a 30-year-old white male Republican with a high-school degree and ask about its feelings toward Democrats, can we expect its responses to mirror the distribution of human opinions in that group?Footnote 10 The vast corpus used to train these models (see, e.g., Washington Post 2023) contains reams of political writing that could, perhaps, be used to construct nuanced depictions of opinions across groups. But when that vast corpus comes from the Internet, the content may be unrepresentative of the public at large, or at least some groups within it (Bail Reference Bail2022). Scholars have probed the default persona of ChatGPT by prompting it to answer a battery of survey questions and showing that the resulting responses have ideological, dispositional, and psychological biases (Abdulhai et al. Reference Abdulhai, Serapio-Garcia, Crepy, Valter, Canny and Jaques2023; Bail Reference Bail2022; Motoki, Pinho Neto, and Rodrigues Reference Motoki, Pinho Neto and Rodrigues2023; Rozado Reference Rozado2023). Consistent with prior findings, Section 7 of the SI confirms that prompting ChatGPT to adopt the persona of an “average” citizen produces responses that are closer to those of Democrats than Republicans.
How well pretrained LLMs can reproduce human opinion when prompted to adopt a particular persona is less clear. Our approach is to generate a dataset of synthetic opinions from ChatGPT about contemporary politics in the United States that we compare to opinions from a survey of matched human respondents from the 2016 and 2020 American National Election surveys.
To examine a pretrained LLM’s ability to simulate the opinions of respondents defined by a particular set of features, we use a survey instrument known as a “feeling thermometer.” Respondents are instructed to consider some group and to indicate the degree to which they experience warm (positive, affectionate, etc.) or cool (negative, disdainful, etc.) feelings toward members of that group. This instrument has been employed by major polling outfits since 1964, and it is widely used by scholars to characterize the extent of societal division (Druckman and Levendusky Reference Druckman and Levendusky2019; Iyengar and Westwood Reference Iyengar and Westwood2019). After instructing the LLM to adopt a persona defined by a set of respondent characteristics, we then ask it to answer a battery of feeling thermometer questions. We choose respondent personas and feeling thermometers to match questions that human respondents were asked in a real public opinion survey, allowing us to gauge how accurately and precisely the synthetic LLM responses capture actual public opinion.Footnote 11
We conduct our primary investigation using perhaps the most publicized and popular software built on a pretrained LLM, ChatGPT 3.5 Turbo (OpenAI 2021). To characterize how robust our results are to differences across LLMs (as well as changes in the “same” LLM over time), we replicate portions of our analysis with ChatGPT 4.0, with ChatGPT 3.5 Turbo both before and after its update on June 25, 2023, and with the open-source model Falcon-40B-Instruct.Footnote 12
We iterate several different versions of a prompt to gather our synthetic data, the full description of which can be found in SI Section 1. Our main results are based on the most detailed version of a prompt in which we instruct ChatGPT to adopt a persona defined as follows:
“It is [YEAR]. You are a [AGE] year-old, [MARST], [RACETH] [GENDER] with [EDUCATION] making [INCOME] per year, living in the United States. You are [IDEO], [REGIS] [PID] who [INTEREST] pays attention to what’s going on in government and politics.”Footnote 13
In each query to ChatGPT, the characteristics in brackets are substituted with values corresponding to a real respondent in the 2016 or 2020 wave of the ANES. These values include:
-
• [YEAR]: 2016 or 2020
-
• [AGE]: age in years of ANES respondent
-
• [RACETH]: non-Hispanic white, non-Hispanic black, or Hispanic
-
• [GENDER]: male or female
-
• [MARST]: divorced, married, separated, single, or widowed
-
• [EDUCATION]: a high school diploma, some college but no degree, a bachelor’s degree or more
-
• [INCOME]: $30k, $50k, $80k, $100k, $150k or more
-
• [IDEO]: an extremely liberal, a liberal, a slightly liberal, a moderate, a slightly conservative, a conservative, an extremely conservative
-
• [REGIS]: registered, unregistered
-
• [PID]: Democrat, Independent, Republican
-
• [INTEREST]: never, sometimes, frequently, regularly, always
For our primary analyses, the LLM is then prompted as follows:
“Provide responses from this person’s perspective. Use only knowledge about politics that they would have. Format the output as a tsv table with the following format:
group,thermometer,explanation,confidence
The following questions ask about individuals’ feelings toward different groups. Responses should be given on a scale from 0 (meaning cold feelings) to 100 (meaning warm feelings). Ratings between 50 degrees and 100 degrees mean that you feel favorable and warm toward the group. Ratings between 0 degrees and 50 degrees mean that you don’t feel favorable toward the group and that you don’t care too much for that group. You would rate the group at the 50 degree mark if you don’t feel particularly warm or cold toward the group.
How do you feel toward the following groups?
The Democratic Party?
The Republican Party?
Democrats?
Republicans?
Black Americans?
White Americans?
Hispanic Americans?
Asian Americans?
Muslims?
Christians?
Immigrants?
Gays and Lesbians?
Jews?
Liberals?
Conservatives?
Women?”Footnote 14
We prompt 30 synthetic respondents for each of the 7,530 human respondents in the ANES survey, yielding a final dataset of 3,614,400 responses.Footnote 15 For each response, we record both the numeric feeling thermometer score, the explanation provided by the LLM for why they chose the score, and a measure of the model’s reported confidence in the response.Footnote 16 In our main analyses below, we rely on the average response from the 30 synthetic respondents drawn for each human, except when calculating uncertainty, where we rely on only the first synthetic response.
2 Results
We evaluate the synthetic data’s quality in three ways. We begin by comparing means and variances to demonstrate that although ChatGPT appears to perform reasonably well at recovering overall averages, it is often biased and overly confident in its approximations of real human survey responses. We then test whether ChatGPT can recover marginal associations between covariates and find that regression results estimated using human and synthetic samples often differ, sometimes substantially in systematic ways. Finally, we document considerable sensitivity of synthetic responses to both the timing of when a prompt was used to generate data, and also to the persona each prompt represents.Footnote 17
We underscore that our empirical setting is a theoretically easy test for ChatGPT. Existing work has documented a western, especially American, bias in the LLM (Cao et al. Reference Cao, Zhou, Lee, Cabello, Chen and Hershcovich2023); we benchmark using one of the most well-known American political opinion surveys; and we specify the precise year that the human respondent participated in the survey, both of which are prior to the end of ChatGPT’s training period. Even so, we test the sensitivity of our conclusions to other questions and datasets in SI Section 12, finding significantly worse performance than we document in this paper, and supporting our intuition that what follows is a best-case scenario for synthetic data. Yet, even in this setting, the best we can say is that the overall average synthetic responses are close to the population averages. For the kinds of associational questions that social scientists care about, synthetic survey data perform poorly even under the favorable conditions we examine.
2.1 Accuracy of Average and Standard Deviations
Figure 1 plots the sample means and standard deviations for the various feeling thermometer scores estimated using either the actual ANES respondents or the average of the synthetic respondents drawn from ChatGPT.Footnote 18 Because the synthetic data were collected to exactly match ANES respondents on the selected covariates, the distributions ideally would be identical.
Average feeling thermometer results (x-axis) for different target groups (y-axis) by prompt type/timing (columns). Average ANES estimates from the 2016 and 2020 waves indicated with red triangles and one standard deviation indicated with thick red bars. LLM-derived averages indicated with black circles and thin black bars. Sample sizes for each groupwise comparison are identical.
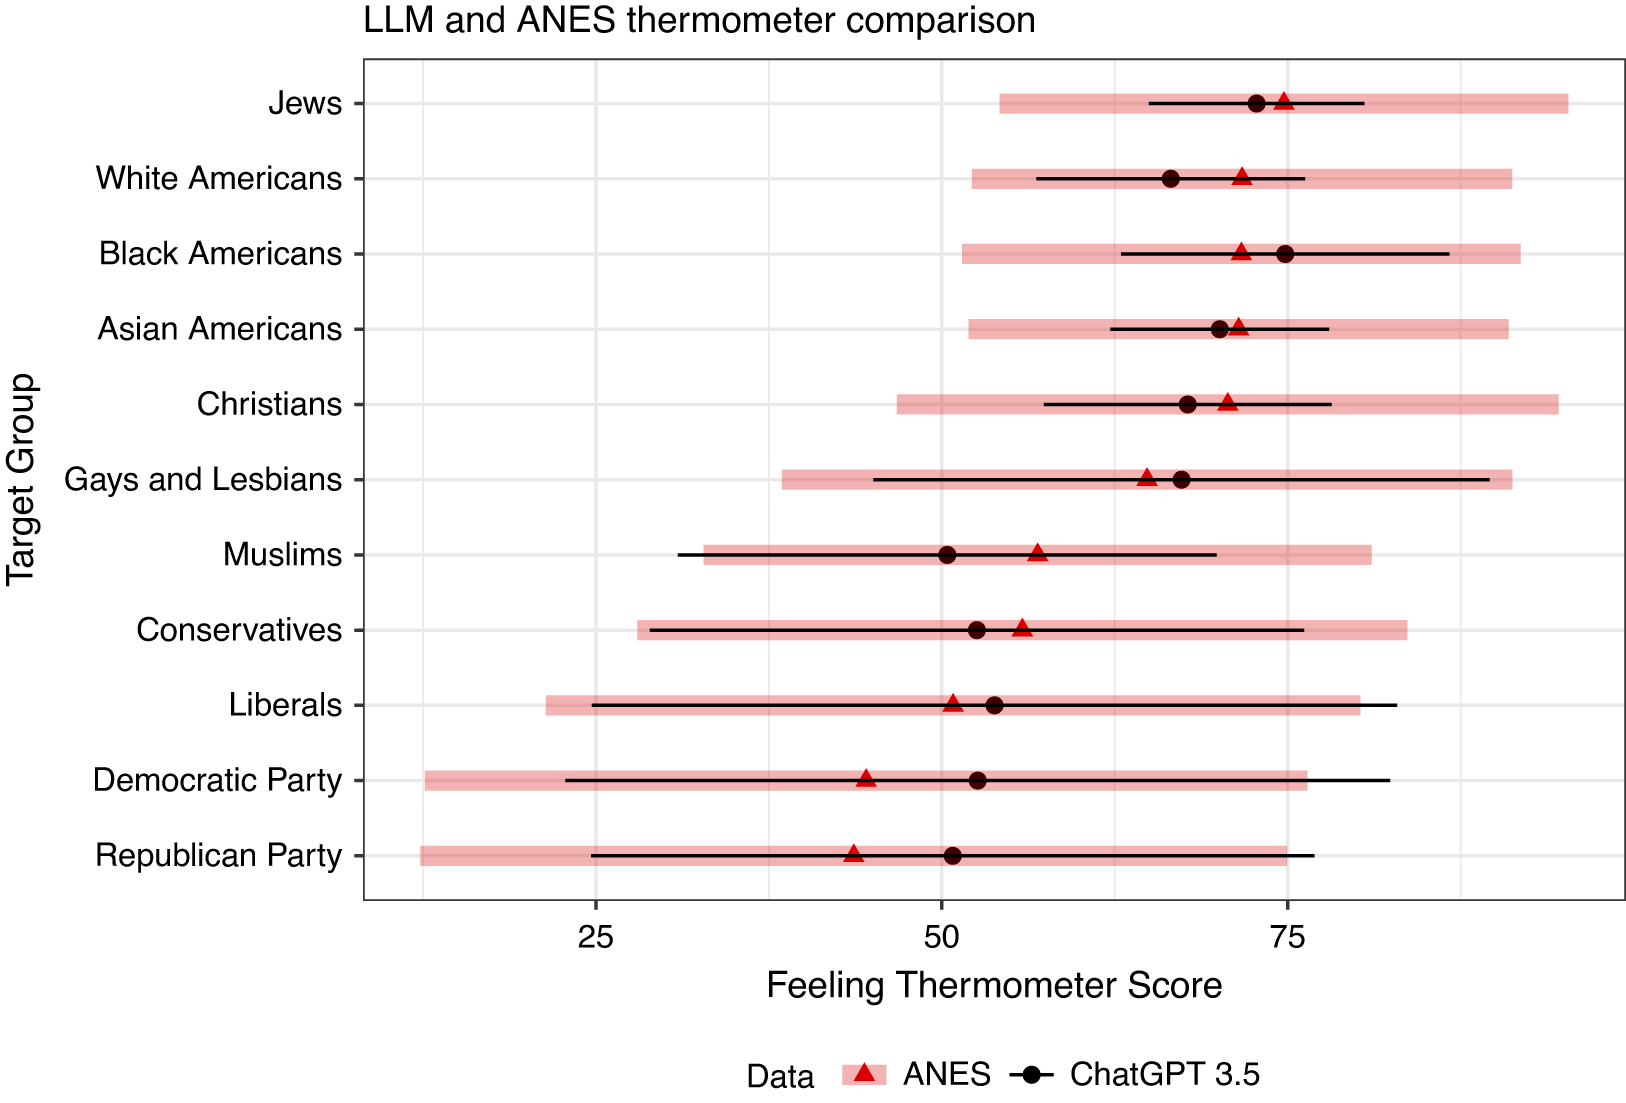
While the average of ChatGPT responses does not exactly match the average survey response in the ANES, every synthetic mean falls within one standard deviation of the ANES average. In addition, the rank ordering of feeling thermometers is largely intact across both samples. That said, the distribution of synthetic responses for some questions exhibits far less variation than human responses, especially for questions asking about feelings toward racial and religious groups. The variation in the ChatGPT responses also reflects statistical uncertainty due to sampling from the underlying language model,Footnote 19 so it is striking that these responses are still more tightly distributed than in the ANES data.
Even though the synthetic data broadly perform well in terms of summarizing overall human opinion, issues emerge when we look at subgroups. To demonstrate, we examine affective polarization and partisan sectarianism, calculating how average opinions toward liberals, conservatives, and the major parties vary across groups of respondents defined by race and partisanship. Figure 2 presents the results, highlighting the relative extremity of ChatGPT responses, especially among Democrats, that is masked when averaging over partisanship in Figure 1. These differences are substantively meaningful, amounting to 0.5–1 standard deviations of the ANES distribution of attitudes, and 10–20 points on the 100-point thermometer scale. In particular, these results suggest that Democrats like liberals more, and conservatives less, than their human counterparts, exaggerating the out-group antipathy along ideological lines. Similar extremism is found among Republicans, especially among non-Hispanic Black Republicans. In general, the patterns reported in Figure 2 highlight that synthetic responses would suggest that society is more politically hostile than it actually is.
Average feeling thermometer results (x-axis) for different target groups (y-axes) by party ID of respondent (columns). Average ANES estimates from the 2016 and 2020 waves indicated with red triangles and one standard deviation indicated with thick red bars. LLM-derived averages indicated by black circles and thin black bars. Sample sizes for each groupwise comparison are identical.
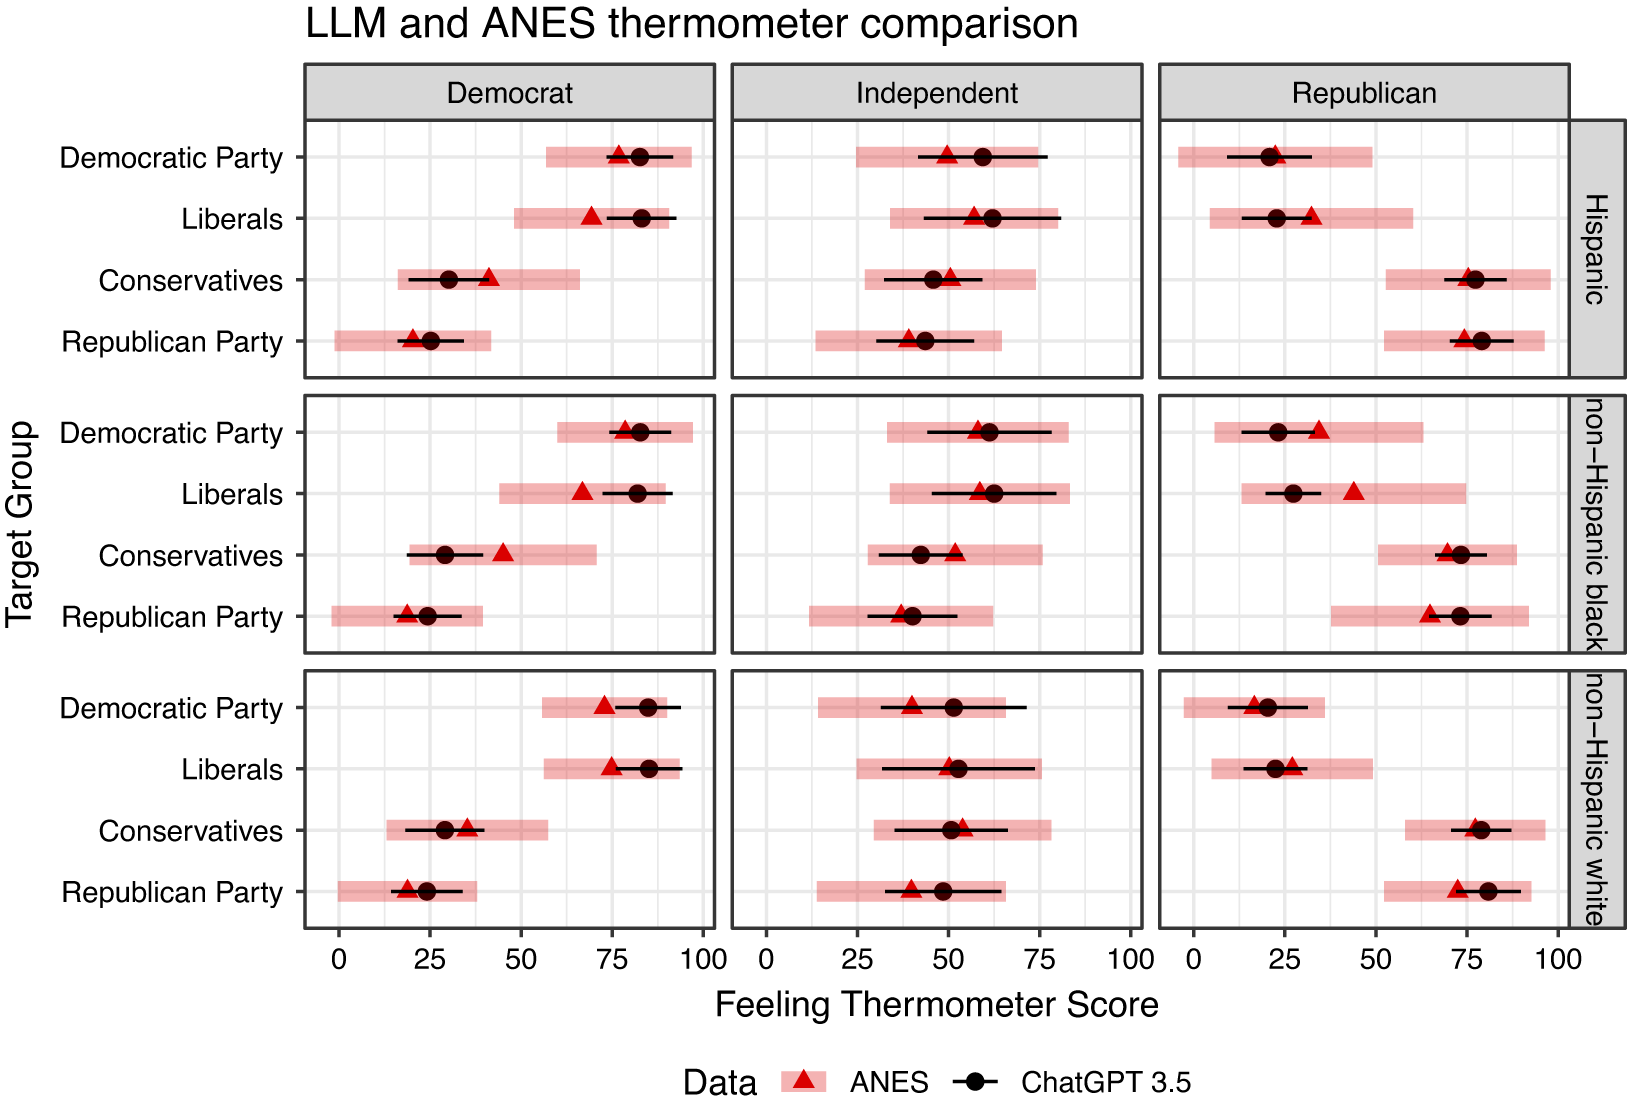
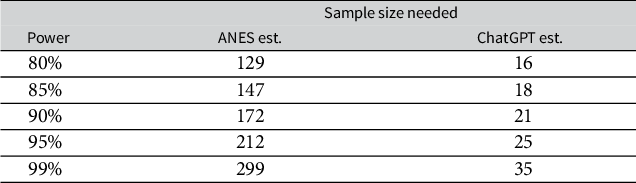
Figure 2 also reveals far smaller standard deviations in the synthetic estimates than found in the ANES. Beyond the substantive concerns with this overconfidence, the undersized variance of synthetic responses poses serious inferential problems for attempts to use such data for pre-analysis study design as some scholars have suggested (Argyle et al. Reference Argyle, Busby, Fulda, Gubler, Rytting and Wingate2023).Footnote 20 Consider, for example, using synthetic opinions from ChatGPT to conduct a power analysis for a human-respondent test of whether partisan affective polarization has increased since 2012, when the average gap between in-party and out-party assessments among partisans in the ANES was 47.4. Table 1 reports the results. Using the estimates of the magnitude and variation in the ChatGPT-generated measures of affective polarization, we calculate the sample size required to detect a difference from the 2012 level at various levels of power. As a baseline, we perform the same power calculation using the magnitude and variation in feeling thermometer scores from our ANES comparison set. Even for 99% power, the ChatGPT estimates imply that just 33 partisan respondents would be necessary to detect a difference from affective polarization in 2012—almost an order of magnitude less than what we calculate from the ANES benchmark.
Calculations of the sample size necessary for a specified power to reject the null hypothesis of no difference in affective polarization among partisans from the average level in the 2012 ANES, assuming a 95% significance level. The second column records the calculation if we assume an effect size and variance equal to the 2016–2020 pooled ANES values (size 7.8, sd 31.4); the third column is the same calculation with our ChatGPT estimates (size 12.5, sd 16.1).
2.2 Accuracy of Estimated Regression Coefficients
Although synthetic data sometimes look reasonably accurate—albeit with too little variation—in the aggregate, more concerning problems emerge when looking at conditional relationships. To test whether the correlational structure of the synthetic data corresponds to the ANES benchmark, we examine differences in regression results obtained using true and synthetic feeling thermometers as the dependent variable. This is a critical test for political science research in particular, where scholars are typically interested in the correlates of public opinion rather than in broad averages.
We estimate linear regression models of the following form:
 $$ \begin{align} \text{FT}_{i, d} = \alpha + \gamma \mathbb{I}_d + \pmb{\beta} \cdot \mathbf{x}_i + \pmb{\lambda} \cdot (\mathbb{I}_d \mathbf{x}_i) + \epsilon_{i, d}, \end{align} $$
where i indexes respondents, d indexes data source (ANES or ChatGPT), $\mathbb {I}_d$
is an indicator for the data source being ChatGPT, and
$\mathbb {I}_d$
is an indicator for the data source being ChatGPT, and $\mathbf {x}_i$
is a vector of the respondent characteristics used in our persona prompt (age, gender, race, education, income, marital status, ideology, party ID, voter registration status, and interest in news and politics). We are most interested in the vector of
$\mathbf {x}_i$
is a vector of the respondent characteristics used in our persona prompt (age, gender, race, education, income, marital status, ideology, party ID, voter registration status, and interest in news and politics). We are most interested in the vector of $\pmb {\lambda }$
coefficients measuring how the partial correlation between each covariate in
$\pmb {\lambda }$
coefficients measuring how the partial correlation between each covariate in $\mathbf {x}_i$
and the feeling thermometer score differs between the synthetic responses and the ANES benchmark.
$\mathbf {x}_i$
and the feeling thermometer score differs between the synthetic responses and the ANES benchmark.
We run the specification in Equation (1) for each combination of feeling thermometer (the 11 target groups in Figure 1) and survey year (2016 or 2020), for 22 total regressions. Figure 3 plots the resulting coefficient estimates estimated using the ANES (x-axis) versus the synthetic data (y-axis), broken out by the predictor. Points are shaded based on whether the coefficients estimated on the synthetic data are significantly different from those estimated on the ANES (i.e., the p-value for the $\hat {\lambda }$
estimate is less than 0.05). Points closer to the 45-degree line indicate a better correspondence between the conclusions an applied researcher would draw using either human or synthetic datasets. Points in the off-diagonal quadrants (upper left and bottom right) are coefficients whose sign differs depending on which data source we employ, meaning that substantive conclusions drawn in the human sample would be reversed in the synthetic sample.
$\hat {\lambda }$
estimate is less than 0.05). Points closer to the 45-degree line indicate a better correspondence between the conclusions an applied researcher would draw using either human or synthetic datasets. Points in the off-diagonal quadrants (upper left and bottom right) are coefficients whose sign differs depending on which data source we employ, meaning that substantive conclusions drawn in the human sample would be reversed in the synthetic sample.
Each point describes the coefficient estimate capturing the partial correlation between a covariate and a feeling thermometer score toward one of the target groups, estimated in either 2016 or 2020. The x-axis position is the coefficient estimated in the ANES data, and the y-axis position is the same coefficient estimated in the synthetic data. Solid points indicate coefficients who are significantly different when estimated in either the ANES or synthetic data, while hollow points are coefficients that are not significantly different. Points in the northeast and southwest quadrants generate the same substantive interpretations, while those in the northwest and southeast quadrants produce differing interpretations. A synthetic dataset that is able to perfectly recover relationships estimated in the ANES data would have all points falling along the 45-degree line.
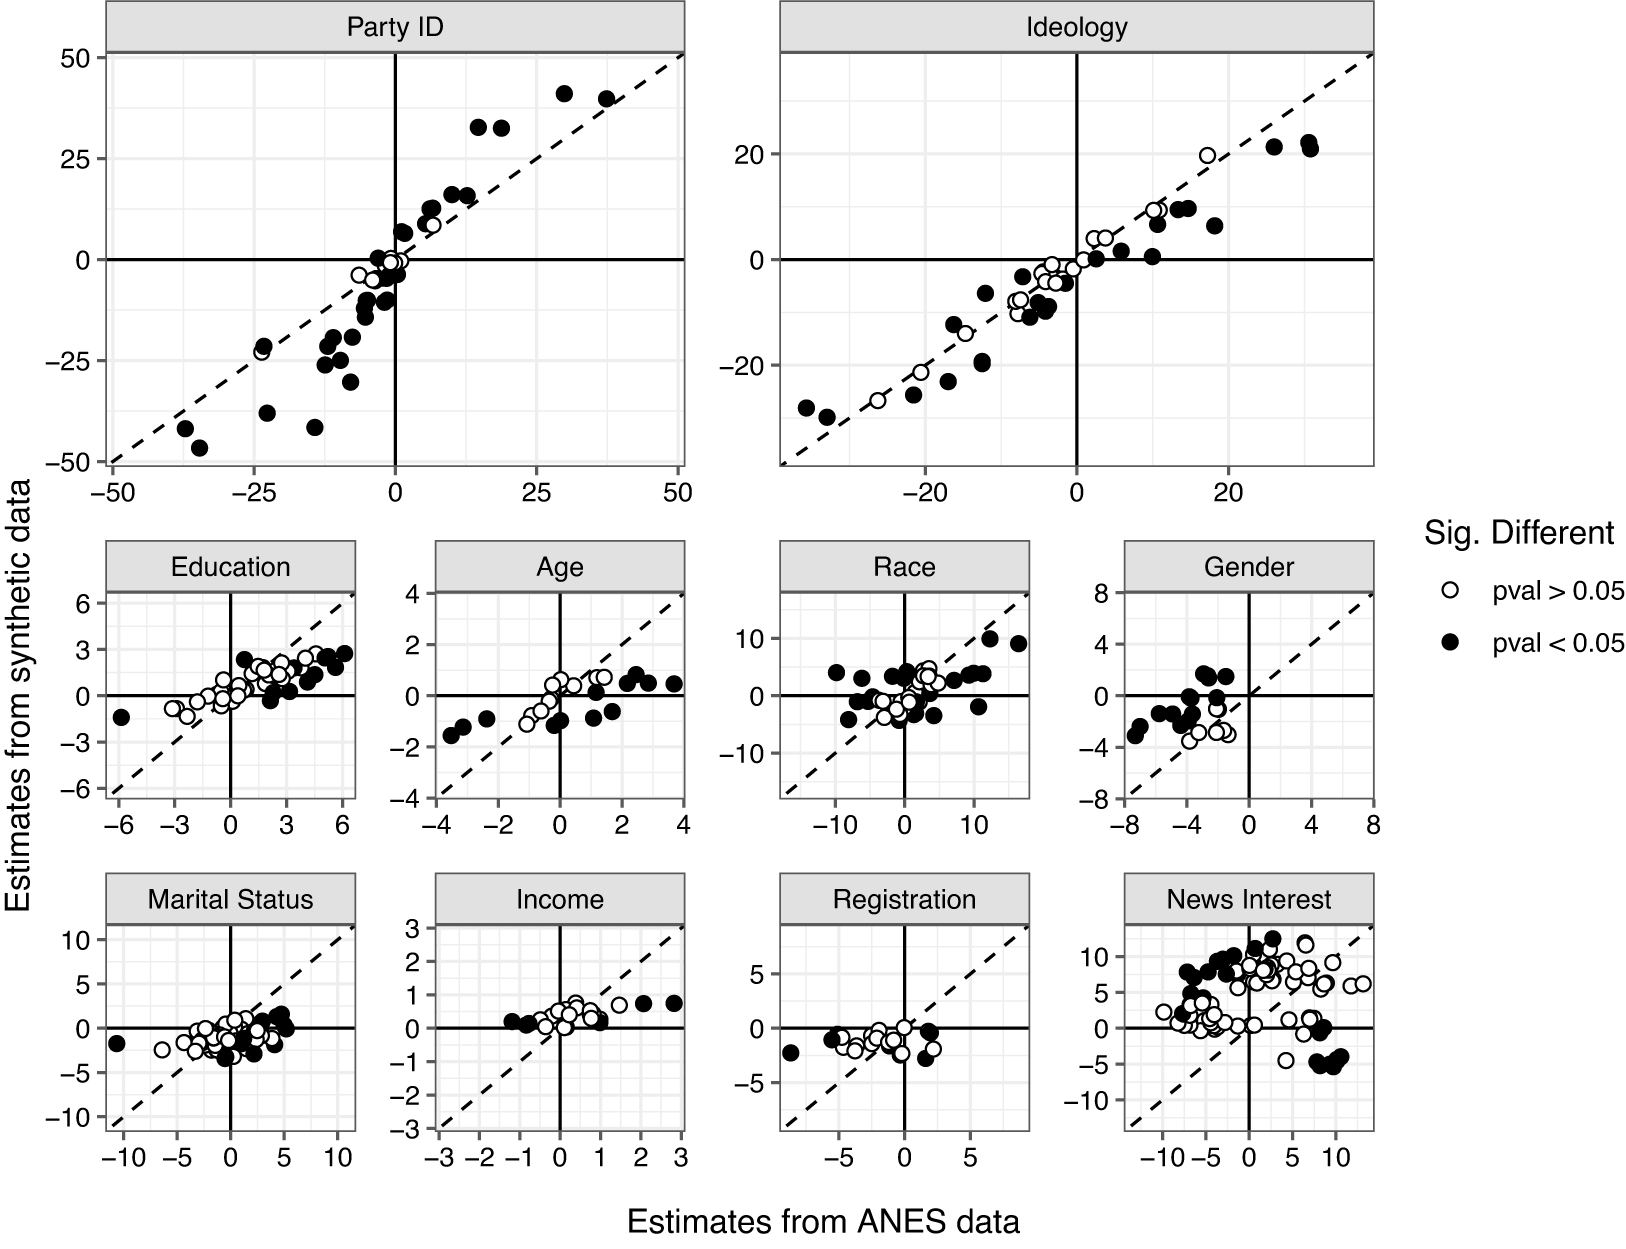
The plot highlights the degree to which the synthetic data are influenced by political covariates. The ideology measure performs best, with points lying close to the 45-degree line, many of which do not differ significantly between the datasets. Partisanship also exhibits a strong positive association, although the apparent S-shape suggests that the associations between partisanship and the battery of feeling thermometers are stronger in the synthetic data than in the human data. Conversely, we document far worse performance among other covariates, in several instances leading to substantively different conclusions—sometimes with opposite signs—than what we would learn from the actual ANES.Footnote 21
3 Sensitivity of Synthetic Responses
In the course of our research establishing these problems, we uncovered additional concerns about the reliability and replicability of synthetic sampling via ChatGPT. Specifically, we find that the distribution of responses is highly sensitive to differences in the prompt used to generate data, which version of ChatGPT is used, and even changes over time in the “same” model. Similar to the concerns about the effects of a “garden of forking paths” (Gelman and Loken Reference Gelman and Loken2014), the differences we find highlight the fact that extracting responses from an LLM inevitably requires making data-dependent analytical decisions that introduce stochastic error into the data generating process that cannot be sensibly calculated or corrected.Footnote 22
3.1 Effect of Different Prompts
One unavoidable issue with using LLMs is that different prompts may affect the accuracy of responses. To investigate, we recollect the synthetic data with two modifications to the description of the persona. The first prompt only describes the nonpolitical profile of the synthetic respondent, including their age, gender, race, marital status, education, and income. The second prompt only includes a description of the synthetic respondent’s political characteristics, including their ideology, partisanship, registration status, and interest in news and politics. By way of comparison, the full prompt used in earlier results includes all attributes in a single description. The raw code for these prompts is given below, where the placeholder text is indicated with a capitalized characteristic in square brackets, which would be replaced with a description for the relevant ANES respondent as described above:Footnote 23
-
• Demographics only: “It is [YEAR]. You are a [AGE] year-old [MARST] [RACETH] [GENDER] with [EDUCATION] making [INCOME] per year, living in the United States.”
-
• Politics only: “It is [YEAR]. You are [IDEO], [REGIS] [PID] who [INTEREST] pays attention to what’s going on in government and politics, living in the United States.”
-
• Combined: “It is [YEAR]. You are a [AGE] year-old, [MARST], [RACETH] [GENDER] with [EDUCATION] making [INCOME] per year, living in the United States. You are [IDEO], [REGIS] [PID] who [INTEREST] pays attention to what’s going on in government and politics.”
We investigate the sensitivity by predicting the mean absolute error (the absolute difference between the ANES feeling thermometer and the LLM’s estimate; MAE) as a function of the prompt type interacted with the target group and the party ID, controlling for all other covariates. As illustrated in Figure 4, the mean absolute error is basically identical between the full prompt and politics-only prompt. However, failing to include information on the respondent’s politics dramatically inflates the error for certain groups, notably those groups which are more politically salient (the parties, ideological groups, gays and lesbians, and Muslims). Political descriptions do not dramatically change the LLM’s errors when it comes to predicting the feeling thermometers toward racial or religious groups, except for Muslims.
Mean absolute error (MAE; x-axes) associated with different target groups (y-axes) by partisanship (columns) for different prompts to generate the synthetic data. MAE is calculated as the absolute difference between the human respondent’s feeling thermometer score for a given target group in the ANES data, relative to the average of 30 synthetic respondents drawn who match the human respondent in terms of their demographics only (light gray circles), political attributes only (dark gray triangles), or both demographic and political attributes combined (black squares).
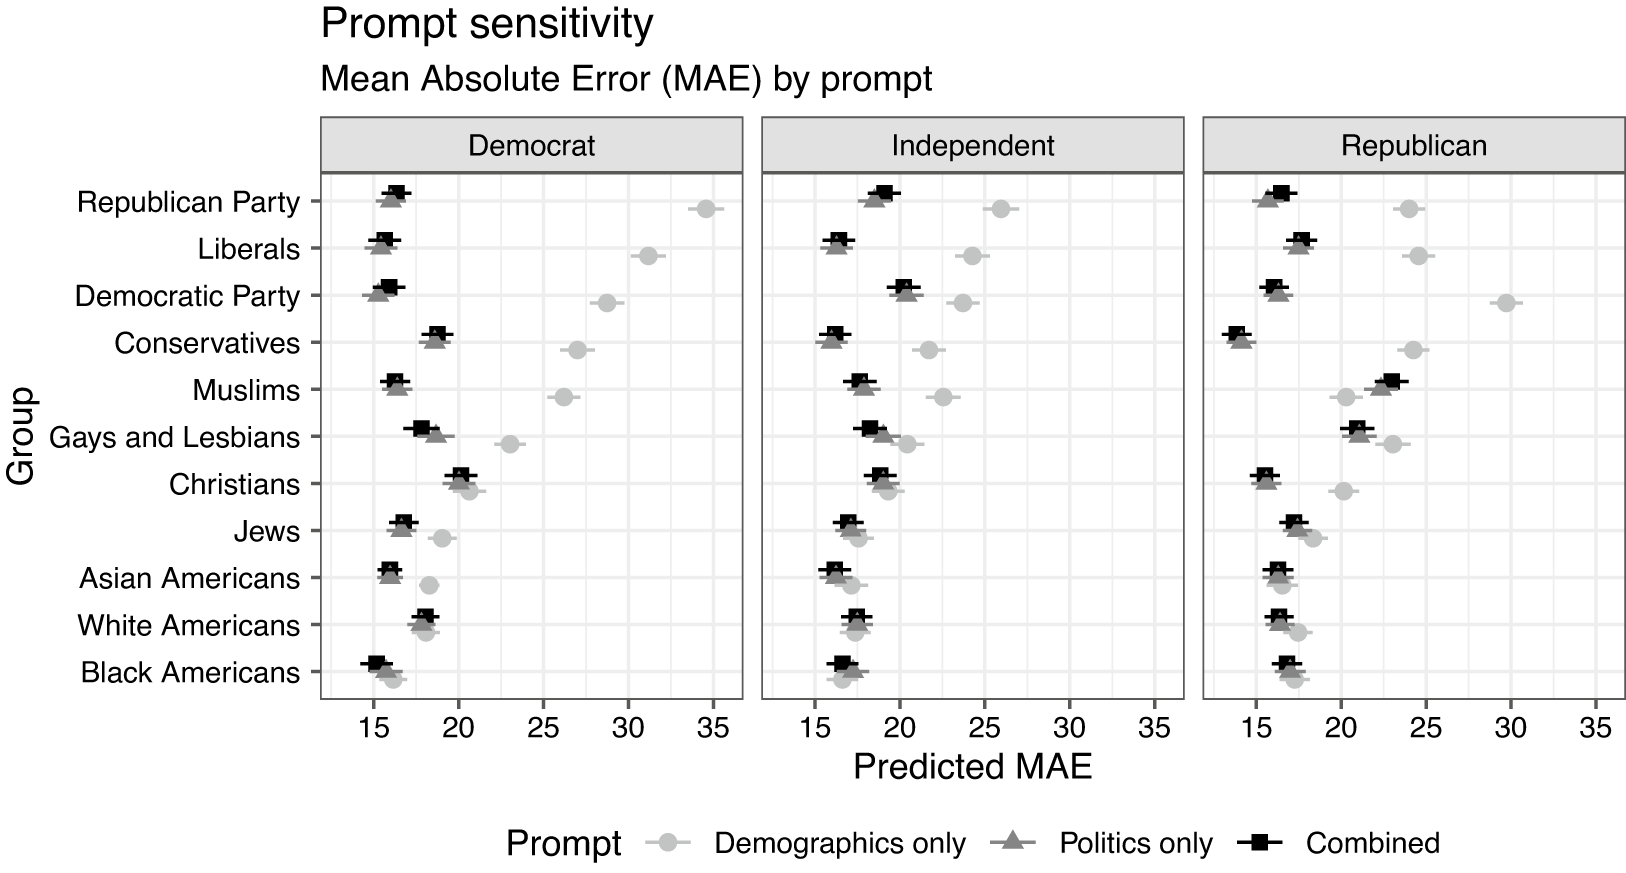
On one hand, the differences we find are reassuring—the pattern of responses improves when we include information on self-identified partisanship that we know is related to opinions. The fact that accuracy improves when we include information that is known to be associated with public opinion suggests that the responses vary in broadly consistent ways.Footnote 24 But even with the partisan prompts, considerable errors remain, and the variation in the changes we observe across various prompts highlights the importance of the prompt being used and the unknown associations that the LLM leverages to generate those responses.Footnote 25
These findings on prompt sensitivity raise important questions for interpreting and extrapolating prompting practices. The variation in accuracy we find when applying similar prompts to different questions and non-U.S. contexts in SI Section 13 reveals how the same prompt can yield different levels of accuracy in ways that raise questions about the ability to develop generalizable prompting practices.Footnote 26
3.2 Effect of Changes in ChatGPT over Time
A second issue is whether the same prompt produces similar responses over time. This is a key question for the reproducibility of LLM-based research, as well as the reliability of conclusions based on synthetic data. To explore the impact of changes over time, we ran a simpler version of our main prompt three times: April 2023, June 2023, and July 2023.Footnote 27 In the interim between our June and July runs, OpenAI upgraded its default 3.5 Turbo version of ChatGPT on June 25, 2023, promising that the original would be accessible until September 2023.
These three snapshots of synthetic data produced from the same prompt allow us to characterize the degree to which such data are “reproducible” in two ways. First, are researchers able to exactly recover the same responses (dataset) using the same prompts over time? Second, even if the precise responses may vary, do patterns and correlations between the responses vary in ways that would change the characterization of relationships within the synthetic data? These questions speak to broader concerns over how the LLM training and updating process affects replication.
Figure 5 plots our April results (x-axes) against the June/July results (y-axes) using identical prompts. Each point is the count of human-synthetic observations that share a given April-June/July coordinate FT score, aggregating over all target groups. Perfect replication would produce a 45-degree line, which we indicate with a dashed red line.
Reproducibility of synthetic data over time. Both plots compare the synthetic dataset generated by a simple prompt gathered in April of 2023 to the identical prompt rerun in June (left facet) and July (right facet) of the same year. Each point indicates the number of observations associated with April versus later synthetic datasets, aggregating across respondents and target groups. Linear regression equation indicated in the top left of both facets, revealing substantially attenuated differences between the April and July runs of the same prompt.
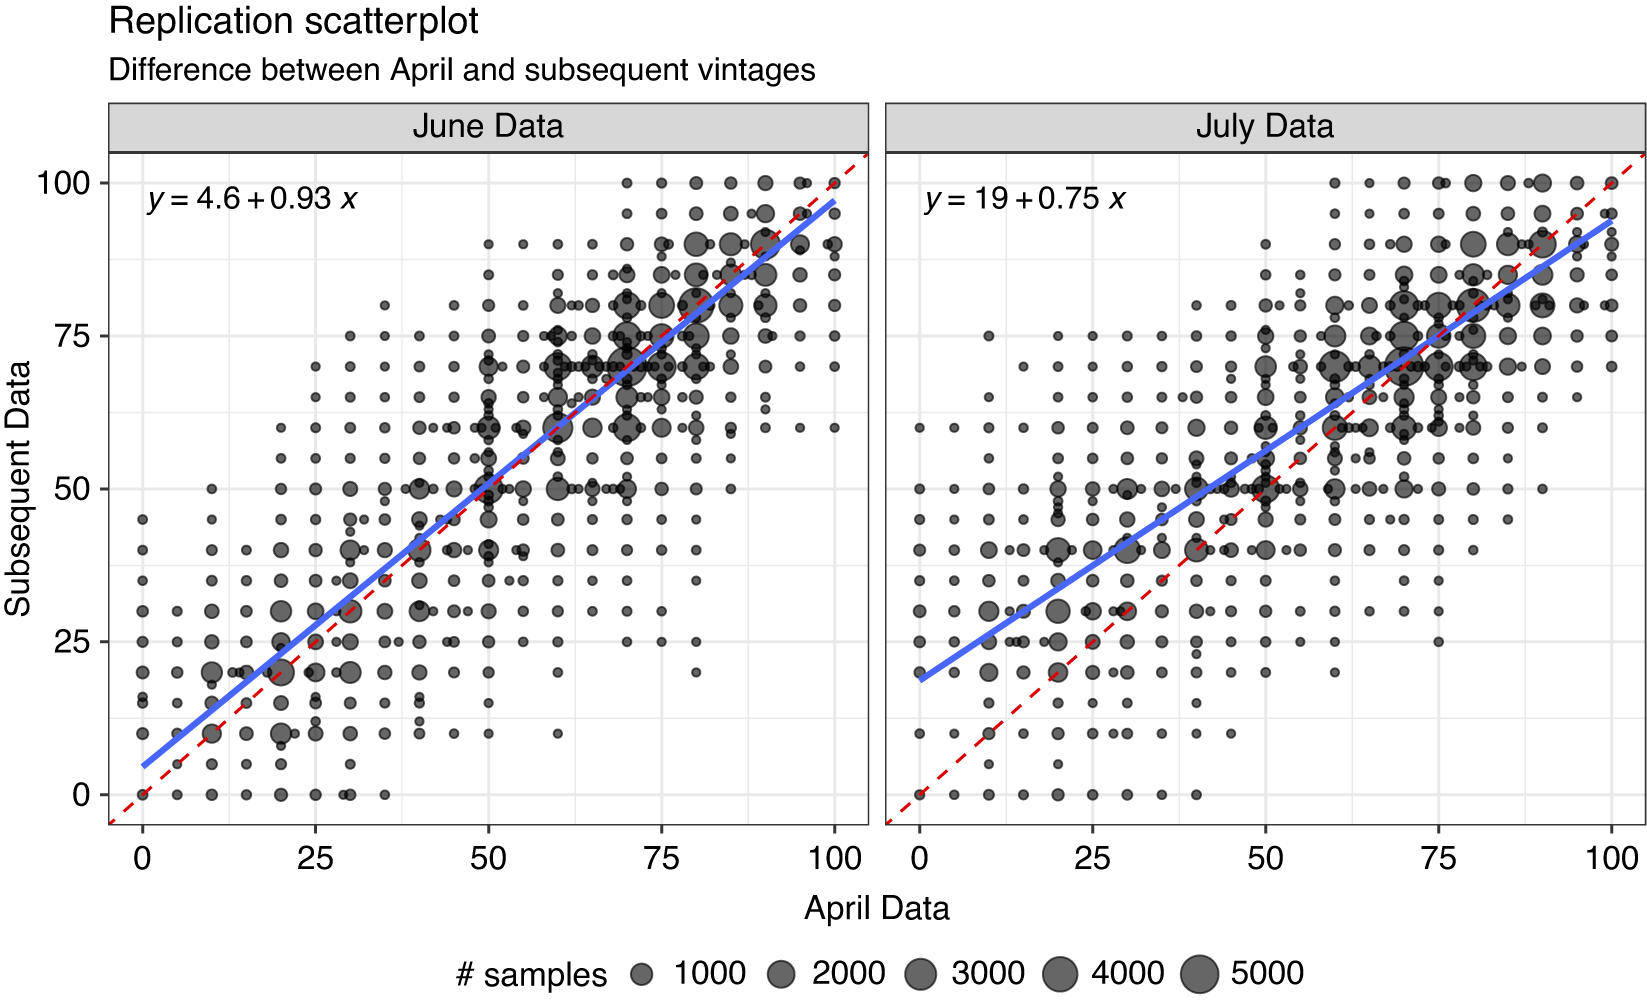
Neither recollection of our data exactly reproduces our original synthetic data. The June sample contains responses that are slightly less extreme than the original April data: the regression line is slightly “flatter” than the 45-degree line denoting equality (slope of 0.93), although it is not statistically distinguishable from a placebo test that randomly sampled the April data. In contrast, the July synthetic sample exhibits substantial mean reversion, with the coldest thermometer scores from prompt responses in April increasing and the warmest scores declining to a lesser degree.
The patterns in Figure 5 reflect the effects of two sources of variation in synthetic data generated by closed-source LLMs. As the left panel reveals, exactly replicating synthetic data was impossible at the time we ran this initial analysis in the spring and summer of 2023.Footnote 28 More concerning is the pattern revealed in the right panel, which shows how the same prompts may produce different synthetic responses because of changes being made to the LLM that are beyond the control of the researcher. Perhaps the flatter line indicates that tweaks based on reinforcement learning from human feedback prevented the AI from expressing the coldest feelings toward any outgroup in our data. Or perhaps new material was included in the LLM which changed the pattern of responses. Without knowing precisely what was done and how that affected the mapping from prompts to responses, it is impossible to know precisely why the responses changed.
Open-source models, which we discuss further in SI Section 14, raise their own set of reproducibility concerns. The most significant challenge is that researchers must either have institutional access to a GPU cluster or rent time from a cloud service. These resources have become especially scarce—and thus expensive—with the explosion of interest in AI and the ongoing global chip shortage. Additionally, it takes more programming expertise to deploy an open-source LLM than to query a commercial API for a closed model. Because both open-source and closed-source LLMs operate on a different computing paradigm than what political scientists are accustomed to, synthetic data pose new challenges for current standards of reproducibility.
4 Discussion and Implications
Human subjects are expensive and complicated. If scholars could replace them with LLM-based synthetic subjects, they could more easily collect information on public opinion, pretest survey questions, substitute the need to reach hard-to-reach populations, and so on. The allure of LLMs like ChatGPT is the ability to quickly and cheaply obtain data without dealing with the many complications and ethical considerations that are associated with human subjects research. The fact that LLMs do a remarkably good job at recovering average responses given by broad groups of respondents in the ANES makes their use tempting. However, our study reveals questions that warrant further investigation before relying on off-the-shelf LLMs as a substitute for characterizing public opinion (see, e.g., Aher, Arriaga, and Kalai Reference Aher, Arriaga and Kalai2023; Dillion et al. Reference Dillion, Tandon, Gu and Gray2023; Horton Reference Horton2023).
First, our findings raise questions about the algorithmic fidelity of LLMs that are not specifically trained to capture the complex interdependencies present among human survey respondents. Second, the precision of responses is excessively high, raising concerns about using synthetic responses for power analyses and research design. In principle, these two issues could possibly be improved by specifically training an LLM using similar survey data, and important work has begun to better understand the potential uses of pre-trained LLMs.
But even if prompt engineering and fine-tuning can produce synthetic samples that meaningfully reflect a particular human opinion within a specific context, several important and difficult questions remain. First, how confident can we be that practices and procedures in any given context are generalizable? As our SI demonstrates, replicating our approach in other contexts reveals a performance that is frequently different from, and also worse than, the patterns we document in the main text. We observe this when examining the same questions from a national online survey, different questions in other surveys conducted in the United States, and different questions in surveys conducted in other countries (see SI Sections 12 and 13). Second, comparison against a known ground truth is a useful way to assess the algorithmic fidelity of synthetic sample, but what about when the ground truth is unknown?Footnote 29 While neither is likely sufficient, other options include the proportion of null responses or the proportion of responses passing a prespecified “nonsense” test. Third, because prompt engineering combined with tuning can induce the synthetic data to draw a wide variety of conclusions in ways that change over time, does this suggest the need for preregistering prompts and fine-tuning and archiving historical LLMs to facilitate transparency and replicability? How do we account for the effect of these uncertainties and changes on our estimates?Footnote 30
Beyond these technological and statistical issues, questions related to the ethics of replacing human opinion with synthetic opinion generated from unknown and unknowable methods are also relevant. Relying on predictions generated by a model with unknown assumptions, trained on an unknown corpus, as a substitute for asking humans how they think and feel about the world is contrary to the origins and importance of public opinion research. Because surveys are often intended to check political power and track how opinions change over time and vary between groups, relying on available preexisting content to generate/extrapolate synthetic opinions risks hard-wiring the past into the present. Finally, as social scientists, we should be cognizant of the difference between characterizing the opinions and behavior of actual human beings—however imperfect and complicated those efforts may be—and studying outputs from an algorithm with unknown properties.
Acknowledgements
The authors are grateful to audiences at Vanderbilt University, Seoul National University, Korea University, Sungkyunkwan University, Yonsei University, KDI School of Public Policy and Management, and the 2024 annual conference of the Society for Personality and Social Psychology.
Author Contributions
All authors contributed to the manuscript and revisions. J.B. led the empirical analyses of ChatGPT. B.K. led the empirical analyses of Falcon-40B-Instruct.
Funding Statement
This research received no specific grant from any funding agency in the public, commercial, or not-for-profit sectors.
Competing Interests
The authors declare no competing interests.
Data Availability Statement
Replication code for this article is available in Bisbee et al. (Reference Bisbee, Clinton, Dorff, Kenkel and Larson2024) at https://doi.org/10.7910/DVN/VPN481.
Supplementary Material
For supplementary material accompanying this paper, please visit https://doi.org/10.1017/pan.2024.5.


 Open access