


Introduction
Understanding how monovalent cations substitute into quartz, as well as how rapidly, and how, they move, is important for considerations including electrical conductivity (Verhoogen, Reference Verhoogen1952; Hughes, Reference Hughes1975; Jain and Nowick, Reference Jain and Nowick1982), diffusion chronometry or more generally quartz compositional heterogeneity in volcanic systems (Biró et al., Reference Biró, Kovács, Király, Falus, Karátson, Bendő, Fancsik and Sándorné2016; Tollan et al., Reference Tollan, Ellis, Troch and Neukampf2019), the fidelity of quartz hosted melt and fluid inclusions (Rottier et al., Reference Rottier, Rezeau, Casanova, Kouzmanov, Moritz, Schlöglova, Wälle and Fontboté2017; Myers et al., Reference Myers, Wallace and Wilson2019), quartz rheology (Griggs and Blacic, Reference Griggs and Blacic1965; Mackwell and Paterson, Reference Mackwell and Paterson1985) and purification or controlled alteration of quartz by electro-diffusion ‘sweeping’ (King, Reference King1959; Brown et al., Reference Brown, O'Connor and Armington1980).
For these reasons, much experimental work has concentrated on obtaining independent determinations of the diffusion coefficients of the monovalent cations, mainly focussed on H and its isotopes (Kats, Reference Kats1962; Shaffer et al., Reference Shaffer, Sang, Cooper and Heuer1974; Kronenberg et al., Reference Kronenberg, Kirby, Aines and Rossman1986; Rovetta et al., Reference Rovetta, Blacic, Hervig and Holloway1989; Bachheimer, Reference Bachheimer1998; Jollands et al., Reference Jollands, Ellis, Tollan and Müntener2020a) though also including Li, Na and K (Verhoogen, Reference Verhoogen1952; Rybach and Laves, Reference Rybach and Laves1967; Frischat, Reference Frischat1970; Shaffer et al., Reference Shaffer, Sang, Cooper and Heuer1974; Sartbaeva et al., Reference Sartbaeva, Wells and Redfern2004; Rottier et al., Reference Rottier, Rezeau, Casanova, Kouzmanov, Moritz, Schlöglova, Wälle and Fontboté2017), as well as their substitution mechanisms (Staats and Kopp, Reference Staats and Kopp1974; Sibley et al., Reference Sibley, Martin, Wintersgill and Brown1979; Halliburton et al., Reference Halliburton, Koumvakalis, Markes and Martin1981; Hosaka and Taki, Reference Hosaka and Taki1981; Aines and Rossman, Reference Aines and Rossman1984; Paterson, Reference Paterson1986; Stalder and Konzett, Reference Stalder and Konzett2012; Baron et al., Reference Baron, Stalder, Konzett and Hauzenberger2015; Frigo et al., Reference Frigo, Stalder and Hauzenberger2016; Müller and Koch-Müller, Reference Müller and Koch-Müller2018; Potrafke et al., Reference Potrafke, Stalder, Schmidt and Ludwig2019; Jollands et al., Reference Jollands, Blanchard and Balan2020b). The fact that the system remains the target of active study >130 years after the first published conductivity measurements in quartz (Tegetmeier and Warburg, Reference Tegetmeier and Warburg1887; Curie, Reference Curie1889), which were more-or-less contemporaneous with the first observations of the presence of O–H groups within quartz (Merritt, Reference Merritt1895; Königsberger, Reference Königsberger1897), is testament to its importance. For more information regarding H incorporation and diffusion in quartz, as well as various physical, chemical and geological implications, see the recent review by Stalder (Reference Stalder2021).
Notwithstanding the considerable amount of research, absent from the literature are descriptions of experiments wherein H is diffused into quartz at elevated pressure and temperature, and the resulting profiles of H content versus distance are measured using Fourier-transform infrared (FTIR) spectroscopy. This technique has now become widely accepted as a tool for considering H diffusion in other nominally anhydrous minerals (e.g. Demouchy and Mackwell, Reference Demouchy and Mackwell2006). Not only can diffusion coefficients be determined using this method, but the contributions of individual H-bearing defects to total H can be resolved, and the specific shapes of profiles in concentration vs. distance space can be used to elucidate diffusion mechanisms.
The diffusion of H in quartz has been proposed to occur by the movement of H along some fast pathway, followed by immobilisation of that H when it moves into association with stationary Al (Hughes, Reference Hughes1975; Jain and Nowick, Reference Jain and Nowick1982; Kronenberg and Kirby, Reference Kronenberg and Kirby1987). This is discussed in more detail below, though, importantly, the corollary of invoking such a diffusion mechanism would be diffusion profile forms that do not necessarily correspond to error-function shapes (e.g. Dohmen et al., Reference Dohmen, Kasemann, Coogan and Chakraborty2010; Bloch et al., Reference Bloch, Jollands, Devoir, Bouvier, Ibañez-Mejia and Baumgartner2020). However, in our previous study (Jollands et al. Reference Jollands, Ellis, Tollan and Müntener2020a), where H was diffused out of quartz, coupled with in-diffusion of Li or Na, we consistently observed profiles that could be fitted to error-function forms. This discrepancy between prediction and observation forms the motivation for the present study, which describes experiments that can be considered broadly as the reverse of those presented by Jollands et al. (Reference Jollands, Ellis, Tollan and Müntener2020a) i.e. wherein H, or 2HFootnote *, is diffused into quartz crystals rather than being diffused out.
Herein, experiments are described wherein different natural quartz crystals containing trace concentrations of H and Li were annealed at 800°C and 0.1 GPa together with H2O or 2H2O at controlled pH. These experiments show H or 2H gain into, and Li loss out of, the quartz crystals. Regardless of the relatively simple experimental design, the diffusion profiles of H (and 2H, Li) are complex, and rarely conform to error-function shapes. These results can be explained by invoking the aforementioned model (Hughes, Reference Hughes1975; Jain and Nowick, Reference Jain and Nowick1982; Kronenberg and Kirby, Reference Kronenberg and Kirby1987), which are also capable of explaining qualitatively why simple error-function forms were observed by Jollands et al. (Reference Jollands, Ellis, Tollan and Müntener2020a).
Methods
Starting materials
Cubes cut from three of the crystals used and characterised in a previous study considering H diffusion in quartz (Jollands et al., Reference Jollands, Ellis, Tollan and Müntener2020a) were again used for this study. These were two sections of a single quartz slab cut from two Tibetan crystals (TIB2 and TIB6), and a crystal of Brazilian quartz (BRA3). In the previous study, TIB2 is denoted Q2, and TIB6 is Q6, both cut from crystal ‘TIB’. BRA3 was denoted Q5. These were chosen to represent a variety of H and Li contents. TIB2 has the highest H + Li, TIB6 the lowest and BRA3 is intermediate.
The only notable trace elements in these materials, as measured in Jollands et al. (Reference Jollands, Ellis, Tollan and Müntener2020a), are Al, Li, B, Ti and H. Generally Na and K were below detection limits. It is not possible to give initial concentrations in the exact crystals used for experiments, though concentration ranges for detected trace elements in the starting materials overall (wt. ppm) were: TIB2: 55–83 Al, 7.4–9.5 Li, 0.19–0.39 B, 0.23–0.53 Ti; TIB6: 2.1–13 Al, 0.4–1.6 Li; and BRA3: 9.4–21 Al, 2.1–3.6 Li, 0.08–0.5 Ti. Using the Thomas et al. (Reference Thomas, Koch-Müller, Reichart, Rhede, Thomas, Wirth and Matsyuk2009) absorption coefficient for quartz, the mean H contents for the starting materials (mean spectrum, extracted from the FTIR maps in figure 1a of Jollands et al. (Reference Jollands, Ellis, Tollan and Müntener2020a), then resolved to remove non-OH components), as wt. ppm H2O, are: TIB2 12.0; TIB6 1.5; BRA3 3.6. As the cubes were cut from areas of larger crystals chosen due for their homogeneity in terms of H2O content, there is no reason to assume any systematic gradients in any trace-element contents (e.g. pre-existing diffusion profiles, or other concentration profiles).
Example spectra (total absorbance) from cores (dotted lines) and rims (solid lines) from all experiments. Both the O–H and O–2H stretching regions are shown, where appropriate.

Experimental methods
Hydrogen in-, lithium-out (H-in/Li-out) experiments
These and all other experiments were conducted at the University of Lausanne. Gold tubing of 4.5 mm O.D. and 4.1 mm I.D. was cut into 20–35 mm lengths, which were cleaned using acetone, then triple crimped and welded at one end. The open capsules were then annealed over a propane flame, then cleaned with boiling concentrated HCl, acetone then ethanol and dried at 60°C. They were then packed with SiO2 powder, together with ~1.5 mm cubes of quartz and ~20 μL of milliQ or HCl–milliQ mixes to give room temperature and pressure pH of 1, 3, 5 or 7. One experiment was run at each pH condition. The experiments at pH1, pH5 and pH7 contained only one crystal of BRA3 – these samples are denoted HQHP-pH1, HQHP-pH5 and HQHP-pH7, respectively. The experiment at pH3 contained one crystal each of BRA3, TIB2 and TIB6, with the samples denoted HQHP-pH3, HQHP-TIB2 and HQHP-TIB6, respectively. Further experimental details are provided in Table 1. At run conditions, the pH values are 5.39, 6.38, 6.88 and 6.90, respectively (see column “pH (expt. P, T)” in Table 1), with log10K for the dissociation reactions of H2O (–13.8) and HCl (–9.79) calculated using SUPCRT (Johnson et al., Reference Johnson, Oelkers and Helgeson1992). Values obtained were extrapolated using the density correlation approach (Eugster and Baumgartner, Reference Eugster, Baumgartner, Carmichael and Eugster1987; Manning Reference Manning1994; Dolejs and Manning, Reference Dolejš and Manning2010). The program Soluble (Roselle and Baumgartner, Reference Roselle and Baumgartner1995) was used to calculate pH, using a Debye-Hückel activity model. Values of the pH in the text herein, refer to pH at room temperature (i.e. 1, 3, 5 and 7).
Experimental conditions. Each entry in the ‘Experiment’ column represents a single run. Some of the runs contained multiple crystals, these are each given individual sample IDs (final column). The experiment labelled ‘Pre-eq.’ was the pre-equilibration step before the H–2H exchange experiment (H2H). HCl was 1 M.

The open ends of the capsules were then flat crimped, welded closed, weighed, and left for >12 hr at ~110°C, then reweighed to verify no mass loss. Charges were loaded into cold-seal pressure vessels which were pressurised (0.1 GPa, N2 pressure medium), and pre-heated to 800°C, with temperatures monitored using type-K thermocouples (further information is provided in the Supplementary Appendix, see below for details). The capsule was then introduced into the hot spot and left for 1 hr using a magnetic system (e.g. Matthews et al., Reference Matthews, Linnen and Guo2003). At the end of the runs, the samples were removed from the hot spot and the bombs were cooled down by blowing with compressed air – thus cooling from run temperature to <200°C in a few minutes. The vessels were then depressurised and charges were recovered and re-weighed to ensure that water was retained through the experiment. Capsules were then opened and the crystals, none of which were cracked, were recovered and mounted in 1 inch epoxy discs, with the c axis of the crystal in the plane parallel to the face of the disc.
The epoxy discs were then prepared as thick sections (~400 μm thickness) for FTIR spectroscopy, ensuring that the section represented approximately the core of the quartz cube. One side was polished (1–3 μm diamond) and the other side was flattened with alumina slurry (>15 μm grit) only. It was found that the latter preparation gave more consistent ablation behaviour when conducting laser ablation inductively coupled plasma mass spectrometry (LA-ICP-MS) analyses with our system.
Deuterium-in, hydrogen-out (2H-in/H-out) experiment
This experiment is denoted HQHP-H2H. For a true H–2H exchange experiment, the only exchange should be between H and 2H. Thus, Li or other monovalent cations should be eliminated from the crystal before the experiment. Such experiments must be undertaken in two steps, firstly to equilibrate (or metastably equilibrate) fully the crystal with H at the run conditions, followed by exchange with 2H (e.g. Kurka et al., Reference Kurka, Blanchard and Ingrin2005; Novella et al., Reference Novella, Jacobsen, Weber, Tyburczy, Ryerson and Du Frane2017).
To this end, crystals of BRA3 were placed into Au capsules with a H2O–HCl mix at pH3, welded, as above, then annealed at 800°C, 0.1 GPa for 53.5 hr. The crystals were then recovered, as above. One crystal was doubly polished and analysed for homogeneity by FTIR spectroscopy (further information is provided in the Supplementary Appendix).
One other crystal was then placed into an Au capsule with nearly pure 2H2O and welded closed, as with the H-in/Li-out experiments. To set the pH, and to avoid large changes in the H/2H ratio of the 2H2O, 0.6 μL of 1 M HCl was added to a 0.6 mL vial of 2H2O (99.99%, Sigma Aldrich) as it was opened. Capsules were filled and welded within ~2 hr of opening the vial of 2H2O, which was not re-used, so H–2H exchange with the atmosphere should be negligible. This experiment was then run as with the H-in/Li-out experiments, for 1 hr at 800°C, 0.1 GPa. Following the experiment, the crystal was mounted in epoxy and prepared for FTIR and LA-ICP-MS analyses, as above.
Deuterium-in, hydrogen and lithium-out (2H-in/H + Li out) experiments
The experimental method was a hybrid of the H-in/Li-out and 2H-in/H-out experiments. Crystals of TIB2, TIB6 and BRA3 were welded into an Au capsule with SiO2 powder and pH3 2H2O, then run at 0.1 GPa, 800°C for 1 hr, and the crystals were recovered and prepared as above. The samples are denoted DQHP-TIB2, DQHP-TIB6 and DQHP-BRA3. For reasons described above, these experiments cannot be considered as H–2H exchange experiments given the presence of Li in the starting material.
Analytical methods
FTIR spectroscopy
FTIR spectra were recorded at the University of Bern using a Bruker Tensor II spectrometer coupled to a Bruker Hyperion 3000 microscope, equipped with an XYZ imaging stage and a dry air-purged analytical chamber. Spectra were recorded (32–128 scans, 8 cm–1 resolution) using a single mercury cadmium telluride (MCT) detector, with a 25–40 μm × 150–200 μm on-sample aperture, with the long axis oriented parallel to the crystal edge. Such FTIR analyses sample a Gaussian volume within the sample (Ni and Zhang, Reference Ni and Zhang2008) with a full width at half maximum that may be considerably larger than the apparent sampling width determined by the nominal aperture size. Therefore, the diffusion coefficients reported herein can be considered maxima due to convolution effects (e.g. Jibamitra et al., Reference Jibamitra, Bhattacharya and S.1988; Jollands, Reference Jollands2020). Spectra were recorded every ~10–20 μm along a 1D profile parallel to the c axis. Whilst some profiles were also measured perpendicular to the c axis, the effective diffusion distances were generally only several tens of micrometres. This is to be expected, given the extreme anisotropy of diffusion for monovalent cations in quartz (e.g. Verhoogen, Reference Verhoogen1952; Frischat, Reference Frischat1970; Jollands et al., Reference Jollands, Ellis, Tollan and Müntener2020a), where diffusion parallel to the c axis is considerably faster than diffusion perpendicular to c. This effectively precludes quantitative descriptions of diffusivity or diffusion mechanisms perpendicular to the c axis – such short profiles will be strongly affected by convolution artefacts. Qualitatively though, this is in line with previous demonstrations of the diffusive anisotropy of H.
Data were processed by baseline subtraction using a concave rubberband algorithm (built into Bruker OPUS software) with 256 baseline points and 3 iterations. Further information is provided in the Supplementary Appendix. Correction to 1 cm thickness was done on baseline uncorrected data, using the orientation-independent relationship valid for both polarised and unpolarised light derived by Jollands et al. (Reference Jollands, Ellis, Tollan and Müntener2020a), based on the height of the 2675 cm–1 band from a linear baseline drawn between 2548 and 2750 cm–1.
Most analyses were done using polarised light, with each profile measured twice, once with E⟂c and once with E||c, giving total absorbance ∑Abs = 2×Abs(E⟂c)+Abs(E||c). Some measurements were done unpolarised, where we assume ∑Abs ≈ 4×Abs(unpol). The latter approximation is only valid for quartz measured on a plane including the c axis, because almost all absorbance in the OH stretching region occurs when E⟂c (e.g. Brunner et al., Reference Brunner, Wondratschek and Laves1961; Baron et al., Reference Baron, Stalder, Konzett and Hauzenberger2015; Potrafke et al., Reference Potrafke, Stalder, Schmidt and Ludwig2019), thus, in this plane, Abs(unpol) ≈ 0.5×Abs(E⟂c). Any spectra showing clear contamination by epoxy resin were removed. The distance between the first ‘uncontaminated’ spectrum and the crystal edge was measured using a photomicrograph for each profile.
The remaining spectra were resolved into a series of pseudo-Voigt peaks, as described in the Supplementary Appendix. Then, the resolved peaks were integrated and grouped together into defect associations (Table 2) based mainly on previous work (Sibley et al., Reference Sibley, Martin, Wintersgill and Brown1979; Halliburton et al., Reference Halliburton, Koumvakalis, Markes and Martin1981; Kronenberg, Reference Kronenberg, Heaney, Prewitt and Gibbs1994; Bachheimer, Reference Bachheimer1998; Stalder and Konzett, Reference Stalder and Konzett2012; Baron et al., Reference Baron, Stalder, Konzett and Hauzenberger2015; Frigo et al., Reference Frigo, Stalder and Hauzenberger2016). Herein, defects are described in the text body using ‘shorthand’ notation, with curly braces (the first column of Table 2). These and other defects referred to in this study are presented in end-member and Kröger-Vink notation in Table 2. Broadly, there are two classes of defects – those that are associated with Al3+ replacing Si4+ (e.g. {AlH}, {AlLi}), and those probably associated with excess O2– (e.g. {LiOH}). Visualisations of the atomic structures of these defects can be found in Jollands et al. (Reference Jollands, Blanchard and Balan2020b), their figures 4–7. The resolved peaks at 3190, 3205 and 3296 cm–1 (expressed as two bands due to overlap between the former two) are assigned to a Si–O vibration (Kats, Reference Kats1962). This assignment remains the subject of debate – Biró et al. (Reference Biró, Kovács, Király, Falus, Karátson, Bendő, Fancsik and Sándorné2016) suggests they might be related to surficial water, though this will not affect the results of this study given that neither represents structurally bound OH groups. The possibility that {HOH} is represented by a band at 3475 cm–1 is considered in the discussion.
The defects described in this study presented in shorthand notation together with their end-member formulae, as well as their description in Kröger-Vink notation. The latter is presented in two ways, one in which the H, 2H or Li are denoted simply as ‘interstitial’ with an ‘i’, and the other where the H or 2H (but not the Li) are assigned to an O, forming an OH group, i.e. as imaged by FTIR spectroscopy. The shorthand notation is used in the text, and the notation designated ‘Kröger-Vink (1)’ is used in all equations, with i sites numbered in equations where necessary.

LA-ICP-MS
LA-ICP-MS analyses were conducted using an Atlex 193nm laser housed inside an Australian Scientific Instruments RESOlution laser ablation system, equipped with a dual-volume Laurin Technic cell (S155), at the University of Lausanne. A 6×7 square grid of 38 μm laser spots, with ~70 μm spacing between points, was defined, then sheared by ~30° into an approximate parallelogram, such that each spot was slightly further from the interface than the last. Analyses were done between ~13–17 J cm–2 on-sample fluence and 30–40 Hz. The sample was ablated for 20 s, with 10–20 s background before and after each point. A standard (NIST SRM 610) was analysed after every 12 points – this was done at 10 Hz, 5 J cm–2 fluence. 29Si (internal standard), 7Li, 11B, 23Na, 27Al, 39K and 49Ti were counted for 0.01–0.1 s per sweep, giving a total sweep duration of 0.5–0.8 s. Data were processed using Iolite (Paton et al., Reference Paton, Hellstrom, Paul, Woodhead and Hergt2011). The first 4 s of each analysis were deleted to reduce the potential for surface contamination. Further information is provided in the Supplementary Appendix.
Results
FTIR spectra
H-in/Li-out experiments
Crystal core and rim spectra from these and all other experiments are shown in Fig. 1. As expected for a H-in experiment, spectra from the rims show consistently greater absorbance in the OH stretching region. In general, these are dominated by bands associated with {AlH}. The 3481 cm–1 peak, attributed to {LiOH}, which is present in some of the core spectra, is consistently absent in rim spectra. The near-rim spectra of sample HQHP-TIB2 show an additional band at 3475 cm–1, which was not present in the starting material. Both the rim and core spectra of sample HQHP-TIB6 show low absorbance of {AlH}, which is barely resolvable. There is no apparent effect of experimental pH on rim spectra, i.e. the rim spectra from experiments HQHP-pH1, -pH3, -pH5 and -pH7, all of which used the same starting material (crystal BRA3) are similar.
2H-in/H-out experiment
Following the initial long (53.5 hr) anneal prior to the diffusion experiment, the spectra showed only bands associated with {AlH}, with constant absorbance across the crystal (more information is provided in the Supplementary Appendix). Following the short (1 hr) diffusion experiment (HQHP-H2H), as with the 2H-in/H + Li-out experiments, the interface spectrum shows a decrease, but not total loss of, absorbance in the O–H stretching region. The only O–H stretching bands in the core are the triplet associated with {AlH} (Fig. 1). At the rim, the main band associated with {Al2H} at 2505 cm–1 is clearly visible. The other band of the doublet at 2473 cm–1 is not clearly visible, but is resolvable when the spectra are fitted. Spectra from this experiment show contributions from neither {LiOH} nor {LiO2H}.
2H-in/H + Li-out experiments
Crystal rim spectra (Fig. 1) show near-complete loss of absorbance in the OH stretching region relative to the core spectra. The peaks associated with {AlH} and {LiOH} are absent within the resolution of our technique (experiments DQHP-TIB6, DQHP-BRA3) or nearly so (DQHP-TIB2). This loss of absorbance in the O–H stretching region is associated with a gain in the O–2H stretching region. The peaks associated with O–2H bonds overlap with Si–O overtones, thus quantifying their absorbance requires spectra to be resolved into separate peaks, some of which are assigned to O–2H and others to Si–O. The {Al2H} defect is represented as a doublet at 2505 and 2473 cm–1. The {LiO2H} defect is expressed as a peak at 2572 cm–1.
We note that the presence of these peaks associated with O–2H does not appear to affect the validity of the thickness correction method, even though this used a band (2675 cm–1) in an overlapping wavenumber region.
Profile lengths and shapes
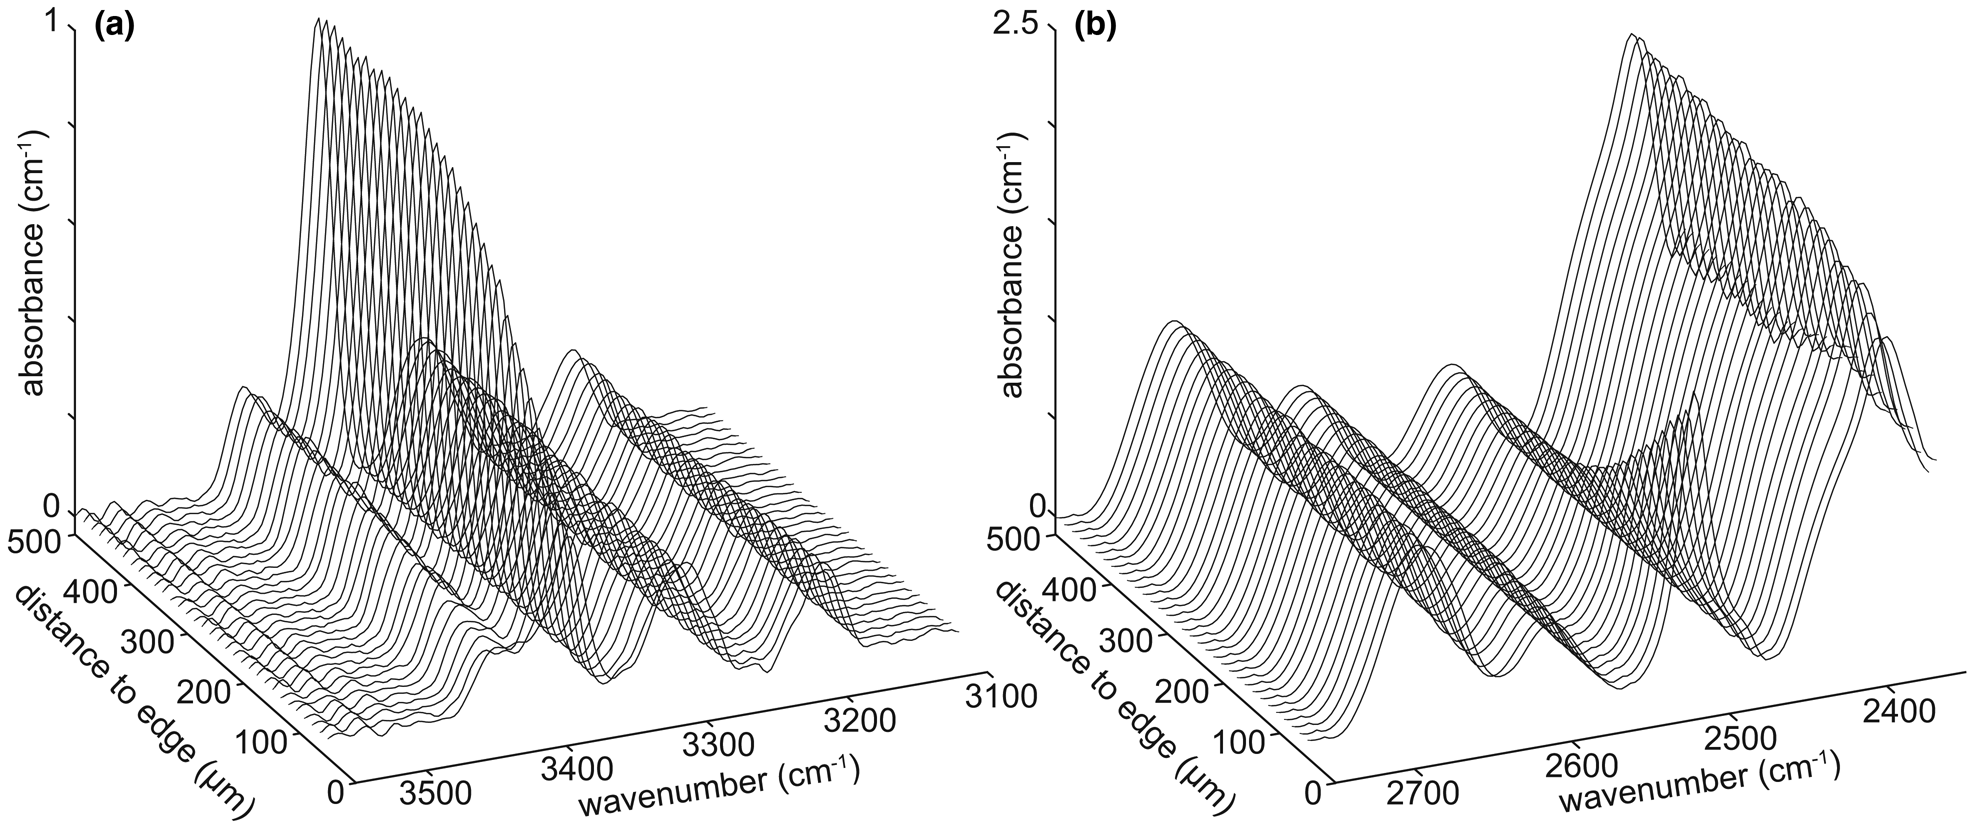
Spectra as a function of distance from the crystal edge for two experiments are presented in Fig. 2. Profiles of defect-specific absorbance (following resolution of spectra into pseudo-Voigt curves) and Li from each sample are presented in Fig. 3. For clarity, every plot in Fig. 3 is also presented in the Supplementary Appendix with expanded scales.
Example spectra as a function of distance from the interface for the 2H-in/H-out experiment HQHP-H2H. (a) Spectra from the O–H stretching region, showing H loss towards the interface. The main visible band is attributed to {AlH}. (b) Spectra from the O–2H stretching region, showing 2H gain towards the interface, with considerable overlap with various Si–O overtones. The main band showing a decrease in absorbance from rim to core is attributed to {Al2H}. The background (core) absorbance associated with O–2H bonds is indistinguishable from zero – the apparent high core absorbance is due to Si–O overtones.
FTIR profiles resolved into individual defect associations, together with the Li content measured by LA-ICP-MS. H-in/Li-out experiments are shown in panels (a)–(e) and (g), (i) shows the 2H-in/H-out experiment, and all others (f, h, j) show profiles from the 2H-in/H + Li-out experiments.

H-in/Li-out experiments
Profiles measured from experiments using the same starting material (BRA3) though with different pH (HQHP-pH1, -pH3, -pH5, -pH7) are similar, with no systematic variation in H concentration or profile form as a function of experimental pH. They all show {AlH}- and {LiOH}-versus-distance curves that do not correspond to an error-function shape (Fig. 3a, c, g, e). Rather, they show stepped shapes, with a relatively high absorbance, gently dipping section near the interface towards the core, then a sharp decrease towards background absorbance. Li profiles show the inverse trend: Li below detection limits near the rim, then an increase in Li towards the core. Whilst the effective profile lengths (600–700 μm) are not identical for the four experiments conducted at different pH conditions, there does not appear to be any systematic relationship between profile length and pH. The absorbance–distance curve associated with the {LiOH} defect shows a similar form to that associated with Li, albeit at much lower absorbance.
The {AlH} profile in experiment HQHP-TIB2 (Fig. 3b) shows a gradual decrease in absorbance from rim to core, with an approximate effective diffusion distance of ~600 μm. However, this profile is not consistent with an error-function form, as indicated by the near linear decrease in absorbance away from the crystal edge. Again, the Li profile approximately mirrors the {AlH} profile. The {LiOH} profile shows a stepped shape, with relatively high absorbance in the core, then a decrease towards the rim, and a flat, low absorbance section in the ~100 μm closest to the rim. The profile of the band assigned to {HOH} mirrors that of {LiOH} – this is the main reason for assigning the band to {HOH}. This is discussed in more detail below with regards to modelling the profiles and associated caveats.
The {AlH} and Li profiles in experiment HQHP-TIB6 appear to be relatively flat (Fig. 3d), however the absorbance, and Li contents, are so low that it is difficult to confidently describe these profiles, so they are not discussed further.
2H-in/H-out experiment
Profiles of absorbance versus distance of the bands attributed to {AlH} and {Al2H} from experiment HQHP-H2H show forms apparently describable as error functions (Fig. 3i), with {AlH} showing out-diffusion and {Al2H} showing in-diffusion, as expected given the experimental design. A series of spectra from this experiment, showing the variation from core to rim in both the O–H and O–2H stretching regions, is presented in Fig. 2. The profile lengths associated with both defects are equal at ~300 μm, which is shorter than the profile lengths from the H-in/Li-out experiments, which were run at the same P-T-t conditions.
2H-in/Li + H out experiments
These experiments consistently show profile forms and length scales that are considerably more complex than both the 2H-in/H-out and H-in/Li-out series. The absorbance of experiment DQHP-TIB2 (Fig. 3f) is dominated by the bands attributed to {Al2H}, which shows a near-linear decrease from rim to core in the first ~250 μm of the crystal, followed by a gradual decrease from ~250–~450 μm from the rim. The profile of absorbance attributed to {AlH} generally shows out-diffusion, but with maximum absorbance at ~ 300 μm from the rim, then a decrease in absorbance, appearing to reach background values at ~600 μm from the rim. {LiOH} and {LiO2H} profiles show forms approaching step shapes, and both are approximately 400 μm long. The Li profile is ~500 μm long showing out-diffusion, with a concave-up form in its near rim section, and a concave down section near the core, the latter being approximately consistent with an error function.
The profiles from experiment DQHP-BRA3 (Fig. 3h) show similar relative behaviour to DQHP-TIB2, albeit at much lower absorbance. The {AlH} profile shows a local absorbance maximum at ~300 μm from the rim. The main difference in profile forms between DQHP-BRA3 and DQHP-TIB2 is that, in the former, {Al2H} shows a near linear decrease from the rim directly towards background values, whereas in the latter, the absorbance approached the background values gradually. As with experiment HQHP-TIB6, DQHP-TIB6 (Fig. 3j) has low H, 2H and Li contents with considerable scatter, such that the data cannot be described in a meaningful way. This experiment is not discussed further.
Discussion
Developing a multi-site diffusion model
In the vast majority of studies of diffusion in geologically relevant crystals using in situ analytical methods, profiles of trace-element concentration (C) versus distance (x) from the diffusion interface had forms corresponding to the error function (e.g. Cherniak, Reference Cherniak2003). Such profiles can be fitted to equation 1, from which a diffusion coefficient, D, is obtained, when the time (t) is known.

C rim and C core are the concentrations at the crystal rim and core, respectively and erfc is the complementary error function. This relationship assumes 1D, concentration-independent diffusion in a semi-infinite medium, plane-sheet geometry, with constant boundary conditions (Crank, Reference Crank1975). In this study, the only sample showing such a profile geometry is sample DQHP-H2H, i.e. from the 2H-in/H-out experiment (Fig. 3i). This implies that, in general, it is not reasonable to describe this system using the above assumptions. However, given the experimental and analytical methods, there is no reason to assume that such geometrical and boundary conditions are inappropriate, and there is also no obvious reason to invoke concentration-dependent diffusion for H, especially at such low concentrations, and tests invoking different forms of concentration-dependent diffusion (linear and exponential) could not reproduce the observed profile shapes.
Rather, some of the profile shapes resemble diffusion coupled to inter-site reactions (Dohmen et al., Reference Dohmen, Kasemann, Coogan and Chakraborty2010). This describes a situation where a crystal has at least two sites on which the diffusant can sit, where each of the sites is associated with a certain diffusivity, and where it can move between the sites. Whilst this process can yield a variety of profile shapes, the most characteristic form in experiments with constant boundaries (in terms of both composition and position) is the step shape (e.g. Fig. 3a, c, g, e), though various other deviations from error-function forms have also been observed (Holycross and Watson, Reference Holycross and Watson2017; Bloch et al., Reference Bloch, Jollands, Devoir, Bouvier, Ibañez-Mejia and Baumgartner2020). This is broadly similar to the ‘trapping’ behaviour that has been well-known in metallurgy since the mid 1900s (Darken and Smith, Reference Darken and Smith1949).
There is an established precedent derived from conductivity studies for invoking such a model to describe H diffusion in quartz. Kronenberg and Kirby (Reference Kronenberg and Kirby1987), expanding on a model proposed by Hughes (Reference Hughes1975) and Jain and Nowick (Reference Jain and Nowick1982) described the process as follows: “diffusion of H at high temperatures requires the dissociation of Al-H pairs to form free $H_i^ \bullet$ followed by transport to neighboring $Al_{Si}^{\prime}$
 sites”, referring to the {AlH} defect, the major defect in most natural and some synthetic quartz (e.g. Halliburton et al., Reference Halliburton, Koumvakalis, Markes and Martin1981; Müller and Koch-Müller, Reference Müller and Koch-Müller2018; Tollan et al., Reference Tollan, Ellis, Troch and Neukampf2019). The implication is that the overall mobility of H should be a function of: (1) the rate at which free H can hop through the lattice; and (2) a constant describing dissociation of charge-neutral associations. This is expanded on below, considering each type of experiment in turn. Further information regarding all models, including curve fitting, is provided in the Supplementary Appendix.
H-in/Li-out experiments
For these experiments, we first consider that H moves by dissociation of ${\rm H}_{\rm i}^{\rm \bullet }$ (or ${}_{\rm \;}^ 2 {\rm H}_{\rm i}^{\rm \bullet }$
 , ${\rm Li}_{\rm i}^{\rm \bullet }$
 ) from its charge-balancing ion (${\rm Al}_{{\rm Si}}^{\rm ^{\prime}}$
 ), followed by hopping to a nearby position. The process is illustrated in cartoon form in Fig. 4.
Cartoon of the diffusion plus reaction concept modelled in this study. The initial condition is in (a), where one OH– group exists adjacent to an Al3+, and another Al3+ is charge-compensated by an interstitial Li, i.e. {AlLi}. Next, (b) the {AlH} dissociates, thus mobilises the H. (c) The mobile H moves. The model shows it moving towards the other Al3+; this would be better represented as a random walk, possibly hopping between O ions forming the c axis parallel double helix. In (d) there is an exchange reaction where the mobile H displaces the immobile Li. The cartoon shows this occurring simultaneously, though this may not be the case. Image (e) is similar to (c), but with the Li now mobile. In (f), the mobile Li moves into coordination with the Al from the previously dissociated {AlH}.

The dissociation of the {AlH} defect, which dominates the FTIR spectra (Figs 1 and 3) will be described by equation 2, where the H is described generically as ‘interstitial’ with an i:

A similar reaction should be possible for Li:

These reactions are equivalent to, for example, eqs. 1b and 1a, respectively, in Campone et al. (Reference Campone, Magliocco, Spinolo and Vedda1995) and eq. 1 of Jain and Nowick (Reference Jain and Nowick1982). That the H and Li are both given subscript i should not be taken to suggest that they occupy the same interstitial site: ${\rm \{ \ Al}_{{\rm Si}}^{\rm ^{\prime}} {\rm \ndash H}_{\rm i}^{\rm \bullet } {\rm \} \ }^\times$ can also be written (more correctly) as ${\rm \{ \ Al}_{{\rm Si}}^{\rm ^{\prime}} {\rm \ndash OH}_{\rm O}^{\rm \bullet } {\rm \} \ }^\times$
 , for example, and the Li probably occupies the large open channel parallel to the c axis.
For simplicity, we assume that in a simple H–Li exchange, it should be possible to combine the two reactions, upon which the ${\rm Al}_{{\rm Si}}^{\rm ^{\prime}}$ cancel out. In order to distinguish between the H or Li in ‘interstitial’ sites associated with Al (immobile), and those in a dissociated, mobile configuration, we use ‘i2’ and ‘i1’ for the former and latter, respectively. Herein, ‘i1’ always refers to an interstitial site where the occupying ion is free to move. Therefore, combining equations 2 and 3, and adding this notation, we have:

which describes the dissociation of {AlLi} and {AlH}, forming two mobile ions that swap places forming two new immobile defects. For the purposes of modelling, this is again simplified by removing the Al to give equation 5:

The method for modelling this process is described briefly here, with further details, including fitting routines, estimations of uncertainties, model limitations, etc., in the Supplementary Appendix. The method involves dividing the total model time into a series of small steps, i.e. the explicit finite difference method. Each time step comprises a diffusion step (Δx = 25 μm, Δt adjusted to maintain numerical stability), where the mobile H and Li diffuse (diffusion only on the i1 site, i.e. only ${\rm Li}_{{\rm i1}}^{\rm \bullet }$ and ${\rm H}_{{\rm i1}}^{\rm \bullet }$
 ), assuming that a single diffusion coefficient can describe both H and Li, then a reaction step where the reaction in equation 5 is modelled. This is done using the equilibrium expression (herein K1 for the reaction in equation 5) specified, using square brackets for concentration (now using units of atoms per 106 Si):

and with various constraints of mass balance and site balance imposed:


Solving these equations yields the concentrations of ${\rm Li}_{{\rm i1}}^{\rm \bullet }$ , ${\rm H}_{{\rm i1}}^{\rm \bullet }$
 , ${\rm Li}_{{\rm i2}}^{\rm \bullet }$
 and ${\rm H}_{{\rm i2}}^{\rm \bullet }$
 , which is possible if four of K1, ∑i1, ∑i2, ∑H and ∑Li are known (further information in the Supplementary Appendix). After the reaction step, diffusion occurs again, then reaction, and so on, until the total model time is reached. The final model output is a series of curves representing the concentration of each defect as a function of distance from the boundary, which are then fitted to the data using non-linear least-squares regression. Uncertainties (95% confidence intervals) for the fitted model parameters, K1 and D, were determined using the constant chi-squared boundary method (Press et al., Reference Press, Teukolsky, Vetterling and Flannery2007). The initial and boundary concentrations of ∑Li, ∑i1 and ∑i2 were set manually for each experiment. The best fit parameters and uncertainties are presented in Table 3 for the five H-in/Li-out experiments modelled in this way. The ∑i1 parameter is problematic, as we have no independent constraints on its value, so, for internal consistency only, this was set to either 0.1 or 1 atoms/106 Si. This is discussed further below with regards to model caveats.
Results from fitting the profiles described from the H-in/Li-out experimes, and some Li-in/H-out experiments from Jollands et al. (Reference Jollands, Ellis, Tollan and Müntener2020a).

Numbers in parentheses represent 95% confidence intervals using the constant chi-squared boundary method (for ‘fitted variables'). If no parentheses are shown, the value has been estimated visually ('fixed variables'). All concentrations are atomic, given per 106 Si. The asterisk * denotes experiments done using the same starting material (crystal BRA3).
Initial and boundary ∑Li are presented along with ∑i1 (mobile) and ∑i2 (immobile), ∑H values can be calculated from these. The ɛ values (absorption coefficients) were determined prior to fitting, assuming that the total concentration of monovalent cations remains constant along the profiles (see Supplementary Appendix). All fits were done using both ∑i1 = 0.1 and 1, for internal consistency only. ${\rm \chi }_{\rm v}^ 2$ is reduced chi-squared. K1 = equilibrium constant from equation 6.
Model fits for profiles from two H-in/Li-out experiments are presented in Fig. 5, showing that the model successfully reproduces the forms and lengths of the profiles.
Profiles of {AlH} and {AlLi} from experiments (a) HQHP-pH1 and (b) HQHP-pH5, fitted. The measured Li content is corrected to account for the {LiOH} defect. Model parameters: total time = 3600 s, Δx = 25 μm. Initial and boundary conditions: (a) ∑i1 (mobile) + ∑i2 (immobile, Al-associated) = 24.4 /106Si; ∑Li (initial) = 17.7 / 106Si; ∑Li (boundary) = 0 / 106Si. (b) ∑i1 (mobile) + ∑i2 (immobile, Al-associated) = 24.9 /106Si; ∑Li (initial) = 17.9 / 106Si; ∑Li (boundary) = 0 / 106Si. All other fit parameters (D, K, ${\rm \chi }_{\rm v}^ 2$ , ɛ) are provided in Table 3. Fits to data from other experiments are provided in the Supplementary Appendix.

{AlH} and {LiOH} defects in H-in/Li-out experiments
A limitation of the model development above is that it did not consider the {LiOH} defects that are visible in the FTIR spectra of most experiments as a band at ~3481 cm–1 (e.g. Baron et al., Reference Baron, Stalder, Konzett and Hauzenberger2015; Frigo et al., Reference Frigo, Stalder and Hauzenberger2016). Adding this defect adds considerable complexity and is only treated briefly here (a detailed description is provided in the Supplementary Appendix), and non-linear least-squares regressions were not attempted – all fitting was done visually only.
As with the reactions presented above, we assume that {LiOH} can dissociate, forming a mobile H or a mobile Li. If we assume that there exists also a {HOH} defect, then we have:

now denoting one of the interstitial sites as i3, and keeping the mobile interstitial site as i1. As another simplifying assumption, the other i site is assumed to not be involved in the reaction, and is left as ‘i’. It is of course possible that there also exists a reaction involving a defect with Li2O stoichiometry, however this possibility is not considered. Now, adding the reaction in equation 11 into the reaction step in the diffusion–reaction model (the equilibrium constant for this reaction is herein denoted K2):

and assuming that the free ${\rm H}_{\rm i}^{\rm \bullet }$ and ${\rm Li}_{\rm i}^{\rm \bullet }$
 can move between defects associated with ${\rm O}^{{\rm ^{\prime\prime}}}$
 and ${\rm Al}_{{\rm Si}}^{\rm ^{\prime}}$
 , profiles for {LiOH}, {HOH}, {AlH} and {AlLi} are generated simultaneously.
An example model output is shown in Fig. 6 along with the data from experiment HQHP-TIB2. Modelling results show that the two Li-bearing defects {LiOH} and {AlLi} show out-diffusion, where {HOH} and {AlH} show in-diffusion profiles. One shortcoming of the model is that it requires a {HOH} defect, however such a defect is not definitively known in the FTIR spectra of quartz – this is discussed further below with other model caveats.
The profile from experiment HQHP-TIB2, resolved, with the {AlH}, {LiOH}, {HOH} (assumed to be represented by a band at 3475 cm–1) and ∑Li modelled simultaneously. This fit was done manually, i.e. no non-linear least-squares regression was attempted, so is not guaranteed to be the best fit. Model parameters: Δx = 25 μm, total time = 3600 s, log10D (m2 s–1)=−9; ∑i1 (mobile) = 2 /106Si; ∑i2 (immobile, Al-associated) = 105 /106Si; ∑i3 (immobile, O-associated) = 8 /106Si; K1 = 0.1; K2 = 0.2.

2H-in/H-out experiment
The profiles from this experiment appear to show error-function forms (Fig. 3i), which might be considered as consistent with simple concentration-dependent diffusion, i.e. equation 1. However, if one assumes that H–Li exchange requires a diffusion–reaction model then there is no obvious reason that this should not also be the case for H–2H exchange. Therefore, a diffusion–reaction model was constructed based on equation 13, i.e. the 2H equivalent of equation 4:

where, as before, ‘i1’ represents a mobile position, and ‘i2’ is immobile. We assume that the equilibrium constant for this reaction (herein K3) can be approximated as 1, at least within the limitations of our experimental and analytical methods:

The profile from this experiment was then modelled and fitted, as above, with H contents (as H2O) determined using ɛ = 89,000 L cm–2 mol–1 (Thomas et al., Reference Thomas, Koch-Müller, Reichart, Rhede, Thomas, Wirth and Matsyuk2009), and 2H contents using ɛ = 79,700 L cm–2 mol–1. The derivation of the ɛ value for 2H2O is described in full in the Supplementary Appendix, however, simply, ɛ for 2H2O is adjusted to minimise the variance of 2H + H (atomic basis) for all points along the whole profile, whilst keeping ɛ for H2O constant. The assumption is that 2H + H should be constant along the profile in the 2H-in/H-out experiment, i.e. every 2H gained is compensated by one H being lost.
When K is set to 1, the modelled profiles approach error-function shapes, as we observe in the 2H-in/H-out experiment. It appears to be possible to generate error-function forms that fit the data with any positive value of ∑i1 (total mobile H + 2H) up to the total value of H + 2H. As ∑i1 decreases, D increases, and where ∑i1 = H + 2H ≈18.5 /106 Si (the total H + 2H is set to 18.5 atoms per 106 Si, see Fig. 7, Table 4), D equals that determined by fitting the data to equation 1.
Models (solid lines) representing the 2H-in/H-out experiment, together with data (circles) from experiment HQHP-H2H. The model parameters are provided in Table 4. Model parameters: Δx = 25 μm; total time = 3600 s. Initial and boundary conditions (for other model parameters, see Table 4): ∑i1 (mobile) + ∑i2 (immobile, Al-associated) = 18.5 /106Si; ∑H (initial) = 0 / 106Si; ∑H (boundary) = 16 / 106Si.


However, the starting material for the 2H-in/H-out experiment prior to the initial equilibration step was the same as that used for the ‘pH series’ (HQHP-pH1, -pH3, -pH5 and -pH7, crystal BRA3). The stepped profiles from the latter series could not be well fitted with ∑i1 over ~3–5 /106 Si – further information is provided in the Supplementary Appendix. If we then consider the results of internally consistent fitting of both the ‘pH series’ and this HQHP-H2H experiment, the diffusion coefficient associated with 2H–H exchange is around one order of magnitude slower than that of H–Li exchange. This is not intuitively reasonable if we assume that diffusivity should increase with decreasing mass and ionic radius of the diffusant, but has been observed before – for example, the monovalent cation with the highest measured diffusivity in diffusion experiments to date is Na (Frischat, Reference Frischat1970). However, we note that Frischat (Reference Frischat1970) used very different experimental methods (little information is provided, however assuming the methods are similar to Frischat (Reference Frischat1968)) – radioactive 22Na was diffused into quartz from a film of 22NaCl at atmospheric pressure, then 22Na vs. depth profiles were measured using serial grinding and by measuring the residual activity.
Overall, we can therefore state that whilst the results of the 2H-in/H-out experiment do not require a diffusion–reaction model, a diffusion–reaction model can reproduce the approximately error function profile shapes.
2H-in/Li + H out experiments
Modelling these experiments is considerably more challenging than the H-in/Li-out or 2H-in/H-out experiments, given that there are now (at least) six unknowns to be solved for in the reaction step, being the concentrations of {AlH}, {Al2H}, {AlLi} plus the mobile Li, H and 2H (i.e. those in the ‘i1’ positions). This is already an incomplete description – ideally we should have more unknowns, i.e. the above plus {LiOH}, {HOH} and {2HOH} (and potentially {Li2O}). Taking the simplified system, i.e. ignoring the O-associated defects, there is no analytical solution to the simultaneous equations in the reaction step, meaning that the equations have to be solved numerically. For this reason, as with the model presented above including the Al- and O-associated defects, the measured profiles from these experiments were not fitted by non-linear least-squares regression. Instead, the profiles of {AlH}, {Al2H} and {AlLi} from two experiments were visually fitted only by adjusting the initial and boundary concentrations of Li and H, ∑i1, ∑i2 and D.
Models are presented in Fig. 8, taking K1 = 0.1 (H–Li exchange, equation 4) and K3 = 1 (H–2H exchange, equation 13) which are broadly consistent with the model outputs presented above. These models generate profiles with several interesting features. Firstly, the {AlH} profiles show maxima at ~300 μm from the crystal edge, where we would normally expect the maxima to be in the crystal cores. Secondly, the near-interface out-diffusion section of the {AlH} profile is concave-up, which is broadly the opposite of the error-function profile form. Thirdly, the {Al2H} profile is concave-down near the interface, again the opposite of the error-function form. All of these model outputs are consistent with the data.
Models (solid lines), along with data (circles) from 2H-in/H + Li out experiments DQHP-TIB2 (a) and DQHP-BRA3 (b). The models were matched to the data visually (i.e. no non-linear least-squares regression). The models include neither {LiOH} nor {HOH} defects. Note that both models reproduce the observed hump in H({AlH}) at ~300 μm from the interface without requiring uphill diffusion. Note also that the tracer diffusivities of H, Li and 2H are assumed to be equal for simplicity. Both models: Δx = 25 μm; total time = 3600 s. Initial and boundary conditions (other model parameters presented in Table 5): (a) ∑i1 (mobile) = 1 /106Si; ∑i2 (immobile, Al-associated) = 134 /106Si; ∑Li (initial) = 54.9 / 106Si; ∑Li (boundary) = 2 / 106Si; ∑H (initial) = 80 / 106Si; ∑H (boundary) = 4 / 106Si, (b) ∑i1 (mobile) = 1 /106Si; ∑i2 (immobile, Al-associated) = 29 /106Si; ∑Li (initial) = 17.9 / 106Si; ∑Li (boundary) = 0.5 / 106Si; ∑H (initial) = 12 / 106Si; ∑H (boundary) = 0.1 / 106Si.


Of particular note are the local maxima in {AlH} profiles. Such features would generally be described as ‘uphill-diffusion’, i.e. diffusion of an element against its own concentration gradient, which is not uncommon in multi-component diffusion systems (Zhang, Reference Zhang, Zhang and Cherniak2010). In this case, all modelled diffusion is downhill – the maxima are due to the presence of a reaction step in the model rather than uphill diffusion. Even though non-linear least-squares regression was not used (the profiles were matched to models by visual estimations only), these results provide clear support to the use of the diffusion–reaction model. They also support the use of such a model for the 2H-in/H-out experiments presented above, despite the model not being required for an adequate fit.
Model caveats and shortcomings
Whilst the model presented above is successful at fitting the results of different experiments with general internal consistency, there are several caveats, limitations and simplifying assumptions that warrant further discussion.
First, in equation 5, and then throughout, it was implicitly assumed that two dissociation and association reactions occur simultaneously. This is not physically realistic – the two reactions would ideally be modelled separately.
Second, and probably the most problematic shortcoming of this model is that it requires free ${\rm H}_{{\rm i1}}^{\rm \bullet }$ and ${\rm Li}_{{\rm i1}}^{\rm \bullet }$
 to be invoked, the former not being associated with any known band in FTIR spectra of quartz. This means that the model needs to assume some concentration of ${\rm H}_{{\rm i1}}^{\rm \bullet }$
 + ${\rm Li}_{{\rm i1}}^{\rm \bullet }$
 , i.e. the sum concentration of the mobile cations at any given time (∑i1, equation 7). The power of FTIR spectroscopy in being able to distinguish different point defects is somewhat inconvenient here – we would probably not be considering this caveat if only the total H content, rather than full FTIR spectra had been measured. In this study, all profiles were fitted with ∑i1 set to both 0.1 and 1 atoms per 106 Si for internal consistency. Some profiles could be well fitted with much lower or higher values of ∑i1 however 0.1 and 1 atoms per 106 Si allowed all profiles to be fitted – further information is provided in the Supplementary Appendix. In lieu of any obvious better alternative, we also made the assumption that these mobile cations (${\rm H}_{{\rm i1}}^{\rm \bullet }$
 and ${\rm Li}_{{\rm i1}}^{\rm \bullet }$
 ) move into their immobile states ({AlH} and {AlLi}) at the end of the experiment, i.e. they move from ‘i1’ to ‘i2’ sites on quench.
Third, in all models, we assume that a single diffusion coefficient is sufficient along the ‘i1’ pathway. There is, however, no reason to assume that (for example) the diffusion coefficient of Li is equal to that of H. By making this assumption, we are effectively applying a H–Li inter-diffusion coefficient, although it is not stated as such (see eq. 5 of Stalder (Reference Stalder2021) and the associated text for a discussion of this concept). Again, this is done for simplification – if we considered this as inter-diffusion, we would need two ‘tracer’ diffusion coefficients, one for Li and one for H (three for the 2H-in/H + Li out experiments), and D would be concentration-dependent, i.e. different at every point along the profile. At this stage of model development, the aim is to minimise the number of variables. It is likely, however, that the uncertainties related to D due to this model limitation are minor relative to those related to the unconstrained nature of ∑i1 (second point, above).
Fourth, in modelling the HQHP-TIB2 profile, a {HOH} defect was assumed – this was represented by a band at ~3475 cm–1, which has not been assigned to this defect. The main reason was that the absorbance of this band appears to be inversely proportional to that of the 3481 cm–1 {LiOH} band (Fig. 9). Some arguments for and against this attribution are presented in the following paragraph.
The integrated areas of the peak assigned to {LiOH} (~3841 cm–1) versus those of the peak at ~3475 cm–1, for experiments HQHP-pH1, HQHP-pH3, HQHP-pH5, HQHP-pH7 and HQHP-TIB2. Grey lines have a slope of –1, and are provided as a visual guide only.
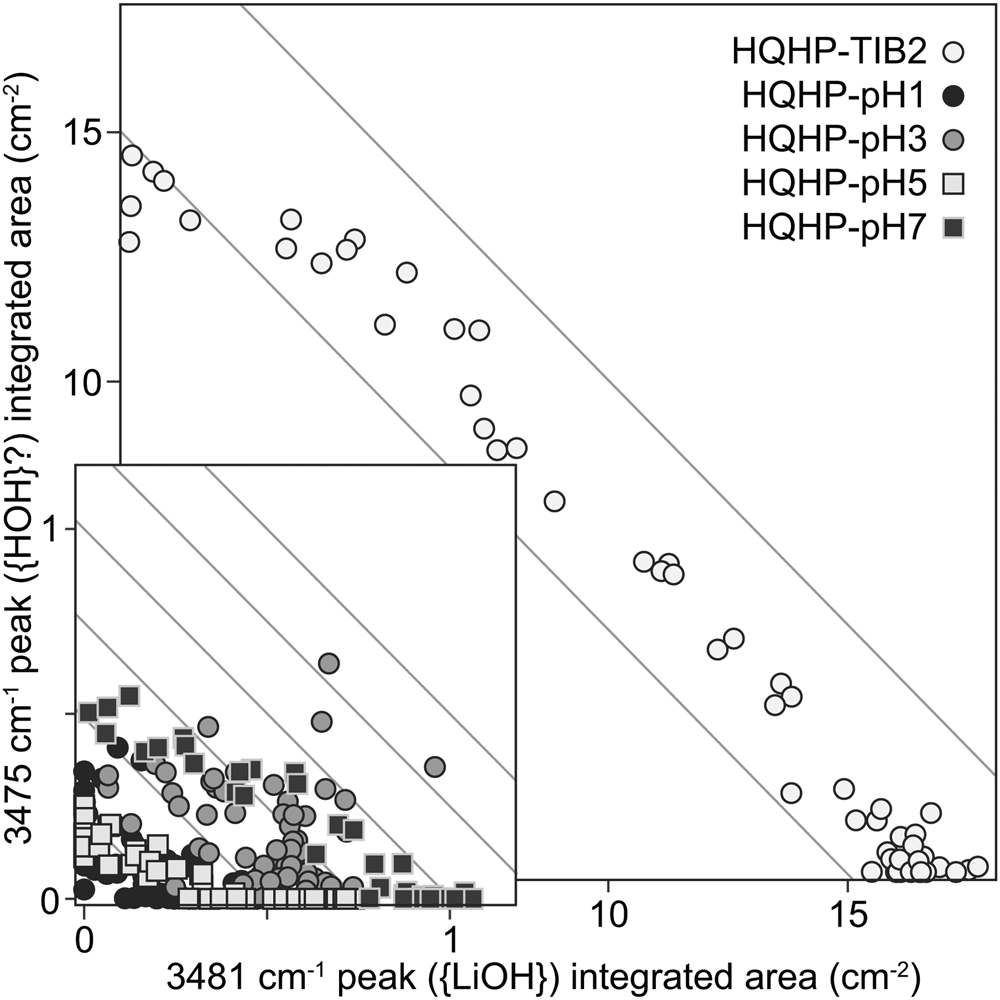
The 3475 cm–1 band was present, although barely resolvable, in experiments HQHP-pH1, -pH3, -pH5 and -pH7. Additionally, polarised FTIR spectra show that the total absorbance of this band is entirely dominated by its E⟂c contribution (see the Supplementary Appendix), as with most bands in the OH stretching region of quartz – this means that if the band represents a defect with H2O stoichiometry, it almost certainly includes structurally-bound OH. Jollands et al. (Reference Jollands, Blanchard and Balan2020b) predicted that a defect with H2O stoichiometry should have bands at 3411 and 3498 cm–1, with the latter showing most absorbance with E⟂c, which would be broadly consistent with our suggestion, though there is no evidence for the former band (although it would probably be subsumed by the {AlH} bands, if it were present). Additionally, Kats (Reference Kats1962) suggested that a band at 3470 cm–1 was not associated with any cation other than H+ (summarised by Kronenberg et al., Reference Kronenberg, Kirby, Aines and Rossman1986). However, it was not observed in quartz crystals grown in the pure SiO2–H2O system (Stalder and Konzett, Reference Stalder and Konzett2012).
Fifth, we have assumed that the equilibrium constants K1, K2 and K3 can be assumed to be constant along the profiles. This is unlikely to be exactly correct, however the ability to fit different profile forms using single equilibrium constants suggests that this effect is minor relative to the other caveats.
The effect of pH
No effect of experimental pH was observed, in terms of either interface H and Li contents, or diffusion profile length/geometry. The original motivation for conducting experiments at different pH conditions was to determine whether a different activity of protons in the fluid would change the interface H/Li ratio, which may then affect the profile length and shape. That no effect of pH was observed does not mean that no effect is possible, however it could be explained by the fact that (1) the difference in pH is considerably lower at experimental conditions than at room temperature or (2) the total amount of Li and H that can be incorporated into the crystals is so low, given the low Al content, that any small variations in Li and H concentration might not be resolvable. Experiments conducted at conditions where the relative pH differences are larger (i.e. at higher pressure) could be enlightening, as could experiments using quartz crystals with higher Al contents.
Reconciling observations from H-in and H-out experiments?
One peculiar observation is that our previous experiments considering H–Li exchange through Li-in/H-out diffusion (Jollands et al., Reference Jollands, Ellis, Tollan and Müntener2020a) gave results that appear to be inconsistent with those presented in this study. Where the H-in/Li-out experiments in this study generally yielded H concentration profiles with complex shapes, those in the Li-in/H-out experiments showed shapes that were, within uncertainty, consistent with error-function forms (Jollands et al., Reference Jollands, Ellis, Tollan and Müntener2020a).
In fact, if the flux in the diffusion–reaction model is reversed, i.e. such that the boundary conditions of Li and H lead to Li in-diffusion, but all other parameters (K, D, number of sites) are kept constant, profile forms close to error functions are the result. To illustrate this further, the Li and {AlH} profiles from the 807°C, Li-in/H-out experiments of Jollands et al. (Reference Jollands, Ellis, Tollan and Müntener2020a) (their Q1L1, Q2L1, Q3L1, Q4L1 and Q5L1) were re-fitted using the diffusion–reaction model. With ∑i1 = 1/106Si, we obtain log10D (m2 s–1) ≈ –8.5 to –9.5, and log10K1 = −0.4 to 0.1 (Table 3), and the profiles from the previous study were fitted satisfactorily (Fig. 10, and Supplementary Appendix). Fitting the same profiles to a standard error-function solution to Fick's second law gives log10D (m2 s–1) between –11.1 to –11.8 (see Supplementary dataset 1 of Jollands et al., Reference Jollands, Ellis, Tollan and Müntener2020a for original fit parameters), i.e. 2–3 orders of magnitude lower than that obtained by using the diffusion–reaction model. Another observation of the Jollands et al. (Reference Jollands, Ellis, Tollan and Müntener2020a) investigation was a relatively large spread in measured D at any given temperature – approximately ±0.3 orders of magnitude around the mean. It is likely that this was due to the use of a variety of different starting materials, however there was no clear systematics observed. Alternatively, this spread in D might relate to the application of a simple diffusion model to a system where a more complex diffusion–reaction model is warranted. However, attempts to re-fit all data from the previous study using the new model were unsuccessful in this regard, the difference between D becomes larger – this almost certainly relates to the fact that we have little or no constraint on the elusive ∑i1 parameter, either in terms of absolute value or relative values between different starting materials.
H and Li profiles from a Li-in/H-out experiment (Q2L1 of Jollands et al., Reference Jollands, Ellis, Tollan and Müntener2020a), fitted using the diffusion–reaction model (solid line). The model parameters are presented in Table 3. Also shown (dashed lines) are fits with error-function forms, barely discernible from the diffusion–reaction model curves, i.e. equation 1. Other fits are available in the Supplementary Appendix.

The original objective of the Jollands et al. (Reference Jollands, Ellis, Tollan and Müntener2020a) investigation was to provide diffusion coefficients that could be applied to Li-in/H-out profiles observed previously in some volcanic quartz crystals (Charlier et al., Reference Charlier, Morgan, Wilson, Wooden, Allan and Baker2012; Tollan et al., Reference Tollan, Ellis, Troch and Neukampf2019). Whilst it now appears that the simple diffusion model applied by Jollands et al. (Reference Jollands, Ellis, Tollan and Müntener2020a) was not strictly appropriate (we previously used equation 1), it is reasonable to assume that their phenomenological diffusion coefficients are appropriate for use as a diffusion chronometer, at least within their quoted uncertainties. This is because the compositional range of their starting materials (in terms of H and Li concentrations) straddled the composition of their studied volcanic quartz, from the Bishop Tuff. Regardless of our above discussion and the considerable complexities in this system, we would still propose that simple solutions or numerical approximations of Fick's second law, such as in equation 1, coupled with the phenomenological Jollands et al. (Reference Jollands, Ellis, Tollan and Müntener2020a) diffusion coefficients are appropriate for purposes of H diffusion chronometry using volcanic quartz in situations where H is lost and Li gained, at least within any reasonable uncertainty.
Conclusion
On the basis of a series of diffusion experiments and in situ analyses, this study demonstrates that H, 2H and Li diffusion in quartz involves a process where H and other monovalent cations move by dissociating from a charge-compensating species, generally Al3+, then moving rapidly to another charge-balancing site, where they become immobilised. Models invoking this process can create different profile forms consistent with experimental observations: step shapes in H-in/Li-out experiments, localised humps in 2H-in/Li + H out experiments, and error-function forms in Li-in/H-out and 2H-in/H-out experiments. Models describing this complex diffusion mechanism of H in quartz have been proposed previously (e.g. Kronenberg and Kirby, Reference Kronenberg and Kirby1987) – this study provides independent support.
Supplementary material
All FTIR spectra and LA-ICP-MS data are available at https://doi.org/10.17632/v3p5fw65bv.1. To view the Supplementary Appendix for this article, please visit https://doi.org/10.1180/mgm.2021.105
Acknowledgements
Jörg Hermann is thanked for access to the FTIR lab at the University of Bern. Alexey Ulianov is thanked for maintaining the LA-ICP-MS at the University of Lausanne in such a condition that the quartz analyses at ablation conditions that were extreme for our instrument, were straightforward. Various people have been involved to some extent in establishment, use and upkeep of the hydrothermal equipment at the University of Lausanne: Tom Sisson, Romain Lafay, Mattia Pistone, Eli Bloch – their work facilitated these experiments. Thanks to Roland Stalder and two anonymous reviewers for their comments that helped to improve the manuscript. This work was supported by the University of Lausanne and a grant from the Swiss National Science Foundation (P400P2_183872) to MCJ.


 Open access

