


The federal crop insurance program has become the cornerstone of US agricultural policy. In 2024, total liability in the program was over $155 billion, and total premium was nearly $16 billion.Footnote 1 The program is subsidized, with premium subsidies exceeding $9.8 billion in 2024 and with additional subsidies being paid to private insurance companies to administer and operate the program. As a result, participation in the program has become ubiquitous, with the vast majority of farmed acreage now being insured.Footnote 2 Central to the operation of the program is comprehension of the relevant risks associated with crop insurance contracts, which in turn reflects risks associated with crop production.
The objective of this paper is to consider the relationship of a unique set of county-level data on soil characteristics – from the National Resources Inventory (NRI) – with crop insurance losses. Because federal crop insurance programs are administered at the county level, we relate county-level aggregate soil characteristics data from the NRI to indemnities paid on crop insurance claims at the county level. To our knowledge, this is the first analysis to utilize county-level aggregated soil characteristics from the NRI in examining crop insurance losses. Our results differ from existing analyses that relate soil characteristics to the federal crop insurance program (for example, Tsiboe and Tack, Reference Tsiboe and Tack2021) in that our analysis is conducted at the county aggregate level, which offers direct implications for determining premium rates in the federal program. Most existing analyses of the relationship between soil characteristics and crop insurance losses consider data collected at the field level. Note that this may introduce practical limitations in terms of suggesting alternatives to current rating methods since a big part of current methods are generally applied at the county level. We demonstrate that losses, including the overall ratio of indemnities to premiums collected, are significantly influenced by soil characteristics. We also offer implications for the system that is used to rate coverage in the federal crop insurance program.
Cropland in the US is of a very heterogeneous quality. This heterogeneity applies to both the extensive and intensive margins. Growing conditions differ significantly across regions and likewise differ within a given region across fields and farms. An important factor underlying the growing performance of specific areas is related to soil characteristics, which is likewise very heterogeneous across the US. In turn, a number of physical properties of soil are related to the growing performance of a given acreage. These soil characteristics are measured through a number of different surveys, including the periodic NRI.
The insurance program is “all-risk,” meaning that it covers yield and revenue losses from a range of possible causes of loss. As a part of the program, loss adjusters are charged with determining losses on insured policies. As a part of this process, loss adjusters assign and apportion losses to various natural hazards which are presumed to have caused the losses. The Risk Management Agency (RMA), which administers the federal crop insurance program, aggregates this cause of loss data at the annual county level in its Cause of Loss database. We utilize this cause of loss data to identify specific hazards that may be related to soil characteristics.Footnote 3
An extensive literature evaluating various aspects of crop risks and insurance exists. With only a few notable exceptions, this literature has devoted relatively little attention to the role that soil characteristics play in determining agricultural risks and outcomes. Woodard, Reference Woodard2016 examined within-field soil quality variability and found that such quality has important implications for the design and rating of crop insurance contracts. He noted that soil quality may vary significantly, even within a county. His results indicated that insurance pricing errors may be as large as 200% when soil quality is ignored. Woodard and Veteramo-Chiu, Reference Woodard and Verteramo-Chiu2017 found that crop insurance pricing efficiency could be significantly improved in the federal program by considering soil characteristics when estimating crop insurance guarantees. Connor et al., Reference Connor, Rejesus and Yasar2021 found that crop insurance may be a minor disincentive to adopting soil conservation practices. In contrast, Fleckenstein et al., Reference Fleckenstein, Lythgoe, Lu, Thompson, Doering, Harden, Getson and Prokopy2020 found that crop insurance served a unique and not contradictory role with conservation practices. Thaler et al., Reference Thaler, Larsen and Yu2021 found that soil loss and degradation affect yields and pose an increasing problem in the Corn Belt. Conservation practices are closely related to the inherent erodibility of soil as well as actual levels of soil erosion, which are reflected in the soil characteristics considered in our analysis. These qualities include indicators of management practices which may be relevant to erosion and therefore to yield risk.
Results presented by Tsiboe and Tack, Reference Tsiboe and Tack2021 suggest that incorporating soil characteristics and topographical features improves the predictive accuracy of yield losses and therefore can improve the rating performance of methods used in the federal crop insurance program. However, the potential for improvement in rating accuracy was specific to farms with limited yield histories. There were no rating improvements for farms with the commonly used yield history of ten years.
The agronomic literature has found that many soil properties are associated with crop productivity. Cox et al., Reference Cox, Gerard, Wardlaw and Abshire2003; Nyiraneza et al., Reference Nyiraneza, Cambouris, Ziadi, Tremblay and Nolin2012; Sene et al., Reference Sene, Vepraskas, Naderman and Denton1985 found that the intrinsic soil texture and structure were associated with the yield performance of soybeans, wheat, and corn, respectively. Corwin et al., Reference Corwin, Lesch, Shouse, Soppe and Ayars2003 found that a number of soil properties influence cotton yields. Anthony et al., Reference Anthony, Malzer, Sparrow and Zhang2012; Martin et al., Reference Martín, Bollero and Bullock2005 found that a number of soil characteristics were associated with yield performance for soybeans. Kravchenko and Bullock, Reference Kravchenko and Bullock2000 found that several soil characteristics were correlated with corn and soybean yields. These studies typically examine soil characteristics at a local (e.g., field) level. We take a different approach in this analysis. We focus on county average values of a number of soil characteristic metrics. The terms of coverage in the federal crop insurance program are set at the county level, and thus, our results are directly relevant to rating parameters and terms of coverage in the federal crop insurance program. Nearly every crop insurance program operates at the county level, and the general terms of coverage are homogeneous within a county.Footnote 4
Soil erosion is a major concern for agricultural productivity. A variety of factors affect erosion, which in turn can impact the productivity and production risk of land. Figure 1 illustrates patterns of soil erosion measured under the 2017 NRI. Considerable heterogeneity in patterns of soil erosion is obvious across different growing regions. We investigate the links of these soil-related factors related to erosion with crop insurance losses, including losses associated with specific sources of risk.
2017 water and wind soil erosion (tons/acre/year).

Figure 1 Long description
The heat map of the United States illustrates soil erosion from wind and water across various counties. The map uses a color gradient to represent different levels of soil erosion, ranging from 0 to 77.32 tons per acre per year. The color scale includes shades of green, yellow, orange, and red, with green indicating the lowest erosion rates and red indicating the highest. The map is divided into small squares, each representing a county. The central and southern regions of the United States, particularly in states like Kansas, Oklahoma, Texas, and parts of the Midwest, show the highest levels of soil erosion, depicted in red. The western and northeastern regions generally exhibit lower erosion rates, shown in green and light yellow. This visual representation highlights the varying degrees of soil erosion due to wind and water across the country.
The link between agricultural policies, including crop insurance, and soil erosion has been investigated by Goodwin and Smith, Reference Goodwin and Smith2003. Their results confirmed an important causal link between participation in the federal crop insurance program and realized erosion of soils. In particular, their results found that agricultural programs, including the federal crop insurance program, bring about more intensive cultivation and encourage production in more marginal areas, which may have more fragile soils. The net effect is that crop insurance programs may operate at odds with other programs intended to promote soil conservation measures. Bryant and O’Connor, Reference Bryant and O’Connor2016 argue that the federal crop insurance program is currently structured using a flawed formula that lets high-risk farmland and management “off the hook” and ignores soil regenerative practices that would secure the soil.
We consider the role played by soil characteristics in determining crop insurance losses. Overall losses, relative to total premiums (i.e., the crop insurance loss ratios), are considered within the context of a number of soil characteristics which may be related to realized losses. If premium rates are accurately accounting for the risks associated with soil characteristics, they should not be related to crop insurance losses. Specific causes of loss, such as drought, flooding, and cold wet weather, as measured using loss cost ratios (i.e., indemnities over liabilities), are also evaluated in the light of several measures of soil characteristics. The overarching goal is to identify those soil characteristics that are associated with crop insurance losses due to specific hazards.
1. Soil characteristics
Soils possess a number of intrinsic properties that are relevant to yield performance. We utilize average soil properties data at the county level that were collected in the 2017 National Resources Inventory (NRI). The NRI is a periodic (every five years) survey that collects detailed soil characteristics and land use patterns. We focus on the 2017 NRI and its measures of soil characteristics and their relationships with crop insurance losses over the 2013–2023 period. Here, we discuss soil characteristics from the Universal Soil Loss Equation (USLE) that were considered in our empirical analysis.Footnote 5
The NRI data come from a random area sample conducted in every county in the US. Prior to 2000, the data were collected from 300,000 sampling segments (primary sampling units) and 800,000 data points once every five years, with multiple measurements taken in each county. The segments are randomly selected plots within each county that are one-half mile square in most counties.Footnote 6 Although the data are only reported on a five-year basis, the NRI moved to an annual survey basis in 2000 and now surveys 41,000 segments annually.
The soil factors that are derived from the sampling are taken using soil measurements at each point. The factors are all inputs into the universal soil loss equation. Each factor represents unique characteristics of the soil that are related to soil erosion. We hypothesize that these factors are related to crop risk and, therefore, are relevant to crop insurance losses. It should be noted that the factors are all related to soil erosion but individually measure different characteristics of soil in a county. This includes factors such as vegetative cover, typical climate, and the adoption of conservation practices. The NRI also classifies land as being rural, federal, water-covered, urban, or developed. Rural land is broken down into cropland, rangeland, pasture, and forest.
The T-Factor reflects the maximum rate of annual soil loss that will permit crop productivity to be sustained indefinitely on a given soil. The R-Factor represents soil erosion and is measured by the number of rainfall erosion index units, plus a factor for runoff from snowmelt or applied water where such runoff is significant. The V-Factor is a measure of vegetative cover and is given by the kind, amount, and orientation of vegetative material to its equivalent in pounds per acre of small grain residue in reference conditions (small grain equivalent). The K-Factor is an element of the universal soil loss equation that represents the inherent erodibility of the soil. The K-Factor is a measure of the potential for soil particles to detach and be transported by rainfall and runoff. The K-Factor primarily is driven by the texture of the soil, although structure, organic matter, and permeability also are relevant.
The WC-Factor characterizes climatic erosivity, specifically wind speed and surface soil moisture. The I-Factor is the potential soil loss (tons/acre/year) from a wide, level, unsheltered, isolated field with a bare, smooth, loose, and noncrusted surface. The C-Factor is the cover and management factor which is based on the percentage of residue cover, type of tillage, and crop type. The C-Factor is given by a ratio comparing the soil loss from land under a specific crop and tillage system to the corresponding loss from continuously fallow and tilled land. The P-Factor is a practice factor that represents the influence of mechanical or structural agricultural practices affecting the soil, such as contour planting, strip cropping, terracing, and combinations. It is given by the ratio of the erosion resulting from the mechanical/structural practice relative to what would occur with up-and-down slope cultivation. Many of these factors are inputs into the universal soil loss equation, which relates characteristics of land to patterns of soil erosion.
2. Empirical approach and data
Crop insurance performance data, including liability, premium, coverage level, and indemnity payments, was collected from the Risk Management Agency’s summary of business database. Online data reporting indemnity payments by specific causes of loss was also collected. As noted, soil characteristics associated with soil erosion were collected from the 2017 NRI survey. The crop insurance data span the 2013–2024 period. The program has undergone important changes over time, though this period was largely characterized by a common set of crop insurance policies and procedures. It is also important to control for typical weather patterns that may be relevant to losses. We included long run normal temperature (degrees Fahrenheit) and cumulative precipitation levels (inches), taken from the National Climate Data Center.
We specify models of crop insurance losses as follows:
 $$Loss_i = \alpha_0 + \beta {\bf Soil\ Characteristics}_i + \lambda {\bf Weather}_i + \delta {\bf X}_i + \epsilon _i$$
where Loss
i
represents a measure of crop insurance losses in county i, α, β, λ, δ are parameters to be estimated, and ϵ
i
is a random error term assumed to be normally distributed. Crop insurance losses are specified alternatively as the loss-ratio (the ratio of indemnities paid to premiums collected) and the loss-cost ratio (the ratio of indemnities to total liability) for specific causes of loss. The ${\bf Soil\ Characteristics}_i$
vector includes all the soil-erosion related factors (e.g., T-factor, R-factor, etc.), the
${\bf Soil\ Characteristics}_i$
vector includes all the soil-erosion related factors (e.g., T-factor, R-factor, etc.), the ${\bf Weather}_i$
vector includes a precipitation measure, a temperature measure, the squared terms of both precipitation and temperature, and an interaction term for precipitation and temperature. The
${\bf Weather}_i$
vector includes a precipitation measure, a temperature measure, the squared terms of both precipitation and temperature, and an interaction term for precipitation and temperature. The ${\bf X}_i$
vector includes land capability class (LCC) variables (e.g., LCC variable 1 to 7) and an average crop insurance coverage level variable.
${\bf X}_i$
vector includes land capability class (LCC) variables (e.g., LCC variable 1 to 7) and an average crop insurance coverage level variable.
Loss ratios must be non-negative and can take a value of zero if no indemnities are paid. In our sample, no observations of zero average loss ratios were observed. Thus, we consider ordinary least squares regression to evaluate the losses. In the case of loss-cost ratios, the dependent variable can only assume values between 0 and 1.Footnote 7 Because the loss-cost ratios are limited to the [0,1] interval, we utilize a fractional probit specification for our loss-cost regressions. The fractional probit model assumes that
 $$E[y_i|X_i] = \Phi (X_i\beta )$$
where Φ(⋅) is the cumulative standard normal distribution. We estimate Equation 2 using maximum likelihood methods. Maximum likelihood estimates of relevant models of loss cost ratios are presented in Tables 4 through 6.
The primary hazards underlying crop insurance indemnities were also considered. This included drought, excessive heat, excessive moisture, flooding, cold and wet conditions, and wind. Indemnities paid under each cause of loss were considered relative to total liability on policies (i.e., the loss cost ratio for specific causes of loss). We first consider the relationship between the aggregate loss ratio (indemnities over premiums) and the soil characteristics, then evaluate the relationship between the cause of loss specific loss cost ratios and the soil characteristics. If premium rates are actuarially sound, soil characteristics and other covariates should not affect the overall loss ratio. The loss data are averages taken over the 2013–2023 period.Footnote 8 This essentially amounts to decomposing the loss cost ratio into the individual components associated with specific causes of loss. The sum of these individual factors should approximate the overall loss cost ratio. The analysis was conducted at the county level.
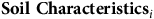
Table 1 contains definitions of the relevant variables along with summary statistics. The cross-sectional data consisted of 2,660 county-level observations. Figure 2 illustrates average loss ratios over the period of study. A considerable degree of heterogeneity is apparent in the loss ratios, suggesting that rates may not be entirely aligned with risk, at least over our period of study. Loss-cost factors are given by the ratio of indemnities paid for specific causes of loss over total insurance liability for the county in question. It is relevant to note that the loss-cost factors suggest that the principal causes of loss in the federal crop insurance program are drought (2.75% of liability) and excessive moisture (3.17% of liability). Indemnities for other causes of loss account for less than 1% of total liability in the program on average. The average loss ratio was 0.7596, and the average ratio of indemnities to farmer-paid premiums is 2.1528. The average coverage level is 70.25%. The county-level average coverage level is calculated by weighting each available coverage level by the number of insured acres at that level. Specifically, for each county, we multiply each coverage level by its corresponding insured acres and then divide the sum of these products by the total insured acres in the county.
Variable definitions and summary statistics

Table 1 Long description
A table with three columns labeled Variable, Definition, Mean, and Standard Deviation, and 30 rows of data. The table provides definitions and statistical summaries for various variables related to crop insurance, including loss cost ratios for different causes of loss, land use factors, soil factors, and climate factors. Key variables include LCR Drought, LCR Moisture, Cropland, Proportion Crop Land, T-Factor, R-Factor, and others. Notable statistics include the average loss ratio of 0.7596, the average ratio of indemnities to farmer-paid premiums of 2.1528, and the average coverage level of 70.25%. The table highlights the heterogeneity in loss ratios, indicating potential misalignment with risk.
Average loss ratios.

Figure 2 Long description
A heat map of the United States showing average loss ratios by county. The map uses a color gradient to represent different loss ratio ranges, from green indicating lower ratios to red indicating higher ratios. The loss ratio ranges are as follows: green for 0.000000 to 0.146158, light green for 0.146225 to 0.281281, darker green for 0.282809 to 0.433219, yellow-green for 0.434438 to 0.620981, yellow for 0.622579 to 0.850658, light orange for 0.852433 to 1.197471, orange for 1.197719 to 1.757875, and red for 1.761110 to 7.388162. The map shows a varied distribution of loss ratios across the country, with some regions having higher loss ratios, particularly in the central and western parts of the United States.
3. Results and discussion
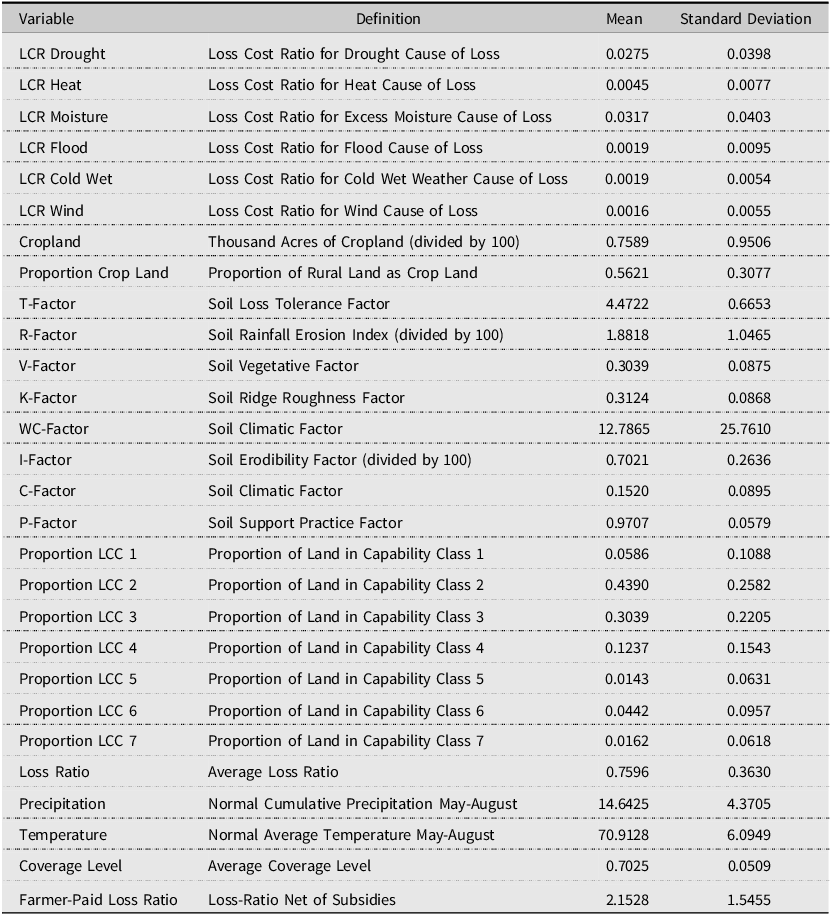
We first consider the relationship between soil characteristics and the overall loss ratio (Table 2). The proportion of land in a county that is cropland is negatively related to the loss ratio, suggesting that fringe growing areas with less cultivated cropland are likely to have higher loss ratios. The T-factor, representing the maximum rate of annual soil loss that can occur without degrading long-term productivity, is positively related to loss ratios (significant at the 10% level). This may suggest that counties with more erosion-tolerant, and thus more intensively cultivated, soils face slightly higher indemnities due to greater cropping pressure despite their higher physical resilience. The R-factor is not related to overall loss ratios, but the V-Factor, representing a greater degree of vegetative cover in a county, is negatively related to the loss ratio. This finding is consistent with the role of ground cover in moderating climatic stress, stabilizing soil structure, and preventing erosion, all of which contribute to reducing overall yield losses. Soils that are more inherently erodible, as represented by the K-factor, tend to have higher loss ratios, though the effect is not statistically significant. The WC-factor, which reflects climate-related erosivity, is also positively related to loss ratios. Again, soils that are more erodible due to weather conditions tend to have higher loss ratios. The I-factor, which represents potential soil loss from a bare and unprotected surface, is not statistically significant. The C-factor, which represents cover and management, is positively related to the loss ratio, indicating that counties with more intensive tillage and lower residue cover tend to experience higher losses overall.
Loss-ratio regression results

Table 2 Long description
The table presents loss-ratio regression results, focusing on various parameters such as cropland, proportion cropland, T-factor, R-factor, V-factor, K-factor, WC-factor, I-factor, C-factor, P-factor, and proportions of different land cover classes (LCC). It also includes environmental factors like precipitation, temperature, and their interactions. The table has 30 rows and 4 columns, with headers labeled Parameter, Estimate, Std Err, and t Value. Key trends include a negative relationship between the proportion of cropland and loss ratio, a positive relationship between the T-factor and loss ratio, and a negative relationship between the V-factor and loss ratio. The C-factor shows a positive relationship with loss ratio, indicating higher losses in counties with more intensive tillage. Environmental factors like precipitation and temperature also show significant relationships with loss ratios.
The P-factor, which reflects the effects of mechanical/structural practices (e.g., strip cropping, terracing) that reduce the amount and rate of water runoff and thereby decrease erosion (i.e., higher P means less use of these practices and increasing erosion), is positive but not statistically significant. This result seems consistent with later findings showing that such practices can mitigate drought-related losses but may exacerbate flood- or excess-moisture-related damages, resulting in an overall neutral effect on total losses. We considered the proportion of land in each of the capability classes, which represent the suitability of land for cultivation, from best to worst.Footnote 9 Land in capability class 1, which is the land best suited to cultivation, had higher loss ratios than land in classes 2, 3, and 4, though the differences for classes 3 and 4 are not statistically significant. This is somewhat contrary to expectations but may reflect the fact that such land is more intensively cultivated. Land in the worst capability class, 7, was found to have much higher loss ratios. Finally, we included variables representing the long-run normal temperature and precipitation levels, along with their squared terms, to control for intrinsic weather factors likely related to loss ratios in the crop insurance program and to capture potential nonlinearities. The parameters associated with temperature and precipitation indicate a “U-shaped” relationship – losses decrease as temperature or precipitation increases from low levels, but beyond a certain turning point, higher values of these variables lead to higher losses.
In all, the results suggest that soil factors associated with greater soil erosion tend to have higher loss ratios. The fact that several observable soil characteristics are shown to be related to loss ratios suggests that premium rates may not fully incorporate relevant soil data and thus that the actuarial performance of the program could potentially be improved by a consideration of measured soil characteristics. The average coverage level is not significantly related to loss ratios.
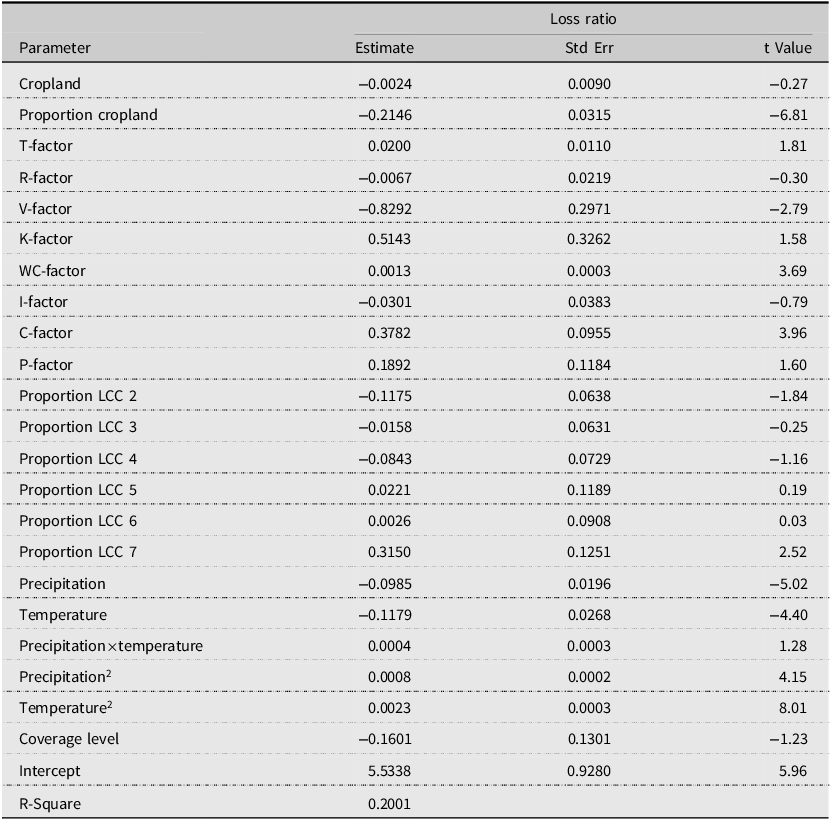
We next consider the relationship of farmer-paid premium loss ratios, which are given by the ratio of indemnities to farmer-paid premium, and soil characteristics. Note that farmer-paid premium is the total premium less relevant premium subsidies. Table 3 presents the results. The T-factor, which represents the maximum rate of erosion that will sustain productivity, is positively related to farmer-paid loss ratios. In this case, the I-factor, representing potential soil loss, is statistically significant and negatively related to loss ratios. Land in capability class 2 again has lower loss ratios, with classes 6 and 7 having higher loss ratios, net of premium subsidies, than is the case for land in capability class 1. Important weather effects on loss ratios are also revealed, with both precipitation and temperature having quadratic effects on loss ratios. Coverage level is strongly related to farmer-paid loss ratios. Loss ratios fall as average coverage levels rise.
Farmer-paid (Net of subsidy) loss-ratio regression results

Table 3 Long description
The table presents regression results for farmer-paid premium loss ratios, which are calculated as the ratio of indemnities to farmer-paid premiums. The table includes various parameters such as cropland, proportion cropland, T-factor, R-factor, V-factor, K-factor, WC-factor, I-factor, C-factor, P-factor, and proportions of different land capability classes (LCC). It also considers weather effects like precipitation, temperature, and their interactions, as well as coverage level. The table has 26 rows and 4 columns, with headers for Parameter, Estimate, Standard Error, and t Value. Notable trends include the positive relationship of the T-factor with loss ratios, the negative relationship of the I-factor with loss ratios, and the varying loss ratios across different land capability classes. Weather effects show quadratic relationships with loss ratios, and coverage level is strongly related to loss ratios, with higher coverage levels leading to lower loss ratios.
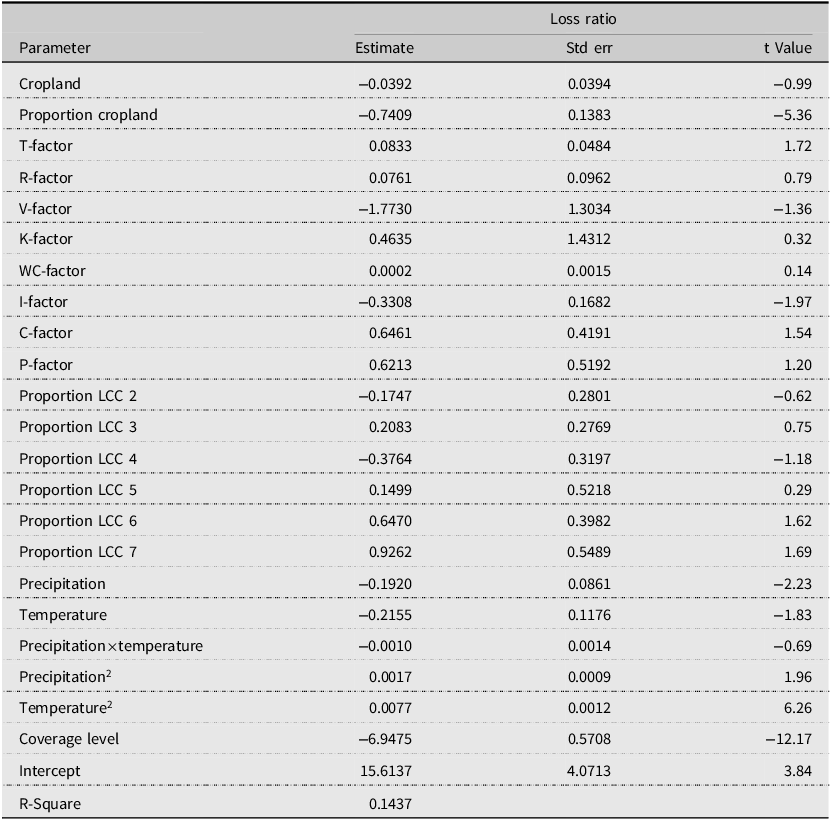
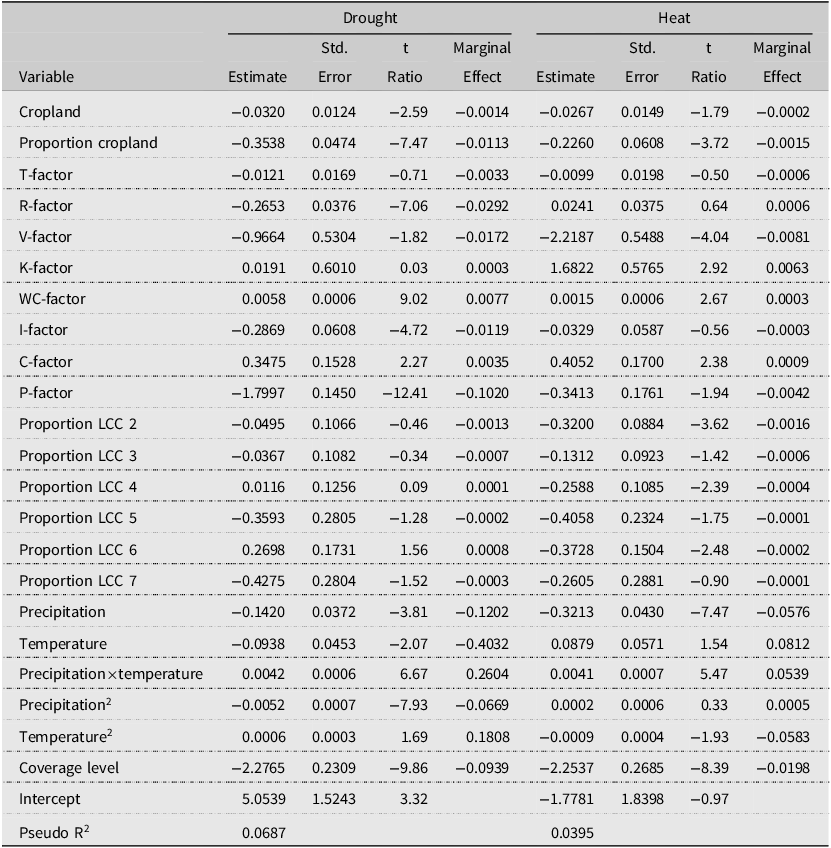
We next consider the relationship of losses from specific causes to soil characteristics. The dependent variable in our regressions is the loss-cost ratio (the ratio of indemnities due to specific causes to overall liabilities). The overall loss-cost ratio is illustrated in Figure 3. Once again, a considerable degree of variability in risks is obvious in the figure. Table 4 considers losses arising from drought and heat. In the case of drought, the proportion of land in crops is negatively related to the loss cost ratios associated with drought, indicating that fringe or marginal agricultural areas (with less cropland) tend to have higher losses, reflecting greater production risk under drought conditions. The R-factor, representing soil losses associated with rain and runoff, is negatively related to drought losses. This is to be expected since drought is likely to be less common in areas with significant rain. The WC-factor, representing climate-related erosivity (specifically wind speed and surface soil moisture), is positively related to drought losses. This might suggest that in regions with higher climatic erosivity, wind-driven soil degradation becomes more pronounced under dry conditions, causing soils to lose structure and moisture more rapidly and thereby amplifying drought-related losses. The I-factor, representing potential soil loss, is negatively related to drought-related loss costs. Areas with higher potential soil loss often correspond to steeper or more erosion-prone landscapes, where farmers may adopt more conservative management practices or crop less intensively. Such adaptive behavior can reduce exposure to drought-induced losses. The C-factor is positively related to drought-related losses, indicating that intensive tillage and reduced surface residue increase vulnerability to drought stress, leading to higher losses. The P-factor, which captures management practices that reduce erosion, is negatively related to drought-related losses, suggesting that adoption of structural/mechanical-oriented practices are associated with higher drought risk (i.e., adoption of strip cropping, for example, means that the P-factor is lower and soil erosion is lower; and this is postively related to drought losses).
Average loss-cost ratios for all causes of loss.

Figure 3 Long description
A heat map of the United States showing loss cost ratios by county. The map uses a color gradient to represent different loss cost ratios, ranging from green for the lowest ratios to red for the highest ratios. The color scale at the bottom indicates specific ratio ranges, with green representing ratios from 0.0000000 to 0.0138338, light green from 0.0138485 to 0.0285618, yellow from 0.0285687 to 0.0464527, light orange from 0.0464650 to 0.0716587, orange from 0.0720314 to 0.1068689, dark orange from 0.1070625 to 0.1587962, light red from 0.1588028 to 0.2602000, and red from 0.2603709 to 0.9829866. The map shows a varied distribution of loss cost ratios across the country, with some regions exhibiting higher loss cost ratios, particularly in the central and southern parts of the United States.
Fractional probit estimates for drought and heat causes of loss

Table 4 Long description
The table presents a comparison of drought and heat causes of loss, detailing various factors such as cropland, proportion cropland, T-factor, R-factor, V-factor, K-factor, WC-factor, I-factor, C-factor, P-factor, and proportions of different land cover classes. Each factor is analyzed for its estimate, standard error, t-ratio, and marginal effect under both drought and heat conditions. Notable trends include significant negative impacts of the P-factor and precipitation on drought losses, and significant positive impacts of the WC-factor and precipitation by temperature interaction on drought losses. For heat losses, the V-factor shows a significant negative impact, while the WC-factor and temperature show significant positive impacts. The table also includes pseudo R-squared values for the models.
Heat-related losses are negatively related to the proportion of land in a county that is cropland. The V-factor is negatively related to heat losses. Vegetative cover can help protect against thermal stress by shading the soil, reducing canopy temperature, and preserving surface moisture. It moderates the heat load on crops and thereby reduces heat-related losses, similar to its mitigating effect under drought conditions. The K-factor, representing the inherent erodibility of soil, is positively related to heat-induced losses. The C-factor is also positively related to heat losses, similar to the case of drought conditions. More intensive tillage may disturb soil structure, reduce residue cover, and increase soil exposure, making fields more susceptible to heat stress The P-factor, representing structural/mechanical practices, is negatively related to heat-related losses. In general, more capable land quality, as represented by the land capability class, is positively related to heat losses. Losses appear to be more significant on higher quality land, likely representing the greater potential for loss and increased cultivation intensity on higher quality land.
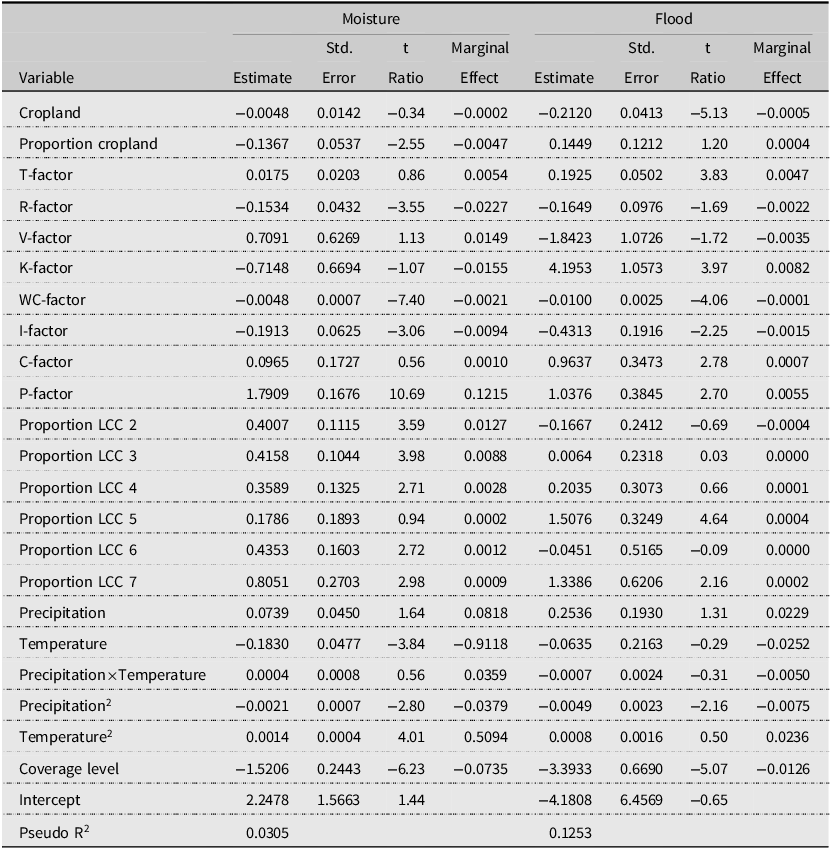
Losses associated with excessive moisture and flooding are presented in Table 5. Excessive moisture-related losses decline with a higher proportion of cropland, likely reflecting that peripheral or less cultivated areas with limited cropland are more susceptible to standing water and waterlogging. The R-factor, which reflects rainfall erosion, is negatively related to losses due to excessive moisture. This likely reflects that regions with high rainfall erosivity have landscapes and management systems adapted to frequent heavy rainfall that help mitigate moisture-related losses. Likewise, the WC-factor, which represents climatic erosivity (a composite of wind speed and surface soil moisture), is negatively related to moisture-related losses. This contrasts with its positive relationship to drought and heat losses, and could reflect that areas with high climatic erosivity – typically drier, windier regions – are less prone to waterlogging or standing-water damage. The P-factor, representing structural/mechanical practices, is positively related to losses from excess moisture. The P-factor represents mechanical conservation practices such as contour planting, strip cropping, and terracing. These practices reduce the volume and velocity of surface runoff and therefore lower the P-factor value; conversely, higher P values indicate weaker or absent adoption of these structural/mechanical practices. In our results, the P-factor is positively related to excess-moisture losses, suggesting that weaker conservation practices (higher P) are associated with reduced drainage efficiency and greater surface water accumulation during periods of heavy rainfall, leading to higher moisture-related losses. Lower quality land, as represented by the proportion of land in different land capability classes, tends to have higher losses.
Fractional probit estimates for moisture and flood causes of loss

Table 5 Long description
The table presents fractional probit estimates for moisture and flood causes of loss, with variables such as cropland, proportion cropland, T-factor, R-factor, V-factor, K-factor, WC-factor, I-factor, C-factor, P-factor, proportion LCC, precipitation, temperature, and coverage level. It includes estimates, standard errors, t-ratios, and marginal effects for both moisture and flood categories. Notable trends include negative estimates for cropland and R-factor in moisture, and positive estimates for P-factor and proportion LCC in both categories. The table highlights the relationships between these variables and losses due to excessive moisture and flooding.
As expected, a higher level of land in cropping corresponds to decreased losses due to flooding. Counties with more cropland are likely to be more robust with respect to flooding damages. The T-factor, which reflects higher erosion tolerance (often corresponds to deeper, more intensively cultivated soils), is positively related to flood losses, suggesting that these areas may also face greater exposure to flood hazards. Greater potential for erosion from rainfall is associated with lower flood-related risks. Land with more vegetative cover, measured by the V-factor, has lower levels of flood-related losses. The K-factor, representing inherent soil erodibility, is positively related to flood losses, indicating that more erodible soils are more susceptible to flood-induced damage. In contrast, the I-factor is negatively related to flood losses, possibly because areas with higher potential soil loss are managed more conservatively or cropped less intensively, reducing exposure to flood hazards. Higher values of the C- and P-factors – reflecting more intensive tillage with less residue cover and weaker support practices – are associated with greater flood-related losses, likely due to poorer drainage, and increased surface water accumulation. In general, land capability class is not a significant determinant of flood losses, although losses are higher in classes 5 and 7.
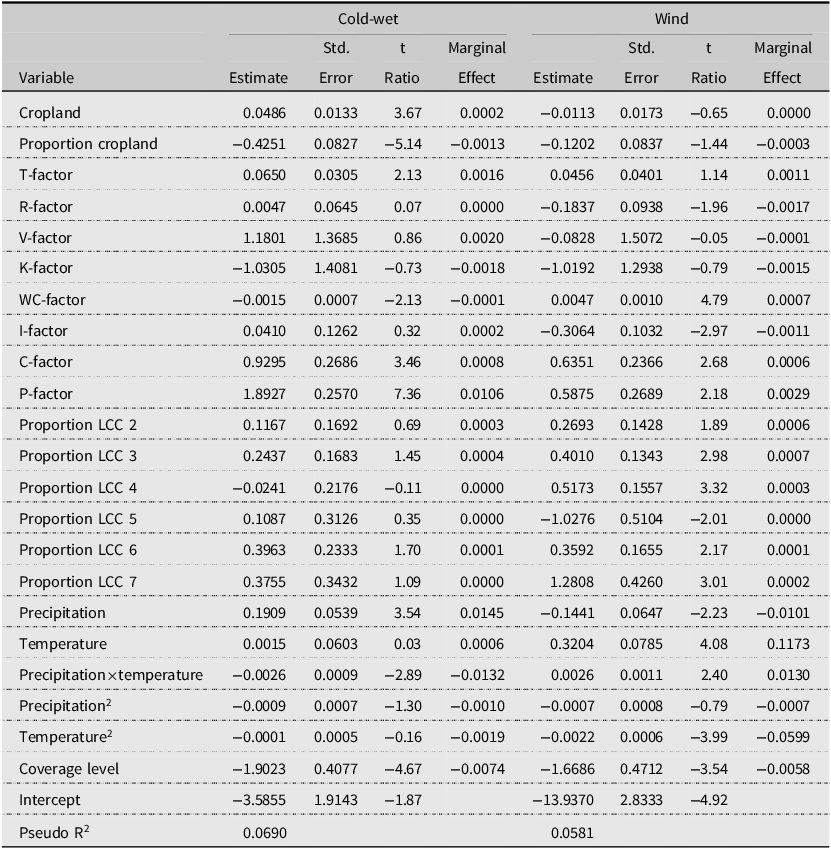
Table 6 contains results for cold-wet weather and wind causes of loss. Losses due to cold-wet weather, representing early season crop risks, are more likely to occur in counties with more cropland and a higher proportion of rural land as cropland. In Table 6, cold-wet losses are positively related to total cropland acreage, reflecting a scale-exposure effect: counties with more cropland simply have more acres at risk during early-season cold or wet conditions. In contrast, the proportion of cropland is negatively related to cold-wet losses. Counties with a high share of land in cropland tend to be core agricultural regions with better-drained soils, more suitable land, and more established management practices, which can reduce vulnerability to cold-wet hazards. A higher T-factor, which relates to a higher tolerance of erosion, is positively associated with cold-wet losses, suggesting that large, highly productive cropping areas may remain exposed to early-season cold and wet conditions. A higher WC-factor, representing climate-related erosivity, is negatively associated with cold-wet weather losses. Higher values of the C- and P-factors are positively related to cold-wet losses. This pattern suggests that more intensive tillage with lower residue cover (high C) and weaker support practices (high P) may reduce soil cover and surface stability, making counties more vulnerable when soils are cold and wet. Land capability classes generally do not appear to be significantly related to losses from cold-wet weather.
Fractional probit estimates for cold-wet and wind causes of loss

Table 6 Long description
The table presents a comparison of estimates, standard errors, t-ratios, and marginal effects for cold-wet and wind causes of loss across various variables. It includes data for variables such as cropland, proportion cropland, T-factor, R-factor, V-factor, K-factor, WC-factor, I-factor, C-factor, P-factor, and proportions of different land cover classes (LCC). Additionally, it covers precipitation, temperature, and their interactions and squared terms. The table also includes coverage level and intercept values. The data is organized into two main sections: Cold-wet and Wind. Each section lists the estimate, standard error, t-ratio, and marginal effect for each variable. Notable trends include significant t-ratios for variables like proportion cropland, T-factor, and P-factor in the cold-wet section, and variables like proportion LCC 7 and temperature in the wind section. The table provides a comprehensive overview of the factors influencing loss ratios and loss-cost ratios for different causes of loss.
Finally, Table 6 contains estimates of a model of wind-related losses. Climate erosivity, represented by the WC-Factor, is positively related to wind losses. This suggests that areas with higher wind speeds – which contribute to higher WC-values – are more exposed to wind-driven damage. Inherent erodibility, represented by the I-factor, is negatively related to wind losses. A higher C-factor, representing cover and management practices, is positively related to wind-related losses. A higher P-factor, reflecting erosion management practices, is positively related to wind-related losses. In general, as land quality decreases, as represented by the land capability factor, wind-related losses increase.
Coverage level tends to be negatively associated with losses from each of the hazards considered. It appears that policies with higher coverage levels tend to have lower loss-cost ratios, once the loss-costs are conditioned on soil characteristics. This is in contrast to expectations, but the effect is robust across different causes of loss.
In all, the results confirm that many soil characteristics are associated with crop insurance losses. Loss ratios are found to be generally significantly positively related to those factors associated with increased soil erosion. A higher degree of vegetative cover is associated with lower loss ratios. These results suggest that current premium rates may not fully capture risks associated with soil characteristics, especially those associated with increased vulnerability to soil erosion.
Soil characteristics have varied relationships with hazard-specific risks. A leading cause of loss in the crop insurance program is drought, which has an average loss cost ratio of 2.8%. Losses associated with excessive moisture, which would include prevented planting losses, are also a major cause of loss, with an average loss cost ratio of 3.17%. The soil characteristics are positively associated with increased soil erosion. Soil characteristics have varied influences on other hazard-specific losses.
3.1. Implications for crop insurance rating
As we have noted, to the extent that premium rates are accurate, soil characteristics should not be related to loss ratios. Federal statute requires that premium rates be actuarially sound with an expected target loss ratio of 1.0. Of course, actuarial soundness is an ex ante concept, and losses in any given year may result in loss ratios that differ substantially from 1.0. We utilize a longer-run average (over the 2013–2024 period) of loss ratios to consider the extent to which premium rates, through loss ratios, incorporate relevant information about soil characteristics. Our results suggest that rates could be further refined to improve the actuarial performance of the program.
Rating procedures currently used in the federal crop insurance program are reviewed by Coble et al., Reference Coble, Knight, Goodwin, Miller and Rejesus2010. Under current procedures, a base premium rate is given by
 $$Rate = \left({\left({{APH} \over {Ref\_Yield}}\right)^\epsilon} \times Ref\_Rate + Fixed\_Rate\right) \times Differential$$
where APH is the insured’s actual production history yield, Ref_Yield is the county reference yield, ϵ is an exponent parameter, Ref_Rate is the base reference rate, Fixed_Rate is a fixed rate component, and Differential is a differential used to adjust rates for different coverage levels. The reference rate is comprised of historical loss-cost ratios and is fixed at the county level. The reference rate summarizes average loss risks in a county and would seem to be the most appropriate point for adjusting rates to incorporate soil characteristics information. Our results have indicated that loss ratios and loss cost ratios are influenced by the NRI soil characteristics. An appropriate avenue for adjusting rates would appear to involve a regression of overall loss cost ratios on the soil characteristics and to make adjustments to reference rates on the basis of such a regression. This remains an important topic for future research. It is relevant to note that the actuarial performance of the program is heterogeneous across different regions in the US.Footnote 10 This spatial heterogeneity may in part be reflective of differences in soil characteristics, which have been shown to be significantly related to ex-post loss ratios.
4. Concluding remarks
We examined the relationship between soil characteristics and crop insurance losses, where the latter represent a reliable measure of overall yield risks. Using county-level NRI soil data and RMA crop insurance data from 2013 to 2024, we find that several different soil characteristics are related to overall loss ratios in the program. If premium rates adequately accounted for the risks associated with soil characteristics, there should be no relationship between loss ratios and the soil characteristics. Thus, our results suggest that gains in the accuracy of insurance premium rates may be achievable through a greater focus on soil characteristics.
We also analyzed the relationships between specific hazards – loss-cost ratios due to drought, excessive heat, excessive moisture, flooding, cold and wet conditions, and wind – and the aforementioned soil characteristics. Different hazards exhibit heterogeneous relationships with various soil properties. In general, characteristics associated with erosion and other production risks tend to be related to losses associated with individual hazards.
Our results contribute to a better understanding of the linkages among soil characteristics and yield risks. Insurance payments reflect the associated yield risk, and we have decomposed these payments into components associated with specific hazards such as drought, excessive heat, excessive moisture, flooding, cold and wet conditions, and wind. This hazard-specific approach helps clarify the channels through which soil conditions influence insured yield risks.
Taken together, the results indicate that current rating procedures may not fully capture the information embedded in NRI soil measures. Incorporating soil characteristics into the determination of county reference rates could improve the actuarial performance of the program and better align premiums with underlying production risks. Since our analysis is conducted at the county level – the geographic unit at which base rates are set – these findings have direct relevance for ongoing discussions about refinements to crop insurance rating.
Future research may benefit from integrating soil characteristics associated with erosion into rating formulas, examining dynamic adjustments of rates as soil conditions evolve, and combining county-level NRI data with information on management practices. Additional insight could also come from analyzing hazard-specific loss ratios, which could provide greater clarity on how particular soil characteristics relate to crop insurance premium rates and losses, as well as additional insight into how soil factors interact with drought, excess moisture, and other sources of risk, thereby informing both crop insurance design and broader soil conservation policy.
Acknowledgements
The work of Rejesus on this research was supported in part by the following: (i) NASA Grant 80-NSSC23-M0034 (The NASA ACRES Consortium Subaward from U. of Maryland), (ii) USDA NRCS Grant No. 2021-1033/NR213A750013G022 (Real-Time Farmer Learning on Benefits of Cover Crops for Managing Soil Health, and Water and Nutrients Dynamics), (iii) USDA NRCS Grant No. 2023-1372/134157-Z5393201 (Implementing a Climate-Smart Precision Cover Crop and Nitrogen Management Decision Support Tool), (iv) the Climate Adaptations through Agricultural and Soil Management Project (CASM) (from NCSU Reduction and Reversal of CO2 Research Endowment), and (v) USDA NIFA Hatch Project No. NC02959. The research effort of Rejesus is part of a regional collaborative project supported by the USDA-NIFA, Award No. 2019-68012-29818, titled Precision Sustainable Ag Coordinated Agricultural Project (PSA CAP): A Cover Crop Network for Enhancing the Sustainability of US Cropping Systems (http://precisionsustainableag.org).


 Open access