


1. Introduction
High density DNA markers contain information about the genetic history of a population. For instance, they can be used to infer the effective population size, recombination rate (e.g. Hudson & Kaplan, Reference Hudson and Kaplan1985; Nielsen, Reference Nielsen2000) or the existence of recent strong selection (e.g. Sabeti et al., Reference Sabeti, Reich, Higgins, Levine, Richter, Schaffner, Gabriel, Platko, Patterson, Mcdonald, Ackerman, Campbell, Altshuler, Cooper, Kwiatkowski, Ward and Lander2002). High density markers are also used in a variety of multi-marker models to estimate the probability that individuals carry the same alleles at a putative quantitative trait loci (QTLs) by exploiting the presence of linkage disequilibrium (LD) between markers and the causal mutation (e.g. Meuwissen & Goddard, Reference Meuwissen and Goddard2001; Durrant et al., Reference Durrant, Zondervan, Cardon, Hunt, Deloukas and Morris2004; Zollner & Pritchard, Reference Zollner and Pritchard2005; Minichiello & Durbin, Reference Minichiello and Durbin2006; Lencz et al., Reference Lencz, Lambert, Derosse, Burdick, Morgan, Kane, Kucherlapati and Malhotra2007).
Some historical information can be gained by considering the markers independently (e.g. single marker homozygosity), but further information resides in the LD between markers (Nordborg & Tavare, Reference Nordborg and Tavare2002). A variety of methods exist to measure pairwise LD based on allele frequencies and frequencies of two loci haplotypes (Zhao et al., Reference Zhao, Nettleton and Dekkers2007). However, it has been pointed out that these measures are very diverse and likely not as informative for inferring population history or for QTL mapping compared to using data from multiple markers along a segment (Nordborg & Tavare, Reference Nordborg and Tavare2002).
Although we cannot observe chromosome segment identity by descent (IBD) status directly, we can observe whether or not two haplotypes contain identical marker alleles along a particular segment. That is, they are observed to be identical by state (IBS) and this run of homozygous markers may occur through recombination. We will refer to an unbroken run of homozygous markers as ‘haplotype homozygosity’ (HHn). The pairs of observed haplotypes may be in the same or different individuals in a randomly breeding diploid population, and HHn is predicted for observed runs of 2, 3, … to n markers, at any specified recombinant distances. Sabatti & Risch (Reference Sabatti and Risch2002) developed a multilocus measure of haplotype homozygosity in diploids and demonstrated its use to measure LD. However, their method is based on observed allele frequencies in the population sample, rather than on historical population parameters, and is computationally demanding for more than two loci. It would not be possible, therefore, to use their method to infer ancestral population history.
To infer information about population parameters from multiple marker haplotype homozygosity data or to use HHn for QTL analysis, we need theory that adequately predicts HHn from historical population parameters. Having developed an analytical HHn predictor, we can then use it for example to:
(1) work backwards using observed HHn sampled from a population to predict the population parameters (e.g. Meuwissen & Goddard, Reference Meuwissen and Goddard2007)
(2) predict the likely sharing of alleles at a putative QTL position given the observed surrounding HHn, using either estimated population parameters from 1 above (e.g. Meuwissen & Goddard, Reference Meuwissen and Goddard2007) or assumed parameters.
A full coalescent analysis of the data would be desirable but is not practical for large numbers of markers in many individuals with recombination (e.g. Zollner & Pritchard, Reference Zollner and Pritchard2005). A practical alternative is to consider the HHn of marker data on pairs of haplotypes which can be summarized for all possible pairs of chromosome segments which are genotyped. Hill & Weir (Reference Hill and Weir2007) present an algorithm for exact forward-in-time predictors of ‘multilocus IBD’ (their terminology for our HHn) between two haplotypes from a randomly breeding population, based on exact two loci methodology (Weir & Cockerham, Reference Weir and Cockerham1974). The authors point out, however, that their methodology is only applicable to haploid populations and quickly becomes cumbersome for more than four loci. An approximate method was then developed for an extended number of loci, which can be more practically applied to both haploid and diploid populations (Hill & Hernandez-Sanchez, Reference Hill and Hernandez-Sanchez2007). Although this approximate method was generally a good predictor of observed HHn in simulated populations, it becomes less reliable when mutation is included in the model (Hill & Hernandez-Sanchez, Reference Hill and Hernandez-Sanchez2007).
In contrast to the forward-in-time prediction of Hill & Hernandez-Sanchez (Reference Hill and Hernandez-Sanchez2007), Meuwissen & Goddard (Reference Meuwissen and Goddard2007) published an approximate coalescence approach for the prediction of pairwise multi-marker HHn, which they extend to estimate effective population size and to predict allele sharing status of a putative QTL position. Their methodology is an extension of a previously published method (Meuwissen & Goddard, Reference Meuwissen and Goddard2001) which has proven effective for QTL mapping in farm livestock (e.g. Farnir et al., Reference Farnir, Grisart, Coppieters, Riquet, Berzi, Cambisano, Karim, Mni, Moisio, Simon, Wagenaar, Vilkki and Georges2002; Olsen et al., Reference Olsen, Lien, Gautier, Nilsen, Roseth, Berg, Sundsaasen, Svendsen and Meuwissen2005; Gautier et al., Reference Gautier, Barcelona, Fritz, Grohs, Druet, Boichard, Eggen and Meuwissen2006). The extended methodology includes the effect of mutation at the markers, which was not previously accounted for (Meuwissen & Goddard, Reference Meuwissen and Goddard2007). There are, however, still some approximations in their method and it was not developed for ancestral changes in population size (see this paper).
Effective population sizes (N) are likely to change over time; for example, some human populations are thought to have undergone a bottleneck (i.e. sharp reduction in size) followed by expansion (e.g. Pluzhnikov et al., Reference Pluzhnikov, Di Rienzo and Hudson2002; Tenesa et al., Reference Tenesa, Navarro, Hayes, Duffy, Clarke, Goddard and Visscher2007). This is likely to affect the observed homozygosity patterns, so the theory needs to predict HHn under these conditions. In fact, it has been demonstrated with simulations that estimates of segment homozygosity for a wide range of chromosome segment lengths can be used to estimate N at multiple times in the past (Hayes et al., Reference Hayes, Visscher, McPartlan and Goddard2003).
We develop a new method to predict HHn that aims to avoid some of the approximations of the above two methods of Hill & Hernandez-Sanchez (Reference Hill and Hernandez-Sanchez2007) and Meuwissen & Goddard (Reference Meuwissen and Goddard2007), and accommodates recombination and mutation as well as changing population size. It is based on coalescence theory, but considers multilocus data in pairs of haplotypes, summarized across all possible pairs by HHn. We compare results from our methodology with the above two published predictors of HHn, as well as our modified version of the Meuwissen & Goddard (Reference Meuwissen and Goddard2007) method. We compare these results with HHn data from simulated populations, including comparisons where population sizes vary over time.
Our method is consistently equal to or more accurate than the above methods, given a wide range of parameters tested. Using simulated populations with and without bottlenecks, we demonstrate that depending on the density of markers, HHn patterns can be considerably altered by ancestral changes in N. McQuillan et al. (Reference Mcquillan, Leutenegger, Abdel-Rahman, Franklin, Pericic, Barac-Lauc, Smolej-Narancic, Janicijevic, Polasek, Tenesa, Macleod, Farrington, Rudan, Hayward, Vitart, Rudan, Wild, Dunlop, Wright, Campbell and Wilson2008) found that the proportion of longer runs of homozygous single nucleotide polymorphism (SNP) markers within individuals in European populations (300 000 SNP panel) is clearly related to variations in recent population history. We demonstrate that our new method (herein referred to as MHH) predicts a pattern of HHn that matches the pattern observed in a genotyped cattle population, given appropriate estimates of changing past population size.
2. Methods
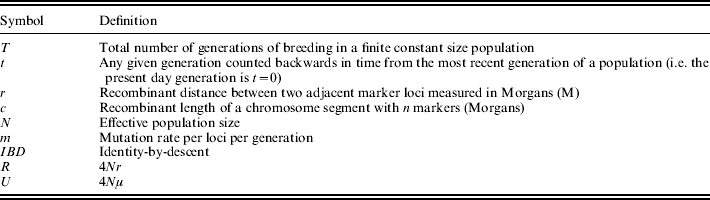
Notation used in this section is detailed in Table 1. Populations are assumed to be panmictic, diploid, with no selfing and no selection or migration. Mutation rate is assumed equal across all alleles. The recombination rate can vary between allele pairs for all analytical methods tested, and marker haplotypes are assumed known without error. A range of parameters were tested to both represent realistic marker densities now available for QTL and population genetics studies in humans and animals, but also to test the robustness of the different methodologies to more extreme parameters similar to full genome sequence data.
General notation presented in this section
HHn can be modelled in an ‘equilibrium population’ with constant size and subject to the balancing forces of drift, recombination and mutation. Additionally, HHn predictions can be extended to a dynamic population which varies in size over time and may not be in equilibrium.
(i). New method of predicting multilocus HHn – MHH
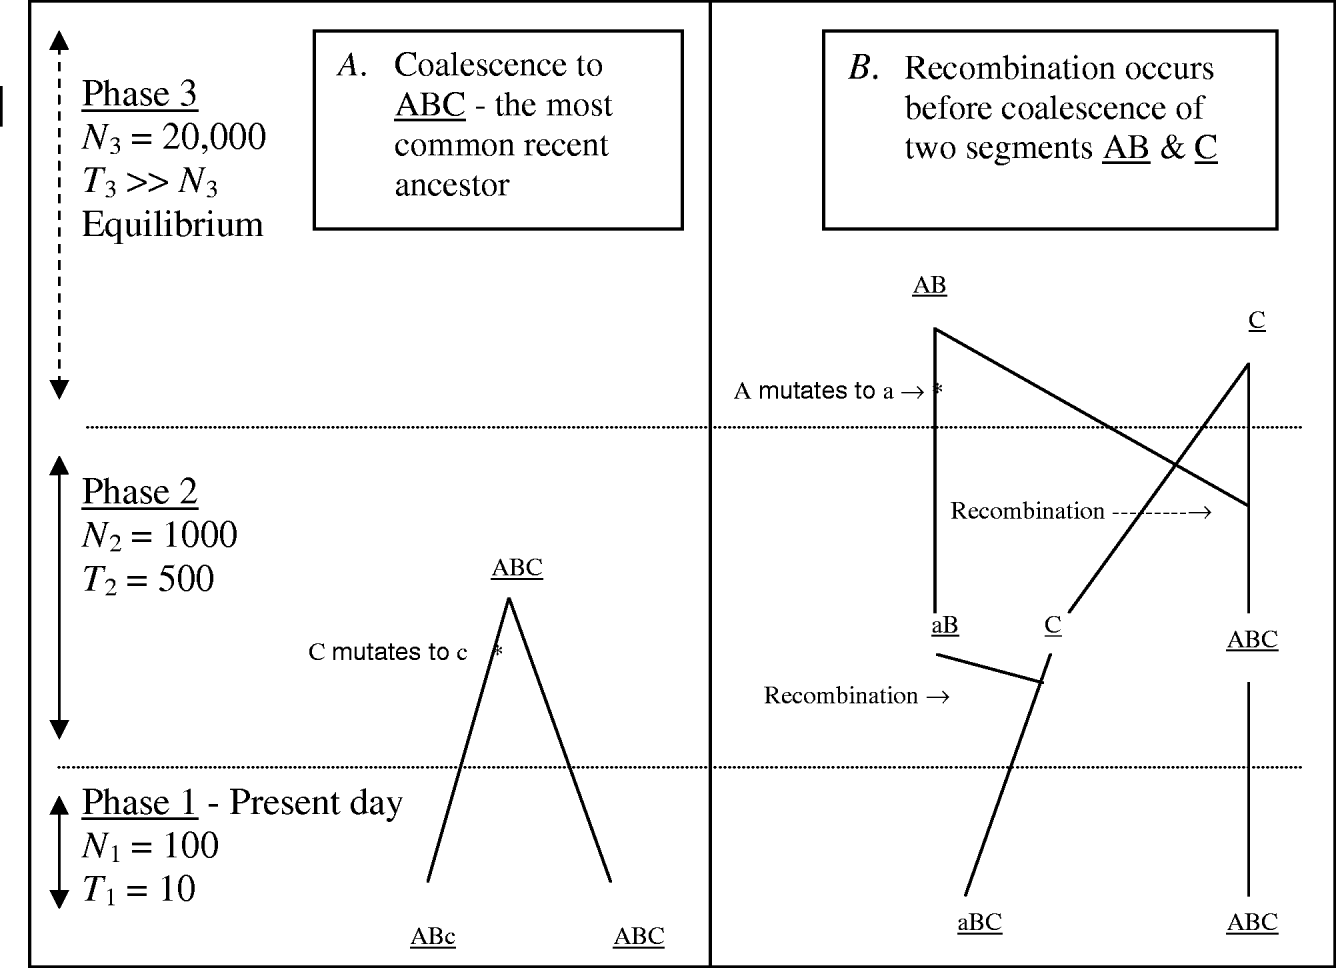
MHH predicts the probability of multilocus HHn for a pair of randomly sampled haplotypes with n markers, using a simplified coalescence approach. Multiple adjacent markers along only one pair of chromosome segments are traced backwards in time. Figure 1 outlines some possible events when tracing a pair of chromosome segments back in time, until coalescence with their most recent common ancestor, with ancestral changes in N expressed as ‘phases’.
Two possible coalescence pathways for a pair of chromosome segments with three markers, in a population which changes in size ancestrally (divided into three ‘phases’). Tracing two DNA segments back in time, in coalescence A there is no recombination or coalescence in phase 1, and coalescence occurs in phase 2 with a mutation event on one segment. In coalescence B, both gametes recombine in phase 2 and in phase three loci ‘a’ mutates, followed by coalesce of segments AB and C.
Assuming first a constant-sized population, the joint probability of homozygosity for all n markers (HHn) can be split into two periods, where n is the total number of markers on a segment of recombinant distance c Morgans:
(1) No coalescence, no recombination and no mutation (i.e. ‘no event’) for t generations. Let the probability of no event in one generation be written as
(1)
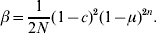
(2) At generation t+1 an event takes place; either coalescence or recombination, and no mutation. The probability of coalescence at generation t+1 (no recombination and no mutation) is
(2)If the event is recombination, we calculate the probability of recombination in each possible interval between two adjacent markers k and k+1 and include the joint probability that all markers on both recombined segments will then coalesce or recombine without mutation. For more than two markers on a segment, we have to sum all possible recombination probabilities for each interval between adjacent markers k and k+1. Additionally, we trace back the HH1 to k and HHk+1 to n probabilities of the recombined segments, therefore sequentially computing haplotype homozygosity probabilities first for all two loci segments, then three loci, to four, etc. The probability of recombination in any given marker interval, including the joint HH of the recombined segments, is
(3)where rk,k+1j is the recombinant distance between marker k and k+1. We ignore the possibility of more than one recombination per segment within one generation.


Combining the two periods above gives the total probability of marker haplotype homozygosity as
![HH_{n} \equals \left[ {\mathop\sum\limits_{t \equals \setnum{0}}^{T \minus \setnum{1}} {\lpar \alpha \rpar ^{t} } } \right]\lpar \beta \plus \tau \rpar .](https://static.cambridge.org/binary/version/id/urn:cambridge.org:id:binary:20160920235758976-0995:S0016672309990358:S0016672309990358_eqn4.gif?pub-status=live)
To accommodate changing effective population sizes going back in time, we model the probabilities of no event followed by an event within each of the different historical population sizes, which we refer to as ‘Phases’. Figure 1 shows a population, where effective size (N) has reduced from very large ancestrally to small in the present day, and the changes are attributed to three major historical phases (1, 2 and 3 going back in time). We calculate the probability of no event for t generations, followed by the event of coalescence or recombination occurring within any given ith phase of variable population size, and then sum the probabilities across all phases (HH All Phases now dropping the ‘n’ subscript for simplicity).
The probability of no event occurring for any given number of t 1 generations followed by an event within phase 1 is as before:
![HH_{{\rm Phase} \ \setnum{1}}\equals \left[ {\mathop\sum\limits_{t \equals \setnum{0}}^{T_{\setnum{1}}\minus \setnum{1}} {\lpar \alpha _{\setnum{1}} \rpar ^{t} } } \right]\lpar \beta _{\setnum{1}} \plus \tau _{\setnum{1}} \rpar \equals \left( {{{1 \minus \alpha _{\setnum{1}} ^{T_{\setnum{1}} } } \over {1 \minus \alpha _{\setnum{1}} }}} \right) \lpar \beta _{\setnum{1}} \plus \tau _{\setnum{1}} \rpar \comma](https://static.cambridge.org/binary/version/id/urn:cambridge.org:id:binary:20160920235758976-0995:S0016672309990358:S0016672309990358_eqn5.gif?pub-status=live)
where subscript ‘1’ refers to phase 1 (present day) population parameters.
For each ith phase going back in time (before present), we calculate the probability of no event for t generations in phase i, and the probability that no event had occurred in any of the more recent phases:
![\eqalign{\tab HH_{{\rm All} \ {\rm Phases}} \equals \lcub HH_{{\rm Phase} \ \setnum{1}} \rcub\plus \cr \tab \left[ {\mathop\sum\limits_{i \equals \setnum{2}}^{{\rm most} \ {\rm ancestral} \ {\rm Phase}} {\left[ {\prod\limits_{h \equals \setnum{1}}^{i \minus \setnum{1}} {\lpar \alpha _{h} \rpar ^{T_{h} } } } \right]} \left( {{{1 \minus \alpha _{i} ^{T_{i} } } \over {1 \minus \alpha _{i} }}} \right) \lpar \beta_{i} \plus \tau _{i} \rpar } \right]\comma \cr}](https://static.cambridge.org/binary/version/id/urn:cambridge.org:id:binary:20160920235758976-0995:S0016672309990358:S0016672309990358_eqn6.gif?pub-status=live)
where subscript i refers to a particular phase counting from the present day, with a stable population size Ni, h designates phases more recent to phase i, and Ti or Th is the total number of generations in phase i or h. The joint HH of the two recombined segments ( ) in ‘τi’ above, should be traced back in time from the generation in which recombination took place within a given phase. To simplify this computationally, we approximate by assuming recombination always takes place in the first generation of a given phase. Any associated error can be minimized by splitting a long phase into a number of shorter phases (see section 3). To avoid this approximation, each phase can be reduced to a single generation, although computing time may ultimately enforce practical limitations.
(ii). Meuwissen & Goddard method – MG
The method developed by Meuwissen & Goddard (Reference Meuwissen and Goddard2007) (hereafter called ‘MG’) predicts the probability of observed markers on a pair of haplotypes being homozygous. Their model is also a simplified coalescence approach that assumes that all haplotype pairs eventually coalesce or recombine if traced an infinite number of generations back in time. Their probability of observing marker homozygosity depends on the probability of the unobserved underlying IBD pattern at and between the markers. It was developed for constant-sized equilibrium populations only.
(iii). Modifications to Meuwissen & Goddard – MGmod
We develop a modified version of MG (MGmod) that allows for variable ancestral population sizes and includes two other minor improvements. Implementation for MGmod is given in Appendix A.
(iv). Hill and Hernandez–Sanchez method – HHF
The approximate HHn predictor (tracing events forward in time) developed by Hill & Hernandez-Sanchez (Reference Hill and Hernandez-Sanchez2007), can be used for either equilibrium or dynamic populations with variable N. The method (hereafter called HHF) initially predicts non-IBD probability which is then used to calculate HHn (or ‘multilocus IBD’), for any number of markers on the segment (Hill & Hernandez-Sanchez, Reference Hill and Hernandez-Sanchez2007). Their method predicts IBD of alleles with respect to a base population in which all alleles are considered unique, while our coalescence method considers observed IBS. The Hill & Hernandez-Sanchez (Reference Hill and Hernandez-Sanchez2007) definition of ‘multiloci IBD’ is that each pair of homozygous loci trace back to a common ancestor, but adjacent homozygous loci may coalesce in different ancestors if there has been intervening recombination. The method is based on an approximation for multilocus segments which requires all adjacent two loci non-IBD probabilities are calculated by the exact transition matrix method of Weir & Cockerham (Reference Weir and Cockerham1974). In this paper, we consider only diploid populations and include mutation, recombination and variable ancestral population size in the transition matrix calculations.
(v). Simulated genotype data and observed patterns of HH n
We forward simulated Wright–Fisher randomly breeding populations of diploid individuals with no selfing. To save computational time, we simulate a given number of pre-determined marker positions on chromosome segments, with an equal probability of recombination between each adjacent marker. All alleles in the founder population are unique and simulations were designed to reach equilibrium before varying population sizes in more recent generations. Alleles have equal probability of mutation and each mutation event is recorded uniquely, giving an infinite alleles model. Variable input parameters include: effective population size, number of generations, as well as mutation and recombination rate. Simulations accommodate changing population parameters for any given number of generations, i.e. ‘i phases’ with different N i, r i and μi for T i generations.
The average single and multiple marker HH n can be calculated over any given number of replicated populations (calculating a mean standard error of HH n estimated across replicates). Results from simulations are averaged over 1000–5000 replications, having found this number to give standard errors of less than 1% of the mean. To improve computational efficiency in simulations where population size and number of generations were very large (N⩾1000), we scaled down the N and T, with the corresponding r and μ scaled up proportionately to maintain original R and U values, (as implemented by Hayes & Goddard, Reference Hayes and Goddard2003 and Hoggart et al., Reference Hoggart, Chadeau-Hyam, Clark, Lampariello, Whittaker, De Iorio and Balding2007). This has almost no effect on the final HHn predictions because it is the U and R values that control the coalescence of linked markers (Hudson, Reference Hudson, Futuyma and Antonovics1991). The HHn results from the simulations were used to benchmark the different analytical predictions of HHn.
(vi). Observed HHn in a panel of dense SNPs genotyped in dairy cattle
We use a panel of dense bovine SNP genotypes to check whether or not we can use our method to predict the observed HH n patterns in real data, given appropriate estimates of the population parameters. Individual SNP genotypes were obtained for 798, Australian Holstein–Friesian bulls with an outbred pedigree, using the Illumina® Infinium BovineSNP50 BeadChip with approximately 56 000 SNPs. Samples were screened for the proportion of missing genotypes, and animals with greater than 10% missing genotypes were removed. The SNPs were included only if they met the following criteria; call rate >90% and minimum allele frequency (MAF)>0·05. SNPs with no recorded heterozygotes were excluded and any animals with genotypes incompatible with pedigree were removed. After screening, 730 out of the 798 animals were retained for the analysis. There were 38 259 SNPs that satisfied all selection criteria and only autosomal SNPs were used.
The SNPs were ordered by chromosome position using Bovine Genome Build 4·0 (http://www.ncbi.nlm.nih.gov/projects/genome/guide/cow/). For animals with <10% of missing genotypes, we imputed alleles using fastPHASE (Scheet & Stephens, Reference Scheet and Stephens2006), having first confirmed the likely high accuracy of this by deleting and imputing a small proportion of known genotypes in our data set. According to the physical positions of the SNPs, the average spacing of the markers retained for this study across the genome is 0·066 megabase pairs (Mb).
HHn was measured within animals to avoid inaccuracies in haplotyping or bias due to some sampled animals possibly being more highly related than the average of the population. Genotypes were checked for unbroken runs of homozygous markers, and we recorded the number of adjacent homozygous SNPs, as well as the physical length of each homozygous segment. We do not have data for the recombinant distance between SNPs so we assume 1 Mb is approximately equal to the recombinant distance of 1 centi-Morgan (cM) (Arias et al., Reference Arias, Keehan, Fisher, Coppieters and Spelman2009 estimated an average of 1 Mb=1·25 cM in cattle).
We define HHn in this data as the probability of n adjacent SNPs being homozygous. We calculated HHn assuming equal recombinant distance between markers genome wide:
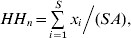
where n is a given number of markers on a homozygous haplotype for which HH n probability is being calculated, i is every possible overlapping segment with n markers along the entire genome, numbered 1 to S, xi is the total number of individual animals homozygous for each segment i and A is the total number of animals genotyped.
(vii). Estimating effective population size from observed cattle HHn
We explored the feasibility of using our HH n methodology to work backwards to estimate population size given observed HH n in the above data. We exploit the theory that LD over shorter distances reflects more ancestral population parameters than LD at larger distances. LD on a segment size of c Morgans is most affected by the population size approximately 1/(2c) generations in the past, assuming a linearly changing population size (Hayes et al., Reference Hayes, Visscher, McPartlan and Goddard2003). We used the following steps with iterations until a close fit of predicted HH n to the observed HH n was achieved:
(1) Assume prior knowledge of the most ancestral population size.
(2) Assume the recombination distances are known without error.
(3) Adjust mutation rate to match single marker homozygosity observed in the data.
(4) Assess the fit of predicted HHn to observed HHn across each segment length with 2, 3, 4, etc. markers, using the chosen parameters and reject Ni. if:
where δ is a predetermined threshold (we used 0·07).(5) If the data does not fit the observed HH n pattern: start at the poor fit position with the smallest segments (c Morgans), and estimate the approximate number of generations back in time (T i) for which the estimate of population size is incorrect (~1/(2c)). Then either:
(a) Introduce a new ‘phase’ of changed population size from this generation forward in time if HHn is not accurately predicted for all segment sizes larger than that being considered.
(b) Or, if only a section of the curve fits poorly then adjust population size in an existing or new phase, only over the generations for which HHn is not well predicted.

Repeat steps 3, 4 and 5 until the predicted HHn fits the observed HHn pattern across all segment lengths.
3. Results
We show limited results for MGmod because this method was equal to or less accurate than MHH for all comparisons.
(i). Equilibrium constant sized population
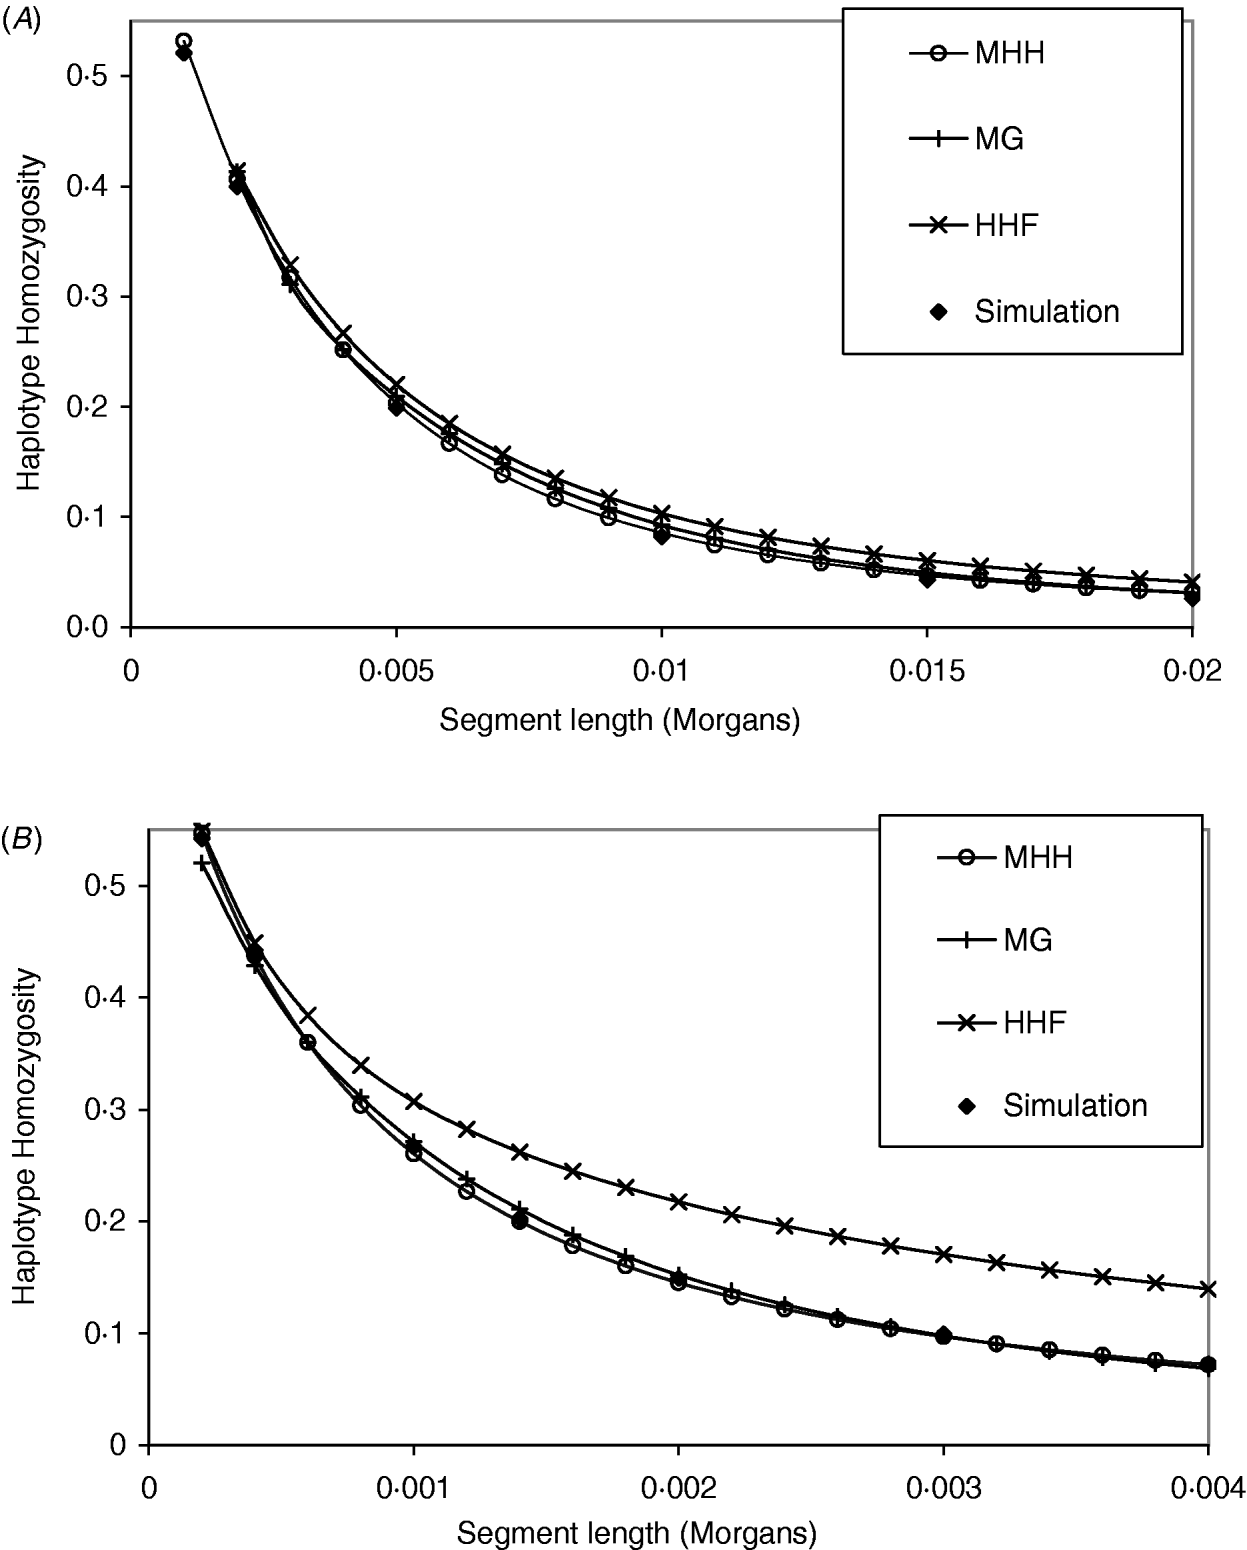
The analytical methods were first compared under the assumption of a neutral Wright–Fisher constant sized equilibrium population. Studies of physical and linkage maps in cattle and humans found that on average 1·25 and 1·27 cM are equivalent to 1 Mb (Kong et al., Reference Kong, Murphy, Raj, He, White and Matise2004; Arias et al., Reference Arias, Keehan, Fisher, Coppieters and Spelman2009), implying that intersite recombination rates are approximately 1·3×10−8. Given that single nucleotide mutation rates are generally considered to be of a similar order (Nachman & Crowell, Reference Nachman and Crowell2000), we start with values of r similar to μ. Figure 2 A and B compare methods with identical population parameters U=4Nμ=0·4, except for a change in the recombination rate between markers (r); R=4Nr=2 in Fig. 2 A and R=0·4 in Fig. 2 B. In Fig. 2 A, all methods give results which are close to those of simulated populations with identical population parameters. In contrast, the parameters in Fig. 2 B show that HHF considerably overestimates the probability of HHn compared to the simulated results, particularly as the number of markers on the segment increases. In Fig. 2 A and B, MHH and MG, agree closely with the simulated HHn, across a range of segment lengths. Computationally, MHH is fast and can easily be implemented with multilocus predictions for hundreds of markers.
(A, B) Graphs show HHn for chromosome segments with 2, 3, 4, etc. markers, that are evenly spaced. All populations have reached a drift–recombination–mutation equilibrium, assuming N=500, T=8000, μ=0·0002. In (A) marker intervals (r) are 0·001 M compared to (B), where r=0·0002. Comparisons are made between HHn predictions using three analytical methods and observed HHn in simulated populations (average of 2000 replicates).
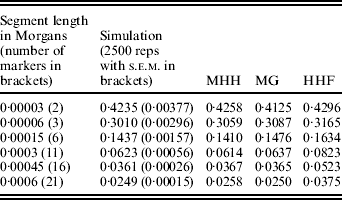
A further comparison of predicted and observed HHn was made with U constant at 0·6 (N=15 000, μ=1×10⁻⁵), while R is 36 (i.e. r=60μ) or R=1·8. Given this N, the marker spacing with R=36 is similar to that for 60 000 SNPs evenly spaced on the bovine or human genome assuming approximate genome size of 35 M (Kong et al., Reference Kong, Murphy, Raj, He, White and Matise2004; Arias et al., Reference Arias, Keehan, Fisher, Coppieters and Spelman2009), while R=1·8 is approximately equivalent to 1·2 million SNPs. With R=36 and r=60μ, all methods agree almost exactly with the simulated populations (results not shown), but with R=1·8, HHF over predicts HHn compared to the simulation values (Table 2). HHF is sensitive to the rate of mutation relative to recombination rates, performing well when μ≪r but less well as they approach similar values.
Observed (simulated data) and predicted HHn (three methods) with population parameters; N=15 000, T=300 000, μ=0·00001 and r=0·00003
(ii). Dynamic population – large ancestral size to small present day
All methods were tested for scenarios where the population size varies over time, excluding the MG method because it was not developed for changing population sizes. For this example, parameters reflect estimated population dynamics in domestic cattle and their ancestors (Gautier et al., Reference Gautier, Faraut, Moazami-Goudarzi, Navratil, Foglio, Grohs, Boland, Garnier, Boichard, Lathrop, Gut and Eggen2007; de Roos et al., Reference de Roos, Hayes, Spelman and Goddard2008). The population is characterized by four distinct ‘phases’ decreasing from a very large ancestral size (in equilibrium) to very small:
Phase 4: ancestral size of 100 000 (600 000 generations) in equilibrium.
Phase 3: N=2500 for 1500 generations.
Phase 2: N=300 for 270 generations.
Phase 1: N=100 for five generations (from present day).
Phases 1–3 are not in equilibrium. The marker interval is 0·0015 M (i.e. approximately 20 000 markers on the bovine genome) and μ=1×10⁻⁵. These parameters result in average single marker homozygosity of 0·62 in the simulations (equivalent to bovine SNP data analysed in this study).
Figure 3 shows that HHF and MGmod method lie reasonably close to the observed values of HHn in simulated data. MHH, overestimates HHn when calculated over four phases of changing N. This is expected due to the approximation of following the HHn probability of recombined segments back in time from the most recent generation of each different phase of changed population size, when in fact the recombination may take place at any generation within each phase (see Methods section). We correct the overestimation by splitting longer non-equilibrium phases into an increased number of shorter phases and Fig. 3 shows two extra HHn curves calculated with MHH using this correction (16 or 1776 phases).
Predictions of HHn using three analytical methods compared to observed values in simulated populations (average of 5000 replicates). Population size is changing over time from very large ancestral N=100 000, and gradually decreasing to present day N=100. (r=0·0015 M and μ=10−5). There are four phases of differing population size. HHn predicted by MHH is shown for these four phases, but also calculated with non-equilibrium phases split into a number of shorter phases (16 or 1776 phases total), to reduce approximation error.
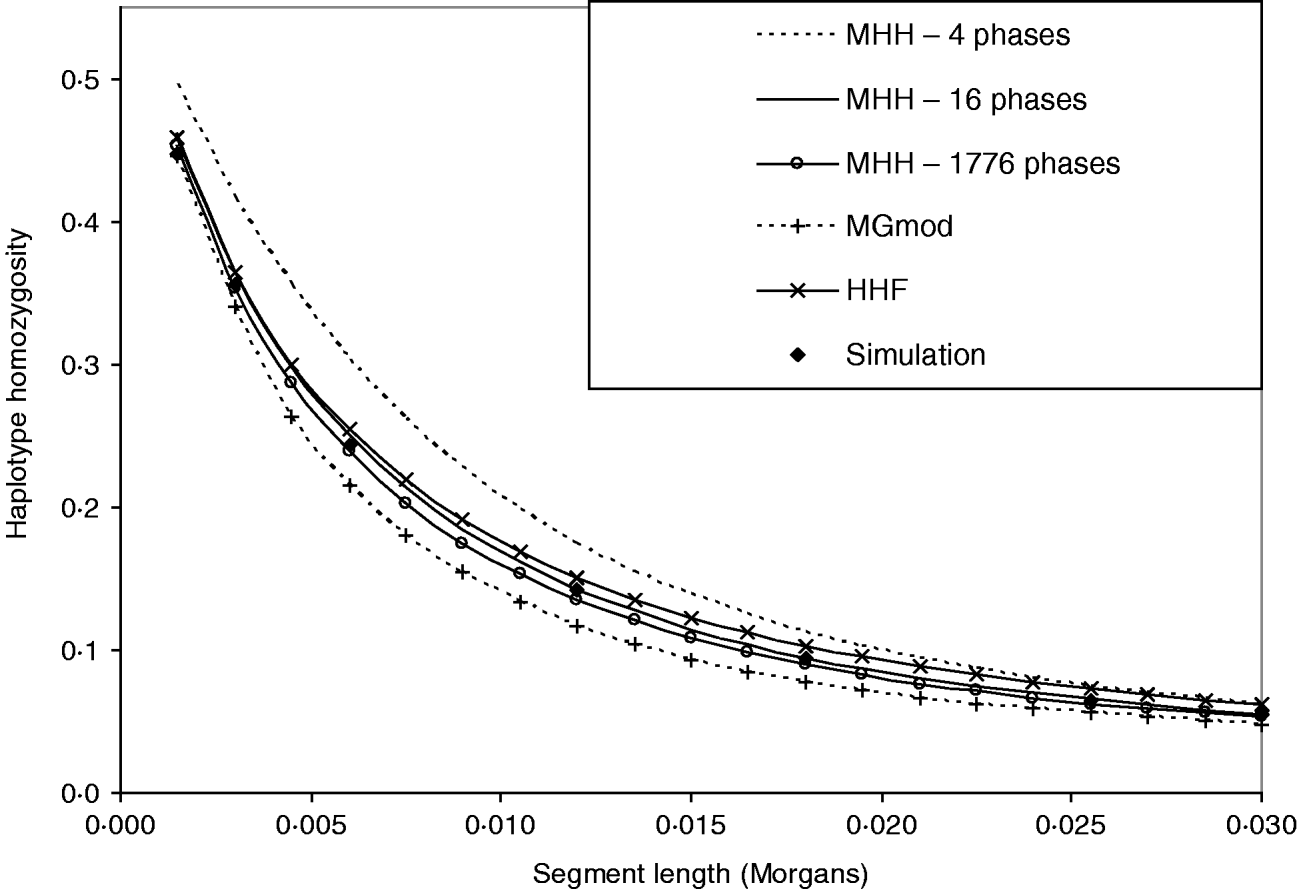
The ‘16 phase’ HHn is calculated by splitting Phase 2 into nine phases and Phase 3 into five. The ‘1776 phase’ is Phases 1–3 split into single generation phases to eliminate approximation error. Phase 4 is not split because it is in equilibrium. Splitting up of longer phases results in HHn prediction which is very close to that of the simulated data (Fig. 3). Comparisons with the above parameters show that when the ith phase is split into j shorter phases, once Tj=0·03Ni, there was very little change in HHn if phases were split further (Table 3). We therefore split long phases to Tj⩽0·03Ni for all further results with MHH.
Observed HHn (simulated population with 5000 replicates) compared with MHH predicted HHn, splitting each long phase of constant population size into an increasing number of shorter phases (population parameters as for Fig. 3)

(iii). Large population with bottleneck and expansion
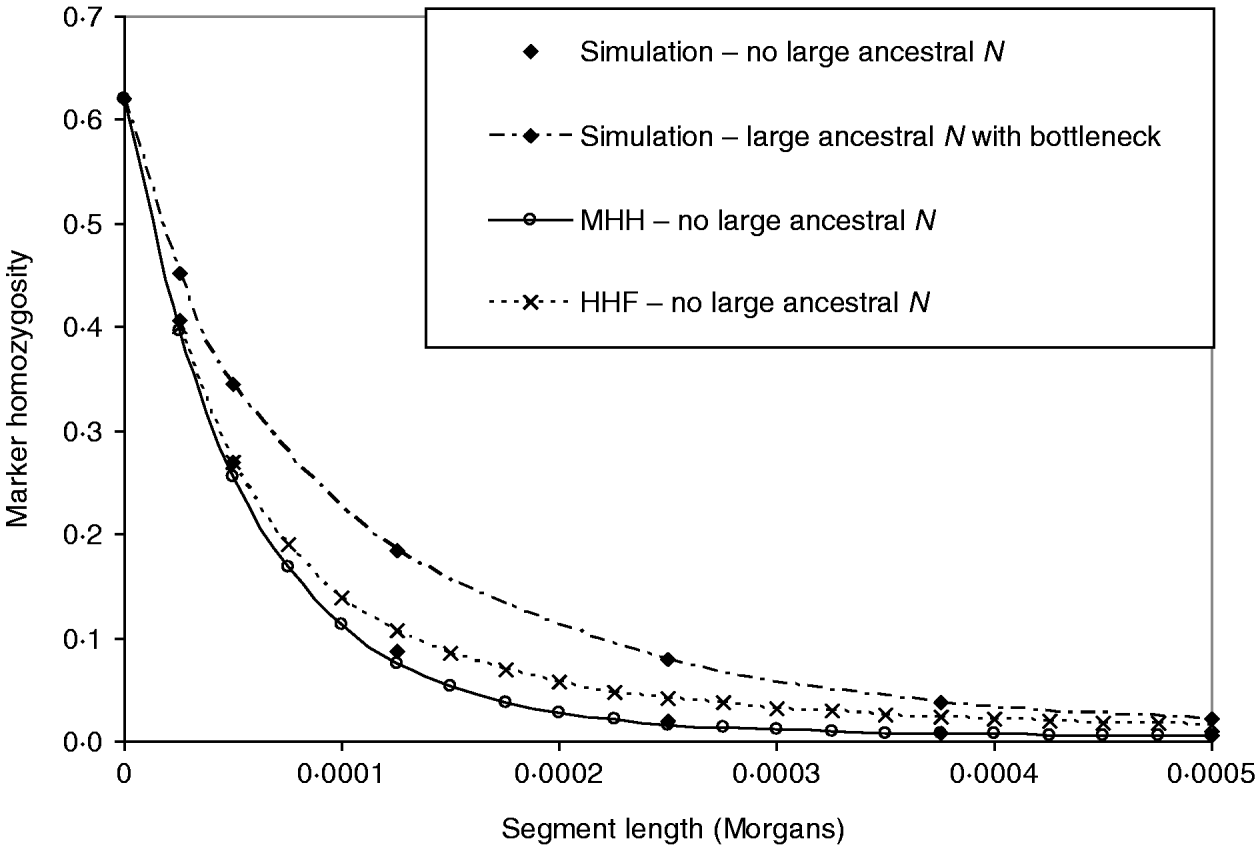
We test whether or not there is sufficient difference in the HHn pattern, to distinguish between populations that have undergone an ancestral bottleneck or no bottleneck, given they have the same single marker homozygosity. The population with no bottleneck is an equilibrium population; N=50 000 and T=507 000. The contrasting population undergoes a severe bottleneck, and then expands again to the original size:
Phase 3: N=50 000 for 500 000 generations (ancestral equilibrium population).
Phase 2: N=2500 for 2000 generations – bottleneck.
Phase 1: N=50 000 for 5000 generations (present day back in time).
To maintain single locus homozygosity of 0·62 in both populations, a mutation rate of 3×10⁻⁶ was used for the equilibrium population, and a slightly higher rate of 5·5×10−6 for the bottleneck population.
Figure 4 A contrasts observed and predicted HHn in the bottleneck and non-bottleneck populations, with marker spacing of 0·0005 M (equivalent to approx. 70 000 SNP evenly spread across the human genome). The same contrasts are made in Fig. 4 B except that r=2·5×10−5 M (approx. 1·4 million SNP evenly spread on the human genome). The analytical predictions and observed HHn in Fig. 4 A are indistinguishable for both bottleneck and non-bottleneck populations. Therefore, given this marker spacing and no prior knowledge of the population ancestral histories, it would not be possible to use the analytical methods to detect the bottleneck.
(A, B) Both graphs show predictions of HHn in two different populations, using two analytical methods compared to observed values in simulated populations (average of 1000 replicates). One population is in equilibrium with constant size (N=50 000) and a second is of the same ancestral and present size, but with a bottleneck (N=2500, T=2000), 5000 generations before present day. In (A), the marker intervals (r) are 0·0005 M, while in (B), r=2·5×10−5 M. The mutation rates in the two different populations have been adjusted to maintain the same single marker homozygosity.
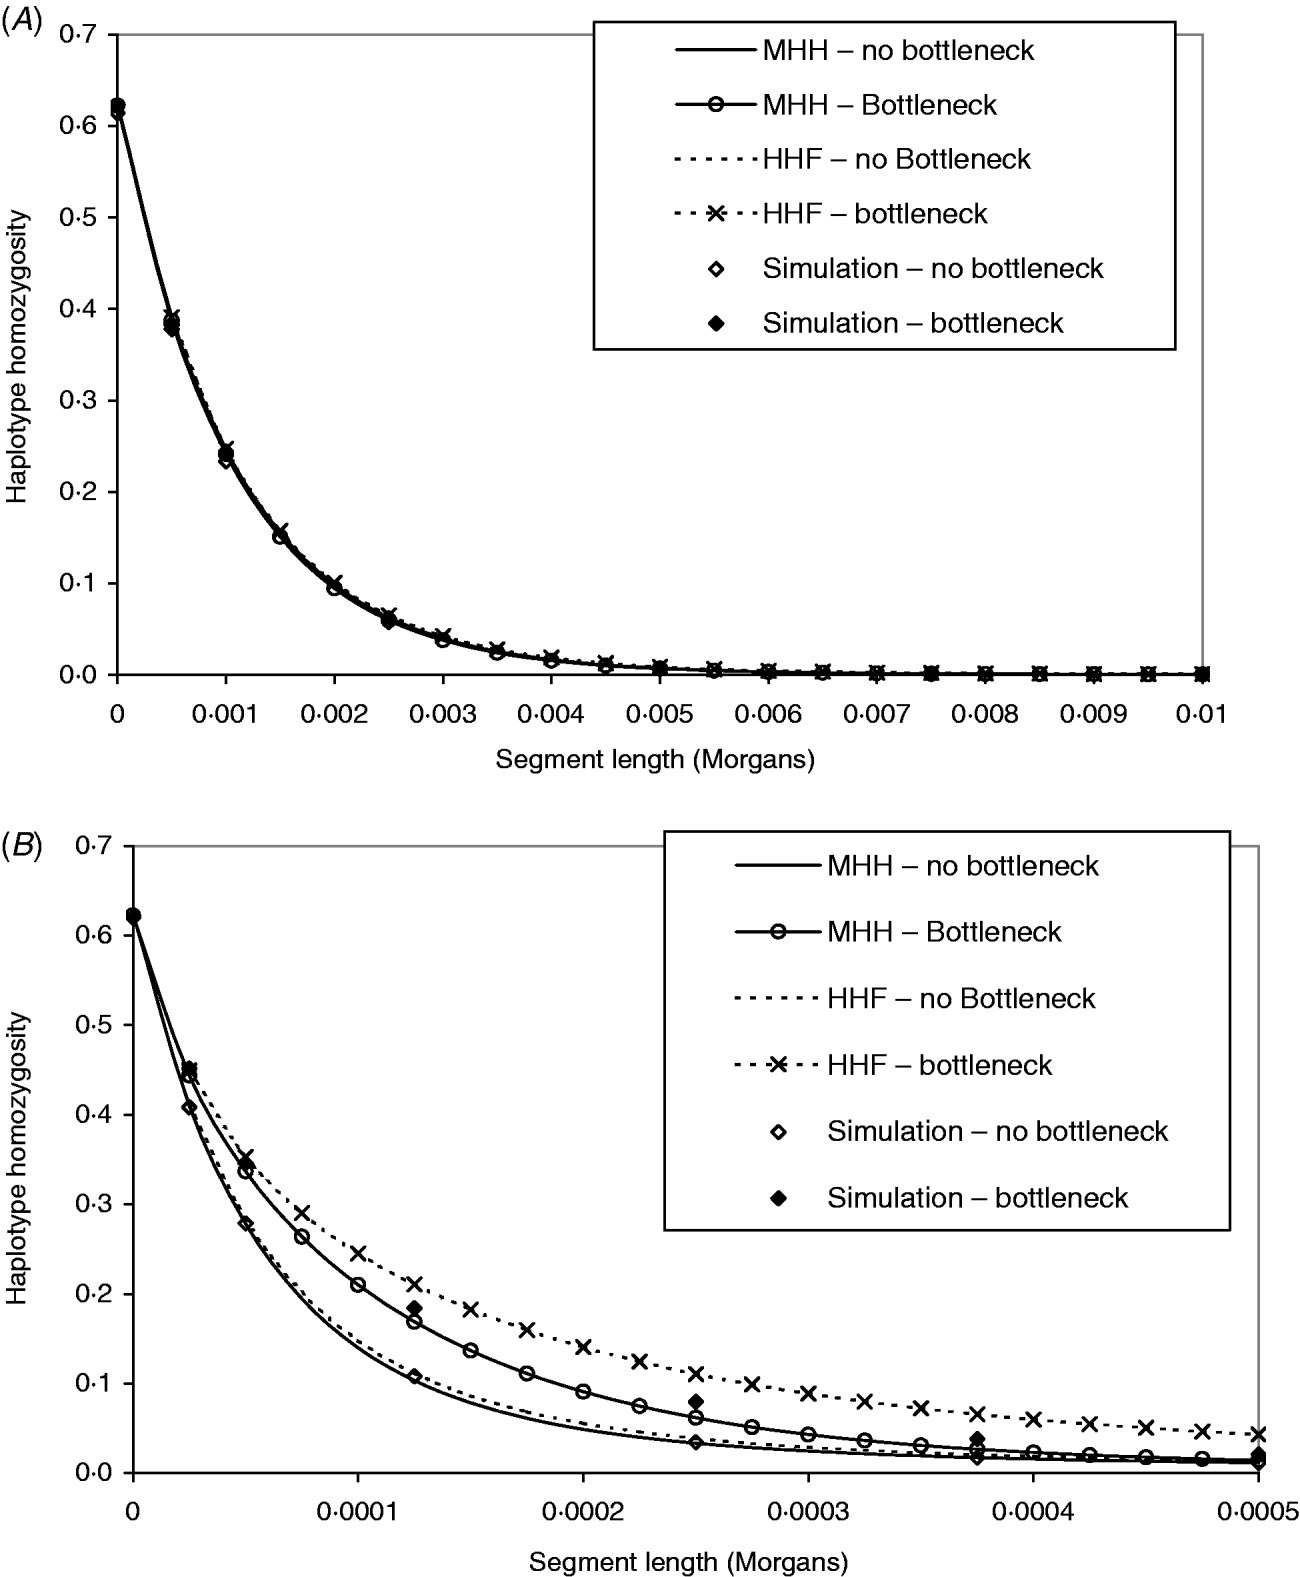
In Fig. 4 B, marker intervals are much smaller and the simulation HHn displays a different pattern in the bottleneck compared to non-bottleneck population. In both populations, MHH predicts similar HHn to simulated values. Although HHF is in good agreement for the non-bottleneck population, it is markedly less accurate in the bottleneck population where the value of μ is closer to r (Fig. 4 B).
In Fig. 5, the above bottleneck population is compared to one with no large ancestral population, to test whether or not the bottleneck masks the ancestrally larger population effect on the HHn pattern. This contrasting population had the following structure:
Phase 2: N=2500 for 52 000 generations – most ancestral phase – equilibrium.
Phase 1: N=50 000 for 5000 generations – most recent phase.
As before, single marker homozygosity was maintained at 0·62 with μ=2·64×10−5 for the population with no large ancestral N. In both populations r=2·5×10−5 M. The analytical methods predict different HHn patterns for the two populations, but again HHF overestimates HHn (μ≈r), while the MHH prediction is close to that observed in the simulated populations (Fig. 5).
HHn predictions using two analytical methods, for an expanding population as for Fig. 4 B (‘bottleneck’), but with no large ancestral size: ancestral N=2500 for T=52 000, followed by N=50 000 for T=5000 to present day. Predictions are compared with observed HHn in simulated populations (2000 replicates). Also plotted is the observed HHn from the bottleneck population in Fig. 4 B (i.e. with large ancestral size=50 000 and bottleneck N=2500 for T=2000), to demonstrate that the bottleneck does not mask the more ancestral population size effect on HHn.
(iv). Prediction of observed bovine HHn and estimation of population size
Figure 6 shows the HHn of observed dense SNP data from a population of dairy bulls genotyped for 38 259 SNPs, with a single marker homozygosity of 0·62. Marker spacing was relatively even, at an average of 0·066 Mb. We used MHH to predict the observed HHn pattern, given the marker spacing and assuming 100 Mb is equivalent to one Morgan recombinant distance. It was not possible to accurately predict the observed cattle HHn using one phase of constant population size, with single marker homozygosity of 0·62 (Fig. 6). With constant N, HHn could be modelled moderately closely for few markers, but as the haplotype length increased to more than 12 markers on the haplotype, HHn was considerably under predicted. To more closely model the observed HHn, we allowed the population size to vary over time (see Method section). We assumed a starting ancestral population of 50 000 in equilibrium, because previous studies suggest a very large ancestral bovine population size (Hayes et al., Reference Hayes, Visscher, McPartlan and Goddard2003; de Roos et al., Reference de Roos, Hayes, Spelman and Goddard2008).
Observed genome wide HHn in cattle, genotyped for 38 259 SNPs (38 K data), compared with MHH predicted HHn. Predictions are shown for constant population size (N=120), as well as sharply decreasing population size with three or six ancestral sizes (from N=50 000 to N<300).
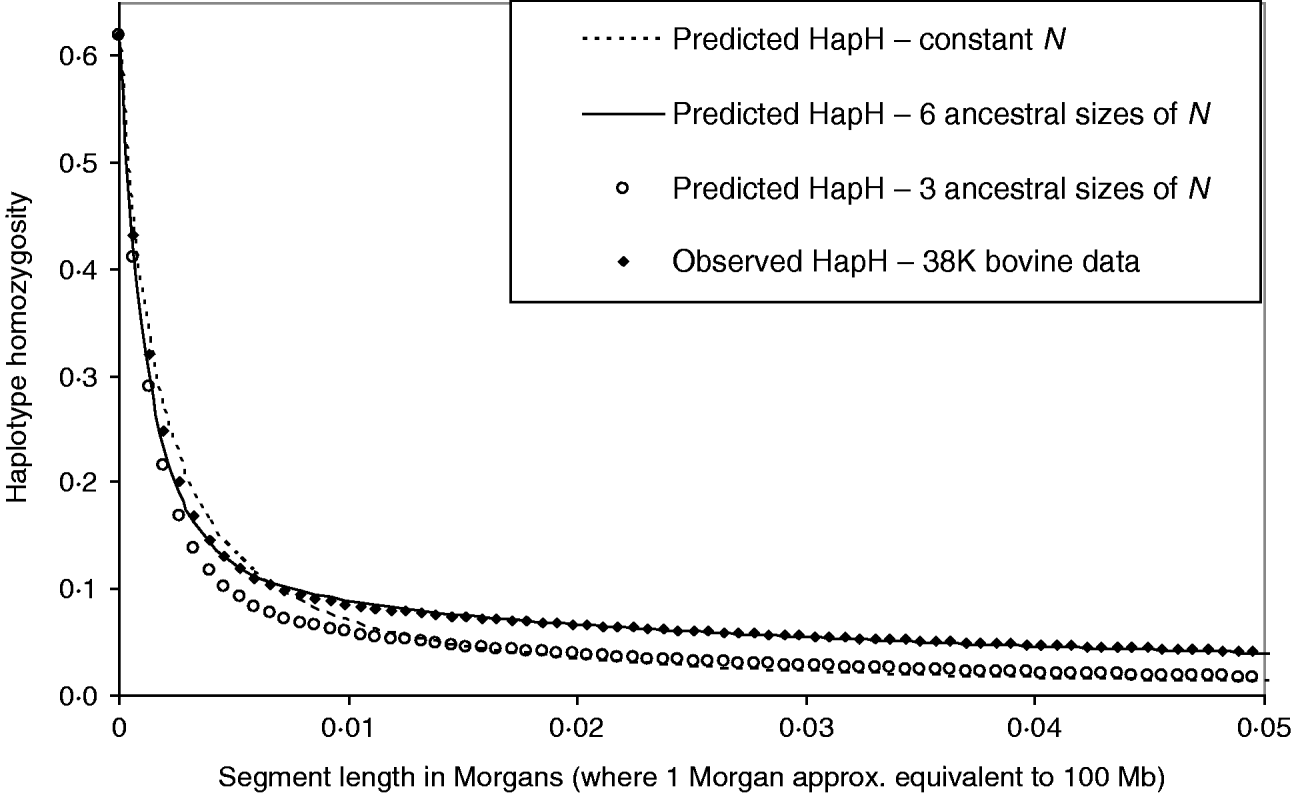
We found that a decreasing population size (to present day) gave a much closer prediction of the observed data than a constant size (Fig. 6). In particular, modelling of HHn was sensitive to changes in population size in most recent 760 generations (approximately 1/(2r)). Repeated estimation of parameters, which predict HHn with a good fit to the observed bovine HHn followed a similar pattern of decreasing population size. Estimated parameters which closely predict the observed HHn (Fig. 6) are:
Phase 6: N=50 000, T=100 000 (equilibrium) – most ancestral population.
Phase 5: N=2500, T=696 (split into 12 phases of 58 generations each).
Phase 4: N=1000, T=20.
Phase 3: N=500, T=18 (split into two phases of nine generations each).
Phase 2: N=200, T=18 (split into three phases of six generations each).
Phase 1: N=80, T=6 (split into three phases of two generations each).
The mutation rate used to match the single marker homozygosity (0·62) in the observed data was 4·7×10−6. The predicted HHn was not sensitive to the population size in the most ancestral phase; smaller or larger N in equilibrium (e.g. 10 000 or 100 000) with appropriately adjusted mutation rates gave very similar results. This is in keeping with the findings that chromosome segment homozygosity over short recombinant distances reflects effective population size more distant in the past than longer segments (Hayes et al., Reference Hayes, Visscher, McPartlan and Goddard2003). Simplifying the above six phases to three, by averaging the most recent 40 generations to N=285 and the next 718 ancestral generations to N=2460, and the most ancestral to N=50 000, gives a much poorer prediction of the observed HHn (Fig. 6).
4. Discussion
This study demonstrates that our new method (MHH) is consistently more accurate across a range of input parameters (N, T, r and μ), than the other methods tested, particularly when recombination and mutation rates were of similar value. We were also able to predict the observed pattern of HHn in a cattle population, given appropriate estimates of historical population sizes changing over time. When accommodating changes in population size, our method approximates the HHn of recombinant segments from the most recent generation of each phase, causing some overestimation of HHn. However, we demonstrate that this is overcome by splitting long non-equilibrium phases into a number of shorter phases. There are other ways to overcome this approximation, and all are likely to increase the computing time; ours resulted in a linear increase in user CPU time for every extra phase.
The theory for HHn developed here applies directly to the situation where sites in the genome are defined without knowledge of whether or not they are polymorphic. This would be the case if the data were genome sequence data where all sites are recorded. In this case, the mutation rate and recombination rate are both about 10−8 per base (Nachman & Crowell, Reference Nachman and Crowell2000; Kong et al., Reference Kong, Murphy, Raj, He, White and Matise2004; Arias et al., Reference Arias, Keehan, Fisher, Coppieters and Spelman2009). Under coalescence theory for the standard neutral model, it is the R and U parameters that are critical in determining the coalescence patterns (e.g. Przeworski et al., Reference Przeworski, Hudson and Di Rienzo2000). Therefore our results with the mutation rate and the recombination rate of 10−5 could apply to sequence data but with N increased by 1000-fold. However, our results would also apply approximately in the following situation. Consider a sequence of 1000 bases as a single ‘locus’ with a mutation rate 1000 times the per base mutation rate. Any mutation that occurs in any of these 1000 bases is recorded as a mutation in the locus. Now the mutation rate and the recombination rate will be approximately 10−5 per locus. In practice, the data often consist of genotypes at sites that are known to be polymorphic. This data will also approximate the data from the 1000 base locus described above because the ascertainment of polymorphisms could be described approximately as sequencing 1000 bases, for instance, and selecting one site that is polymorphic to be genotyped. In predicting HHn at such known polymorphic SNPs, we set the mutation rate so that the observed single SNP homozygosity matches that predicted. In this way, the match of the predicted to the observed data depends on the pattern of LD and is not influenced by the match at single SNPs. The bias that use of the analytical HHn method would introduce if the same higher mutation rates were assumed in order to predict homozygosity at a postulated QTL position given the SNP HHn, needs further investigation.
The original MG methodology was not developed for changing population size and has three main approximations, two of which have been corrected in this paper, that work in opposing directions and therefore sometimes cancel each other out. However, both the modified and original methods still apply a third approximation; the assumption that, conditional on a recombination occurring on the chromosome segment underlying the markers, marker coalescence on the segments separated by recombination are calculated independently. This assumption ignores the fact that they share a joint coalescence up to the time the recombination takes place. The result of this approximation is particularly evident where the population size is decreasing rapidly to the present day (Fig. 3). In smaller populations, the method under-predicts the HHn, because it does not account for the correlation in the time taken for the markers to coalesce given a recombination occurs. MHH models more accurately the multi-marker probability of coalescence before and after the segments recombine, which gives better performance under a range of parameters.
The main drawback of HHF is that marker HHn probabilities are increasingly over predicted as the mutation rate approaches the recombination rate between markers (e.g. Fig. 2 B). This is apparent also in Fig. 4 B (r=5 μ), with marker density close to that already feasible in the human genome, and expanding N similar to human populations which are estimated to be large and expanding (Zhao et al., Reference Zhao, Yu, Fu and Li2006; Tenesa et al., Reference Tenesa, Navarro, Hayes, Duffy, Clarke, Goddard and Visscher2007). Hill & Hernandez-Sanchez (Reference Hill and Hernandez-Sanchez2007) give a derivation explaining why their approximate method performs less well in the presence of mutation. However, they point out that for livestock populations their method should perform well, because the influence of mutation is relatively minor due to small present day population sizes in livestock.
The parameters for the bottleneck populations were chosen to verify that the multi-marker HHn patterns are strongly influenced by marker intervals only for a finite number of ancestral generations backwards in time from the present day. Chromosome segment homozygosity on a segment of ‘c’ Morgans is influenced by the population size at approximately 1/(2c) generations ago, assuming a linear change in population size (Hayes et al., Reference Hayes, Visscher, McPartlan and Goddard2003). Our results in Fig. 4 A clearly demonstrate that no distinction was possible between the populations with and without a bottleneck 5000 generations ago when marker intervals were 0·0005 M. In this case, we would expect a two marker haplotype to be influenced by population size only up to 1000 generations ago. We did detect different patterns of HHn in the bottleneck versus no bottleneck populations with much smaller marker intervals of 2·5×10−5 M (Fig. 4 B).
Our results indicate that we should be able to predict changes in historical population sizes with an efficient search strategy to optimize the parameters given in the data. Clearly, it is not possible to predict the observed HHn pattern in cattle when a constant population size is assumed (Fig. 6). The time period over which we can predict the changing population sizes will depend on the marker intervals. Our estimated cattle population parameters indicate a reduction in the population size from past to present (over approximately 760 generations), and follow a similar trend to estimates from studies which have used two marker LD to predict historic cattle population size (Gautier et al., Reference Gautier, Faraut, Moazami-Goudarzi, Navratil, Foglio, Grohs, Boland, Garnier, Boichard, Lathrop, Gut and Eggen2007; de Roos et al., Reference de Roos, Hayes, Spelman and Goddard2008). This is also in keeping with historical events which have resulted in decreasing effective population size in cattle: first due to domestication approximately 1500–2000 generations ago (assuming a generation interval of 5–7 years), then breed formation followed by breed society registration, and finally modern intense selection schemes with artificial breeding techniques (approximately 5–8 of most recent generations). There is also a possibility that recent intense selection of dairy cattle has resulted in an excess of intermediate length homozygous segments, which would result in a smaller estimate of present day N than the true N. However, the observed bovine SNP data used for this study covered the entire genome and is therefore less likely to be heavily biased by selection.
The consistently better performance of MHH compared to the others in this study for increasing population size and very dense markers, implies that it is a good method for use with human genotype data where effective population size has in more recent times been increasing rapidly (Zhao et al., Reference Zhao, Yu, Fu and Li2006; Tenesa et al., Reference Tenesa, Navarro, Hayes, Duffy, Clarke, Goddard and Visscher2007). With our new analytical method, it should be possible to develop formal search algorithms to predict changing population size given observed dense SNP data. We are also extending MHH to predict local recombination rates from dense SNP data, using a likelihood inference approach. A further application of our method is to predict relative probability of homozygosity at a putative QTL position, given the surrounding observed marker homozygosity (Meuwissen & Goddard, Reference Meuwissen and Goddard2007), or similarly to impute missing marker information.
Appendix A
MGmod – Modifications to MG
Our main modification to MG is to allow for implementation with changes in ancestral population sizes, in a similar way as described for our method in this paper (i.e. considering multiple ‘phases’ of constant population size). Our modification of MG follows the same framework and notation as the Meuwissen & Goddard (Reference Meuwissen and Goddard2007) published method, where the probability of homozygosity at the markers is calculated by considering the conditional marker homozygosity given the underlying segment IBD pattern, and the prior probability of the IBD pattern:

For P(π), we calculate the probability of segment coalescence in each ‘phase’ of a given population size and finite number of generations, and sum the probabilities across all phases for the full probability of coalescence. For the following segment pattern, we would first calculate each term on the right-hand side, across all three phases. P(π=[0 1 0])=P(π=[. 1 .])−P(π=[1 1 .])−P(π=[. 1 1])+P(π=[1 1 1]). Likewise, we also sum P(y=1|π), over each phase of changed population size, for each possible IBD pattern. These multi-phase conditional and prior probabilities are then substituted in the above equation (A1).
Our second modification to the Meuwissen and Goddard method (Meuwissen & Goddard, Reference Meuwissen and Goddard2007) is to replace the single conditional probability of a marker being homozygous (i.e. no mutation before coalescence) given it is located on an IBD segment, with three conditional probabilities: depending on whether or not the IBD segment is bounded by recombination on 0, 1 or 2 sides. If an IBD segment is known to be bounded by recombination, the probability of mutation on this segment is higher than if unbounded because shorter IBD segments indicate longer coalescence times and more time for mutation to occur.
The derivations are therefore written in full for the modifications and the three conditional marker probabilities are:
(a) Within or at the end of an IBD segment, which is unbounded by any known recombination; P(y=1|π=[1n])=P(y=1 & π=[1n])/P(π=[1n]), where π=[1n] in n IBD adjacent intervals.
(b) Within or at the end of an IBD segment, which is bounded on one side by recombination; P(y=1|π=[0 1])=P(y=1 & π=[0 1])/P(π=[0 1]), where P(y=1 & π=[0 1])=P(y=1 & π=[. 1])−P(y=1 & π=[1 1]) and P(π=[0 1])=P(π=[. 1])−P(π=[1 1]).
(c) Within or at the end of an IBD segment, which is bounded on both sides by recombination; P(y=1|π=[0 1 0])=P(y=1 & π=[0 1 0])/P(π=[0 1 0]), where P(π=[ …0 …]) is calculated in terms of IBD segments, thus: P(π=[0 1 0])=P(π=[. 1 .])−P(π=[1 1 .])−P(π=[. 1 1])+P(π=[1 1 1]) and likewise, P(y=1 & π=[0 1 0])=P(y=1 & π=[. 1 .])−P(y=1 & π=[1 1 .])−P(y=1 & π=[. 1 1])+P(y=1 & π=[1 1 1]).
Our third modification is to calculate the joint probability of no mutation for all markers on one IBD segment. In the original method, the probability of mutation when more than one marker is found on an IBD segment is considered independent for each marker. However, this probability is correlated because the markers occur on the same IBD segment. We have altered the method to calculate the joint probability of no mutation for all markers occurring on the same IBD segment:
![\eqalign{\tab P\lpar y \equals \lpar 1\rpar ^{n} \left\vert {\pi \equals \lpar } \right.1\rpar ^{n \minus \setnum{1}} \rpar\cr \tab \equals {1 \over {2N}}\lpar 1 \minus c\rpar ^{\setnum{2}} \ast \mathop\sum\limits_{t \equals \setnum{0}}^{T \minus \setnum{1}} {\left[ {\left( {1 \minus {1 \over {2N}}} \right) \lpar 1 \minus c\rpar ^{\setnum{2}} \lpar 1 \minus \mu \rpar ^{\setnum{2}n} } \right]} ^{t} \comma \cr}](https://static.cambridge.org/binary/version/id/urn:cambridge.org:id:binary:20160920235758976-0995:S0016672309990358:S0016672309990358_eqnU4.gif?pub-status=live)
where n is the number of markers on the IBD segment, t is any given generation, T is the total number of generations and c is the total recombinant distance of the IBD segment (Morgans).
I. M. gratefully acknowledges scholarship support from Melbourne University, Meat and Livestock Australia and Department of Primary Industries Nancy Millis award. M. G. acknowledges support from Australian Research Council project DP0770096. The authors are grateful to C. P. Van Tassell and T. S. Sonstegard for provision of the bovine SNP data through a collaborative agreement with the Bovine Functional Genomics Laboratory, USDA-ARS.



