





Introduction
Reward processing refers to the psychological, behavioral, and neural mechanisms by which individuals detect, evaluate, anticipate, and respond to experiences of reward and pleasure. To improve characterization of this multidimensional construct, the Research Domain Criteria framework was developed (NIMH, 2008). This includes the ‘Positive Valence Systems (PVS)’ domain, which is divided into the constructs of reward responsiveness, reward learning and reward valuation (NIMH, 2023). Reward responsiveness refers to the capacity to respond to, enjoy, and seek out rewarding stimuli, encompassing both initial reactions and sustained engagement with positive experiences. Reward learning relates to the ability to modify behavior based on experience with rewards, involving learning associations between stimuli, actions, and outcomes. Finally, reward valuation refers to processes by which an individual assesses the value of a potential reward based on its probability, cost/effort, and context (NIMH, 2023). Reward processing plays an important role in shaping behavior and motivation, and impairments could be expressed behaviorally as anhedonia, reduced motivation for social events, or impaired self-care (Alloy & Nusslock, Reference Alloy and Nusslock2019).
Such behaviors are often reported across disorders in the mood-psychosis spectrum (Der-Avakian & Markou, Reference Der-Avakian and Markou2012; Strauss & Gold, Reference Strauss and Gold2012), such as schizophrenia and bipolar disorder (BD). These disorders demonstrate considerable overlap in both genetic predisposition and phenotypic expression (Förstner et al., Reference Förstner, Böttger, Moldavski, Bajbouj, Pfennig, Manook, Ising, Pittig, Heinig, Heinz, Mathiak, Schulze, Schneider, Kamp-Becker, Meyer-Lindenberg, Padberg, Banaschewski, Bauer, Rupprecht and Tschorn2023).
Several studies report different degrees of functioning across the PVS construct of reward responsiveness in individuals with psychotic disorders, BD, and major depressive disorder (MDD). That is, the immediate response to reward in an experimental setting appears to be intact in individuals with psychotic disorders (e.g. schizophrenia and schizoaffective disorder) or BDs (Johnson et al., Reference Johnson, Mehta, Ketter, Gotlib and Knutson2019; Strauss, Visser, Lee, & Gold, Reference Strauss, Visser, Lee and Gold2017; Yan et al., Reference Yan, Cao, Zhang, Song, Cheung and Chan2012). Self-reported anticipatory pleasure was found to be intact in BDs (Tso, Grove, & Taylor, Reference Tso, Grove and Taylor2014); however, impaired in individuals with a psychotic disorder or MDD (Frost Visser et al., Reference Visser, Chapman, Ruiz, Raugh and Strauss2020; Hallford et al., 2019). The same is true for neural responses in the striatum during reward anticipation (Long et al., Reference Long, Wang, Tian, Cao, Xie and Jia2022; Yang et al., Reference Yang, Su, Yang, Song, Yan, Luo and Zeng2022; Zeng et al., Reference Zeng, Yan, Cao, Su, Song, Luo and Yang2022).
Impairments in reward learning, specifically in identifying the most rewarding option, have been documented in individuals with schizophrenia (Koch et al., Reference Koch, Schachtzabel, Wagner, Schikora, Schultz, Reichenbach, Sauer and Schlösser2010; Waltz, Frank, Robinson, & Gold, Reference Waltz, Frank, Robinson and Gold2007; Waltz, Frank, Wiecki, & Gold, Reference Waltz, Frank, Wiecki and Gold2011; Yılmaz, Simsek, & Gonul, Reference Yılmaz, Simsek and Gonul2012), BD (Brambilla et al., Reference Brambilla, Perlini, Bellani, Tomelleri, Ferro, Cerruti, Marinelli, Rambaldelli, Christinodoulou, Joga, Dima, Tansella, Balestrieri and Frangou2013), and MDD (Adida et al., Reference Adida, Jollant, Clark, Besnier, Guillaume, Kaladjian, Mazzola-Pomietto, Jeanningros, Goodwin, Azorin and Courtet2011; Dezfouli et al., Reference Dezfouli, Griffiths, Ramos, Dayan and Balleine2019; Halahakoon et al., Reference Halahakoon, Kieslich, O’Driscoll, Nair, Lewis and Roiser2020). However, these impairments do not appear to extend to punishment learning (Adida et al., Reference Adida, Jollant, Clark, Besnier, Guillaume, Kaladjian, Mazzola-Pomietto, Jeanningros, Goodwin, Azorin and Courtet2011; Strauss et al., Reference Strauss, Frank, Waltz, Kasanova, Herbener and Gold2011; Waltz et al., Reference Waltz, Frank, Robinson and Gold2007). Optimal reward learning requires the ability to discern the overall reward patterns associated with each option without an overreliance on recent successes or failures. In BD, difficulties might be driven by high sensitivity to (recent) wins (Brambilla et al., Reference Brambilla, Perlini, Bellani, Tomelleri, Ferro, Cerruti, Marinelli, Rambaldelli, Christinodoulou, Joga, Dima, Tansella, Balestrieri and Frangou2013). In schizophrenia, reward learning performance has been inversely associated with negative but not with psychotic symptoms (Strauss et al., Reference Strauss, Frank, Waltz, Kasanova, Herbener and Gold2011; Waltz et al., Reference Waltz, Frank, Robinson and Gold2007; Waltz et al., Reference Waltz, Frank, Wiecki and Gold2011; Yılmaz et al., Reference Yılmaz, Simsek and Gonul2012). Depressive symptoms in BD have been linked to poorer reward learning, whereas mania symptoms have not (Adida et al., Reference Adida, Jollant, Clark, Besnier, Guillaume, Kaladjian, Mazzola-Pomietto, Jeanningros, Goodwin, Azorin and Courtet2011; Pouchon et al., Reference Pouchon, Vinckier, Dondé, Gueguen, Polosan and Bastin2023). Despite these findings, there remains limited research exploring the associations of psychotic and manic symptoms with reward learning, particularly from a transdiagnostic perspective.
Reward valuation includes weighing, for example, effort and probability in decisions to pursue a reward, and therefore it is less obvious what constitutes an impairment. Generally, people with psychotic disorders take less effort for reward in the most rewarding conditions (Barch, Treadway, & Schoen, Reference Barch, Treadway and Schoen2014; Gold et al., Reference Gold, Strauss, Waltz, Robinson, Brown and Frank2013; Yang et al., Reference Yang, Huang, Harrision, Roser, Tian, Wang and Liu2021; Zou et al., Reference Zou, Ni, Wang, Yu, Lui, Zhou, Yang, Cohen, Strauss, Cheung and Chan2020). This is stronger for those with many negative symptoms (Yang et al., Reference Yang, Huang, Harrision, Roser, Tian, Wang and Liu2021; Zou et al., Reference Zou, Ni, Wang, Yu, Lui, Zhou, Yang, Cohen, Strauss, Cheung and Chan2020), and similar findings have been reported in people with depression and those who score high on depressive symptoms (Halahakoon et al., Reference Halahakoon, Kieslich, O’Driscoll, Nair, Lewis and Roiser2020). For BD, findings on reward valuation have been mixed (Hayden et al., Reference Hayden, Bodkins, Brenner, Shekhar, Nurnberger, O’Donnell and Hetrick2008; Hershenberg et al., Reference Hershenberg, Satterthwaite, Daldal, Katchmar, Moore, Kable and Wolf2016; Yang et al., Reference Yang, Huang, Harrision, Roser, Tian, Wang and Liu2021; Isıklı et al., Reference Isıklı, Bektaş, Tamer, Atabay, Arkalı, Bağcı, Bayrakci and Zorlu2024; Moran, Prevost, Culbreth & Barch, 2024).
Taken together, impairments seem to exist in all three domains of the PVS in people with psychotic disorders, and, though sometimes less consistently, BD. The strongest impairments might exist in those with more severe negative or depressive symptoms. In line with this, a trans-diagnostic study employing a sample of individuals along a severe mental illness-spectrum reported that global reward processing deficits (i.e. across the three PVS domains) are associated with negative symptoms, while a selective weakened reward response is not (Luther, Jarvis, Spilka, & Strauss, Reference Luther, Jarvis, Spilka and Strauss2024).
Though domains of reward processing have been suggested as potential endophenotypes of BD or SCZ, the findings in first-degree relatives (FDRs) of individuals with mood-psychosis spectrum disorders have been mixed (Bora et al., Reference Bora, Cesim, Eyuboglu, Demir, Yalincetin, Ermis and Akdede2024; Hanssen, Krabbendam, Robberegt, & Fett, Reference Hanssen, Krabbendam, Robberegt and Fett2020; Linke et al., Reference Linke, Koppe, Scholz, Kanske, Durstewitz and Wessa2020). Several studies found no behavioral differences between people with psychosis, their FDRs, and healthy individuals during reward anticipation (Mucci et al., Reference Mucci, Dima, Soricelli, Volpe, Bucci, Frangou, Prinster, Salvatore, Galderisi and Maj2015; Millman et al., Reference Millman, Gallagher, Demro, Schiffman, Reeves, Gold, Rouhakhtar, Fitzgerald, Andorko, Redman, Buchanan, Rowland and Waltz2020). A study found equal reward learning rates in BD relatives and controls (Linke et al., Reference Linke, Koppe, Scholz, Kanske, Durstewitz and Wessa2020), while relatives of people with schizophrenia were found to have difficulty with reward learning (Hanssen et al., Reference Hanssen, Krabbendam, Robberegt and Fett2020). Young adults with clinical high risk for psychosis or BD showed lower effort for reward in highly rewarding conditions (Bora et al., Reference Bora, Cesim, Eyuboglu, Demir, Yalincetin, Ermis and Akdede2024), but as far as we know, this has not been investigated in familial high-risk groups. Compared to healthy individuals, first-degree relatives of people with BD showed decreased prediction error signals during a reward task (Macoveanu et al., Reference Macoveanu, Kjærstad, Chase, Frangou, Knudsen, Vinberg and Miskowiak2020). It is important to note that the extent of literature on relatives is much more limited than that on patients, and most studies had small samples, so additional studies with larger sample sizes are needed to establish whether functioning on any of the three PVS domains constitutes an endophenotype. The identification of such endophenotypes could aid in bridging the gap between genetic risk and clinical manifestation, and offer potential targets for early intervention (Gottesman & Gould, Reference Gottesman and Gould2005).
The majority of research studied each of the PVS components in relative isolation, and limited data are available on how these three components covary on a behavioral level. However, studies have assessed the relationship between two reward concepts. For instance, Nguyen et al. (Reference Nguyen, Hess, Van Orman, Forken, Blatt, Fremont, Faraone and Glatt2022) and Duffy et al. (Reference Duffy, Sturm, Sares, Sarabia, Delao, Becker, Colmenares, Manavi, Rojas, Tregellas, Young and Thomas2024) found no correlation between effort expenditure and reward learning in a healthy population. Another study reported no significant association between reward learning and self-reported reward responsiveness (Sailer, Wurm, & Pfabigan, Reference Sailer, Wurm and Pfabigan2024). Geaney et al. (2015) revealed a significant but weak positive correlation between reward anticipation and effort expenditure at low probabilities. These weak associations between the reward constructs are surprising, as research has demonstrated that the components involve overlapping neural and genetic pathways (Hess et al., Reference Hess, Kawaguchi, Wagner, Faraone and Glatt2016). An important point for future research is to determine whether these results hold true in patient populations.
Although recent findings on reward-processing components have advanced our understanding of shared and distinct features of disorders across the mood-psychosis spectrum, research to date has primarily focused on individual reward-processing components in isolation. Consequently, little is known about how these components covary at a behavioral level and whether such covariation is different in those with a mood-psychosis spectrum disorder compared to the general population. Understanding the interplay between PVS components is important to better understand the origins of deficits, if deficits in multiple domains exist. In addition, examining PVS performance in FDRs of people with mood-psychosis spectrum disorder aids in bridging the gap between genetic risk and clinical manifestation. Reward-processing deficits in relatives would indicate familial liability as an underlying mechanism, whereas the absence of those deficits but associations with current symptoms would suggest that deficits are state-dependent. Therefore, the current preregistered (https://doi.org/10.17605/OSF.IO/WQBNE) study addressed the following aims.
First, we aimed to determine how PVS components covary on a behavioral level in the overall cohort of individuals with a mood-psychosis spectrum disorder, their FDRs, and controls (RQ1). Based on the above outlined study results demonstrating no or weak correlations between two PVS components, we hypothesized that we would similarly find weak or no covariation between the three PVS components.
Second, we examined to which extent this covariation differs between individuals with a mood-psychosis spectrum disorder, FDRs, and controls (RQ2). Based on these findings, we expect to find considerable variability in reward processing in patients. Therefore, we hypothesized that the covariation between PVS components would be less pronounced in patient groups as compared to the relatives and the control group.
Third, we examined to which extent individuals with a mood-psychosis spectrum disorder, their FDRs, and controls differ in performance on the PVS components (RQ3). We expected that individuals with psychotic or BDs would show worse performance on tasks measuring reward anticipation, reward learning, and willingness to expend effort for reward compared to controls. FDRs are furthermore expected to exhibit intermediate profiles, reflecting their familial liability and subclinical phenotypic traits.
Fourth, we analyzed how current depression, mania, and psychosis symptoms are related to performance on the PVS components (RQ4). We hypothesize that deficits in performance on the PVS components are related to negative and depressive symptoms, but not mania or psychosis symptoms.
Materials and methods
Study design and procedure
Data from the current investigation stem from two substudies, which both aimed to investigate the PVS in people with BD or a psychotic disorder, their FDRs, and controls. First, we set up a cross-sectional family design neuroimaging study (from hereon in-lab study). at the Erasmus Medical Center (Erasmus MC) in Rotterdam, The Netherlands. Participation in this study entailed one visit with a duration of ~5.5 h, including diagnostic interviewing, a magnetic resonance imaging (MRI) scan, three computer tasks, the collection of blood samples, and assessments of blood pressure, height, and weight. Finally, participants completed self-report questionnaires on-site or at home. Second, an observational family design online study was conducted (from hereon online-study; Broer et al., Reference Broer, Barendse, van den Brink-Steinmann, Snijders, van der Weijden-Germann, Bilder and van Haren2025, preprint). Eligible participants received a link to the information letter and informed consent form. They completed questionnaires and the three tasks that were also used in the in-lab study, on a computer at home, at any time convenient to them.
Both studies were approved by the local medical ethical committee of the Erasmus MC, and all procedures were conducted in accordance with the Declaration of Helsinki (64th WMA General Assembly; October 2013). Written informed consent was obtained from all participants before participation. Data were collected between January 2021 and August 2024. The hypotheses and methods were preregistered at: https://doi.org/10.17605/OSF.IO/WQBNE.
Participants and recruitment
For both studies, recruitment of participants was accomplished by directly contacting participants from the Dutch Bipolar Cohort (Snijders et al., Reference Snijders, de Witte, van Den Berk, van Der Laan, Regeer, Begemann, Berdenis van Berlekom, Litjens, Boks, Ophoff and Hillegers2020; Vreeker et al., Reference Vreeker, Boks, Abramovic, Verkooijen, van Bergen, Hillegers, Spijker, Hoencamp, Regeer, Riemersma-van der Lek, Stevens, Schulte, Vonk, Hoekstra, Van Beveren, Kupka, Brouwer, Bearden and MacCabe2016) and Genetic Risk and Outcome of Psychosis study (Korver et al., Reference Korver, Quee, Boos, Simons, de Haan and Investigators2012). For the in-lab study, additional recruitment took place via patient organizations and psychiatric clinics in or near Rotterdam, The Netherlands. Participants who declined participation in the in-lab study or did not meet its inclusion criteria were also invited to take part in the online-study. The existing cohorts included participants aged ≥18 years. For the in-lab study, 278 participants signed informed consent; for the online-study, 332 participants signed informed consent.
For both studies, participants needed to demonstrate understanding of the purpose, procedures, risks, and benefits, and payment procedures of the present investigation. For the in-lab study, individuals were not eligible for participation if they presented MRI-related contraindications (i.e. claustrophobia, non-removable ferromagnetic objects, pacemaker, or other stimulatory devices), if they had a history of closed head injury, neurological illness, and endocrine dysfunction, or if they demonstrated neurological abnormalities and/or structural brain abnormalities that interfere with present assessments, based on neurodiagnostic evaluation. For the online-study, individuals had to provide informed consent through an online portal and be able to complete the assessments on a computer (not tablet or mobile device).
Participants were included in the patient group if they had BD type 1, type 2, or not otherwise specified (NOS), schizophrenia, schizoaffective disorder, schizophreniform disorder, delusional disorder, brief psychotic disorder, or psychotic disorder NOS. Relatives were required to have a first-degree family member with one of these diagnoses, but did not have these diagnoses themselves. Individuals from the healthy control group were eligible if they themselves and their first-degree family members were free of the diagnoses mentioned for the patient group. Relatives and controls were still eligible for participation in the presence of other psychopathologies. For the online-study, diagnostic status was based on information from the prior cohorts or from the clinic. For the in-lab study, diagnoses were confirmed with diagnostic interviews conducted by trained researchers (using the Comprehensive Assessment of Symptoms and History (Andreasen, Flaum, & Arndt, Reference Andreasen, Flaum and Arndt1992) for participants with a bipolar or psychotic disorder based on information from the prior cohorts or the clinic, using the Mini-International Neuropsychiatric Interview for other participants (Sheehan et al., Reference Sheehan, Lecrubier, Sheehan, Amorim, Janavs, Weiller, Hergueta, Baker and Dunbar1998). The Diagnostic and Statistical Manual of Mental Disorders, Fifth Edition criteria were followed, and decisions were made based on consensus between two trained researchers. For the FDR group, the family member with mental illness could participate themselves as well, but if not, their diagnostic status was confirmed as part of the prior cohorts we recruited from.
Tasks
The order of the computer tasks was counterbalanced. Each task was preceded by instructions on screen. The participants were told that their performance on the computer tasks influenced the amount of reward received, but in reality, they received a fixed amount at the end of all assessments. This was explained to them during a debriefing (in-person for in-lab study, as written text for online-study). Detailed descriptions of each task can be found in the Supplementary Materials. The code and stimuli of the tasks are freely available at DOI: 10.17605/OSF.IO/2WY7U.
The monetary incentive delay (MID) task was intended to measure anticipation of reward. Outcome parameters extracted from this task entail the difference in average accuracy and reaction time between reward (combining small and large rewards) and neutral trials.
The Effort Expenditure for Reward Task (EEfRT) (Treadway et al., Reference Treadway, Buckholtz, Schwartzman, Lambert and Zald2009) evaluates how participants assess effort versus reward. Outcome parameters retrieved from this task entail the overall percentage of hard-task choices, the linear slope in hard-task choices as a factor of hard-task reward magnitude (separately at both reward probabilities), and the difference in percentages of hard-task choices between the two probabilities. In calculating an individual’s slope in hard-task choices, we covary with trial number to remove any effects of fatigue.
Participants played two versions of the three-armed Bandit task: (1) the coin Bandit task, and (2) the social Bandit task, measuring financial and social reward learning, respectively. Outcome measures were calculated separately for each version and consisted of the total score, the win-stay rate, the lose-shift rate, and the learning rate. The win-stay rate is defined as the percentage of times a participant chooses the same arm after being rewarded by that arm in the previous trial, averaged across all rounds. The lose-shift rate is defined as the percentage of times a participant chooses a different arm after not being rewarded by an arm in the previous trial, averaged across all rounds. The learning rate is the linear slope of the likelihood of choosing the best arm as a factor of the trial number. This is calculated for the first half of all rounds, as most learning takes place then, and the slope is likely to get nonlinear in the second half of the runs. The best arm is the one that has the highest reward rate in that round.
Symptom measures
For the in-lab study, we used the total score of the Altman Self-Rating Mania (ASRM) scale (Altman, Hedeker, Peterson, & Davis, Reference Altman, Hedeker, Peterson and Davis1997) as a measure of mania symptoms, the total score of the Inventory of Depressive Symptomatology (IDS) self-report (Rush et al., Reference Rush, Gullion, Basco, Jarrett and Trivedi1996 28) for depressive symptoms. The ASRM and IDS were self-report questionnaires. The positive and negative symptom scores were assessed using the Positive and Negative Syndrome Scale (PANSS) interview (Kay, Fiszbein, & Opler, Reference Kay, Fiszbein and Opler1987). Relatives and controls completed only the IDS, as the ASRM and PANSS are developed for and validated in people with a bipolar or psychotic disorder specifically.
For the online-study, symptom assessments were self-reported. We used the total score of the ASRM for mania symptoms, the total score on the 8-item Patient Reported Outcomes Measurement Information System (PROMIS, Pilkonis et al., Reference Pilkonis, Choi, Reise, Stover, Riley and Cella2011) depression scale (Cella, Gershon, Bass, & Rothrock, Reference Cella, Gershon, Bass and Rothrock2015) for depressive symptoms, and the total score of the psychosis subscale of the BASIS-24 (Cameron et al., Reference Cameron, Cunningham, Crawford, Eagles, Eisen, Lawton, Naji and Hamilton2007) for psychotic symptoms. There was no index of negative symptoms in the online-study.
Analysis plan
The steps to answer all research questions are outlined in detail in the Supplementary Materials and summarized below; we executed these steps separately in the in-lab study and online-study. We used R’s lavaan package. First, we performed assumption checks for normality, outliers, multicollinearity, and homoscedasticity, and conducted corrections if necessary. Second, we used linear mixed-effect modeling to test group differences in all observed task outcome variables (as defined in Section ‘Tasks’ and listed on the left in Supplementary Figure S1), corrected for age, sex, and years of education, and with a random intercept by family ID (first part of RQ3). The multiple comparisons corrected threshold was ɑ = .005. Third, to examine the covariation among the PVS components, multilevel confirmatory factor analysis (CFA) was used (RQ1). The model from Supplementary Figure S1 with the three covariates (but without the ‘symptoms’ variable) was used as the basis and modified, for example, by correlating errors, to improve fit. Fourth, we used multigroup CFA on the model from the previous step to compare the factor covariances between groups (RQ2). We extracted factor scores from the three factors using lavPredict and applied analysis of covariance (ANCOVA) to compare these scores between groups (second part of answer to RQ3). The corrected threshold was α = .018. Finally, we added the symptoms’ observed variables in the final model from step 3 to relate the factors with the current symptom levels (RQ4). For the in-lab study, the CFA did not reach a good fit, so subsequent steps were only applied to the online-study, see Supplementary Materials for details.
Results
Descriptive information
Descriptives of both samples can be found in Table 1. In the in-lab study, 103 patients had bipolar I disorder with or without psychotic features, 5 bipolar II disorder, 11 schizoaffective disorder, 16 schizophrenia, and 6 another non-affective psychotic disorder. Among relatives and controls, the most common psychopathology was (past) MDD (n = 14 and n = 15, respectively), but the majority had no history of psychopathology (n = 30 and n = 48, respectively). In the online-study, participants were not interviewed; based on information from the cohorts we recruited from, 181 patients had BD, and 3 had a psychotic disorder. Two patients from the in-lab study were inpatients, the remainder was outpatient; for the online-study, none of the participants were inpatients. Current depressive symptoms were higher in patients than relatives and controls for both studies (in-lab study: IDS Mpatient = 14.0, Mrelative = 7.5, Mcontrol = 5.9, F(2,249) = 25.8, p < .001; online-study: PROMIS Mpatient = 17.8, Mrelative = 12.8, Mcontrol = 13.9, F(2,306) = 20.0, p < .001).
Descriptive information about the samples

Note: Bandit:
a Learning rate: the linear slope of the likelihood of choosing the best arm as a factor of the trial number. This is calculated for the first half of all rounds as most learning takes place then and the slope is likely to get nonlinear in the second half of the runs. The best arm is the one that has the highest reward rate in that round.
b Win-stay rate: the percentage of times a participant chooses the same arm after being rewarded by that arm in the previous trial, averaged across all rounds.
c Lose-shift rate: the percentage of times a participant chooses a different arm after not being rewarded by an arm in the previous trial, averaged across all rounds.
Covariance between positive valence constructs (RQ1)
The final model for the online-study contained no covariates and several correlated errors between the observed variables in the reward learning factor (see Figure 1). This model showed adequate fit (root mean square error of approximation [RMSEA] = 0.02, standardized root mean square residual [SRMR] = 0.06, Comparative Fit Index [CFI] = 0.98, Tucker–Lewis Index [TLI] = 0.98). Paths from observed task variables to their factor were kept identical to the original plan. The multilevel structure with correction for family relations was maintained, although the fit was similar without this multilevel structure. The three reward-processing factors did not covary (anticipation-effort: b = −0.06, standard error [SE] = 0.06, z = −0.99, p = .32; anticipation-learning: b = −0.05, SE = 0.07, z = −0.72, p = .47; effort-learning: b = −0.11, SE = 0.11, z = 1.04, p = .30).
Final model for the online-study with factor loadings and covariances (significant parameters in bold).

As mentioned in the methods, the final model for the in-lab study did not meet our fit criteria (RMSEA = 0.07, SRMR = 0.07, CFI = 0.84, TLI = 0.79). Therefore, we base the covariance between factors on the EFA results. Correlations between factors were weak (anticipation-effort: r = .14; anticipation-learning: r = −.03; effort-learning: r = .15).
Difference in covariance between groups (RQ2)
For the online-study, the multigroup model had a worse fit than the model combining groups (all groups combined Akaike’s Information Criterion (AIC) = 23,233, BIC = 23,410, χ 2 (68) = 76.47; split by group AIC = 23,298, Bayesian Information Criterion (BIC) = 23,826, χ 2 (204) = 292.91, RMSEA = 0.05; p < .001). Therefore, we prefer the model combining all groups, that is, the model assuming equal covariance across groups.
Difference between groups in performance on positive valence constructs (RQ3)
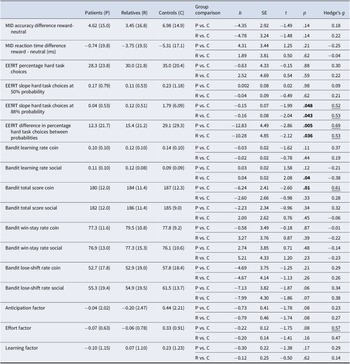
There were no differences between patients, relatives, and controls on any of the indices from the three reward tasks in the in-lab study. Table 2 shows the means and standard deviations (before transformation and outlier winsorization) and model results (after transformation and outlier winsorization) for each outcome. In the online-study, there were several group differences on the EEfRT and Bandit outcomes, but these did not survive multiple comparisons correction (see Table 3). We also examined group differences in scores extracted from the three factors in the final model from the online-study. There were no significant differences (see Table 3). Across the task outcomes, little variance was explained by the family ID random intercept. For several outcomes, the mixed models did not converge, or the random factor accounted for negligible variance, leading us to switch to ANCOVA analyses; details about this are explained in the notes of Tables 2 and 3.
Group differences in performance on the task outcomes for the in-lab study
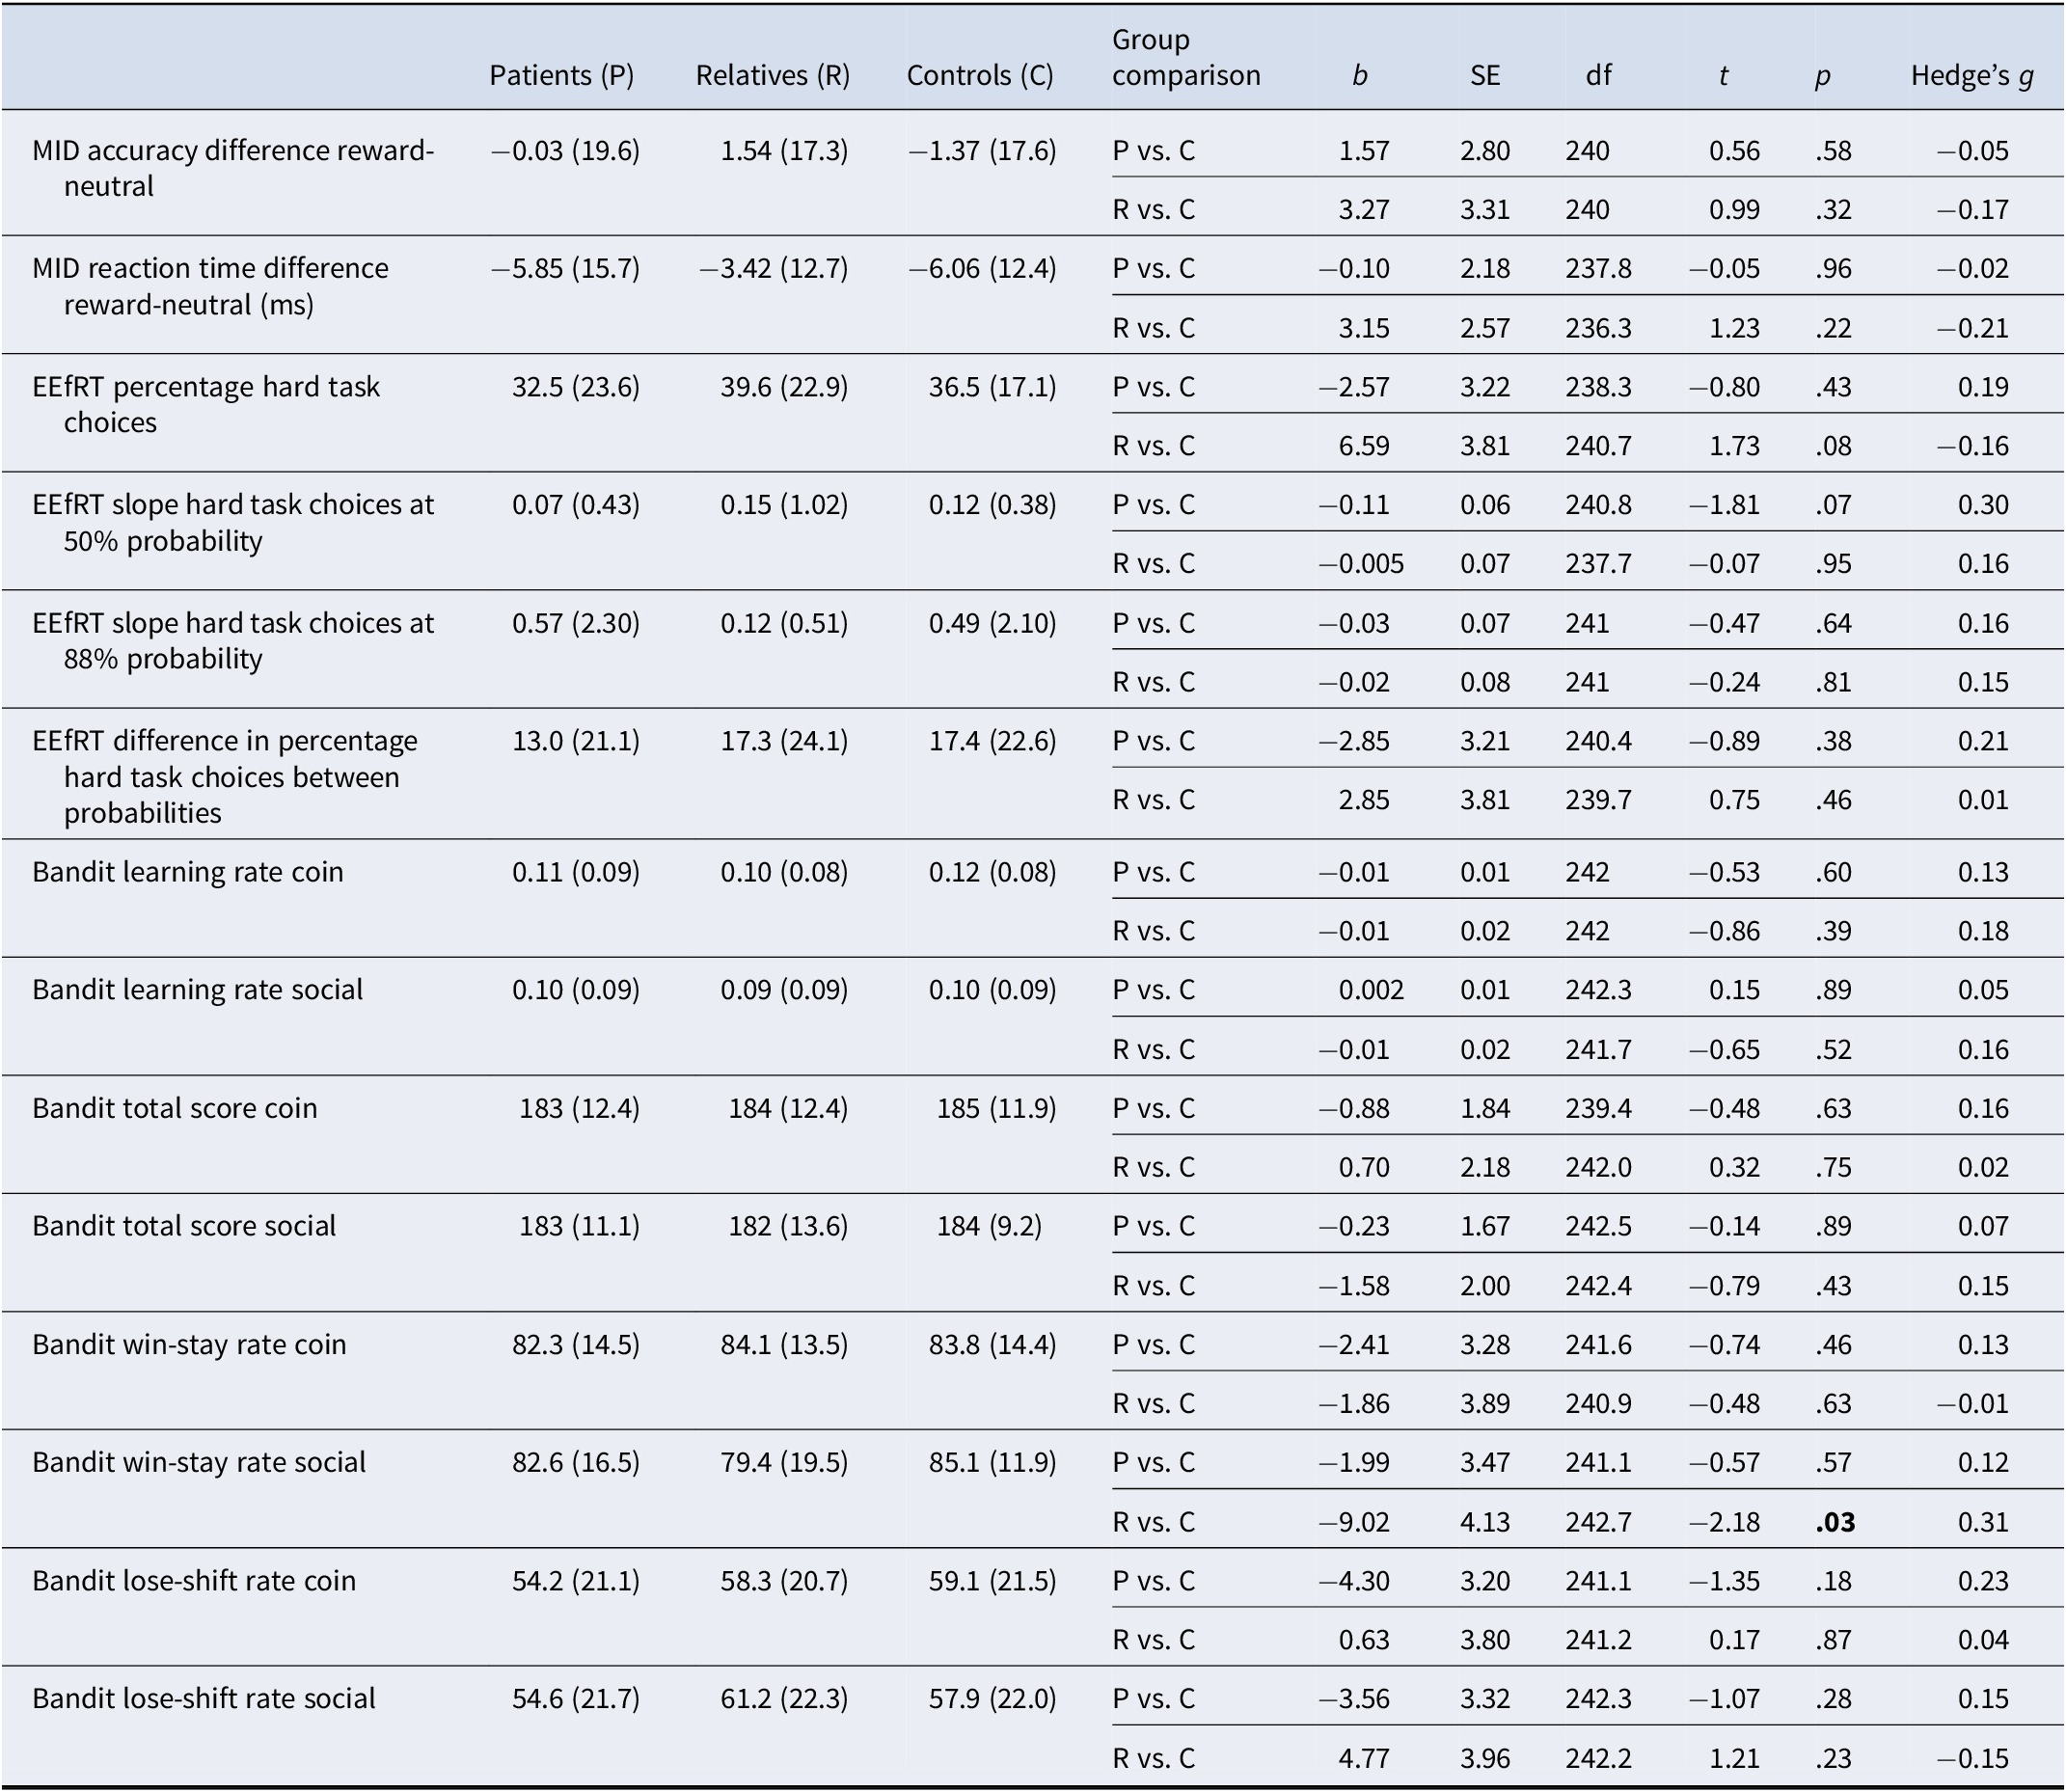
Note: Values under ‘patients’, ‘relatives’, and ‘controls’ are means and standard deviations of each group. The top row for each outcome represents the patients–controls comparison, the bottom row represents the relatives–controls comparison. Bold values are significant before multiple comparisons correction, no results were significant after correction. Results for ‘MID accuracy difference reward-neutral’, ‘EEfRT slope hard task choices at 88% probability’, and ‘Bandit learning rate coin’ were based on ANCOVA because no variance was explained by the random intercept.
Group differences in performance on the task outcomes for the online-study

Note: Values under ‘patients’, ‘relatives’, and ‘controls’ are means and standard deviations of each group. The top row for each outcome represents the patients (P)–controls (C) comparison, the bottom row represents the relatives (R)–controls (C) comparison. Bold values are significant before multiple comparisons correction; no results were significant after correction. Eta-squared values of at least 0.5 are underlined. Results for ‘EEfRT percentage hard task choices’, ‘EEfRT slope hard task choices at 88% probability’, ‘EEfRT slope hard task choices at 88% probability’, ‘Bandit win-stay rate coin’, and ‘Bandit total score social’ were based on linear mixed models. All other outcomes were analyzed with ANOCVA because no variance was explained by the random intercept.
Association between symptoms and performance on positive valence constructs (RQ3)
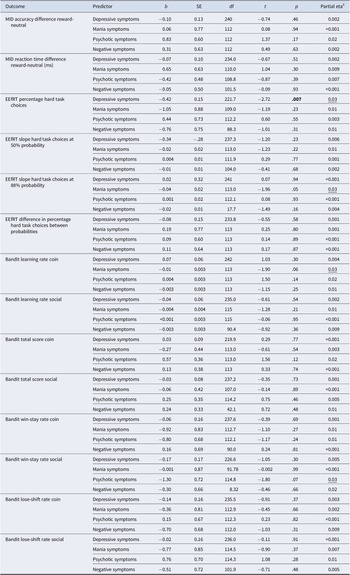
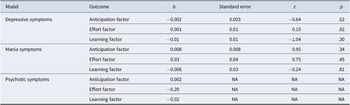
For the in-lab study, we examined symptoms in relation to the individual outcome measures of all tasks (see Table 4). The association between depressive symptoms and percentage hard task choices on the EEfRT was the only significant result before multiple comparisons correction, with 3% variance explained, and no associations were significant after multiple comparisons correction. For the online-study, we added the symptom measures to the final CFA model. The results are summarized in Table 5. For depressive symptoms, the model fit remained good, but the level of symptoms was not associated with any of the factors. For mania symptoms, the model fit remained good, but the level of symptoms was again not associated with any of the factors. For psychotic symptoms, the model became unidentified.
Associations between symptoms and performance on the task outcomes for the in-lab study

Note: Bold values are significant before multiple comparisons correction, no results were significant after correction. Eta-squared values of at least 0.03 are underlined. Results for ‘MID accuracy difference reward-neutral’ (all symptoms), ‘EEfRT slope hard task choices at 88% probability’ (depressive symptoms), ‘EEfRT difference in percentage hard task choices between probabilities’ (mania, psychotic and negative symptoms), ‘Bandit learning rate coin’ (all symptoms), and ‘Bandit learning rate social’ (mania and psychotic symptoms) were based on ANCOVA because no variance was explained by the random intercept.
Associations between symptoms and performance on the task factors for the online-study

Discussion
The PVS divides reward-related processes into three constructs: reward responsiveness, reward learning, and reward valuation. The current study aimed to examine how performance on tasks corresponding to these three constructs covaries; how performance differs between adults with mood-psychosis spectrum disorders, those at familial risk, and controls, and how performance relates to mood and psychotic symptoms. We tested this in an in-lab study and an online-study.
The three reward constructs showed weak (nonsignificant) covariance, and we did not find evidence that this covariance was different for individuals with a mood-psychosis spectrum disorder compared to relatives or controls. The weak associations between the reward constructs are in line with the literature: several studies found no correlation between the reward constructs (Duffy et al., Reference Duffy, Sturm, Sares, Sarabia, Delao, Becker, Colmenares, Manavi, Rojas, Tregellas, Young and Thomas2024; Nguyen et al., Reference Nguyen, Hess, Van Orman, Forken, Blatt, Fremont, Faraone and Glatt2022; Sailer et al., Reference Sailer, Wurm and Pfabigan2024), or a weak correlation (Geaney et al., 2015). This might imply that the constructs are more distinct than their clustering under the PVS would suggest. The individual outcome variables did cluster together within their reward construct (with the exception of the MID outcome variables), suggesting they have internal consistency. The weak performance of the original MID outcome variables might reflect that it is harder to capture difference scores reliably, or that the MID works better as a brain activation probe than as a behavioral measure.
In the in-lab study, there were no performance differences between groups on any of the outcome variables of the three tasks. In the online-study, no performance differences between groups survived multiple comparisons correction. Based on effect size, there were medium-sized effects of group on the EEfRT slope by reward value, the EEfRT difference in choices between the probabilities, and the overall effort factor. These indicated that controls take into account the reward value and probability more in their choices to exert effort than patients and relatives. Also, based on effect size, not significance, there was a medium-sized difference between patients and controls in the total score on the Bandit coin, with a lower score for patients. This is in line with previous research (Brambilla et al., Reference Brambilla, Perlini, Bellani, Tomelleri, Ferro, Cerruti, Marinelli, Rambaldelli, Christinodoulou, Joga, Dima, Tansella, Balestrieri and Frangou2013; Koch et al., Reference Koch, Schachtzabel, Wagner, Schikora, Schultz, Reichenbach, Sauer and Schlösser2010; Waltz et al., Reference Waltz, Frank, Robinson and Gold2007; Waltz et al., Reference Waltz, Frank, Wiecki and Gold2011; Yılmaz et al., Reference Yılmaz, Simsek and Gonul2012). Again, looking at effect sizes, it is partially driven by learning rate (Hedge’s g = 0.37), but not win-stay rate (Hedge’s g = −0.01), and therefore might reflect difficulty identifying, more so than sticking with, the most rewarding option.
Overall, there were fewer impairments in reward-related performance in patients than expected, although the medium effects described above are all in the expected direction. There are several possible explanations for this. The impairments could be overestimated in the literature, related to small samples and publication bias. Meta-analysis could be helpful in this regard, once enough studies have been done on each reward construct. Alternatively, the current study could have underestimated the impairments due to the relatively high-functioning samples. That is, almost all patients were outpatients, had relatively highly educated for this group, and exhibited low levels of current symptoms (see Table 2). This would suggest impairments might not be universal but driven by those with more severe illness history, in a current episode, or with lower education. There is some evidence of effort valuation depending on the current state in BD (Yang et al., Reference Yang, Huang, Harrision, Roser, Tian, Wang and Liu2021). Third, impairments might depend on the task and could be influenced by the cognitive demands of the task. For example, the Bandit task used in this study requires little working memory because the reward history of each arm stays on screen, in contrast to tasks in other studies, like the Iowa Gambling Task or probabilistic versions of the Go/No-go. Working memory impairments are well-known in mood-psychosis spectrum disorders (Bora & Pantelis, Reference Bora and Pantelis2015) and could affect group differences. For reward tasks that require working memory or other specific cognitive skills, it would be important for future research to test potential confounding by these skills, not just by general cognition or IQ.
For the comparison of participants at familial risk with controls, the literature was inconsistent and partly null (Linke et al., Reference Linke, Koppe, Scholz, Kanske, Durstewitz and Wessa2020; Hanssen et al., Reference Hanssen, Krabbendam, Robberegt and Fett2020; Mucci et al., Reference Mucci, Dima, Soricelli, Volpe, Bucci, Frangou, Prinster, Salvatore, Galderisi and Maj2015; Millman et al., Reference Millman, Gallagher, Demro, Schiffman, Reeves, Gold, Rouhakhtar, Fitzgerald, Andorko, Redman, Buchanan, Rowland and Waltz2020), and therefore our findings are largely consistent with the literature. In addition, the variance in the task outcomes explained by family ID was generally low. Thus, we found no evidence that performance on any of the three PVS constructs could constitute an endophenotype of mood-psychosis spectrum disorders.
Before multiple comparisons correction and when looking at effect sizes, there were more group differences in the online-study than in the in-lab study, particularly in the EEfRT/reward valuation construct. Yet, findings are highly similar after correction. We previously found that participants in the online-study and in-lab study behaved similarly on the EEfRT (Broer et al., Reference Broer, Barendse, van den Brink-Steinmann, Snijders, van der Weijden-Germann, Bilder and van Haren2025, preprint). Note that it was not our intention to directly compare the group differences or associations with symptoms between the settings. The use of the two samples can be seen as a form of replication.
No associations between symptoms and performance on the PVS constructs were significant after multiple comparisons correction. Based on the effect size, 3% of the variance in effort for reward was explained by depressive symptoms, with participants with more current depressive symptoms being less willing to exert effort. This is consistent with the literature (Halahakoon et al., Reference Halahakoon, Kieslich, O’Driscoll, Nair, Lewis and Roiser2020). The same explanations described above for the (lack of) group differences would also apply to these findings on symptom associations.
Strengths and limitations
Strengths include the use of two samples: (i) a built-in replication, with decent sample sizes; and (ii) the use of standardized, commonly used reward tasks that do not require high (working) memory demands. Yet, the current findings have to be considered in light of several limitations. First, the recruitment strategy and convenience sampling led to selection bias; the samples were relatively well-educated, and the patients were often high-functioning/low in current symptoms. Partially, this is difficult to avoid, as an acute psychotic or manic episode would interfere with participants’ ability to provide informed consent, and those with strong anhedonic symptoms might not be motivated to take part in research. The sampling could have led to an underestimation of group differences and limited variance in the symptom measures. Also, we did not distinguish between diagnostic categories within the group with mood-psychosis spectrum disorders. This was by design as the studies took a dimensional approach, focusing on symptoms that occur across the diagnostic categories (e.g. many of the participants with BD have experienced psychotic episodes). Next, in the online-study, different instruments were used to assess symptom severity for psychosis and depression than in the in-lab study, while negative symptoms were not assessed. It was obvious that we had to find an alternative to the PANSS interview, which was the BASYS24. Also, we aimed to reduce the time burden during the online-study by replacing the IDS with the PROMIS. In addition, we were interested in mechanisms in which familial risk expresses itself, and familial risk occurs heterotypically, that is, across diagnostic boundaries. Yet, it means that we cannot say if patients in certain diagnostic categories showed a different pattern of reward-related behavior than patients in other diagnostic categories. Further, we used one task per reward construct, except for reward learning. The factor analysis would be able to give better evidence of the three-factor structure if we had multiple tasks for each reward construct.
Conclusion
This study aimed to examine how performance on tasks of reward responsiveness, reward learning, and reward valuation covaries; how performance differs between adults with mood-psychosis spectrum disorders, those at familial risk, and controls; and how performance relates to mood and psychotic symptoms. We examined this in an in-lab setting and an online study. The three reward constructs showed weak (nonsignificant) covariance in all groups. There were a few impairments in reward-related performance in participants with a mood-psychosis spectrum disorder, none of which survived multiple comparisons correction. The comparison of participants at familial risk with controls showed no evidence that performance on any of the three PVS constructs could constitute an endophenotype of mood-psychosis spectrum disorders, though this does not mean they are not endophenotypes, just that the current results do not find support for it. There were no associations between symptoms and performance on the PVS constructs after multiple comparisons correction. We recommend future research examining the contribution of specific cognitive skills to reward-related behavior, and on sources of clinical heterogeneity in reward functioning within the patient group, such as disease severity.
Supplementary material
The supplementary material for this article can be found at http://doi.org/10.1017/S0033291726103444.
Acknowledgments
Deidentified data of participants who gave consent for data sharing will be made available through the National Data Archive. The authors would like to thank Katia Harle for her support in developing the Bandit task and Jim Gold for his input on the draft manuscript. This study benefited from the contributions of Dr. Robert Bilder, who provided guidance and support. We are saddened by his recent passing and dedicate this work to his memory.
Author contribution
MvdW-G: Conceptualization, methodology, writing – review and editing. NEMvH: Conceptualization, funding acquisition, supervision, project administration, writing – review and editing. MNM: Investigation, writing – review and editing. MB: Investigation, writing – review and editing. AV: Methodology, investigation, writing – review and editing. RO: Funding acquisition, project administration, writing – review and editing. RMB: Funding acquisition, project administration, writing – review and editing. MEAB: Conceptualization, methodology, data curation, formal analysis, writing – original draft, visualization, writing – review and editing.
Funding statement
This work was supported by the National Institute of Mental Health R01MH114152. Open access funding provided by Erasmus MC.
Competing interests
The authors declare none.




 Open access

