Notation

Introduction
It has been reported that the glaciers distributed around the Asian highland have contributed to the recent sea-level rise, accounting for as much as 20% of the volume transferred to the oceans from glacier wastage (Reference MeierMeier, 1984; United States Department of Energy, 1985). This estimation, however, is based on a few observations and many assumptions because information on this region has been quite limited. Therefore, the Intergovernmental Panel on Climate Change (Reference Warrick, le Provost, Meier, Oerlemans, Woodworth, Houghton, Meira Filho, Callander, Harris, Kattenberg and MaskellWarrick and others, 1996) laid down certain requirements related to the mass balance of glaciers excluding ice sheets:
-
(1) Need for knowledge about the monsoon-nourished glaciers of central Asia.
-
(2) Quantifying the process of internal accumulation (refreezing of meltwater) for incorporation into mass-balance models.
Almost all glaciers on the Tibetan Plateau are strongly affected by monsoons, and they undergo simultaneous accumulation and ablation in the summer. Glaciers on the plateau were categorized into two types (Reference Yafeng and LiShi and Li, 1981; Reference MaohuanHuang, 1990): the continental type, with little precipitation and low temperature; and the maritime type, with high monsoon precipitation and temperate internally. The continental-type glaciers are distributed widely from the central region to the northwestern semi-arid region, while the maritime-type glaciers are limited to the southeastern humid region.
Reference Fujita, Seko, Ageta, Jianchen and TandongFujita and others (1996) observed the role of superimposed ice in the mass balance of a continental-type glacier on the central Tibetan Plateau. They pointed out that the formation of superimposed ice at the snow–ice interface (ice surface) prevented mass loss in the accumulation zone during the melting season. A few cases of shrinkage of glacier volume in the Himalaya have been evaluated (Reference Fujita, Nakawo, Fujii and PaudyalFujita and others, 1997, Reference Fujita, Takeuchi and Seko1998; Reference Kadota, Fujita, Seko, Kayastha and AgetaKadota and others, 1997). Reference Fujita, Nakawo, Fujii and PaudyalFujita and others (1997) pointed out that the glaciers in the Himalaya, which were under the monsoon climate, have shrunk more rapidly than those in other regions of the world. However, there have been few evaluations of glacier mass balance using a numerical energy-balance model on the plateau, although several observations have been made with respect to glacier mass balance (e.g. Reference Ageta, Wenjing and NakawoAgeta and others, 1989, Reference Ageta1991; Reference Jianchen and TandongPu and Yao, 1994). Therefore, it is important to understand the mass balance of the continental-type glacier under the monsoon climate and its response to climate change.
In order to evaluate the effects of the monsoon climate and refreezing process on the glacier mass balance on the plateau, an energy-balance model including the refreezing process is constructed in this study. The present study focuses on Xiao (“small” in Chinese) Dongkemadi glacier in the middle of the Tanggula mountains (33° N, 92° E), central Tibetan Plateau (see Fig. 1). The terminus and highest altitudes are 5380 and 5926 m a.s.l., respectively, and the area of the glacier is 1.77 km2. The glacier surface faces south to southwest with a gentle slope (Fig. 2).
Location map of study area. TG, Tanggula mountain area including Xiao Dongkemadi glacier

Location map of mass-balance stakes (open squares) and the sites where ice temperature and albedo were measured (solid squares) on Xiao Dongkemadi glacier. Meteorological station was located at 5600 m a.s.l. (solid square).

Mass-Balance Model
The energy-balance model consists of heat balance including heat conduction into the glacier, and mass balance including refreezing of water in the snow layer in a vertical dimension. A schematic flow chart of the model is shown in Figure 3. Changes in the surface level derived from accumulation, surface melting, evaporation and snow densification, and the ice level derived from the formation of superimposed ice are taken into account in order to evaluate surface conditions such as albedo. Input variables for the model are the daily mean values of solar radiation, air temperature, relative humidity and wind speed, and daily precipitation.
Schematic structure of energy-balance model.

Surface heat balance
The basic equation of heat balance at the surface is described as:
All components are positive when fluxes are directed towards the surface. Net radiation consists of short- and longwave radiations as:
Turbulent sensible- and latent-heat fluxes are calculated by the bulk method:
and
The surface temperature is calculated from Equations (1–4) as:

Here we assume that heat for melt is zero, and the following approximations are used:
and
When the positive surface temperature is calculated in Equation (5), it is assumed to be zero. The following iterative calculations are performed until the difference between surface temperatures becomes <0.1°C:
-
(1) surface temperature is obtained assuming no heat transfer into the glacier (Equation (5));
-
(2) the heat transfer into the glacier is calculated using the calculated surface temperature (see next subsection);
-
(3) the new surface temperature is obtained using the calculated heat flux into the glacier (Equation (5)).
Saturated specific humidity and its gradient are calculated as functions of air temperature by using the empirical equations presented by Reference KondoKondo (1994).
Downward longwave radiation is estimated from the dew-point temperature at the surface and a coefficient related to the sunshine ratio based on empirical equations (Reference KondoKondo, 1994). The dew-point temperature at the surface is obtained from relative humidity and saturated vapor pressure, which is derived from air temperature. A coefficient relating to the sunshine ratio is calculated from the downward shortwave radiation under a cloudless sky, which is calculated theoretically from the latitude, the Julian date and the observed downward shortwave radiation.
Surface albedo has to be evaluated according to the surface condition because that condition varies with altitude, time and climate change. Reference Yamazaki, Kondo, Sakuraoka and NakamuraYamazaki and others (1993) estimated surface albedo from surface snow density considering the multiple reflection in a surface snow layer and assuming that the surface snow layer consists of an ice plate and an air layer in the vertical dimension. The thickness of the ice plate is empirically calculated from surface snow density. Therefore, it is necessary to consider the densification of snow for the calculation of surface albedo. Reference MotoyamaMotoyama (1990) presented a model of snow densification due to viscous compression. A compactive viscosity factor is estimated by an empirical formula with respect to snow density. The strain-rate–stress relation for a layer is calculated when the density of a snow layer at a given depth and the overburden load on that layer are given. The minimum albedo of bare ice is fixed at 0.48 based on the observed data (Reference Seko, Jianchen, Fujita, Ageta, Ohata and TandongSeko and others, 1994). The effect of dust condensation on the surface due to ablation is not taken into account in this model.
It is assumed that solar radiation, wind speed, relative humidity and the amount of precipitation are independent of altitude. Topographical effects are not taken into account since the glacier and the surrounding mountains have gentle slope.
Heat transfer into glacier
The heat transfer into the glacier should be calculated for an estimation of the surface temperature and water refreezing. Heat conduction within the snow layer is calculated using a temperature profile within the snow and the absorption of irradiance as:
and
The thermal conductivity of snow is obtained as a function of snow density (Reference MellorMellor, 1977). The net irradiance (difference between downward and upward irradiance) within the snow at a given depth from the surface is calculated by assuming an exponential decrease in radiation as:
It is assumed that the extinction coefficient of snow is constant and independent of snow density, grain-size, wavelength and so on. The value used (40 m−1) is from Reference Fukami, Kojima and AburakawaFukami and others (1985). Calculations with smaller values of the extinction coefficient did not significantly affect the mass balance. When the snow layer is wet, on the other hand, the heat transfer within is zero and the absorbed irradiance causes an internal melt.
Heat conduction in glacier ice is basically described as in the equations for snow as:

and
The thermal conductivity of ice is obtained as a function of ice temperature (Reference HobbsHobbs, 1974). It is assumed that the extinction coefficient of ice is constant and independent of wavelength. The value (10 m−1) is taken from Reference HobbsHobbs (1974). The net irradiance at the ice surface (I itf), however, is neglected when the snow thickness is >0.2 m since I itf becomes 0.03% of the absorbed solar radiation at a depth of 0.2 m from the surface.
If there is no water in snow, the temperature profile in a glacier is calculated with Equations (6) and (7), and the heat transfer into the glacier is obtained from the difference in temperature profiles during a given period as:

If the surface temperature is zero with wet snow, heat flux between the surface and glacier body is considered to be zero since no temperature gradient exists within snow. If the surface temperature is negative with wet snow, a positive flux from the glacier body to the surface is caused by the temperature gradient below the surface as:
Incorporating this calculated heat flux into the glacier, the new surface temperature is calculated by Equation (5) until the surface temperature becomes stable as mentioned above.
Refreezing of water
Reference Fujita, Seko, Ageta, Jianchen and TandongFujita and others (1996) pointed out that the amount of superimposed ice formed at the ice surface is significant in the mass balance of this glacier. In the model of this study, an amount of superimposed ice during a given period is calculated from the variation in glacier ice temperature as:

It is assumed that the snow layer can retain water up to 5% of water content in volume when meltwater and/or rainwater are supplied. Water cannot infiltrate the ice surface, and excess water runs off downstream. It is considered that heat flux from wet snow to the surface is released by the refreezing of capillary water in the snow layer calculated using Equation (9). Thus, the refrozen amount of capillary water is described as:
Water is also refrozen within the snow layer when it percolates into cold snow. The amount of refrozen water within cold snow is calculated from the changes in snow temperature as:

The refreezing of capillary water contributes to an increase in snow density. It is assumed that snow with high density and an ice layer do not prevent the percolation of water.
Phase of precipitation
Because precipitation takes place mainly during the summer monsoon season in this region, it is considered that the snowfall/rainfall considerably affects the mass balance. A relationship between the probability of snowfall and air temperature in this region is obtained from the observed data of Reference UenoUeno and others (1994) as:
Observations and Input Data
Continuous glaciological observations were started in 1989 on Xiao Dongkemadi glacier. Observations related to glaciology, hydrology and meteorology were then carried out intensively on and around the glacier during the period May-September 1993 (Ageta and others, Reference Ageta, Tandong and Ohata1994, Reference Ageta, Seko, Fujita, Jianchen and Tandong1997; Reference Seko, Jianchen, Fujita, Ageta, Ohata and TandongSeko and others, 1994). The locations of observation sites on the glacier, and the observed variables, altitudes, periods and references are shown in Figure 2 and Table 1.
Location, period and source of observed variables on Xiao Dongkemadi glacier

The density and thickness of the snow layer, and the temperature profile in the glacier are needed for the present model as the initial conditions at a given site. The initial snow-layer and ice density are assumed to be 400 and 900 kg m−3, respectively. The snow thickness observed on 10 October 1992 is adopted as the initial surface condition. The initial temperature profile at a given altitude is estimated from the profile at 5600 m a.s.l. on 10 October, and from the lapse rate of ice temperature, which was obtained as 0.0072°C m−1 from the observed data. The temperature at 20 m depth is assumed to be constant. The lapse rate of air temperature is obtained as 0.0075°C m−1 from the meteorological dataset (Reference Ohta and AgetaOhta and Ageta, 1996).
The input data used for the calculation were obtained at 5600 m a.s.l. on Xiao Dongkemadi glacier from 10 October 1992 to 9 October 1993. Input variables were the daily mean values of air temperature, solar radiation, relative humidity and wind speed, and daily precipitation. Because the available daily amount of precipitation was limited during the 1993 monsoon season, the amount during winter was estimated from the change in the surface level recorded at 5600 m a.s.l., assuming that the surface-level rise corresponds to the snowfall with a density of 100 kg m−3. The possibility of rainfall during winter can be neglected since air temperature was below freezing. The average/total variables during the calculated year are summarized in Table 2. Bulk coefficient for turbulent heat fluxes (0.002; Reference Yamazaki, Kondo, Sakuraoka and NakamuraYamazaki and others, 1993) is chosen so the calculated results fit the observed ones. Coefficients in the calculation of downward longwave radiation are tuned as follows: downward longwave radiation is calculated using data observed at base camp (50–60 m a.s.l.; 10 km from the glacier) and compared with the residual longwave radiation, which is obtained from the observed downward and upward shortwave radiation, surface temperature (upward longwave radiation) and net radiation at base camp.
Annual average/total variables at 5600 m a.s.l. of Xiao Dongkemadi glacier as input in the calculation for the year from 10 October 1992

Verification of Model
Temporal variation in calculated parameters
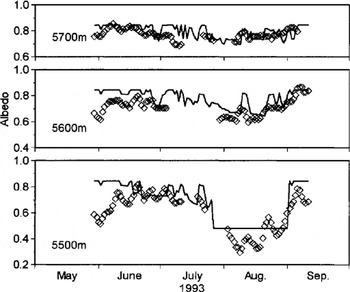
Calculations were done to determine whether the model was indeed representative for the year beginning 10 October 1992. Figure 4 shows the comparison between observed and calculated albedos at 5500, 5600 and 5700 m a.s.l. for the period May–September 1993. The observed albedos are lower than calculated ones in early June. This may be due to deposition of dust, which was not considered in the model. Figure 5 shows the variation between observed and calculated ice temperatures on the surface and at 2 and 8 m depth at 5600 m a.s.l. Each sensor level was fixed at the depth at which the sensors were installed in October 1992. Changes in the levels of surface and ice surface were obtained at three different altitudes (5500, 5600 and 5700 m a.s.l.; Fig. 6). These results show that the model was indeed representative of the surface condition, heat balance, heat conduction in the glacier, mass balance and refreezing process at different glacier altitudes.
Observed (squares) and calculated (solid line) albedos at 5700, 5600 and 5500 m a.s.l. on Xiao Dongkemadi glacier, May–September 1993.

Observed (markers) and calculated (lines) surface and ice temperatures at 5600 m a.s.l. on Xiao Dongkemadi glacier, October 1992–September 1993.

Observed (markers) and calculated (lines) relative levels of snow surface (crosses) and ice surface (triangles) at 5700, 5600 and 5500 m a.s.l. on Xiao Dongkemadi glacier, October 1992–September 1993. The level of ice surface on 10 October 1992 is set to zero at each site.

Mass balance during 1992/93
The mass balance of Xiao Dongkemadi glacier was observed by the stake method on 10 October 1992 and 11 September 1993. The altitudinal distribution of specific mass balance was calculated at intervals of 50 m in elevation during the same period of stake measurements (Fig. 7). The model represents well the specific mass balances at different altitudes.
Altitudinal distribution of the observed (crosses) and calculated (line) mass balances on Xiao Dongkemadi glacier, 10 October 1992 to 11 September 1993.

The areal average of each mass-balance component for the whole glacier area during the year from 10 October 1992 was calculated considering a specific value and an area of Xiao Dongkemadi glacier at a given altitude span of 50 m as:
Calculated values are summarized in Table 3. The annual balance during 1992/93 was +200 mm w.e. Reference Fujita, Seko, Ageta, Jianchen and TandongFujita and others (1996) determined that 60% of the infiltrated water was retained in the accumulation area, based on observations during the melting season of 1993. Even for the whole glacier area, including the ablation area, about 20% of the meltwater and rainwater was refrozen in the snow layer and did not contribute to runoff. This implies that the mass balance and runoff of a cold glacier cannot be estimated from surface heat/mass balance alone during the melting season (Reference Ageta and FujitaAgeta and Fujita, 1996).
Areal average of the calculated mass-balance components for the whole area of Xiao Dongkemadi glacier for the year from 10 October 1992

Discussion
Effect of summer accumulation on mass balance
Continental-type glaciers are widely distributed on the plateau and maintain their mass even under environmental conditions such as arid climate and the strong solar radiation that occurs at high altitude and middle latitude. In order to verify how glaciers maintain their mass in the continental climate, model calculations were performed by switching the peak accumulation season from summer to winter and exchanging the refreezing processes of cold and temperate glaciers, since these were considered to affect the mass balance. For the winter type, the original precipitation dataset in the first half of the year (arid winter) was exchanged for that of the second half (humid summer) to obtain an annual cycle of humid winter and arid summer in the model verification, while the original precipitation cycle was used for the summer type. It was assumed that all of the initial ice was at 0°C, and that the refrozen water, which was produced by the calculation from temperature profiles, was not retained in a glacier of the temperate type, while the calculation in the cold type was undertaken in the same manner as in the model verification.
Figure 8 and Table 4 show the altitudinal distributions of four types of modeled mass balances for the year from 10 October 1992, and their averages for the whole glacier area and equilibrium-line altitudes (ELAs), respectively. The figure shows that the mass-balance profile is affected largely by the difference between summer and winter accumulation rather than between a cold and a temperate interior. Annual balances of the summer type were positive, and those of the winter type negative, for both cold and temperate types, and ELAs of the summer type are about 200 m lower than those of the winter type, as shown in Table 4. It is believed that the difference between summer and winter types results from the surface condition during the melting season. In the summer types, summer snowfall keeps the albedo high and restrains melting, though a part of summer precipitation does not contribute to the accumulation as rainfall. In the winter types, on the other hand, the boundary altitude of the snow and ice surface would rise with time because of insufficient snowfall during the melting season. The figure and table suggest that glaciers on the plateau can exist over a wide temperate range because they are accumulated in summer. If glaciers were accumulated in winter, they would maintain their mass only in a colder environment (higher altitude/latitude) under the same amount of precipitation.
Altitudinal distributions of annual balances calculated for summer accumulation type in cases of the cold glacier (SC; solid squares) and the temperate glacier (ST; open squares), and for winter accumulation type in cases of the cold glacier (WC; solid circles) and the temperate glacier (WT; open circles).

Areal average of annual balances and ELAs calculated for four types of glaciers (summer and winter accumulation types and cold and temperate types)
The figure also shows that the altitudinal gradients of mass balance around the equilibrium line of the summer types are larger than for the winter types. Similar characteristics were pointed out by Reference Kaser, Hastenrath and AmesKaser and others (1996) schematically for tropical glaciers where accumulation and ablation occur simultaneously throughout the year. The large gradient of mass balance in the summer type is considered to be a result of the high sensitivity of mass balance to variables dependent on altitude, such as air temperature.
Sensitivity of mass balance to meteorological variables
In order to compare the sensitivities of mass balances to the meteorological variables for summer/winter types, firstly only the annual air temperature at which the annual balance becomes zero in the average for the whole glacier area for each type was changed. Then the values of all of the variables needed to change the annual balance by −100 mm w.e. were found as shown in Table 2. Both summer and winter types were examined in the same way as the cold type. Since the albedo is not an input variable, it has to change in the calculations.
As shown in Table 2, the change in the albedo affected the change in mass balance for both summer and winter types due to the strong solar radiation at high altitude in the middle latitude. The table suggests that air temperature also considerably affects the mass balance, especially in the summer type. Because the increase in air temperature not only decreases accumulation in summer, but also drastically increases ablation in combination with albedo lowering due to the decrease in snowfall during the melting season, the summer type is more sensitive to air temperature than the winter type. Other variables, such as precipitation, solar radiation, relative humidity and wind speed, have little effect compared with their average/total values.
Seasonal dependence of mass balance
Occasional periods of albedo lowering were apparent in the meteorological data. This phenomenon is thought to be caused by dust deposition due to sandstorms, and to affect mass balance strongly. Not only albedo but also some of the other variables changed for a short period in a few cases. “Seasonal dependence” of mass balance of the glacier, therefore, was examined by changing the time when a variable was altered for a short period in both summer and winter types. Daily means of albedo (−0.2) and air temperature (+1°C), and daily precipitation (+10 mm w.e.) were changed for only 5 days from the input data.
Figure 9 shows the seasonal dependence of mass balance on the change in each variable for 5 days. The abscissa and ordinate are the date when perturbation was given and the perturbation of annual balance at the end of the calculation year (9 October 1993), respectively. In both summer and winter types, changes in albedo and air temperature in winter do not affect the annual balance very much, whereas increased precipitation brings about a positive annual balance more than the added amount of precipitation. The albedo lowering in June and July alters the annual balance perturbation by >100 mm w.e. in the negative direction in both summer and winter types, because solar radiation in this season is intense. Ghanges in air temperature during the melting season also change the annual balances by nearly −50 mm w.e. These findings imply that the surface condition changed by perturbation for only 5 days in the melting season greatly affects the heat/mass balance for the succeeding period.
Seasonal dependence of mass-balance sensitivity on the changes in variables for a 5 day period calculated for summer (solid lines) and winter (dashed lines) accumulation types. Horizontal and vertical axes denote the date when 5 days perturbation is given, and the perturbation of areal averaged annual balance at the end of the calculation period (9 October 1993). PR, AT and ALB denote the daily precipitation, air temperature and albedo, respectively.

Figure 9 clearly shows that the effect of summer precipitation perturbation in the winter type on the perturbation of the annual balance is quite large (more than four times the annual balance perturbation derived from winter precipitation perturbation), whereas the change in the summer has little impact on the annual balance. This would suggest that precipitation in the melting season is significant since it prevents albedo lowering and restrains ablation.
Vulnerable glaciers in the monsoon climate
The previous subsection notes that the summer accumulation contributes to maintaining glaciers on the plateau. On the other hand, Reference Fujita, Nakawo, Fujii and PaudyalFujita and others (1997) pointed out that glaciers in the Himalaya in a monsoon climate have shrunk more rapidly than those in other regions of the world. As shown in Table 4, annual balances of the summer type are positive, whereas the summer type is more sensitive to air temperature than the winter type (Table 2). Figure 10 shows the annual mass balances of both summer and winter types when the annual air temperature is changed. When annual air temperature is increased by >2.35°C compared with 1992/93, the annual balance of the summer type becomes lower than that of the winter type, as shown in Figure 10.
Areal averaged annual balance of summer (solid lines) and winter (dashed lines) accumulation types when the annual air temperature is changed from the present condition. Annual air temperatures, when the mass balances of both types become 0 mm w.e., are shown in Table 2.

Reference Oerlemans and FortuinOerlemans and Fortuin (1992) tried to estimate the worldwide glacier sensitivity based on an energy-balance model of 12 glaciers around the world. Reference Oerlemans, Haeberli, Hoelzle and SuterOerlemans (1998) discussed the effect of increased precipitation on the same glaciers by calculating the changes in annual balances when air temperature was increased by +1°C, and precipitation simultaneously by +10%. In order to evaluate the sensitivity of glaciers on the plateau, the sensitivities of summer and winter types were compared with those of these 12 glaciers, as shown in Figure 11. The sensitivities of the other 12 glaciers were taken from Reference Oerlemans, Haeberli, Hoelzle and SuterOerlemans (1998). The figure suggests that the sensitivity of the winter type fits the Oerlemans curve, whereas the summer type is more vulnerable than other glaciers. This is because the increase in air temperature causes a decrease in accumulation and a drastic increase in ablation with lowering albedo, whereas the increase in precipitation simply increases accumulation in the winter type and other glaciers. Thus the contribution of glaciers around the Asian highlands to a rise in sea level (estimated to be 20% of world glacier wastage in the previous study, as mentioned in the Introduction) may have been underestimated for summer-accumulation-type glaciers in the monsoon climate.
Changes in annual balances of 12 glaciers around the world when air temperature and precipitation are increased by 1°C and 10%. Crosses denote the results of summer- (S) and winter- (W) accumulation-type glaciers calculated in this study. Solid circles and exponential fitting curve are from Reference Oerlemans, Haeberli, Hoelzle and SuterOerlemans (1998).

Concluding Remarks
The model in this study has estimated that 20% of total infiltrated water was refrozen and does not run off from the glacier. This implies that the runoff and mass balance of cold-type glaciers cannot simply be estimated from the mass/heat balance at the surface.
Model calculations performed for the summer and winter accumulation types showed that glaciers under a semi-arid environment could maintain their mass since the monsoon provides precipitation during the melting season. If the same amount of precipitation were provided in winter, the locations of glaciers would be limited to colder environments such as higher altitude/latitude. In the summer-accumulation type, some precipitation fails to contribute to the accumulation as rainfall, but snowfall keeps the albedo high and largely restrains ablation during the melting season. Since the Tanggula mountains are located on the boundary between the monsoon and westerly flow (Reference Yatagai and YasunariYatagai and Yasunari, 1998), the accumulation season and/or precipitation amount in this region may change in a complex way as climate changes. The glacier would be sensitively affected by such changes, as the model results show.
Although glaciers on and around the plateau can exist in the form of the summer-accumulation type, they are more vulnerable to warming than winter-accumulation-type glaciers. For summer-accumulation-type glaciers, an increase in air temperature causes a decrease in accumulation and a drastic increase in ablation with lowering albedo. The influence of glaciers in the Asian highlands on sea-level change may therefore be more than has been estimated in studies to date.
Acknowledgements
The authors are very grateful to all the members of the China–Japan joint project CREQ (Cryosphere Research on Qingzang Plateau) for their valuable advice as well as their logistic support in the field. The manuscript was greatly improved by the critical comments of R.J. Braithwaite, M.J. Hambrey, M. Nakawo, T. Aoki and an anonymous reviewer. Financial support came from Grants-in-Aid for the International Scientific Research Program (No. 03041038) and for the International Geosphere–Biosphere Program Scientific Research, both from the Ministry of Education, Science, Sports and Culture, Japanese Government, and for Cooperative Research under the Japan–U.S. Cooperative Science Program from the Japan Society for the Promotion of Science.