

Introduction
In one of the early examinations of the electoral fortunes of incumbents, Rose and Mackie (Reference Rose, Mackie, Daalder and Mair1983) begin with a simple question: Are winners losers? Their own comprehensive and comparative analyses provide a clear answer, revealing how incumbency is more likely to be a liability than an asset. Subsequent research has reinforced this notion across time and countries, making the so‐called ‘cost of ruling’ – the negative incumbency effect – one of the most well‐established findings in political science (Wlezien Reference Wlezien2016; Cuzan Reference Cuzan2015). In other words, governing parties lose votes. Studies have estimated that, on average, elections cost incumbents between 1.6 and 2.5 per cent of their vote share (Paldam Reference Paldam1986; Nannestad & Paldam Reference Nannestad and Paldam1999; Narud & Valen Reference Narud, Valen, Strøm, Müller and Bergman2008; Stevenson Reference Stevenson2002; Wlezien Reference Wlezien2016), and the size of this electoral wear increases with their tenure in office (cf. Nannestad & Paldam Reference Nannestad and Paldam1999; Stevenson Reference Stevenson2002; Wlezien Reference Wlezien2016).
Although we know that winners tend to become losers, we know less about why. This article puts forward and tests the argument that bad news accumulates over tenure, gradually eroding the electoral support for government. Our basic expectation is that news tone affects the public's perception of and support for the government. More particularly, we argue that a constant stream of negative news images causes an increasing congestion of ‘bad memories’ that is an important driver of the cost of ruling. This congestion is an implied but unexplored aspect of existing theoretical perspectives on why government vote loss increases with the length of tenure. Negative media coverage sometimes figures as one of the liabilities of office (e.g., Rose & Mackie Reference Rose, Mackie, Daalder and Mair1983: 119–121; Green & Jennings Reference Green and Jennings2016: 138–139), but focused theoretical attention and systematic empirical investigation have been lacking.
The tendency to emphasise negative developments is a well‐known characteristic or news value of the media (Harcup & O'Neill Reference Harcup and O'Neill2001; Shoemaker Reference Shoemaker2006). We make no assumptions about the specific sources or causes of news negativity (e.g., it is not our intention to pin negativity on journalistic framing alone) and we make no attempt to distinguish between some sort of objective (negative or positive) reality and the framing given to stories in the news. We are simply interested in how the information available to voters through the news affects their support for government. Important in our approach to news tone is the inherently political nature of news in the sense that its content is usually more favourable to some actors than others (Green‐Pedersen et al. Reference Green‐Pedersen, Mortensen and Thesen2017). This is particularly the case when studying politics from a government‐opposition perspective. Obviously, most people will view news about increases in hospital queues or unemployment as negative, but in the context of party competition, such news stories play to the disadvantage of those in charge of policy making much more than they hurt the opposition.
Utilising a dataset on daily news coverage over a 20‐year period in Denmark, we show how governments with the same tenure, struggling with comparable economic conditions, experience different degrees of vote loss according to the accumulated balance of positive and negative news images during tenure.
Why are winners losers?
Although we know that governing parties lose votes and that the cost of ruling has increased in recent decades (Narud & Valen Reference Narud and Valen2007), there is still a limited body of research that successfully explains why governments lose votes over time. Admittedly, there is a large, strong literature on vote and popularity (VP) functions that is of interest to this discussion. Many VP studies focus on how the development of the economy (or perceptions thereof) affects government popularity and how governments try to influence their own support by manipulating the economy (cf. Lewis‐Beck & Paldam Reference Lewis‐Beck and Paldam2000). Similar to the cost‐of‐ruling research VP studies concentrate on government popularity, but the focus in this literature is on cyclical patterns in government support rather than decline over time. Interestingly, the VP literature has shown how economic news play a key role in shaping public perceptions of how the economy is doing (cf. Nadeau et al. Reference Nadeau, Niemi, Fan and Amato1999). Hetherington's (Reference Hetherington1996) seminal study of the 1992 American presidential campaign, for instance, showed how the media's negative framing of the economy contributed to Bush's defeat. The important role of the news has thus also been highlighted in this neighbouring literature on government popularity, which stimulates the idea of the media being a central factor in the steady decline of government support over election periods.
Returning to the cost of ruling, studies that concentrate on variations across political systems highlight how the incumbency disadvantage varies according to the concentration and visibility of policy responsibility (Narud & Valen Reference Narud, Valen, Strøm, Müller and Bergman2008; Rose & Mackie Reference Rose, Mackie, Daalder and Mair1983; Strøm Reference Strøm1990; Powell & Whitten Reference Powell and Whitten1993; Palmer & Whitten Reference Palmer, Whitten, Dorussen and Taylor2002). Where concentration and visibility are high, voters can assign blame to the government more easily. This in turn accelerates and/or strengthens the process by which voters gradually lose faith in incumbents. However, this still does not explain the basic finding: that governments – across time and institutional contexts – (almost) always lose.
Instead of using variation as a starting point, Nannestad and Paldam's (Reference Nannestad and Paldam1999) comprehensive and much‐cited review of the cost‐of‐ruling literature approaches the puzzle from the observation that the cost of ruling is unusually constant: ‘Therefore it must be explained by something that is likely to be unusually stable as well’ (Nannestad & Paldam Reference Nannestad and Paldam1999: 9). In their effort to explain the cost of ruling by way of what they call a ‘deep parameter of human behaviour’, they proceed with three theoretical models. The first, based on Mueller (Reference Mueller1970), holds that governments face an increasing coalition of minorities. When governments make decisions, there is inevitably a losing minority of discontented voters. The longer a government stays in office, the more decisions it makes. The losing minorities are not identical every time, meaning that the result is an increasing number of voters who have seen the government implement policies they do not support.Footnote 1 Importantly, this happens because the government made inconsistent and unrealistic promises prior to taking office – in order to win office. But when entering office these ‘over‐promises’ are revealed. The opposition, on the other hand, can formulate policy alternatives and promises that may shine in comparison to the compromises necessary when they later (after winning) must balance the state budget. The idea is simple and plausible, but empirical support is nevertheless lacking (Wlezien Reference Wlezien2016).
The second perspective discussed by Nannestad and Paldam is the median‐gap theory, which is based on the notion that party competition in a one‐dimensional, left‐right issue space is competition over the median voter (Hotelling Reference Hotelling1929). Moreover, it assumes that parties move policy to their preferred position (left or right) after taking office. Gradually they thereby lose a proportion of the median voters who give their vote to the opposition in order to close the median gap and again bring policy closer to their own centrist position. Stevenson (Reference Stevenson2002) generalised this theory, showing how policy will grow more extreme (more to the left or right), and the cost of ruling higher as tenure increases; not because governing parties become more extreme, but because it takes time to legislate and implement all of their preferred policies across the many different policy sectors (Wlezien Reference Wlezien2016). Again, the idea is neat and convincing, but empirical evidence has previously been lacking. However, in his recent analysis of American presidential elections, Wlezien (Reference Wlezien2016) finds that policy misrepresentation (based on the median‐gap hypothesis) is an important mechanism that explains part of the cost of ruling.
Nannestad and Paldam's third contender (and favourite) is grievance asymmetry theory. The basic story here is the well‐known psychological bias that induces an asymmetric response to negative and positive information (cf. Kernell Reference Kernell1977; Lau Reference Lau1982; Soroka Reference Soroka2014). Assuming that voters base their decision on economic developments – a fair assumption according to the extensive literature on the economic vote – the fact that they over‐emphasise negative changes and under‐emphasise positive ones will lead to a cost of ruling. Even with a better‐than‐average economy, the grievance asymmetry ensures a vote loss. As pointed out by Wlezien (Reference Wlezien2016), however, a problem with this perspective is that in order for grievance asymmetry theory to explain an increasing cost of ruling, the asymmetry has to increase over time; moreover, the grievance asymmetry perspective on the cost of ruling has yet to be tested in empirical research.
Another potential explanation can be found in the literature on valence politics. Green and Jennings (Reference Green and Jennings2012), for instance, study how the voters’ perception of the government's issue competence granger‐causes their support for them. While this perspective does not offer an explanation of why governments would suffer from increasing vote loss over time, in a recent comparative study, Green and Jennings (Reference Green and Jennings2016) address this limitation by concentrating on how performance evaluations develop over the course of tenure. Their impressive and comprehensive analyses show how negative performance evaluations have a stronger effect on government support than do positive evaluations and that the accumulation of negative judgements exerts a considerable effect on incumbent support: ‘[T]he costs of governing are a function of the accumulation of blame for poor perceived performance’ (Green & Jennings Reference Green and Jennings2016: 142).
The endogenous nature of the relationship between performance evaluations and vote intention means that the interpretation of these results is open for debate. The independent variable of interest in this perspective – evaluations of government performance – comes very close to the dependent variable – vote intention for the incumbent parties. In fact, applying a slightly broader definition of the cost of ruling, a decline in performance evaluations could arguably be included as part of the phenomenon we are trying to explain. It is nevertheless interesting that the performance judgements are unrelated to the exogenous performance indicators of incumbents (Green & Jennings Reference Green and Jennings2016), which begs further questions about what is driving the observed decline in performance judgements.
Green and Jennings suggest some answers when discussing their assumptions about the underlying processes that cause performance evaluations to decline. From the perspective of this articl, it is noteworthy that this discussion concentrates on the information about government to which voters are exposed. In fact, for the first time in this literature, the role of the media and negative news is given serious consideration:
One bad news story will be followed by another, then another, and so on. We would not expect negative performance shocks to dissipate, returning to equilibrium, if they are stored in public memory in such a significant way and if negativity bias means they are more attended to and memorised. The accumulation of negative information will have an additional effect on incumbent party support. It is as though every piece of bad news reinforces what voters have previously heard. (Green & Jennings Reference Green and Jennings2016: 184)
Green and Jennings’ argument offers a solution to the key challenge when explaining the cost of ruling. Government vote loss is fairly constant across contexts but at the same time steadily increasing during tenure, although with some predictable exceptions related to campaigns and honeymoon periods (cf. Green & Jennings Reference Green and Jennings2016). What is needed in order to explain the nearly universal presence of incumbency costs and the continuous increase of vote loss during tenure is an equally universal and equally rising phenomenon that relates to policy responsibility. Given the importance of media in political life, the time seems ripe for the idea that news information could provide what the literature has been lacking thus far – namely an explanation of the cost of ruling that also finds empirical support.
Negative news, accumulated grievance and governing costs
There are three steps involved in linking news coverage to the cost‐of‐ruling phenomenon: We need to substantiate that news tone (1) influences vote intention, (2) relates to policy responsibility and (3) is generally more negative than positive, providing the basis for an accumulation of grievances.
The influence of news tone on vote intention
Developments like the decline of party membership, end of the party press, and the increasing spread and use of different communication media mean that contemporary media institutions are the most important sources of information and channels of communication between the public and political sphere (cf. Mazzoleni & Schulz Reference Mazzoleni and Schulz1999; Strömbäck Reference Strömbäck2008; Esser & Strömbäck Reference Esser and Strömbäck2014). Combined with the increasing tendency of voters to switch parties, the role of media in explanations of vote choice would seem to warrant considerable research attention.
As mentioned above, the role of media has received attention in the extensive literature on the influence of the economy on government popularity and the VP function. In the literature on issue ownership, which is ultimately concerned with vote choice, recent examples of media influence on vote choice can also be found. The news coverage of issues owned by a given party can increase voter support for that party (Thesen et al. Reference Thesen, Mortensen and Green‐Pedersen2017; Ansolabere & Iyengar Reference Ansolabehere and Iyengar1994; Beyer et al. Reference Beyer, Knutsen and Rasch2014; Boomgaarden & Vliegenhart Reference Boomgaarden and Vliegenthart2007; Walgrave & De Swert Reference Walgrave and De Swert2004). Given that previous research relates the tone of media coverage to the public's vote (cf. Hopmann et al. Reference Hopmann, Vliegenthart, De Vreese and Albæk2010; Kleinnijenhuis et al. Reference Kleinnijenhuis, Van Hoof, Oegema and De Ridder2007; Brody Reference Brody1991; Joslyn & Ceccoli Reference Joslyn and Ceccoli1996; Zaller Reference Zaller, Mutz, Sniderman and Brody1996), the assumption that news tone also would influence the cost of ruling seems reasonable.
News tone and policy responsibility
The second step when turning from vote choice in general to a specific emphasis on incumbent vote losses is to substantiate that news tone relates to the policy responsibility of incumbents and that it does so in a negative or critical way. Perspectives and research on news value theory constitute a natural starting point in this regard. A set of values exists among journalists that specifies several properties of an event that increase its ‘newsworthiness’ (Harcup & O'Neill Reference Harcup and O'Neill2001; Shoemaker Reference Shoemaker2006). The combination of the two news values of elite status/power and negativity clearly establishes a potential link between news tone and the electoral costs of governing. Regarding the latter value – negativity – the implication is that negative news and a disproportionate focus on societal problems or failures dominate the media (Soroka Reference Soroka2012).
Regarding the former value – elite status/power – a number of studies across different national contexts find that incumbents receive more media coverage than challengers (Semetko Reference Semetko1996; Hopmann et al. Reference Hopmann, De Vreese and Albæk2011). Incumbents’ decisions can affect nearly all aspects of society, which increases their relevance as objects of news coverage. In a recent study of the so‐called ‘incumbency bonus’, Green‐Pedersen et al. (Reference Green‐Pedersen, Mortensen and Thesen2017) argue that the media prominence of government actors is inextricably linked to the watchdog role of the media and the burden of being held responsible for all kinds of problems. In other words, contrary to what the concept implies, the incumbency bonus should not cause an electoral bonus but rather constitute a liability for the government. Rose and Mackie (Reference Rose, Mackie, Daalder and Mair1983) describe the inevitable unpopularity that accompanies office:
In so far as a governing party is human, it will make mistakes. In so far as it is visible, its mistakes will be well publicized. In so far as it is responsible for all that is done by government, it will be identified with all the shortcomings of its administration, and with all the problems of a nation, whether or not its policies are contributing causes or even mitigating ones. (Rose & Mackie Reference Rose, Mackie, Daalder and Mair1983: 119)
Thus, we argue that news tone in general, even when it does not explicitly address government performance, matters to incumbent support. This is because news stories provide information about the nature and development of problems in society which, together with direct and explicit information about government performance, in turn is used when passing judgement on incumbents.
The news tone is more negative than positive
Third, and finally, if the amount and tone of news should contribute to explaining the steadily increasing vote loss of governments during tenure, it would require that the dominance of negative over positive news is relatively stable over time. Should this be the case and given that news is stored in voter memory (Green & Jennings Reference Green and Jennings2016: 138–139), the result is that the asymmetry increases steadily during tenure. We provide empirical support for this assumption in the following, showing that while some news stories are obviously positive, the news agenda as a whole is always more negative than positive from the incumbent's point of view.
Combining the pieces: Bad news accumulation and vote loss
Based on the above discussion, we find it promising to think of the cost of ruling as a result of two separate processes in political communication. First, a grievance asymmetry or negativity bias in the information environment of voters, ensuring a dominance of negative frames and perspectives from the point of view of government. Second, a grievance accumulation whereby negative information – all the explicit mishandling, scandals and mistakes or simply just the unfortunate events and developments outside government control – is stored in an ever‐growing stock of memories that pushes more and more voters away from the incumbents.
We frame this as a push process through which voters are mainly disappointed by incumbents rather than attracted to challengers. Naturally, however, there are also pull elements at play simultaneously, often merely reflecting different sides of the same coin. In other words, the electoral disadvantages of officeholders have their counterparts in the strategic advantages enjoyed by the opposition (Rose & Mackie Reference Rose, Mackie, Daalder and Mair1983: 119–121). Unlike governing parties, the reliability of opposition parties is not severely tested. Or in the words of Nannestad and Paldam (Reference Nannestad and Paldam1999: 11), the ‘true policy, Z’ parameter, which voters need in order to pass judgement on parties, becomes distant from a rational perspective where performance is key. As already mentioned, it is easy to offer enticements when, for the moment, they are merely ideas that need not be negotiated into a budget or a detailed and concrete policy. Furthermore, opposition parties will usually avoid the same level of critical media attention to which government is subjected (Green‐Pedersen et al. Reference Green‐Pedersen, Mortensen and Thesen2017).
In light of the existing literature, our idea builds on and explicitly examines some of the underlying theoretical arguments about what causes performance evaluations (and thus incumbent support) to exhibit a steady decrease (Green & Jennings Reference Green and Jennings2016). Furthermore, our argument provides exactly the cumulative function missing in the grievance asymmetry theory (Wlezien Reference Wlezien2016). A constant stream of ‘bad memories’ to the public results in an ever‐increasing congestion of mistakes, scandals and negative developments that increases the cost of ruling steadily throughout the duration of tenure. The micro‐level foundation underlying this mechanism is strongly related to theories of retrospective economic voting and memory studies in political psychology. The former strand of research documents the importance of prior economic developments to voting behaviour (cf. Duch & Stevenson Reference Duch and Stevenson2008). Retrospective voting has also been identified in non‐economic areas (see an overview in Healy & Malhotra Reference Healy and Malhotra2013), which supports our general and broad application of this assumption. The latter strand of research argues that memory cannot be ignored as a facilitator of vote choice (cf. Lau & Redlawsk Reference Lau and Redlawsk2006), showing, for instance, that emotion and negative stimuli have a positive effect on recall (cf. Kensinger & Corkin Reference Kensinger and Corkin2003). While grievance asymmetry (see above) is certainly also relevant here, note that we do not have to make any assumptions about how voters weight positive and negative information – even though this would not work against the theory but rather reinforce the mechanism. Instead of relying on a deep parameter of human behaviour, we ‘externalise’ the grievance asymmetry; or rather, the negativity bias inherent to human behaviour also shapes news institutions and news content, which in turn exert a steady, negative influence on voter evaluations of government.
Summing up, our main expectation is an accumulation effect: Governments gradually lose voters over the course of tenure because grievances accumulate in the shape of negative news. However, in the empirical analysis we also evaluate three alternative media effects consistent with the general argument about news tone as a driver of government vote loss. The first is a cost‐of‐ruling effect stemming from day‐to‐day media coverage becoming increasingly negative during government tenure. The second is the straightforward expectation that it is day‐to‐day news negativity (not the accumulation of bad news) that drives the cost of ruling. Finally, the third alternative explanation is that bad news coverage possibly has a stronger impact as tenure increases, regardless of whether news actually gets worse over tenure.
Research design and data
When examining the link between news tone and the cost of ruling, we make use of a comprehensive dataset combining monthly opinion polls with daily news coverage from 1984–2003 in Denmark. Similar to most European proportional representation systems, Denmark has a multiparty system. Party competition in Denmark is nevertheless characterised by two blocs of parties – one on the left, the other on the right – providing clear government alternatives (Green‐Pedersen & Thomsen Reference Green‐Pedersen and Thomsen2005). This is, of course, a simplification of the dynamics of the Danish multiparty system, but also a reminder that our study bears relevance for similar multiparty systems and the two‐party context.
That said, there are institutional characteristics that affect the clarity of responsibility in a political system and which therefore possibly matter to the cost of ruling (Powell & Whitten Reference Powell and Whitten1993; Palmer & Whitten Reference Palmer, Whitten, Dorussen and Taylor2002; Wlezien Reference Wlezien2016). The attribution of responsibility is made easier by the type of direct control over policy offered in a parliamentary system such as Denmark. Conversely, a high number of parties, strong opposition influence and, most importantly, frequent multiparty minority coalitions – often with no dominant party at the median – work in the opposite direction (Gallagher et al. Reference Gallagher, Laver and Mair2006; Schofield Reference Schofield1995; Heidar & Rasch Reference Heidar, Rasch and Knutsen2017). In addition, although Denmark is a unitary state, much of the implementation of especially welfare policies is decentralised to the local and regional levels of government, just as European Union regulation also affects Denmark and thus also limits the clarity of responsibility. Overall, then, Denmark should in theory be a relatively hard case when identifying the cost‐of‐ruling phenomenon given that a number of institutional features make policy responsibility less concentrated and visible. We return to this question in the conclusion in light of the empirical results.
With respect to the news media, Denmark is a typical example of Hallin and Mancini's (Reference Hallin and Mancini2004) democratic corporatist media system (Allern & Blach‐Ørsten Reference Allern and Blach‐Ørsten2011). Yet the theoretical argument of this article is very general, suggesting that the scope of the findings should not be restricted to the context of northern Europe. Different media systems generally fulfil the two key assumptions of our argument: Politics is mediatised in the sense that voters receive their information about performance and policies from the media, as noted above (Strömbäck Reference Strömbäck2008), and news content is largely negative (Soroka 2014). Obviously, the tone of news might differ across systems due to, for instance, variations in the strength of public service broadcasting and the degree of commercialisation and competition in the media market, as documented by Esser et al. (Reference Esser, Engesser, Matthes, Berganza, de Vreese, Esser and Hopmann2017). Nevertheless, from the perspective of our case selection, the most important aspect is that ‘the evidence of negativity across countries is a consequence of a certain universality in the negativity bias, for humans, and for journalists as well’ (Soroka Reference Soroka2014: 94). We therefore argue that our assumptions and explanations most likely should translate rather easily to other media systems.
Measuring the dependent variable
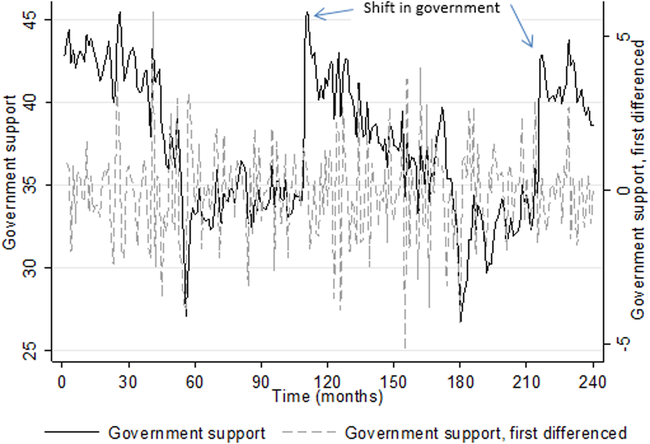
The dependent variable – government support – was measured using data on party support for the period from 1984–2003, based on monthly Gallup surveys.Footnote 2 For each month, the vote intentions for parties in office were aggregated, thereby forming the dependent variable of monthly vote intention for incumbents. In other words, we do not use electoral results as a measure of the cost of ruling, but instead make use of polls to capture the continuous development of electoral sentiment between elections (Jennings & Wlezien Reference Jennings and Wlezien2016). Figure 1 shows the over‐time development in both absolute support for government parties as well as month‐to‐month changes in support.
Government support, level and first‐differenced, Denmark, 1984–2003. [Color figure can be viewed at wileyonlinelibrary.com]

Opinion polls are not election results, and one could imagine either that the cost of ruling is the result of a campaign dynamic or that the government is able to regain during the campaign what is lost in everyday politics. As shown by Jennings and Wlezien (Reference Jennings and Wlezien2016), however, polls are a strong predictor of election results and increasingly so when the polls are close in time to the election. To exclude the possibility that the cost of ruling first of all relates to campaign dynamics, we compared the vote intention from the start of each campaign with the final vote, finding no consistent pattern.Footnote 3 Consequently, if we are to better understand governing costs, we must look beyond campaigns and elections.
Measuring the main independent variable
The news tone is measured drawing on data from Danish radio news in the period 1984–2003. The radio news was produced by the Danish Broadcasting Corporation (DR), which in this period enjoyed a de facto monopoly on broadcasting radio news and had an audience of approximately one million listeners in a country with some five million citizens. From the perspective of other news sources and those not listening to radio news, studies of the Danish media system have found these broadcasts to be an important link between the agenda of morning papers and evening television news (Lund Reference Lund2002). The DR broadcasts are therefore arguably a sound and efficient means by which to measure the news content experienced by the Danish electorate during the period of investigation. Moreover, the Danish radio news broadcasts have never been seen as having a particular party‐political colour, which probably reflects the limited tradition for ‘self‐made’ stories. The news database contains all of the features from the long version of the daily radio news broadcast at noon (just over 58,000 items). The noon broadcast was typically considered the most important due to its impact on television news later in the day, and it had the most listeners.
The news tone of each feature was coded. As discussed in the introduction, this article is based on a political understanding of news tone. By this we mean whether the news is good or bad from the incumbent's perspective. The reason is that we study news tone in order to explain the cost of ruling as opposed to examining whether or not the media portray ‘reality’ in a way that is negatively biased (e.g., Soroka Reference Soroka2012). While there are obviously different sources of negativity in the news, we are neither interested in nor able to distinguish them in the current study.
To operationalise the idea of the news tone from a political perspective, the tone of each news feature was coded into four categories: neutral, negative, positive or un‐codable. The coding was based on short resumes of the news features.Footnote 4 Some of these resumes were simply too short to code the tone, which was then categorised as ‘un‐codable’. The main coding rule reflects our distinct political perspective on media tone, where the news is evaluated on the basis of how it relates to government responsibility and the opposition‐government competition (see examples in Table A1 in the Online Appendix).
Using the viewpoint of government ministers as our starting point, typical negative stories include news about increasing inflation, industry closures, crime, accidents, spread of new diseases and so on. However, stories where the government might be content with a specific policy but nevertheless met by criticism also qualify as bad news. The assumption is that the minister in charge would have preferred different news content or no story at all. Furthermore, the opposition‐versus‐government perspective also means that we have coded internal disagreement within the government, together with media attention to the opposition (unless critical of the opposition), as negative. For the most part, neutral stories cover news that provides a reasonably balanced portrayal of an issue, such as highlighting both something negative and something positive. However, news that does not communicate any clear evaluation or that is lacking relevance to politics has also been coded as neutral. The central point is that the judgement on the tone of the news is based on a political perspective on media‐politics relations: Is this news feature good, bad or neutral for the incumbent government (Green‐Pedersen et al. Reference Green‐Pedersen, Mortensen and Thesen2017)?Footnote 5
It is also important to emphasise that our coding of news tone is not limited to stories in which government actors are explicitly mentioned. Although news stories that, for instance, blame incumbents are clearly negative (and coded accordingly), our argument is also built on the assumption that policy responsibility links government actors to societal developments – even when they themselves do not figure in the news.Footnote 6 In other words, news about industry closures, environmental disasters, crime waves and so on are coded negative, even without any government presence in the respective stories.
Note that we included some additional layers in the coding to get closer to our theoretical variable. For instance, when the news item attributes blame or criticism to a previous government, this would not be coded as a negative news item. Furthermore, if a news story contains government criticism but the criticism is re‐directed or countered by a third party, the item would not be coded as negative. On the other hand, if the criticism is redirected or answered only by the incumbents themselves, then it has been registered as negative. The latter coding rule reflects the assumption that incumbents will (almost) always meet negative news with blame‐shifting or blame‐avoidance statements, but such statements are nevertheless responses that do not remove the initial negative attention (see also Hood et al. Reference Hood, Jennings, Dixon, Hogwood and Beeston2009).Footnote 7
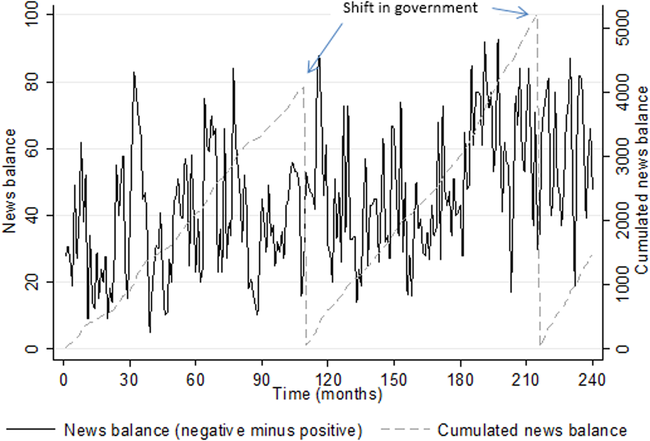
All of the analyses reported below have been performed on a dataset where the news features were aggregated into monthly observations, summing to a total of 240 months in the 20‐year period (see Table A2 in the Online Appendix for descriptions of news tone and Figure A1 for the distribution of stories over time). Our measure of news tone is simply based on first subtracting the amount of negative news in a given month from the amount of positive news in the same month. This arguably constitutes a valid measure of the theoretical argument as it relates directly to the balance between negative and positive news images while at the same time capturing the extent of the negativity bias. Next, in order to capture the idea about accumulated news asymmetry or grievances, the news tone balance or asymmetry is summed consecutively (as a running tally) for every month the incumbent has been in office. Figure 2 shows both the month‐to‐month variation in the news balance measure as well as the cumulated news balance measure. As seen in the figure, the size of the negativity bias varies from month to month, but the general pattern is clearly one of an overweight of negative news, as also implied by the accumulation of negative news.
News tone balance, month by month and cumulated, Denmark, 1984–2003. [Color figure can be viewed at wileyonlinelibrary.com]

There is a statistically significant difference between the mean news tone during the two centre‐right governments and the single centre‐left government in this period (results not shown). But this difference disappears when controlling for the slight increase in negativity over time (noticeable in Figure 2). Furthermore, government colour is unrelated to our dependent variable of interest – the change in vote intention for governing parties – and we find no significant interaction between news tone and government colour when explaining government support in the polls. We have, therefore, not included government colour in the analyses below. Future work (i.e., comparative studies that cover more cabinets) should hopefully have enough degrees of freedom to investigate potential differences between cabinets.
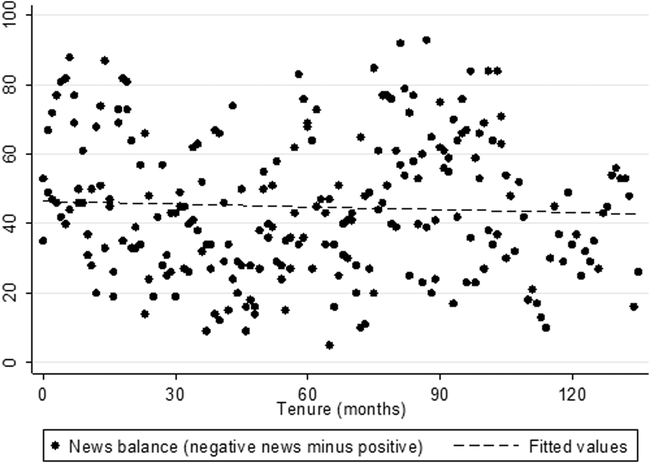
Figure 3 does not provide support for our first potential alternative explanation of the cost‐of‐ruling phenomenon – namely that the month‐to‐month news balance simply becomes more negative with tenure. When examining the news balance‐tenure relationship, there is no clear pattern (Pearson's R of –0.05, not statistically significant). Consequently, the linear fit between tenure and month‐to‐month news balance is nearly flat.
News balance (non‐cumulated) across tenure, scatterplot with linear fit, Denmark, 1984–2003.

Defining length of tenure comes with some challenges as what constitutes a new government is not beyond discussion. In the following, we define a ‘shift of government’ as when power shifts from one bloc of parties to another. In practice, in the period under investigation, this implies that a shift of government requires a new prime minister and a new prime ministerial party. It does not count as a change in government when the same government continues after an election or when a small party leaves or enters the ruling coalition. The argument behind this operationalisation is that the colour of the government and the prime minister is what voters see as the most important traits of a Danish government. Based on this definition, the period under investigation has seen three governments: the centre‐right government of Conservative Poul Schlüter in 1982–1993; the centre‐left government of Social Democrat Poul Nyrup Rasmussen in 1993–2001; and the centre‐right government of Liberal Anders Fogh Rasmussen in 2001–2009.
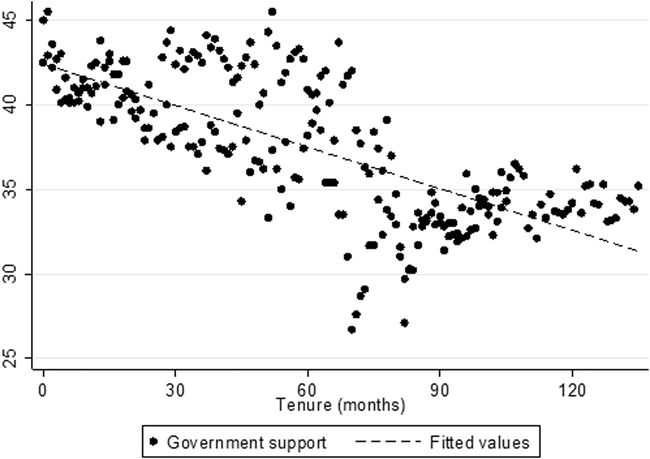
More particularly, the variable that identifies length of tenure in our models is measured as the number of months a government has occupied office. In those instances where a government continues after an election, the tenure variable keeps counting the months in office. Plotting vote intention for government against the length of tenure, Figure 4 shows that there is in fact a cost of ruling in the data used for the following analyses. Support declines steadily as tenure increases, and the linear prediction plot is fit with an R2 of 0.41.
Government support across tenure, scatterplot with linear fit, Denmark, 1984–2003.

Control variables
It is well‐established that a weak economy may lower support for the incumbent government. The effect of economic conditions on government support is measured using the Organisation for Economic Cooperation and Development's Composite Leading Indicator (CLI), which builds on a wide range of key, short‐term economic indicators.Footnote 8 The CLI is a times‐series consisting of several indicators revealing a consistent relationship with a reference series (e.g., industrial production, gross domestic product) at turning points. It provides qualitative information on short‐term economic movements, especially at the turning points, meaning that its main message is the increase or decrease rather than the amplitude of the changes.
To control for the change in government support caused by parties entering or leaving the government coalition between elections, we include a dummy variable identifying such events. Furthermore, in the Danish case, the over‐time decline in support for the government shown in Figure 3 is also found in elections results. Thesen (Reference Thesen2016) shows that the cost of ruling in Danish elections from 1981 to 2014 totals 2.1 percentage points on the government level and 0.8 percentage points per governing party. Finally, to account for the cyclical patterns identified in the literature on VP functions, we distinguish campaigns and honeymoon periods using two dummy variables that are given the value 1 in, respectively, the month of the election and the month prior to election (campaign); and the three months following the month of the election (honeymoon).Footnote 9
Statistical model specification
We test our argument using a series of error correction models, which have been chosen for several reasons. First, the central variables in the analysis are non‐stationary. That government support trends downwards over time is exactly what cost‐of‐ruling theory predicts and is empirically corroborated by Figure 4 and additional tests based on the Augmented Dickey‐Fuller approach (see Table A3 in the Online Appendix). By construction, the tenure variable has a deterministic time trend with breaks for those months where the government shifts from one bloc of parties to the other. Given the systematic overweight of negative news, the cumulated measure of news coverage clearly follows a stochastic trend over time with breaks similar to the tenure variable (see Figure 2 and test statistics reported in Table A3 in the Online Appendix).
In fact, Engle‐Granger co‐integration tests indicate that the series are co‐integrated, meaning that a long‐run equilibrium may exist between the series and deviations from this equilibrium are stationary. Though the application of the error correction model is not restricted to the study of co‐integrated series, it is a recommended and standard solution in this case (see De Boef & Keele Reference De Boef and Keele2008). When studying the cost of ruling, we are dealing with phenomena that are unusually invariant: governments lose support and negative news outweighs positive news. This results in closely matching trends, which complicates the attempts at causal modelling; however, applying an error correction model where the dependent variable has been first‐differenced alleviates these concerns.
An additional advantage of the error correction model is the ability to estimate both short‐ and long‐run effects, which is attractive given that theory does not provide guidance on how quickly voter support may respond to media coverage. Furthermore, the inclusion of differenced time‐series (month‐to‐month changes) reduces the noise that may stem from changes in government compositions, where a party may either enter or leave a coalition without provoking the election of a new government. Given that we measure government support as the sum of vote intentions for the parties in government, such changes in the government coalition may automatically influence the level of support for government parties but not necessarily the month‐to‐month changes in government support.
The error correction model has the following generic form:

Where ∆yt in this case represents change in government support from one month to the next, Χ is a vector of the explanatory variables discussed above, with subscript j referring to the particular explanatory variable, α0 is the intercept, α1 is the so‐called ‘error correction rate’ and ε is the disturbance term. The immediate, short‐term impact of news would be given by the coefficient of the first‐differenced variable (β0) and by the coefficient of the lagged minus the first‐differenced variable (β1 – β0). The long‐run multiplier (LRM) is an important quantity of the error correction model, allowing us to estimate the total effect of X distributed over future time periods. LRM is calculated by dividing the coefficient of the lagged variable (β1) by the error correction rate, which is the coefficient of the lagged dependent variable measured as levels – that is, β1/α1. To estimate long‐run effects, the LRM could then be multiplied with any given change in the value of X. In line with most applications of the error correction model, we do not difference the dummy variables discussed above.
Findings
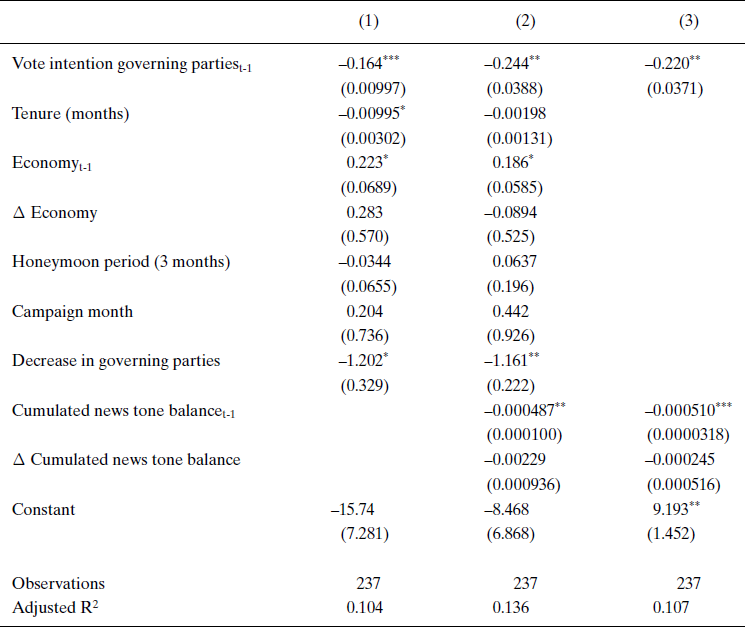
Table 1 presents our main findings. The stepwise modelling procedure reflects our attempt to explore the cost of ruling by examining the relationships between incumbent support, length of tenure and cumulated news tone. The logic is that if the relationship between tenure and government support disappears when introducing the cumulated news balance variables, then this suggests that the relationship between tenure and government support is (at least partly) due to cumulated news balance. Thus, we begin by establishing the well‐known negative effect of tenure on government support in model 1 before adding our news tone variable. In model 2 we then add the news tone variable to see whether: (1) there is an effect of news tone on vote intention for governing parties; and (2) if the inclusion of media coverage reduces/removes the direct effect of tenure.
Error correction model explaining vote intention for government, monthly data, Denmark, 1984–2003

Notes: Robust (clustered) standard errors in parentheses. *p < 0.10; **p < 0.05; ***p < 0.01. Dependent variable is ∆ vote intention for governing parties.
The results provide positive answers to both of these questions, as elaborated upon below, indicating support for the argument that the accumulation of bad news is an important explanation of the cost‐of‐ruling phenomenon. In model 2 in Table 1, we see that the lagged dependent variable is negative and statistically significant, which indicates how the error correction model as expected captures disruptions to the equilibrium relationship between government support and our explanatory variables. The process of re‐equilibration, whereby government support is adjusted as a result of, for instance, a higher level of cumulated news negativity, is not immediate but occurs over future time periods at a rate dictated by the lagged dependent variable. The largest part of the movement in voter support will occur in the first month, where nearly 25 per cent (0.244) of the shift will take place, while the rest manifests itself gradually over the following months.
The cumulated news tone balance is of greater theoretical interest to us, however, and we will present the results from the perspective of the two questions above. First, we do find that news tone affects government support. This does not stem from any immediate or short‐run effect, as the coefficient of the first differenced cumulated news variable is statistically insignificant. However, the lagged cumulated news variable is clearly significant and negatively signed as expected. These results provide support for our accumulation expectation and at the same time weaken the second alternative explanation from the theory section: that the cost of ruling is simply a result of month‐to‐month changes in the tone of the news.Footnote 10
Interpreting the long‐term effect involves calculating the LRM, which we find is –0.002 (lagged coefficient/lagged dependent variable = 0.000487/0.244 = 0.002). This means that for two governments with the same length of tenure and similar economic conditions, a difference in the cumulated news tone balance of 455 (one‐third of a standard deviation) will eventually increase the gap in their support levels by nearly 1 percentage point (0.91). Admittedly, a large part of this effect – 0.22 percentage points, corresponding to the error correction rate of nearly 25 per cent (0.91 × 0.244) – manifests itself in the first month. A standard deviation rise in cumulated negative news, a sizeable but still not extreme increase, adds up to a 2.7 percentage point drop in government support.
In model 1 in Table 1, we notice the expected negatively signed effect of government tenure, clearly corroborating the basic expectation derived from the cost‐of‐ruling literature. After controlling for economic developments and government support in the previous month, Danish governments lose a quarter of a percentage point for every two years they are in power. Moving on to model 2 in Table 1, the first thing to notice is that this effect vanishes. The inclusion of the cumulated media variable leaves the tenure coefficient substantially lower and statistically insignificant. We interpret this as a sign of mediation; or, more precisely, as a specification of why increased tenure reduces government support: because negative news images accumulate over time.
Keep in mind that the results are obtained while taking into account the autoregressive component in government support, economic developments and other control variables. A closer look at the coefficient of the economic variable reveals a positive and statistically significant effect, as the literature on the economic vote and VP functions would predict. The estimated effects of the ‘Honeymoon’ and ‘Campaign’ variables are insignificant, while a reduction in the number of governing parties has the expected negative effect.Footnote 11 More relevant from the perspective of our research question is the fact that the inclusion of control variables does not substantially alter the estimated effect of news tone on vote intention for governing parties. As can be witnessed in model 3 in Table 1, the cumulated news asymmetry effect is just marginally stronger in a reduced model containing only the autoregressive term.
Diagnostic tests revealed the presence of heteroscedasticity (Breusch‐Pagan/Cook‐Weisberg test, p > 0.0074), and, thus, the models reported above use clustered standard errors. Furthermore, a leverage‐versus‐residual squared plot showed that four observations have high leverage but very small residuals (indicating that they do not bias the estimate), and four observations have high residuals but very low leverage (indicating that they have very little influence on the overall regression estimates).Footnote 12
We have run several additional models to test the robustness of the models reported above. Table A4 in the Online Appendix illustrates that our findings on the accumulated news grievances mechanism are stable across different specifications. In the first model, we have operationalised the cumulated news effect in an alternative way in order to reduce the trend in this variable. We do so by accumulating the ratio of negative to positive news – a measure which is not by default linked to the total number of news stories in a given month.
In the second and third models in Table A4 in the Online Appendix, we drop the autoregressive component and identify the news accumulation effect using level of (instead of changes in) government vote intention as the dependent variable. The fourth model in Table A4 tests an operationalisation of the cumulated news tone balance, where distant news is de‐emphasised at the expense of greater weight on the last 12 months. Specifically, this is related to discussions in the field of retrospective economic voting, where recent experiments find that voters substitute the end (i.e., election‐year) for the whole (i.e., full term) (Healy & Lenz Reference Healy and Lenz2014). In line with these findings, we see that the cumulated news effect is in fact stronger when accounting for the so‐called ‘end heuristics’. The fifth model in Table A4 evaluates our third alternative explanation for the news‐driven cost‐of‐ruling effect: that news tone simply has a stronger impact on government support as tenure increases. This translates to an interaction effect between month‐to‐month news balance (equal to the first‐differenced cumulated news balance) and tenure, which does not receive support in our models. Finally, model 6 in Table A4 illustrates how the main results of the article are reproduced when using unemployment instead of economic developments as a control variable.
Conclusion
We have argued that news content, by providing voters with a constant stream of negative images from the point of view of government, offers a plausible answer to the question of why ‘winners are losers’. Studying the relationship between the asymmetric news tone and vote intention for incumbents on a monthly basis over 20 years in Denmark, we find support for this claim. While there is no indication of a short‐run news tone effect, where changes in news negativity from one month to the next affect government support, there is a long‐run equilibrium between government support and cumulated news images; and when negativity accumulates, government support gradually readjusts to a lower level. Thus, there is strong evidence to support the main argument of the article: that news negativity accumulates during incumbency, thereby pushing away a steadily increasing number of voters.
The theoretical perspectives and empirical results fit nicely into existing research, making use of previously untested assumptions. Other studies have hinted at the role of news media but have not developed or tested the argument. The most elaborate studies come from the literature on vote and popularity functions, but this literature only focuses on the economy, not the entire issue agenda. Yet with its focus on cyclical patterns in government support, it does point to questions that would be highly relevant to investigate further. One would be the role of election campaigns. This article has argued that the cost of ruling is the result of what happens between elections. An open question is whether election campaigns systematically dampen or increase the losses that the government has incurred since the last election. In our view, this research track is worth pursuing further.
Furthermore, we have only examined one country. Although we argue that our assumptions and explanations are general in scope, matching the near universal existence of governing costs as well as the negative and critical character of political news in democratic societies, comparative approaches are obviously needed to assess this. In the above, we pointed to Denmark being a relatively hard case for identifying the cost of ruling as factors such as minority governments and decentralisation blur the clarity of responsibility. Yet there is an obvious need for more comparative work on the cost of ruling. Having identified a basic mechanism – cumulated negative news coverage – provides a better theoretical underpinning for comparative work. We need to understand how different political institutions affect this mechanism. Although there are similarities between two‐party systems and bloc‐based competition in a multiparty system, studies consistently find that voter movements vary across electoral systems (cf. Dassonneville & Hooghe Reference Dassonneville and Hooghe2011). Even within a multiparty context, different practices of executive power‐sharing matter. For instance, Hjermitslev (Reference Hjermitslev2018) recently showed that junior partners in coalition governments are particularly hit by the cost of ruling. This raises important questions about how voters attribute negative news to different coalition partners.
Another comparative question relates to different media systems. As argued above, Denmark is an example of the corporatist media system, and the Danish radio news was a good proxy for the entire media agenda in the period studied. However, the media dynamics might be quite different in the countries of southern Europe, for instance, where political parallelism is stronger and public broadcasters have been found to report in less negative ways (Esser et al. Reference Esser, Engesser, Matthes, Berganza, de Vreese, Esser and Hopmann2017: 89). Based on the findings of this article, such differences are likely to affect the cost of ruling.
Furthermore, recent developments in media landscapes also raise broader questions about the future outlook of news influence on incumbent support. As argued by Green‐Pedersen et al. (Reference Green‐Pedersen, Mortensen and Thesen2017), the negative focus in the news, from a government perspective, is tightly linked to the idea of critical journalism. In other words, the development of news institutions, news values and the journalistic role will likely affect the extent to which news content exhibits a negativity bias from the perspective of governing parties. Time has passed since the end of our period of investigation. Meanwhile, social media and online news have rapidly changed media landscapes. Although traditional news sources are still important agenda‐setters, it is nevertheless an open question how these changes will impact the way in which news affects the cost of ruling. To the extent that the critical journalism generating a negative news tone from an incumbent perspective is under pressure, costs of governing might look different in the near future.
Acknowledgements
We would like to thank Christopher Wlezien, Jane Green, Michael Lewis‐Beck and Jason Eichorst for thorough and constructive advice at crucial stages in the work on this article. Earlier versions have also been presented at the 2016 annual conference of the Comparative Policy Agendas project in Geneva and the APSA 2018 conference in Boston, MA. Thanks to discussants and other attendants for helpful feedback. Finally, we thank the three anonymous referees and the editors for valuable comments and advice.
Online Appendix
Additional information and analysis may be found online in the Online Appendix at the end of the article:
Table A1. Examples of positive, negative and neutral news stories
Table A2. Descriptives of news tone (positive, negative, neutral and uncodeable stories)
Table A3. Fisher‐type unit‐root test (trend included). Null hypothesis: all panels contain unit roots
Table A4. Alternative specifications of the news accumulation effect. Model 1, 4 and 5: DV is ∆ vote intention; Model 2 and 3: DV is vote intention
Figure A1. Number of radio news stories across time, scatterplot with linear prediction, Denmark, 1984‐2003


 Open access