Introduction
High-resolution ice-core records from alpine glaciers provide proxy records for natural and anthropogenic changes in climate and in the environment during intervals of up to thousands of years. Despite apparent extensive spatial coverage of ice-core records in Asia (e.g. from the Himalaya, Tibet, the Tien Shan and the Altai (Central Asian Deep Ice-Coring Project; data: http://www/sci.uidaho.edu/cae/projects/cadip/index.html)), there remains a great need to obtain records from poorly documented parts of the Asian mountain system. One such region, the Pamir mountains, is one of the key regions for studying atmospheric circulation dynamics and changes in terrestrial systems at mid- to low latitudes. The high-elevation snowfields of the Pamirs contain robust records documenting moisture advection into central Asia from the Atlantic and Arctic, dynamics of the westerly jet stream, the Siberian High and Asian monsoon, and natural and anthropogenic environmental change over central Asia. Little information about past climate has been obtained from the Pamirs (Reference ShackletonShackleton and others, 1995; Reference Dodonov, Sheckleton, Zhou, Lomov and FinaevDodonov and others, 1999; Reference LiLi and others, 2006) or from central Asia. This, despite the fact that Asia has a long history of diverse civilizations and a high potential for dramatic human impact in the near future, related to demands for land use, water and general social development.
The Pamirs are near the second largest loess-soil deposit in the world, which is in southwest Tajikistan and northwest Afghanistan, while the largest deposit is in northwest China. Given the abundance of atmospheric aerosols in north central Asia, glaciochemical time-series data may provide insight into terrestrial/marine sources, the spatio-temporal extent of central Asian dust outbreaks and their potential impacts on climate. Concentrations of major elements and rare elements in snow and ice can be used to infer the location of sources of aerosols.
A team from the University of Idaho (UI) and the Climate Change Institute at the University of Maine (CCI UM) conducted reconnaissance on Fedchenko glacier during the summer of 2005. The primary purpose of our study was to identify and calibrate the physical links controlling the modern climate and atmospheric aerosol concentration signals preserved in the cores and to determine the location of a prospective deep drilling site from which to recover long-term paleoclimatic records potentially to 1000 m depth.
Study Region
Fedchenko glacier (Fig. 1) is one of the largest alpine dendrite glaciers in the mid–subtropical latitudes of the Northern Hemisphere (38°15′ N, 72°15′ E). It has a total area of 649 km2, a length of 77 km, an elevation of 2900–6300 m a.s.l., and an equilibrium-line altitude at 4700 m a.s.l. (Reference Dolgushin and OsipovaDolgushin and Osipova, 1989). According to seismic and gravitational surveys conducted during the International Geophysical Year (1957/58) (Reference Berzon, Pak and YakovlevBerzon and others, 1962), the thickness of the glacier varies from 250 m at the glacier tongue to 800 m in the middle part of the glacier at 4000 m a.s.l. At 5000 m a.s.l., the thickness reaches 1000 m, offering a unique opportunity to recover the deepest ice cores outside of the polar regions.
Location map of Fedchenko glacier, Pamir mountains, central Asia.

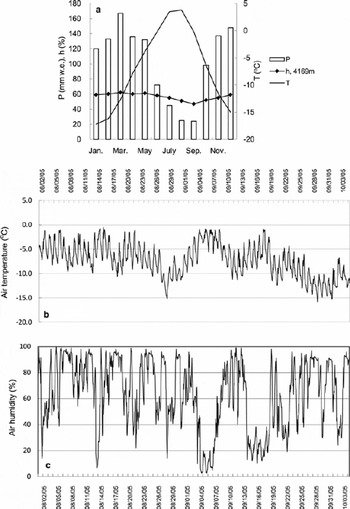
The Asian interior is a dynamically complex region, and assessing the main atmospheric circulation patterns over western central Asia is a challenging problem. The main moisture to the region comes with the westerlies, south-western cyclones and sometimes with Indian monsoons. Unlike precipitation in the Himalaya, Tibet, the central and eastern Tien Shan, or the Altai, precipitation in the Pamirs is greatest during the winter and spring (Fig. 2), because of the relieved impact of the Siberian/Tibetan high-pressure systems during winter. Summer and autumn are dry seasons over southwestern central Asia. Seasonal distribution of relative humidity is inversely related to air temperature, more typical for the subtropical (tropical) areas where the absolute humidity is not a strong function of air temperature but rather of vertical convection. Although rare, in June and July the Indian monsoons may reach the Pamirs as, typically, individual 2–3 day intrusions with heavy precipitation at the southern and eastern border, and they probably can reach the central Pamirs (Reference ZabirovZabirov, 1955; Reference AgahanyancAgahanyanc, 1965; Arushev and others, 1976; Reference Demchenko, Medvedev and FinaevDemchenko and others, 1985). The trace of the Indian monsoon over the Pamirs and its impact on the central Pamirs is still questionable.
(a) Monthly distribution of air temperature T, precipitation P and relative humidity h at Fedchenko station (4169 m a.s.l.). (b, c) Hourly air temperature (b) and relative humidity (c) measured at Fedchenko glacier by AWS (5420 m a.s.l.). Date format is month/day/year.
The main synoptic processes over central Asia were identified based on the 14 types of macro-synoptic processes developed in central Asia (Reference Bugaev, Dzordzio and KozikBugaev and others, 1957; Reference Subbotina, Muminova and InagamovaSubbotina 1995). This classification was based on the probability of different synoptic conditions tracking the main troposphere airflows (e.g. cyclonic and anticyclonic flows at the surface and at 500 mbar). The classification was described by Reference Il’inova, Tursunov and EmmIl’inova and others (1965), Reference Barry and PerryBarry and Perry (1973) and Reference Aizen, Aizen, Melack, Kreutz and CecilAizen and others (2004).
In southwestern central Asia, steady high air temperatures and dust storms are a common synoptic process during the warm season. Pamir glaciers are contaminated by dust primarily during the development of thermal depressions (Fig. 3). At the same time, in Tibet, the Himalaya and the Tien Shan, extensive summer precipitation washes aerosols out of the atmosphere.
The main synoptic processes observed during dust-storm development in central Asia: (a) warm half-year; (b) cold half-year. Numbers indicate the synoptic processes as follows, where the percentage frequency of processes is in parentheses, the numerator corresponding to warm, and the denominator to cold half-years: 1. western cold intrusion (16/14); 2. northwestern cold intrusion (13/9); 3. northern cold intrusion (9/4); 4. south Caspian cyclone (3/11); 5. Murgab cyclone (0/31); 6. periphery of anticyclones (26/31); 7. thermal depression (5/0).

Firn-/Ice-Core Sampling, Processing and Analyses
The absence of snow redistribution by avalanches in the large (10 km × 5 km), high-elevation accumulation area of Fedchenko glacier (Fig. 4) provides a favorable environment for the accumulation of undisturbed, horizontal layers of snow. The drilling sites therefore provide a suitable location for the recovery of ice cores and subsequent development of paleoclimatic records. The upper accumulation zone of the glacier is characterized by a gently sloping surface (0–1° inclination) with no specific local conditions (e.g. depression or saddle location). The Fedchenko glacier accumulation area is located at the cold recrystallization zone, where the glacier ice is frozen to the underlying bedrock and glacier velocity is minimal. The glacier ice surface velocity measured between two global positioning system (GPS) surveys in 2005 and 2006 was 1 m a−1 at the proposed deep drilling site at 5206 m a.s.l.
Map of the drilling sites on Fedchenko glacier, summer 2005: (1) 5206 m a.s.l.; (2) 5365 m a.s.l.

During 2005 fieldwork on Fedchenko glacier, snow-pit samples were collected and two shallow snow/firn cores of 12.6 and 9.0 m depth and of 7.5 cm diameter were drilled with a ‘Mini-Felix’ Swiss solar-powered electromechanical drill. The lower drilling site at 5206 m a.s.l. was placed on the leeward slope, while the higher site at 5365 m a.s.l. was set on the windward slope of the vast accumulation area.
Snow samples were collected every 5–10 cm from two 2 m snow pits dug near the drilling sites. The stratigraphy of the snow pits was described in the field (Fig. 5). From stratigraphic analysis of the snow pits and firn cores, we found no sign of water percolation. The ice temperature measured at 9 m depth and at 5206ma.s.l. was −8°C. Summer daytime air temperatures did not exceed −2°C. Winter air temperatures fell to −38°C at 5420 m a.s.l., measured by an automatic weather station (AWS) from 2 August 2005 until 18 February 2006 (Fig. 2b).
(a, b) The snow-/firn-core density and snow accumulation in snow water equivalent (SWE) from the two core sites: 5206 m a.s.l. (a) and 5365 m a.s.l. (b). (c) Stratigraphic profile within the snow pit (5365 m a.s.l.): 1. new and fine-grained snow (1–2 mm); 2. medium-grained snow (2–3 mm); 3. medium- to coarse-grained snow (>3 mm); 4. ice crusts.

Snow samples and firn/ice cores were processed in the base camp (5210 m a.s.l.) for further chemical analyses. Each core section was scraped (10 mm), such that all surface and subsurface contamination from the drilling process was removed. The inner 5 cm diameter cleaned core sections were then cut at 5–12 cm length intervals and were split into three 4 mL Nalgene bottles. The diameter, length and weight of each recovered core section were measured to convert the original snow depths to water equivalent. Snow-pit samples and core sections were packed into insulated shipping containers for transportation. The processed samples were distributed to UI for stable-isotope analyses (δ18O and δD) and to dedicated laboratories at CCI UM and the University of Heidelberg (UH) for analyses of rare earth elements (REE) and other trace elements.
Oxygen isotope ratios were measured using a standard CO2 equilibration technique (Reference CraigCraig, 1957). Hydrogen isotope ratios were measured using Cr reduction in a continuous flow system (Reference Morrison, Brockwell, Merren, Fourel and PhillipsMorrison and others, 2001). Data are reported in standard delta (δ) notation vs Standard Mean Ocean Water (SMOW). The analytical precision for measurements of oxygen and deuterium isotope ratios was ±0.05‰ and ±0.5‰ respectively. Analytic uncertainty in d-excess was 0.52‰.
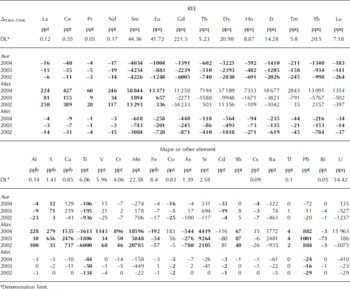
An inductively coupled plasma mass spectrometer (ICP-MS) (Element II ICP-SFMS, Finnigan, Bremen, Germany) at CCI UM was used for the analysis of REE (La, Ce, Pr, Nd, Sm, Eu, Gd, Tb, Dy, Ho, Er, Tm, Yb, Lu), heavy metals (As, Sr, Cd, Sb, Cs, Ba, Tl, Pb, Bi, U) and other elements (Al, S, Ca, Ti,V, Cr, Mn, Fe, Co) (Table 1). The ICP-SFMS generated very high-resolution data (≤0.5 cm), allowing identification of seasonal signals. Trace metal concentrations from the firn cores were obtained at parts per thousand (ppt) levels. Since the instrument detection limit is defined as three times the standard deviation of ten acidified (1% optima HNO3) deionized water samples, the limit varies based on the element analyzed. For a full description of individual instrumental element detection limits, reproducibility based on parallel ice-core section analysis, and results of ice decontamination see Reference Osterberg, Handley, Sneed, Mayewski and KreutzOsterberg and others (2006). The blanks data were used to calculate the method detection limits (3σ) listed in the Appendix (Table 5). An Apex sample introduction system with a 100 μL min−1 uptake was used to take into account spectral interface. The Apex is a desolvating nebulizer similar to that used by Gabrielli and others (2006).
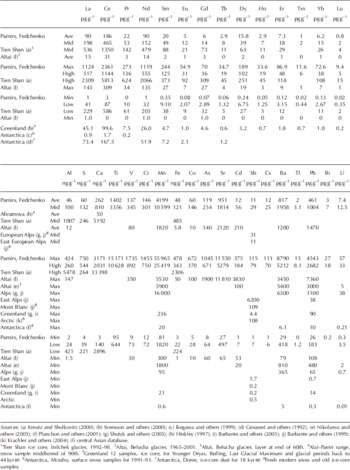
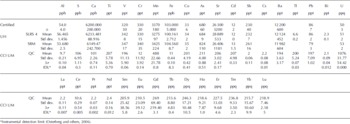
Concentrations of rare earth elements, heavy metals and other elements in snow-/firn-core samples (5365 m a.s.l.) collected in 2005 from the Pamirs and in samples from other compared regions. ‘High’ is mean concentration among samples with dust records >2σ; ‘Mid’ is mean concentration among samples with records 2σ ≥ concentration > σ; ‘Low’ is mean concentration among samples with records Max, Min and Ave are absolute maximum, absolute minimum and average concentration
Samples from two pilot Fedchenko snow/firn cores and snow pits were also analyzed by ICP-MS for concentrations of major and other elements and heavy metals (i.e. As, Rb, Sr, Mo, Ag, Cd, Sb, Ba, Tl, Pb, Bi, U, Na, Mg, Al, Ca, Sc, V, Cr, Mn, Fe, Co, Cu, Zn) at UH. Original samples were analyzed after acidification with high-purity nitric acid to 1% with double sub-boiled HNO3.
To test accuracy, the riverine water reference material SLRS-4 from the National Research Council Canada was analyzed at CCI UM and at UH. The same check standard would exclude any calibration problems. The SLRS-4 is only certified for the elements listed in Table 5, so the quality-control data (QC standards) cover all the elements that were running. QC samples and the SLRS-4 were run for each run, and every 10–15 samples throughout the run to check for drift or other problems. The SLRS-4 is run for accuracy; the QC standard for reproducibility and for calculating overall precision. The results of the calibration through the same check standard were in accordance with the certified values.
Measurement results for concentrations of heavy metals, REEs, major and other (<1 wt.%) elements were similar from both the UH and CCI UM laboratories (Table 2). Comparison of measurements from UH with those from CCI UM shows high correlations (0.70–0.90) and slope close to 1 for all the major dust elements. For calcium, the correlation was slightly lower and with a maximum number of outliers. This could be associated with the distribution of evaporite mineral particles, which showed more variability in the cores than other mineral dust particles (personal communication from E. Osterberg, 2008. Results from the two laboratories for the non-evaporite elements (Al, Fe, Mn, Cr, Co, etc.) generally match well but diverge at concentration peaks. This probably reflects an uneven distribution of particles in the samples. The low-concentration values match almost perfectly, while the peaks sometimes have different values. The variation in slope around 1, i.e. from 0.8 to 1.2, indicates an absence of systematic calibration errors between the CCI UM and UH data.
Across-laboratory correlation of processes for analyses of heavy metals, major and other trace elements. Ave and Ave’ are average concentration of elements from the Pamir pilot snow/firn cores processed in laboratories of the CCI UM and UH respectively, r is the correlation coefficient, a is the slope of the linear relationship between concentrations processed in the two laboratories, and n o is the number of outliers in samples where the discrepancy exceeded mean standard deviation of the concentration differences for an element
Adjustments were made by omitting a record from the analysis when the discrepancy between concentrations from the two laboratories exceeded the average element standard deviation.
For the climatic analysis, we used meteorological data from the Fedchenko meteorological station established in 1932 on a rocky ledge at the center of Fedchenko glacier at 4169 m a.s.l. and an AWS installed at 5420 m a.s.l. near (within 2 km of) the drill site at 5365 m a.s.l. (Fig. 6).
(a) Fedchenko meteorological station and (b) AWS.

Results
Annual accumulation rate
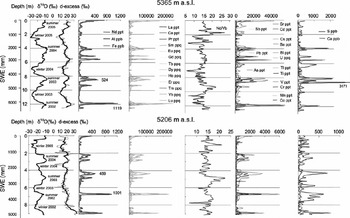
No significant post-depositional effects were apparent in the oxygen/hydrogen records from the firn core. The amplitude of the signal near the bottom of the core was similar to that observed near the surface (Fig. 7). To determine annual snow accumulation layers, we used stable-isotope records and selected geochemical records with existing, well-preserved, seasonal signals (Figs 7 and 14). Identification of annual accumulation layers in the snow/firn core was based on the extreme values of δ18O and δD because minimum winter and maximum summer air temperatures are a distinctive characteristic of the Pamir meteorological regime (Fig. 2a). Distribution of selected major elements and REE presents well-defined seasonal signals that respond to specific seasonal precipitation distribution in the Pamirs. Concentration maxima with distinguishing REE and major-element peaks are related to dry summer seasons. Background values in geochemical records are related to winter and autumn seasons (Figs 7 and 14).
Fedchenko isotopic composition, δ18O and d-excess (bold curve is 5 years smoothed): REE, heavy metal, major elements and trace elements in snow/firn cores at 5365 and 5206 m a.s.l.
Snow and firn–ice densities (Fig. 5a) were used to establish profiles of cumulative depth and accumulation water equivalent. On average from 2002 to 2005, the mean annual accumulation rate, calculated at drill site 1 (5365 m a.s.l.), was 2090 mm w.e. At drill site 2 (5206 m a.s.l.), average accumulation was 1380 mm w.e. for the same period. The 9.14 m core from 5206 m a.s.l. revealed more annual accumulation layers than the 12.58 m core from 5365 m a.s.l. Considering that both sites were located within the same large accumulation area, about 5 km from each other (Fig. 4), we assumed that the rate of snow accumulation was very similar to the amount of precipitation deposited at the drilling sites. The upper drilling site, on the windward slope of the adjusted valley, has a higher precipitation rate than the low drilling site, which is located in the precipitation shadow on the leeward slope, 5 km east of the upper site. Therefore the difference in accumulation between these two sites (5206–5365 m a.s.l.) was significant, with accumulation/altitude gradient averaging ∼4.6 mm m−1. This difference is similar to the altitudinal distribution of snow water equivalent at high elevations of marine alpine regions of the northwestern Alps and southeastern Tibet (4.0 mm m−1), and southwestern Scandinavian mountains (up to 5.5 mm m−1) (Reference Loktionova-Aizen and KotlyakovLoktionova-Aizen, 1995; Reference Aizen and AizenAizen and Aizen, 1997).
Stable isotopes in snow pits and firn cores
Means and amplitudes
Concentrations of stable isotopes in glacial cores are determined by air temperature, relative humidity, precipitation, and the trajectory of air masses from their source regions. In the Pamirs, the majority (68%) of precipitation occurs during the cold season (November–April; Fig. 2a). This leads to mean isotope ratios that are lower in the Pamirs (i.e. ![]() and
and ![]() ) than in the Tien Shan (−16.3‰) or the Altai (−13.6‰) (Reference Aizen, Aizen, Melack, Kreutz and CecilAizen and others, 2004, Reference Aizen, Aizen, Fujita, Nikitin, Kreutz and Takeuchi2005) despite lower air temperatures during the corresponding periods (Table 3). For example, at the Altai drill site in Siberia, 24% of the precipitation occurs during the cold season when the mean minimum δ18O is −16‰. This results in a 2.4‰ decrease in the annual mean δ18O. In the Pamirs, 68% of the precipitation occurs in the cold season, coinciding with the mean minimum δ18O value of −23‰ and resulting in a 5.8‰ decrease in the annual mean δ18O. About 40% of the firn-core records from Fedchenko glacier (5365 m a.s.l.) exhibit δ18O values below −20‰, whereas ∼2% of the Altai’s firn/snow core comprises records below −20‰ (Fig. 8).
) than in the Tien Shan (−16.3‰) or the Altai (−13.6‰) (Reference Aizen, Aizen, Melack, Kreutz and CecilAizen and others, 2004, Reference Aizen, Aizen, Fujita, Nikitin, Kreutz and Takeuchi2005) despite lower air temperatures during the corresponding periods (Table 3). For example, at the Altai drill site in Siberia, 24% of the precipitation occurs during the cold season when the mean minimum δ18O is −16‰. This results in a 2.4‰ decrease in the annual mean δ18O. In the Pamirs, 68% of the precipitation occurs in the cold season, coinciding with the mean minimum δ18O value of −23‰ and resulting in a 5.8‰ decrease in the annual mean δ18O. About 40% of the firn-core records from Fedchenko glacier (5365 m a.s.l.) exhibit δ18O values below −20‰, whereas ∼2% of the Altai’s firn/snow core comprises records below −20‰ (Fig. 8).
(a) Absolute (f) and (b) integrated (Σf) probable distribution of δ18O records in different central Asian ice/firn cores. Periods of ice-core records are presented in Table 3.

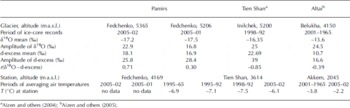
Means and seasonal amplitudes of δ18O and d-excess, and correlation between δ18O and d-excess, r, from the central Asian snow/firn cores. T is long-term mean annual air temperature for the quoted periods, corresponding to the ice-core records at nearby stations
The difference between the maximum and minimum monthly air temperatures at the Pamir meteorological station is large (ΔT = 21°C). This difference is reflected in the large range (22.9‰) in δ18O ratios (Table 3).
Spatial distribution of isotope ratio from two Fedchenko pilot snow/firn cores
The two Fedchenko glacier snow/firn cores exhibit similar mean isotope ratios, but different minimum and maximum values (Fig. 7). Minimum isotope concentrations were lower at high altitude (5365 m a.s.l.) than at low altitude (5206 m a.s.l.). This reflects a decrease in air temperature with increasing altitude and an increase in precipitation with increasing altitude during cold seasons. More enriched values of isotopes related to warm seasons were found in the high- than in the low-altitude core. The inverse distribution of isotope concentration probably reflects an inverse distribution of air temperatures during the warm season. The higher maximum air temperature at higher altitudes is caused by increasing night condensation processes with increased altitudes, through the heating of the atmosphere as a result of energy released during the condensation process. High values of relative humidity, up to 100%, were recorded by AWS at 5420 m a.s.l. mainly during night-time in August (Fig. 2c). The air humidity close to saturation confirms intensive condensation processes at high altitudes.
Relationship between stable hydrogen-isotope and oxygen-isotope ratios
The δ18O/δD relationships in the Fedchenko snow/firn cores (Fig. 9) have similar slopes (8.5 at the higher site, 8.3 at the lower site) to that of the oxygen/hydrogen covariance for the global meteoric water-line (GMWL; 8.0). Of the three central Asian mountain ranges, the Pamir (Fedchenko glacier) δ18O/δD slope value is closest to that of the GMWL (Fig. 9). This suggests that the relationship between fractionation factors in the Pamir pilot cores most resembles that of the GMWL, explaining the absence of strong melt and percolation in the Fedchenko snow/firn cores.
Relationship between deuterium (δD) and oxygen (δ18O) isotope ratios for snow/firn cores from (a) the Pamirs (5365 and 5206 m a.s.l.), (b) the Altai (4150 m a.s.l.) and (c) the Tien Shan (5200 m a.s.l.). Periods of ice-core records are presented in Table 3.

Deuterium excess
The deuterium excess (d-excess) is a parameter reflecting non-equilibrium fractionation during initial evaporation from the ocean, re-evaporation at land surfaces and/or mixing along air-mass trajectories (Reference Merlivat and JouzelMerlivat and Jouzel, 1979; Reference Jouzel and MerlivatJouzel and Merlivat, 1984). A smaller or larger intercept than the GMWL intercept (10) in the local δ18O/δD relationships from the snow/firn core, snow pits and precipitation reflects different kinetic evaporation effects on the transferred water vapor. For example, initial water vapor may be evaporated quickly or slowly under non-equilibrium conditions (Reference Kendall and McDonnellKendall and McDonnell, 1998). The long-term mean d-excess value (18.1‰) and seasonal amplitude (25.8‰) in the Pamir snow-/firn-core records (Table 3) are intermediate between the values for the Tien Shan (22.7‰ and 39‰ respectively) and Altai (10.7‰ and 16.6‰ respectively). That is, water vapor contributing to precipitation in the Pamirs probably evaporates more (less) slowly or is less (more) often re-evaporated than water vapor contributing to precipitation in the Tien Shan (Altai).
Seasonal deuterium-excess variation
The Pamir snow/firn cores differ from the Tien Shan and Altai cores (Fig. 7) in that the maximum d-excess values, occurring in summer, and minimum values, occurring in winter, relate to seasonal δ18O and air-temperature variations, and inversely to relative air humidity. Snow/firn cores drilled in Inilchek glacier, Tien Shan, and in west Belukha glacier, Siberian Altai, exhibit inverted seasonal d-excess and δ18O variability (Reference Aizen, Aizen, Melack, Kreutz and CecilAizen and others, 2004, Reference Aizen, Aizen, Fujita, Nikitin, Kreutz and Takeuchi2005). Low precipitation and air humidity from June to September in the Pamirs cause intensive summer evaporation over plains and at low altitudes of the ablation zone (Reference LebedevaLebedeva, 1976) on the Pamir glaciers (e.g. at 4169 m a.s.l.; Figs 2a and 10). This suggests enhanced continental water recycling, i.e. the return of land surface evaporation water to the glacier surface as precipitation. The western and northwestern cold intrusions (Fig. 3) transfer and recycle moisture originated over eastern Europe, northern Africa, the eastern Mediterranean and the Black, Caspian and Aral Seas during warm seasons (Reference Bugaev, Dzordzio and KozikBugaev and others, 1957; Reference Barry and PerryBarry and Perry, 1973; Reference KuznezovaKuznezova 1978, Reference Kuznezova1983; Reference RodionovRodionov, 1994; Reference Subbotina, Muminova and InagamovaSubbotina, 1995; Reference MeleshkoMeleshko and others 1998; Reference Arpe, Bengtsson, Golitsyn, Mokhov, Semenov and SporyshevArpe and others, 2000; Reference Kreutz, Wake, Aizen, Cecil and SynalKreutz and others, 2003; Reference Aizen, Aizen, Melack, Kreutz and CecilAizen and others, 2004, Reference Aizen, Aizen, Fujita, Nikitin, Kreutz and Takeuchi2005; Reference Kurita, Yoshida, Inoue and ChayanovaKurita and others, 2004; Reference Elguindi and GiorgiElguindi and Giorgi, 2006).
However, at high altitudes of the accumulation zone where the snow/firn cores were drilled (e.g. at 5420 m a.s.l.), the condensation process intensifies; air humidity reaches saturation (Fig. 2c) and the condensation significantly dominates the evaporation that leads to increases in the summer d-excess records (Fig. 7), similar to processes observed in Antarctica (Reference Kendall and McDonnellKendall and McDonnell, 1998).
Low air humidity and high air temperature and d-excess values in summer at the Fedchenko glacier station (Fig. 2) correspond to the seasonal variation of d-excess in precipitation estimated from the long-term values at the stations located between 30° N and 40° N (Reference Froelich, Gibson and AggarwalFroehlich and others, 2002). The low relative humidity and accordingly high d-excess in summer indicates the prevailing influence of relative humidity over air temperature in seasonal distribution of the d-excess.
Seasonal fluctuations of the δ18O and d-excess relationship may provide insights into variability in the pattern of mesoscale atmospheric circulation. During winter/early spring, when precipitation is greatest, d-excess values for the Pamir snow/firn core range from 8‰ to 14‰ (Fig. 7). These values are similar to those for the GMWL. Western, northwestern and northern air masses bring precipitation to the Pamirs that clearly originated over the Atlantic Ocean without further modified recycling. During the summer/ autumn seasons, d-excess increases by up to 28.5‰ (Fig. 7). This reflects complex sources of precipitation (Reference Bugaev, Dzordzio and KozikBugaev and others, 1957; Reference KuznezovaKuznetsova, 1978, Reference Kuznezova1983; Reference Subbotina, Muminova and InagamovaSubbotina, 1995) such as air masses originating over warm oceanic waters (South Atlantic and Indian Oceans) or warm southern Caspian Sea waters combined with the modification of air masses during passage over relatively warm continental waters. In the Pamir pilot firn core obtained from the higher altitude (5365 m a.s.l.), there are two maxima in stable-isotope and d-excess distribution during the warm season each year (Fig. 7), which could be caused by variations in the origin of moisture.
REE, major-element and heavy-metal concentrations in the Pamir firn core
High, medium and low concentrations
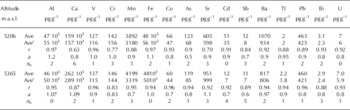
The range of concentrations, in the snow/firn cores, of background and high dust conditions was large: for Nd, Al and Ca the concentration ranges were 1–1119, 2–424 and 3–3171 ng g−1 respectively (Table 1). For this reason, samples were divided into two groups with three clusters in each group. The first group was based on three arbitrary concentrations: high dust (samples with concentration >2σ), medium dust (2σ ≥ concentration > σ) and low dust (concentration ≤ σ), where σ is the standard deviation of the concentration measurements. The second group comprises three clusters based on values of absolute maximum, minimum and average. Concentrations of REE, major elements and other elements in each cluster within each group are given in Table 1.
Medium concentrations of REE and major elements, as well as high and low concentrations, (Table 1) from the Fedchenko snow/firn cores are an order of magnitude lower (up to 20 times) than those from the Inilchek snow/firn core (Reference Kreutz and SholkovitzKreutz and Sholkovitz, 2000). The proximity of the Takla Makan desert to the central Tien Shan and associated föhn incursions causes excessive loading of aerosol in the Tien Shan region. Furthermore, the greater aerosol loading of dry deposition in the Tien Shan glaciers is caused by the absence of winter precipitation and snow cover in low-lying surrounding areas. In contrast, snow is accumulated year-round at Fedchenko glacier where the greatest accumulation occurs during winter and spring. The concentration of calcium (Ca) is also lower in the Pamirs than in the Tien Shan. The exception is the concentration of sulfur (S), which is higher in the Pamirs than in the Tien Shan. This may be associated with dust brought from the fertilized western central Asian lowlands, which are closer to the Pamirs. Average and maximum concentrations of REE in the Pamirs are about an order of magnitude (three to nine times) greater than in Altai ice cores as well as in polar ice cores (Table 1).
Content of heavy metals and other trace elements
The average and maximum contents of the light trace elements (e.g. Al, V, Mn, Fe and Co) in snow and firn on Fedchenko glacier are two to nine times greater than on the Altai glaciers, which are heavily polluted (Reference Nikolaeva, Saprykin and PalesskiNikolaeva and others, 2003). At the same time, average, maximum and minimum content of the heavy metals As, Sr, Cd, Ba and Pb in snow and firn on Fedchenko glacier are two to fourteen times lower than in snow and firn from the Altai glaciers (Table 1). The average content of Ba is an exception.
Maximum content of Mn and Ba is two to three times greater than in snow and firn from the Alps, which is also a highly polluted region (Reference Van de VeldeVan de Velde and others, 2000). Among the trace elements, concentrations of antimony (Sb) were comparable with concentrations in the Canadian Arctic (Reference Krachler, Zheng, Fisher and ShotykKrachler and others, 2004) and Mont Blanc in the European Alps (Reference BarbanteBarbante and others, 1999) but significantly less than in the eastern European Alps (Table 1). Intensive atmospheric pollution over the Pamirs is caused primarily by recovery and refining of natural gas, oil, antimony, lead, uranium and gold in Tajikistan, Turkmenistan, Iran and Uzbekistan. Southwestern Tajikistan still has the second largest aluminum production in the former Soviet Union. The desiccated Aral Sea is also a source of large mineral aerosol production that spreads eastward over central Asia.
Seasonality in aerosol loadings
There is substantial seasonal variability in the deposition of non-soluble aerosol. This variability is illustrated by the depth profiles for REE, major elements and other elements, which are identical in timing to changes in δD and δ18O stable isotopes (Figs 7 and. 14). S and Ca are exceptions that did not demonstrate an obvious seasonal pattern.
Several peaks in REE, major and other elements were observed in warm seasons (Figs 7 and 14). Summer is characterized by dust storms and dry, hot, hazy weather. Well-known regional winds called ‘Afghanis’ bring dust from Iran, Afghanistan and Turkmenistan. Regional loess from Tajikistan is loaded during the development of summer thermal depressions (type 7; Fig. 3). Regional loess could also be brought by southern cyclones (e.g. southern Caspian and Murgab cyclones (types 4 and 5; Fig. 3)). Background minimum aerosol loading is observed in winter. Wet ground and low convection levels suppress transport of aerosols in the Pamirs during the cold season when precipitation is at a maximum.
Drought and aerosol loading
In southwestern Asia, a drought developed from 1998/99 to 2002. This has intensified the frequency, duration and area coverage of severe dust/loess storms in Afghanistan and Tajikistan (Reference Barlow, Cullen and LyonBarlow and others, 2002). Records of pilot snow/ firn cores from the Pamirs are lacking for the first 2 years of drought. However, there are records for 2001 and 2002 from the site at 5206 m and for 2002 at 5365 m a.s.l. For both sites, the concentrations of REE and major elements for late summer/autumn are about two times greater for 2002 and 2001 than for other years (Figs 7 and 13). However, S does not show the same pattern.
Normalized REE pattern
The similarity in distribution between REEs (Fig. 7) suggests that loess is one of the predominant lithogenic materials transported to the Pamirs. To confirm the loess component of the snow/firn core, samples from Fedchenko REE records were normalized using upper continental-crust values (Reference Taylor and McLennanTaylor and McLennan, 1985). Distributions of the normalized REE in the Pamir samples, based on examination of averages of low, medium and high values, were alike (Fig. 11). The normalized REE patterns (low samples) have a few (not absolute) features comparable with normalized loess sediment patterns (Reference Taylor, McLennan and McCullochTaylor and others, 1983).
‘Penitent snow’ in the ablation zone of Fedchenko glacier (4600 m a.s.l.) (photo courtesy of L. Braun).

REE mean composition from the Pamir snow/firn cores for background (a), medium (b) and high (c) clusters normalized to upper continental-crust (UCC) means (Reference Taylor and McLennanTaylor and McLennan, 1985). Tien Shan (TS) REE means are from Reference Kreutz and SholkovitzKreutz and Sholkovitz (2000), and loess

Comparison of the Pamirs with the Tien Shan with respect to normalized REE concentrations reveals both different and similar distribution patterns. In the Tien Shan the main lithogenic material is Chinese loess. The normalized REE patterns from the Tien Shan show a consistent trend towards a small enrichment in light REEs (Reference Kreutz and SholkovitzKreutz and Sholkovitz, 2000). The REE pattern for the Pamirs does not show such a trend. The Pamir samples differ by showing a strong decrease in gadolinium (Gd). Gd is contained in many rare minerals (e.g. monazite and bastnasite) that are found in deposits in northeastern Asia, closer to the Tien Shan than to the Pamirs. Furthermore, the geochemical evidence of the low-Gd anomaly in the Pamir cores suggests that the material source and accumulating environment of the Tajik–Afghan loess differ from those of the Chinese loess. The highest Gd concentration is found in granite, granodiorite, shale, sandstone and schist, while the low Gd content is generally found in glacial drift-covered terrain and calcareous areas (R. Salminen, http://www.gsf.fi/publ/foregsatlas). The Pamirs consist of arch-wise splits into structural zones (Reference AgahanyancAgahanyanc, 1965). These external zones were formed by Paleocene–Oligocene sea-lagoon sediments and are therefore rich in calcium carbonate, which is highly erodible by water or wind.
A notable increase of europium (Eu) is the same in both the Pamirs’ and the Tien Shan’s normalized patterns in all three cluster samples.
Nd/Yb ratio
Analysis of mineral aerosols over the Chinese desert region (Reference Zhang, Arimoto, Zhu, Chen and ZhangZhang and others, 1998) showed that the ratio, Nd/Yb, of neodymium and ytterbium concentrations is directly related to the input of Chinese loess dust. The higher the ratio the higher the loess input. In Pamir cores, the Nd/Yb ratio varies from 6 to 26.6. An average ratio value is 14.2, which is lower than the average ratio for the Tien Shan core (17.2). Variability in the Pamirs’ Nd/Yb ratio is associated with seasonal timing variability, which appears in the isotope profile (Fig. 7). Stable-isotope concentrations are significantly correlated with the Nd/Yb ratio (r = 0.74). However, the distribution of Nd/Yb ratios differs from that of the REE profiles. The maximum Nd/Yb ratio is generally observed during spring. However, there is a maximum even at the end of the cold seasons (at 1.0 m and 1.7 m; Fig. 7). Consequently, we suggest that the aerosol observed in both the Pamir cores generally derives from the local Afghan–Tajik loess deposition but Chinese loess may contribute at the end of winter/spring seasons.
Deposition of Ca and S
While deposition of non-loess Ca and non-loess S is high during periods of high loess deposition (in summer), there is pronounced variability in concentrations of Ca and S during background/low loess periods (in winter). For example, three significant increases in REE, heavy-metal, Al and Fe profiles accompany increases in Ca, but do not accompany simultaneous increases in S in samples from 4.0–5.6 m depth in the pilot snow/firn core obtained at 5365 m a.s.l. There were eight strong fluctuations in REE, heavy-metal and Ca profiles in the core at 5365 m a.s.l., while there were only three in the S distribution. Generally, aerosols of the same composition can be deposited at different times. S is the exception, which suggests a source other than dust or loess aerosol (e.g. anthropogenic). The aerosol observed in both cores from the Pamirs was characterized by high concentrations of REE and Al, high or moderate concentrations of Ca and a background concentration of S. Concentrations of elements in aerosols obtained from different central Asian sites surrounding the Pamirs are broadly similar (Table 4) to records obtained from the pilot snow/firn core at 5365 m a.s.l.
Element ratios in Fedchenko glacier snow-/firn-core samples, and the closest values for central Asian aerosols

Discussion: Spatial Distribution of Aerosol Records during High and Low Aerosol Loading
To avoid the interannual variability associated with the influence of local conditions on aerosol loading distribution, we analyzed records for each year (Tables 6 and 7 in Appendix) and averaged records for the whole considered period (Figs 12 and 13). A consistent pattern, which is observed each recorded year, was considered significant.
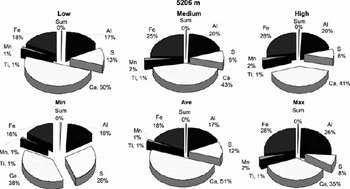
The main component of the aerosol loading to Fedchenko glacier consisted of the elements Ca, Fe, Al and S. On average, the concentration of Ca was 51% and 62% at the two sites. Concentrations of Fe, Al and S averaged 18–11%. At the drilling site located on the leeward slope during the high/maximum aerosol loading, the proportion of Ca and S decreased and the proportion of Fe and Al increased by 10% (Fig. 12; Table 6) compared to low/minimum aerosol loading conditions.
Main components of the insoluble aerosol loading to Fedchenko glacier for the high/maximum, medium/average and low/minimum clusters.
To analyze the spatial distribution of REE, major and other elements we computed the difference in concentrations between the two drill locations. The difference was considered significant if the sign of the difference was the same during each recorded year and if the difference exceeded the sum of instrumental and method detection limits (Table 7). Concentrations of the light REE, La, Ce, Pr, Nd, Sm and Eu, were greater at the drilling site located on the windward slope than on the leeward slope in a cluster of high/maximum aerosol loadings during the three considered years (Fig. 13). Dust storms produce greater concentrations of light REE at the windward slope than at the leeward slope located 5 km from the windward slope. For medium and low clusters, REE concentrations decreased with altitude independent of distance or slope exposition, indicating the existence of atmospheric background REE loading that decreases with altitude while the components remain the same.
Spatial differences Δ5365−5206 in (a–c) REE ((a) high/maximum clusters; (b) medium/average clusters; (c) low/minimum clusters) and (d) major and other element concentrations of two snow/firn cores obtained from 5365 and 5206 m a.s.l.

For each considered year, during the high aerosol loading, concentrations of light trace elements and heavy metals demonstrated positive differences between windward and leeward slopes. The concentrations of Ti and As are exceptions, showing an opposite tendency to other elements. During background conditions, the differences in trace elements and heavy metals between the two locations are insignificant, being less than the instrumental detection limit.
Conclusions
The location of a prospective site for deep drilling was determined by analyzing two pilot snow/firn cores obtained from Fedchenko glacier. A site on a leeward slope at 5206 m a.s.l. with significantly less accumulation is more appropriate than a site on a windward slope at 5365 m a.s.l. This allows recovery of longer-term paleoclimate records, possibly to 1000 m depth.
A well-defined, seasonal stratification in isotope and geochemical signals characterized the meteorological and atmospheric-aerosol loading regime of the Pamirs. Air temperature and humidity/precipitation were the primary controls on the stable-isotope records, i.e. precipitation was more depleted during the low temperatures of the winter months and more enriched during the higher temperatures of the summer. Spring–winter maximum and summer–autumn minimum precipitation typical of the central Pamirs resulted in the lowest mean isotope ratios among values obtained from other glaciers in central Asia. Low-humidity, intensive re-evaporated/recycled moisture brought from the surrounding low-elevation areas, and prevailing condensation at high elevations of the glacier accumulation zone during the warm season with minimum precipitation, resulted in increasing d-excess values. Pilot snow-/firn-core records for the Pamirs are also distinctive in the matched seasonal variation in d-excess and δ18O. Values of d-excess as well as δ18O were greater in warm seasons.
Isotopic composition (δ18O) and detailed profiles of neodymium (Nd), samarium (Sm) and trace elements (UH) in snow/firn cores from Fedchenko glacier at 5365 and 5206 m a.s.l.

Annual minima in isotope ratios decreased with altitude because of decreasing winter air temperatures and increasing precipitation. The inverse relationship between altitude and maximum air temperature was probably due to the increasing condensation with altitude.
The alpine areas of the Pamirs have climatic features transitional between marine-originated precipitation and the recycling of atmospheric moisture. The most similar (relative to GMWL) interpretation is the δ18O–δD relationship from the most depleted Pamir isotope records, related to greater precipitation during the cold season that originated in the Atlantic without modified recycling. For summer/autumn seasons, increased d-excess reflects complicated sources of precipitation (e.g. South Atlantic and Indian Oceans, warm southern Caspian Sea waters or relatively warm continental waters).
The similarity in REE concentration patterns suggests that loess is the predominant lithogenic material transported to the Pamirs from Afghan–Tajik loess deposits. Those deposits are characterized by high concentrations of REE and Al, high or median content of Ca, and a background S concentration. Samples from the Pamirs differed in having low concentrations of Gd. We do not exclude occasional intrusion of Chinese loess into Pamir glaciers.
Aerosol concentrations in Fedchenko glacier samples are lower than in Tien Shan cores. However, the REE profile of both pilot Pamir cores documented one of the most extreme droughts of 2001 and 2002 that developed in southwest Asia. At the same time, concentrations of REE, major and other elements in snow and firn samples from the Pamirs exceeded those from Antarctica, Greenland and even the relatively contaminated Alps and Altai. Heavy-metal concentrations in Fedchenko glacier samples were several times lower than in snow and firn from the Altai glaciers. Concentrations of trace elements (e.g. antimony) were similar to those in the Alps and Arctic Canada. Extensive fertilization in areas close to the Pamirs probably explains the significant concentrations of sulfur observed even during background aerosol loading. Heavy-industrial and agricultural development since the mid-20th century have contributed to intensive atmospheric pollution over central Asia.
Acknowledgements
This research was supported by grants awarded by the US National Science Foundation (ATM-0754644 and ATM-0754479) and US National Oceanic and Atmospheric Administration (NA04OAR4600179) to UI and UM. We appreciate valuable comments and corrections suggested by C. Barbante.
Appendix
Detailed Data on Applied Methodology in Interpretation of Trace Element Series
To avoid the influence of patching patterns on the distribution of major-element and REE concentration, we analyzed the records from two drilling sites showing the characteristics in terms of accuracy, detection limit, reproducibility and distribution.
Analytical characteristics and certified determinations of the applied methodology: means, standard deviations of riverine water reference materials (SLRS-4 and SRM), overall precision based on quality control (QC), and determination limits based on blanks (3σ)
Annual share of the main components (%) of the insoluble aerosol loading to Fedchenko glacier pilot snow/firn cores obtained from 5365 and 5206 m a.s.l. for the maximum, average and minimum clusters

Differences Δ5365−5206 in REE and major and other element concentrations of two cores obtained on Fedchenko glacier, at 5365 and 5206 m a.s.l.