

Introduction
Equal pay for women constituted one of the most important labor market reforms of the twentieth century, on par with the introduction of the forty-eight-hour working week in 1919.Footnote 1 However, in contrast to working-hours legislation, its international diffusion took much longer—typically between 1947 and the mid-1960s. Britain was an outlier, with equal pay legislation introduced in 1970 (coming into full effect in 1975), much later than the European Economic Community (EEC) nations, Canada, or the United States. However, despite strong evidence from other countries that equal pay did not produce significant female unemployment or other adverse economic consequences, its announcement was met by warnings from economists of substantial negative economic impacts, including a rise in female unemployment.Footnote 2
In fact, a 15 percent rise in women’s relative hourly earnings from 1973 to 1976 (compared with men) was accompanied by an expansion of the female workforce and relative female employment in both the public and private sectors (for numbers employed and hours worked).Footnote 3 Yet the results of this “natural experiment” in pay regulation did not prevent some economists and politicians predicting that the introduction of a UK National Minimum Wage in 1998—mainly effecting female workers—would create mass unemployment. Once more, these predictions proved wide of the mark.
In contrast to the National Minimum Wage, there has been relatively little research on the impacts of equal pay legislation. This article first briefly outlines what proved to be the UK’s longest labor reform campaign, taking over eighty years to achieve success, and the reasons why policy makers continued to reject equal pay even after its adoption by most major industrial nations. It then discusses the introduction of equal pay legislation in 1970 and contemporaneous official research to estimate its likely impacts. The reasons behind equal pay legislation having an apparent positive impact on women’s employment are then reviewed, together with their implications for the nature of the British labor market.
Finally, the article examines a hypothesis proposed, but not fully developed, by Joshi, Layard, and Owen, that the unexpected positive relationship between equal pay and relative female employment was “simply that employers began to realize the true worth of female labour.”Footnote 4 Despite a substantial increase in the working lives of women over the postwar decades, together with a rise in their relative “human capital” (proxied by educational qualifications), collective bargaining systems had fossilized male/female pay differentials based on convention and established practice. Equal pay prohibited such discrimination, thereby addressing market imperfections such as monopsonistic employers, direct (or “Becker,” discrimination, discussed below), and indirect discrimination by consigning female workers to secondary labor markets.
The Long Battle for Equal Pay
Equal pay had been an objective for the Trades Union Congress (TUC), at least formally, since the 1888 “matchgirls’ strike.” Unions’ support for equal pay was partly in response to fears that employers might replace more expensive male workers with cheaper females in jobs where mechanization could reduce the importance of strength and stamina.Footnote 5 In addition to the threat of displacement by lower-paid women workers, this also reflected the trade union movement’s goal of the “family wage”—providing the male breadwinner with sufficient earnings to support his family and enable his wife to devote her time to housework and child care.Footnote 6 Unions considered that equal pay would prevent substitution of men by women, who were assumed to have lower productivity.
Women’s widespread employment in industry during World War I increased support for equal pay. In September 1918, the War Cabinet appointed the Atkin Committee “to investigate and report upon the relation which should be maintained between the wages of women and men, having regard to the interests of both as well as the value of the work.”Footnote 7 Following its April 1919 report, the House of Commons voted for equal pay in all branches of the Civil Service and local government, though the government took no action.
The long history of campaigns and inquiries that failed to achieve movement on equal pay is illustrated by the Civil Service. The majority reports of the MacDonnell Commission (1912–1915), Haldane Commission (1918), and 1918 War Cabinet Committee all recommended moves toward equal pay. However, introduction was repeatedly delayed and the 1929–1931 Tomlinson Commission failed to endorse equal pay, partly on the grounds that this would provide more favorable treatment for women workers in the public sector than their private sector counterparts. The campaigning Labour member of Parliament, Ellen Wilkinson, proposed a parliamentary motion on Civil Service equal pay, passed by 156 to 148 votes in April 1936—which the prime minister, Stanley Baldwin, reversed via a vote of confidence.Footnote 8
Following the great expansion in the volume and range of female employment during World War II, a Royal Commission on Equal Pay revisited this issue between 1944 and 1946. However, it was not empowered to make recommendations, only to consider the social, economic, and financial implications.Footnote 9 Moreover, its findings did not unequivocally support the case for equal pay; and in December 1946, the official working party rejected equal pay in the private sector, partly owing to TUC’s opposition to enforcing it through legislation. This may have reflected the law lords’ extreme antiunion stance, as evidenced by three notorious Edwardian court cases: Allen v. Flood, Quinn v. Leathem, and Taff Vale Railway Co. v. Amalgamated Society of Railway Servants—reflecting a bias that was still strongly evident in the 1940s.Footnote 10 Equal pay legislation might have provided a further pretext for judicial interference in industrial disputes. Equal pay in the “nonindustrial” (that is, nonmanual) public sector was rejected on the grounds that women workers in the public sector would receive unequally favorable treatment, together with cost considerations. A declaration in favor of equal pay in principle was also ruled out because it was argued that this would compel the government to introduce equal pay in the public sector.Footnote 11
The 1951 Conservative government also rejected equal pay, though in the run-up to the 1954 election (that appeared to be a very close contest) the chancellor, Rab Butler, decided that conceding equal pay for workers in the public sector was an important vote-winner—appealing to working women and neutralizing a similar pledge from the Labour Party. Equal pay was eventually granted from January 1955 for the “nonindustrial” (that is, executive) Civil Service, phased in between 1955 and 1961, and was soon extended to local government employees and teachers.Footnote 12
Meanwhile, most leading industrial nations had adopted equal pay legislation. In France, a law of 1950 stipulated that all collective agreements should conform to equal pay for equal work. Italy’s 1947 constitution enshrined the principle of equal pay for equal work, which by 1965 was said to be defined broadly.Footnote 13 West Germany’s 1949 Basic Law included equality of pay as part of broader equal rights. However, the Benelux nations had made less progress, despite equal pay legislation.Footnote 14 Sweden’s legislation followed the definition of “equal pay for . . . equal value,” while Norway had a looser definition. Canada had introduced federal equal pay laws, and eight provinces had their own legislation, while the U.S.A.’s 1962 Equal Pay Act prohibited discrimination for similar work (for workers covered by the minimum wage provisions of the Fair Labor Standards Act). There were also state-level equal pay acts, the majority of which referred to “comparable work.” Footnote 15 (See Appendix Table 1 for a summary of data collected by the Ministry of Labour regarding equal pay legislation overseas at July 1965.)
Britain’s 1962 bid to join the EEC required acceptance of Article 119 of the 1957 Treaty of Rome, committing each member-nation to “maintain the principle of equal renumeration for equal work as between men and women workers.”Footnote 16 Moreover, in December 1961, the EEC resolved to move in stages to full equal pay (for equal work) by the end of 1964.Footnote 17 This was more problematic for Britain than for the EEC Six, given that they all had some form of equal pay legislation.Footnote 18 In the event, the EEC Six failed to achieve equal pay in all sectors, partly due to factors such as differences in tasks between women and men on similar work and differentials reflecting overtime, seniority, night work, unpleasant or dangerous work, bonuses, and geographical factors.Footnote 19
In 1962 UK officials estimated the cost of equal pay at £350 million, equivalent to an addition of 2.5 percent to annual wages/salary costs. In addition, it was anticipated that male workers might seek higher rates to preserve male/female differentials. Equal pay was accepted as the price of EEC entry, but officials sought to negotiate greater flexibility, phasing it in over four or five years.Footnote 20 Negotiators also hoped to be allowed to implement equal pay via Britain’s traditional method of wage-setting—collective bargaining—before embarking on legislation.Footnote 21 However, France vetoed Britain’s membership before such negotiations commenced.Footnote 22
Britain’s Introduction of Equal Pay
Britain’s 1967 female/male hourly earnings ratio (excluding agriculture) was 59.7 percent, compared to France’s 83.5 percent and West Germany’s 69.3 percent.Footnote 23 Moreover, there was no evidence of Britain closing the gap; the differential had remained stable since the early 1950s. UK wage rates were mainly set by company- or plant-level collective bargaining or by industry/occupation statutory wage-setting through wage councils. Wage councils were independent statutory wage-negotiating bodies, established by Winston Churchill in 1909, to set minimum pay levels in “sweated trades” with low wages and unionization rates.Footnote 24 These comprised representatives of the employer and employee sides of each trade or industry, together with three independent members (who had a vote only in an impasse); one of whom acted as chairman. Agreed proposals were embodied in wages regulation orders, legally enforceable on employers if they formed part of employees’ contracts. Moreover, employers not party to these agreements could be legally compelled to comply with the agreed terms for their industry or trade.Footnote 25
In 1962, basic, minimum, or standard wage/salary rates for about 13 million employees were settled by collective bargaining, a further 5 million by individual contracts between employers and employees, and about 4 million by wage councils and agricultural wages boards—mainly involving female workers (around 2.375 million out of 3.8 million wage council workers in the late 1960s).Footnote 26 Unequal pay was particularly institutionalized in wage councils, which set different minimum rates for men and women.Footnote 27 They typically based differentials on established conventions in their sectors, thus fossilizing pay inequality. Firm-level collective bargaining also typically institutionalized male/female earnings differentials, largely based on convention and previous practice.
As The Economist noted in 1969, while a few Western nations had not yet joined the International Labour Organisation, Britain was “virtually alone among advanced countries in its lack of any legal equal pay requirement.”Footnote 28 In 1969, only 1.5 million of Britain’s 8.5 million female employees received equal pay, mainly confined to nonmanual public sector workers, some professions, and several textile industries in which it had been traditionally practiced.Footnote 29 Equal pay legislation would therefore involve a major pay rise for a substantial proportion of Britain’s workforce.Footnote 30 By 1968, females comprised about 20 percent of the total national wage/salary bill. The distributive trades and professional and scientific services accounted for almost half the wage/salary bill for women, while manufacturing sectors represented only about one-fifth.Footnote 31
The 1963 TUC Conference had passed a resolution calling on the next Labour government to enact equal pay. Rapid growth in women’s unionization (accounting for 70 percent of the increase in trade union membership between 1964 and 1970) made this a growing priority of the TUC, which had hitherto not always pressed the issue.Footnote 32 Labour’s 1964 election manifesto included a pledge to introduce equal pay as one of a seven-point “charter of rights for all employees.”Footnote 33
An interdepartmental working party was established in January 1965, chaired by Ray Gunter, the minister of labour, to examine the economic and social implications of equal pay. However, it merely recommended voluntary methods of implementation via tripartite discussions with the TUC and employers’ organizations—in line with Britain’s tradition of setting wages and conditions via collective bargaining.Footnote 34 In June 1968, Gunter’s successor, Barbara Castle, announced that she would be entering into new discussions with the Confederation of British Industry (CBI) and TUC with a view to agreeing to a timetable for the phased introduction of equal pay.Footnote 35 Castle’s determined and skilled championing of equal pay legislation was instrumental in it finally being enacted. She had a long-standing interest in equal pay and seized the opportunity to intervene in the June 1968 women machinists’ strike at Ford’s Dagenham plant, triggered by a new job evaluation scheme that undervalued their work. She was able to broker a settlement while also focusing attention on the wider problems of low and unequal pay.Footnote 36
Both the main ministries involved—the Ministry of Labour (later rebranded as the Department of Employment) and the Treasury—had long-standing hostility to equal pay legislation. For example, a 1965 Ministry of Labour note suggested that the government should confine its activities to introducing equal pay for the industrial Civil Service over seven years and promoting equal pay in the private sector via exhortation and example.Footnote 37 The Treasury demonstrated extreme hostility, citing incomes policy and balance of payments considerations. Raising women’s earnings would significantly increase aggregate household income and thus threaten the Treasury’s long-term priorities of restoring the City’s international role and sterling’s role as a major international convertible currency. These objectives were vulnerable to any substantial rise in aggregate demand, given Britain’s low currency reserves.Footnote 38
Treasury officials launched a concerted campaign to block the 1970 Equal Pay Bill, pressing Roy Jenkins, the chancellor of the exchequer, to persuade Castle to moderate her comments on equal pay in Parliament, on the Labour Party’s national executive, and at Labour Party annual conferences.Footnote 39 Tactics also included lobbying other ministries that equal pay would get in the way of their priorities.Footnote 40 When direct opposition failed, they turned to delaying tactics, advising the chancellor to play for time by calling for more research.Footnote 41 Opposition continued, even after the passing of the act; for example, Treasury officials pressured the Department of Employment not to call for reductions in earnings differentials prior to the end of the five-year transition period (contrary to the intention of the legislation).Footnote 42
Castle had commissioned a study of the probable economic and social consequences via the Interdepartmental Group on Equal Pay, in collaboration with the TUC, CBI, and related organizations, which she presented to the cabinet on August 28, 1969.Footnote 43 It focused on thirteen industries with substantial numbers, or proportions, of female workers (Table 1), estimating their costs of moving to “equal pay for the same work.” This definition was chosen (rather than the wider “equal pay for work of equal value”) partly because estimating equal value was impracticable, given the general absence of job evaluation studies.Footnote 44 Equal pay for the same work had also been adopted by the EEC, and this strongly influenced the government’s approach to legislation, given an expectation that Britain would eventually join the EEC.Footnote 45
Estimated direct costs of equal pay as a percentage of the adult wage and salary bill, for the sectors examined by the Department of Employment and Productivity, 1968

Source: LAB 8/3507, Department of Employment and Productivity, “Enquiry into the cost of equal pay,” July 1969, para. 25, TNA.
The Interdepartmental Group on Equal Pay was aware that “equal pay” did not mean parity of earnings. For example, hourly earnings of women clerical workers in the nonindustrial Civil Service were 80 percent of those for men, despite equal pay, owing to women working at lower points on the incremental scale and sometimes for fewer hours. Moreover, occupations with higher proportions of women typically had below average wages.Footnote 46 Unequal promotion opportunities was another factor creating disparities, even where equal pay for similar work had been achieved.Footnote 47 An economy-wide analysis of the likely total costs of equal pay (Table 2) found substantial differences by broad sector, with variations largely reflecting their proportions of female workers. Meanwhile, the study of sectors with high female employment (see Table 1) showed that there were much larger variations within these sectors.
Expected costs of equal pay by sector, 1969
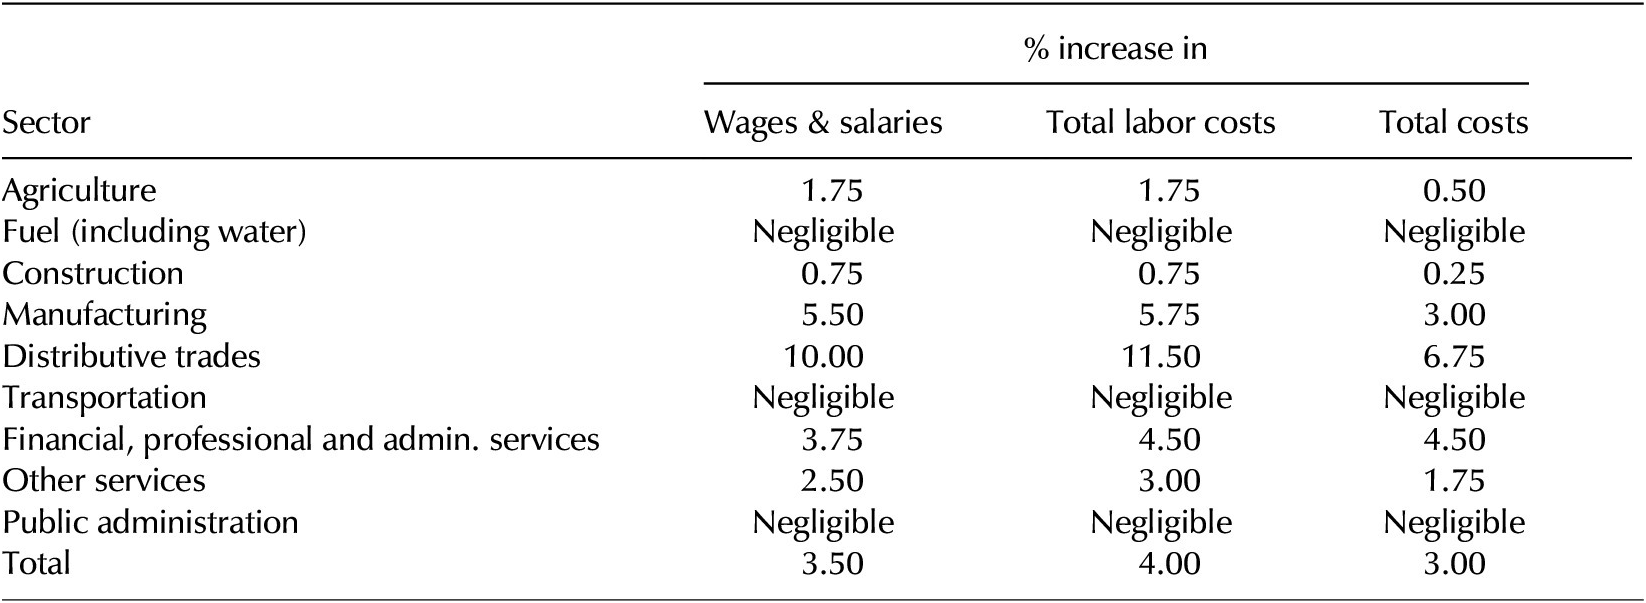
Source: T328/339, Treasury brief regarding equal pay legislation, H. G. Walsh, September 3, 1969. Annex A, “The economic and social implications of equal pay for women. Summary of note by officials.”
Note: The analysis does not allow for intersector repercussions.
The group estimated the direct costs of equal pay (that is, pay increases for women doing similar work as men but previously at lower rates); “consequential direct costs” (that is, increases in other components of remuneration, such as pension contributions); and indirect costs (changes in wages/salaries “as a result of repercussions”).Footnote 48 Some 304 firms were approached, 225 of which returned the questionnaire in time. Apart from the hotel, catering, and retail trades, the majority of women in surveyed firms were found to be doing semiskilled manual work involving a fair degree of manual dexterity, often in traditional “women only” occupations. Almost all sectors surveyed had jobs where women and men were not regarded as interchangeable, owing to the nature of the work or “long-standing practice,” thereby reducing the cost on a “same work” basis.Footnote 49 Anticipated impacts were found to vary considerably, both between broad sectors and within narrow industries (e.g., clothing, 3–31 percent range in expected wage/salary rises between firms examined; retailing, 0–31 percent; and electronics, 0–18 percent). Median impacts also varied widely, from zero for three manufacturing industries to 18 percent for clothing. and 13 percent for retailing.
Firms were also questioned regarding expected employment impacts. Many argued that equal pay would produce a shift from employing juveniles and part-time workers in favor of fewer, but better-quality, workers, used more intensively; together with increased mechanization; more rigorous streamlining of the labor force; critical examination of jobs (especially women’s); and termination of production in some chemicals and food plants with mainly female employees. Some expected a considerable reduction in female employment, but others were very doubtful this would occur, and a few suggested that equal pay would draw more married women into employment. Not only were women considered indispensable in some jobs, but in some localities they constituted the only untapped source of labor.Footnote 50 Indeed, employers in some sectors thought they were at considerable risk of being unable to compete for the necessary female labor if better-paid jobs for women became available. Some predicted easier recruitment if more women were encouraged to enter the labor force, together with better attendance and lower labor turnover (though several considered the opposite to be more likely) together with more efficient utilization of female labor, where mechanization could take the strength element out of jobs previously done by men, especially if legislative restrictions on overtime and shift work were lifted.Footnote 51
The Interdepartmental Group estimated a 5.5 percent increase in labor costs (5.0 percent in pay and 0.5 percent in national insurance contributions, etc.), equivalent to a 4.0 percent increase in total costs, with a roughly equivalent rise in prices. However, this assumed that equal pay would not have any substantial effect on women’s productivity, which was “doubtful . . . in some employments, female labour is used extremely wastefully because of the extreme cheapness with which much of it can be obtained. A sharp increase in women’s rates of pay is, almost certainly, likely to . . . get more effective work from them.”Footnote 52
Abolishing gender pay differentials was predicted to weaken job demarcation lines and promote more efficient labor utilization:
There is a tendency for some firms to make use of low paid but also low productivity women workers. It is by no means certain that costs are necessarily reduced by this process. If women’s earnings are relatively higher, these firms will be persuaded to . . . make more use of male labour or increase the efficiency [of] . . . their female labour.Footnote 53
However, it was also noted that some low productivity sectors with very high female/male ratios and low wage rates, such as clothing and electronics, might see further increases in the cost pressures they were already facing from lower-income countries.Footnote 54
The report’s conclusions, based on the most conservative (i.e., highest cost) assumptions, were that the upper limit of the rise in the national wages/salary bill would be 5 percent over the implementation period, representing an average increase in women’s earnings of about 25 percent, with manual workers in manufacturing having the largest pay gains. However, it was not improbable that the additional wage bill would be only 3 percent. The CBI asserted a higher upper limit of 6 percent, claiming that in some industries the figure could be up to 25 percent.Footnote 55 Manufacturing costs were predicted to rise by 4 percent or less, though some sectors, such as clothing, pottery, and electronics, would be much more heavily impacted.Footnote 56 It was concluded that equal pay would be unlikely to significantly increase aggregate unemployment, though it was likely to increase the number of women available for employment, while decreasing the growth of job opportunities for them—though, presumably, the remaining job opportunities would be better ones. Similar conclusions were reached even for the Development Areas (areas of high unemployment in Britain’s declining regions).Footnote 57
On September 25, 1969, Castle informed the cabinet that she proposed to introduce a bill to phase in equal pay by the end of 1975—a compromise between the two-year period pressed by the TUC and the nine years that the CBI wanted for full implementation.Footnote 58 Both the TUC and CBI had emphasized the desirability of allowing firms and sectors to make their own arrangements in moving to equal pay. The legislation would provide a framework for negotiations before they were compelled to act in 1975.Footnote 59
Section 1 of the Equal Pay Act 1970 came into full operation on December 29, 1975, with an intermediate stage on December 31, 1973, when women would be entitled to receive treatment that ensured orderly progress toward full equality.Footnote 60 Employers were required to offer equal pay, terms, and conditions for work of the same or broadly similar nature; or that, though different, had been assessed of equal value under a job evaluation scheme.Footnote 61 Meanwhile, a private members bill on sex discrimination by Baroness Seear was referred to a House of Lords select committee, which found compelling evidence of widespread malpractice. The Conservative government drew up proposals in 1973, which were extended by the 1974 Labour government, in the white paper Equality for Women. Footnote 62 This formed the basis of the 1975 Sex Discrimination Act, which prohibited unequal treatment in nonpay aspects of employment, such as hiring, promotion opportunities, job transfer, training, and dismissal procedures, enforced by the Equal Opportunities Commission.Footnote 63 Its powers included conducting formal investigations and, where appropriate, issuing legally enforceable nondiscrimination notices.Footnote 64
Workers could take complaints to industrial tribunals and appeal a tribunal’s decision to the Employment Appeal Tribunal. Meanwhile sections 3, 4, and 5 of the Equal Pay Act enabled referral of discriminatory wages agreements, wages orders, or pay structures to the Central Arbitration Committee to amend or remove. Given that “material differences” between jobs were hard to codify, the tribunal system played a key role in interpreting cases and setting precedents. However, most commentators argue that the1975 Sex Discrimination Act (hereafter SDA) was much less important in equalizing pay than the Equal Pay Act.Footnote 65 The specific impacts of SDA on the firms that the London School of Economics’ Equal Pay and Opportunity Project (EPOP) investigated were found to be minimal.Footnote 66 However, despite its limitations, the SDA did substantially increase job opportunities, for example by compelling employers to open up their training programs to women.Footnote 67
While women’s earnings grew faster than men’s from 1970 to 1976, in 1976 they were still only 64.3 percent of average male earnings.Footnote 68 Many companies found ways around the Equal Pay Act, such as changing mixed gender jobs into single gender jobs, the inclusion of additional job content for men to maintain pay differentials, moving women workers to minimum-grade jobs rather than the appropriate grade for their work, and tightening women’s piecework rates in order to recoup higher basic rates.Footnote 69 These abuses were at least partially curbed by the Equal Pay (Amendment) Regulations of 1983, to comply with a European Court of Justice ruling that the United Kingdom was in breach of the European Union’s equal pay directive. Women were granted a statutory right to equal pay for equal value, rather than the previous weaker definition of equal pay for “like work” (that is, substantially similar or “equivalent” work). Equal value was defined as work that was similarly demanding in terms of factors such as effort, skill, and decision making.Footnote 70
Turning the Law of Supply and Demand on Its Head? Female Earnings and Employment under the Equal Pay Act
There was relatively little public controversy regarding the Equal Pay Act, probably reflecting the wide diffusion of equal pay legislation in other Western nations. Moreover, the government had published its research into the estimated costs and impacts,Footnote 71 and the legislation was to be phased in over five years. In 1970, Sloane and Chiplin provided the most detailed academic analysis of its likely impacts. They argued that higher women’s wages would probably lead to substantial substitution by men and machines and that “viewed dynamically, both from their own and the firm’s viewpoint women offer poor [training] investment prospects and hence tend to congregate in lower-skilled occupations, further depressing the wage rate.”Footnote 72 Meanwhile, married women might react to higher wages by working fewer hours and devoting more time to their household duties. Thus, they argued, the Equal Pay Act might simultaneously reduce both the demand for and supply of female workers.Footnote 73 However, they acknowledged that it was “theoretically possible to raise the female wage rate . . . without creating female unemployment,” owing to elements of monopsonistic or segmented labor markets.Footnote 74
Three years later, two leading Dual Labor Market theory economists, Nicholas Bosanquet and Peter Doeringer, argued that the Equal Pay Act would accentuate labor market duality by increasing the proportion of “women only” jobs and (by implication) overall male/female earnings differentials, while also indirectly reducing incentives for training:
Equal pay legislation may well increase the number of occupations that are segregated by sex. Where piece-rate and individual incentive schemes are replaced by time rates, workers will become more interested in improving promotion opportunities through collective bargaining, in place of the system of economic advance through proficiency on a particular job.Footnote 75
The nonacademic press was relatively relaxed regarding the Act, compared to the later introduction of the National Minimum Wage. This author’s search of the online versions of the British broadsheet national newspapers found very limited coverage of the legislation and no strong condemnations of this intervention.Footnote 76 An October 1969 Economist article predicted that the Bill would not help poorly paid women, who would be substituted by more efficient male workers and driven back into all-women occupations. Conversely, professional women were predicted to benefit, as they, unlike their less skilled counterparts, were subject to “uneconomic discrimination.”Footnote 77
Neoclassical demand and supply analysis suggests that a rise in both women’s relative wages and employment following equal pay legislation could only be explained by an unrelated upward shift in the demand curve for women’s labor—due to either women suddenly becoming more productive or, more plausibly, by the greater relative growth of high female employment sectors as compared to male-dominated sectors. While some economists have retrospectively suggested that this explains Britain’s successful introduction of equal pay, very few economists, if any, contemporaneously predicted this in the run-up to the Equal Pay Act.
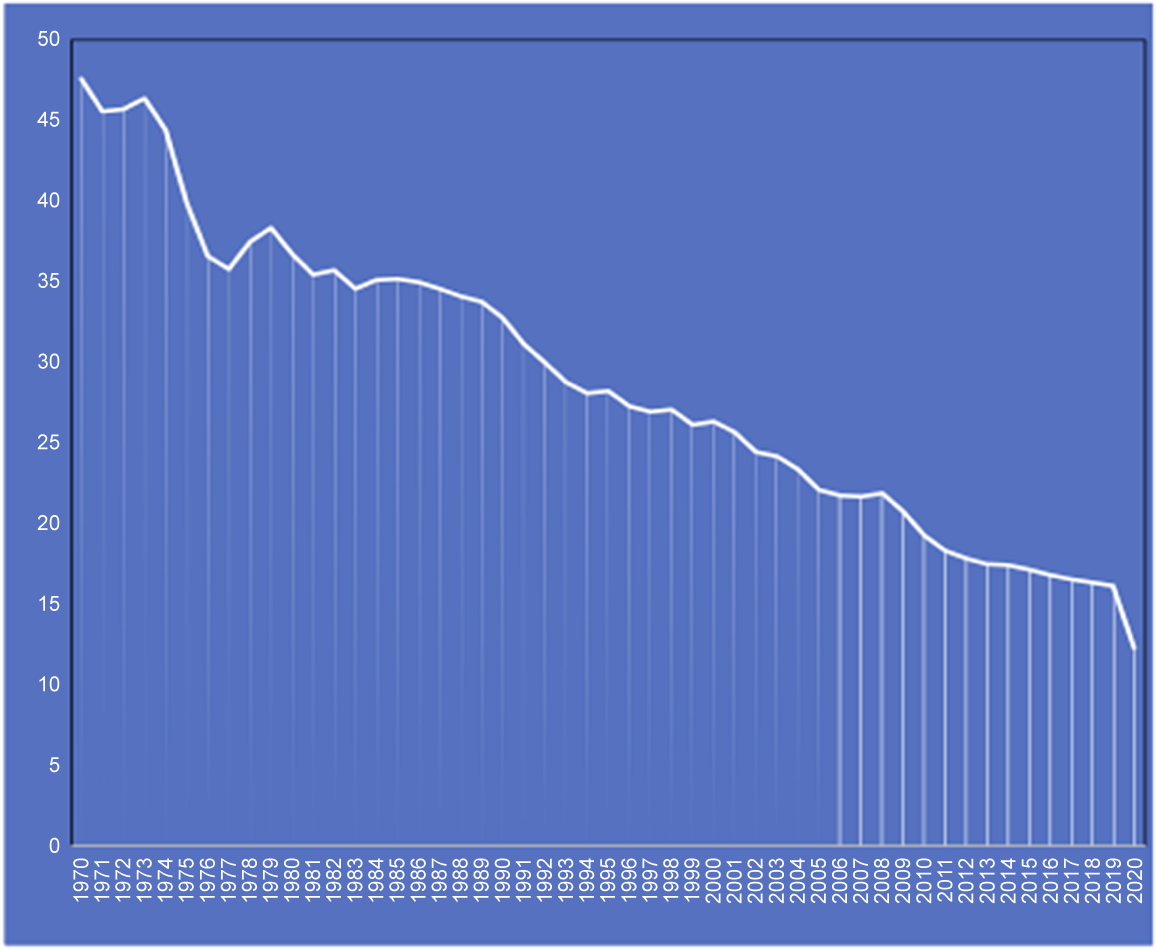
In the event, the theoretical possibility noted by Sloane and Chiplin—that a frictionless labor market was an illusion because of distortions that made even the sign of the changes in female pay and employment impossible to predict by such analysis—proved to be the most likely explanation for equal pay coinciding with both higher women’s employment and incomes. The gap between female and male mean earnings narrowed markedly between 1970 and 1976, after being broadly static over the 1950s and 1960s (Table 3). Moreover, this proved the start of a long-term reduction of male/female earnings differentials, as shown in Figure 1. From 1971 to 1976, women’s relative hourly earnings rose by 15 percent (mainly over 1973 to 1975) for both manual and nonmanual workers, in contrast to a prolonged period of stagnant relative pay from the late 1950s to early 1970s. Moreover, this was accompanied by an 11 percent rise in female relative employment, concentrated among part-time workers.Footnote 78
Raw gap between female and male mean earnings as a percentage of male earnings
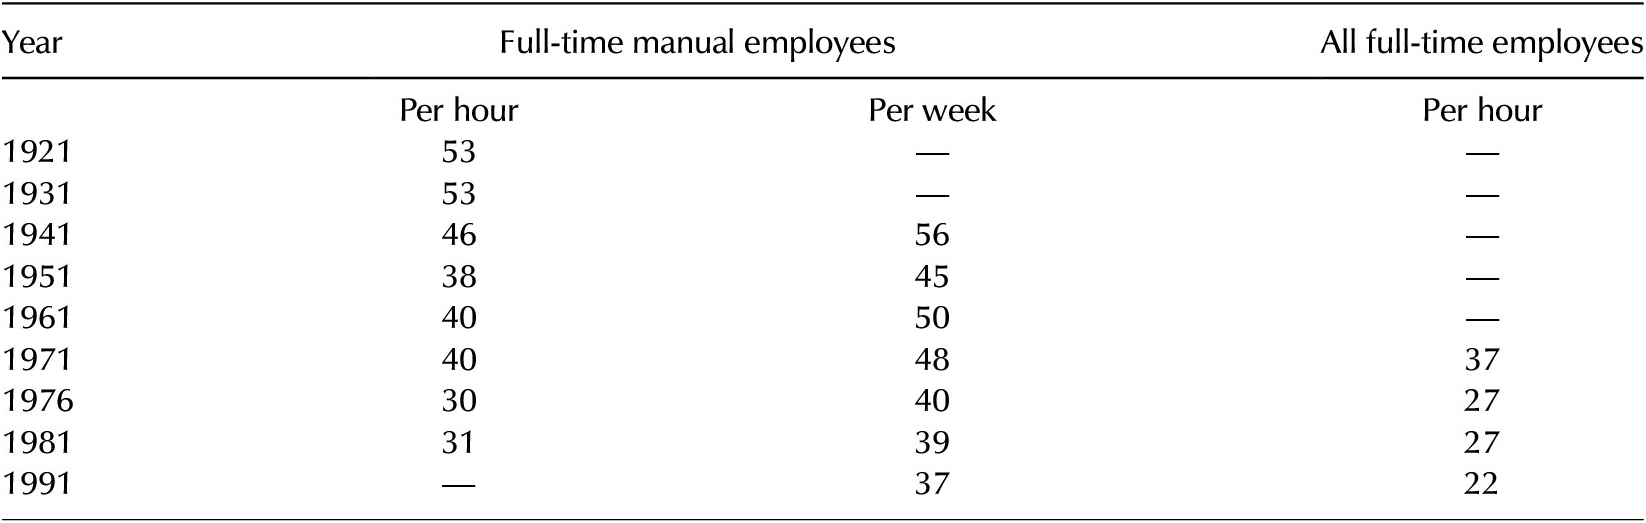
Source: Bryson et al., “Gender Wage Gap in Britain,” 838.
The UK gender wage-gap ratio, 1970–2020.
Source: Organisation for Economic Co-operation (2021), Gender wage gap (indicator), doi: 10.1787/7cee77aa-en (accessed September 1, 2021).
Note: Defined as the difference between median earnings of men and women relative to median earnings of men.
Relative female employment rose from 59 percent in 1970 to 72 percent in 1980 for numbers employed, and from 43 percent to 53 percent in terms of hours.Footnote 79 Over 1971 to 1977, activity rates for women aged 20 to 64 rose from 52 percent to 60 percent, then stabilized at this rate in the late 1970s, followed by a more gradual, longer-term rise from the 1980s (Table 4). Married women’s activity rates grew more sharply, from 46.8 percent to 57.0 percent from 1971 to 1977, also stabilizing in the late 1970s before resuming a slower upward trend, while the ratio of female/male aggregate hours worked also rose.Footnote 80 Meanwhile, unemployment, which had been roughly equal for men and women in the early 1970s, diverged during the mid-1970s, with women having lower unemployment rates despite rising relative earnings.Footnote 81 However, there was a growing gap between women’s full-time and part-time pay rates, suggesting that secondary labor markets persisted largely by drawing on part-time female labor.Footnote 82
Activity rates for women aged 20 to 64 and aggregate female/male hours worked, 1901 to 1980
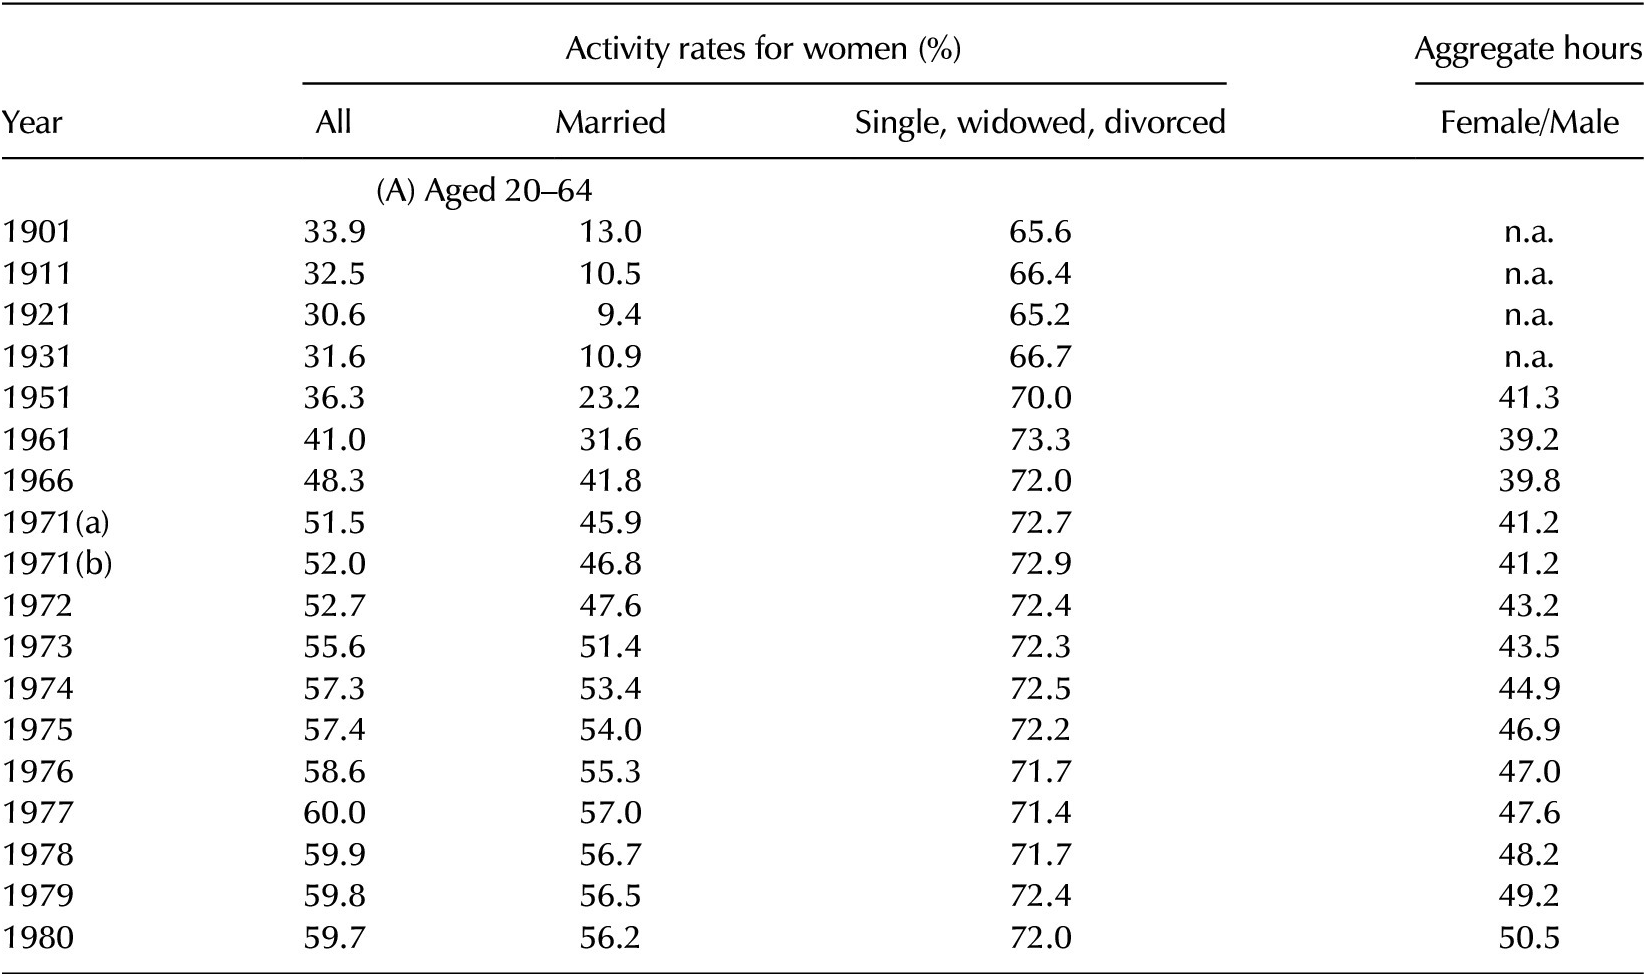
Source: Joshi, Layard, and Owen, “Why Are More Women Working in Britain?” S151, S171.
Notes: Activity rates 1901–1971(a) are based on Census data (1901–1931, England and Wales only; 1951–1971, Great Britain); 1971(b)–1980 are based on data from the Department of Employment Gazette, adjusted to exclude students.
Most traditional labor economics models assume that employment is demand-determined, at least after a large positive wage shock, implying that equal pay legislation should have reduced the relative employment of women. An early study by Chiplin, Curran, and Parlsey found that changes in working hours and in the industrial, occupational, and age distribution of the workforce only explain a small proportion of the increase in female/male earnings from 1970 to 1976.Footnote 83 However, this was challenged by Borooah and Lee, who argued that structural change in favor of sectors with higher female/male ratios explained most of the rise in women’s relative earnings and employment, an argument partially supported by Sloane and Theodossiou.Footnote 84 These findings were in turn challenged by Alan Manning, who argued that the evidence for any significant upward shift in the demand curve for female labor was not convincing, and the rise in female employment could be much better explained in terms of imperfect, monopsonistic, labor markets.Footnote 85
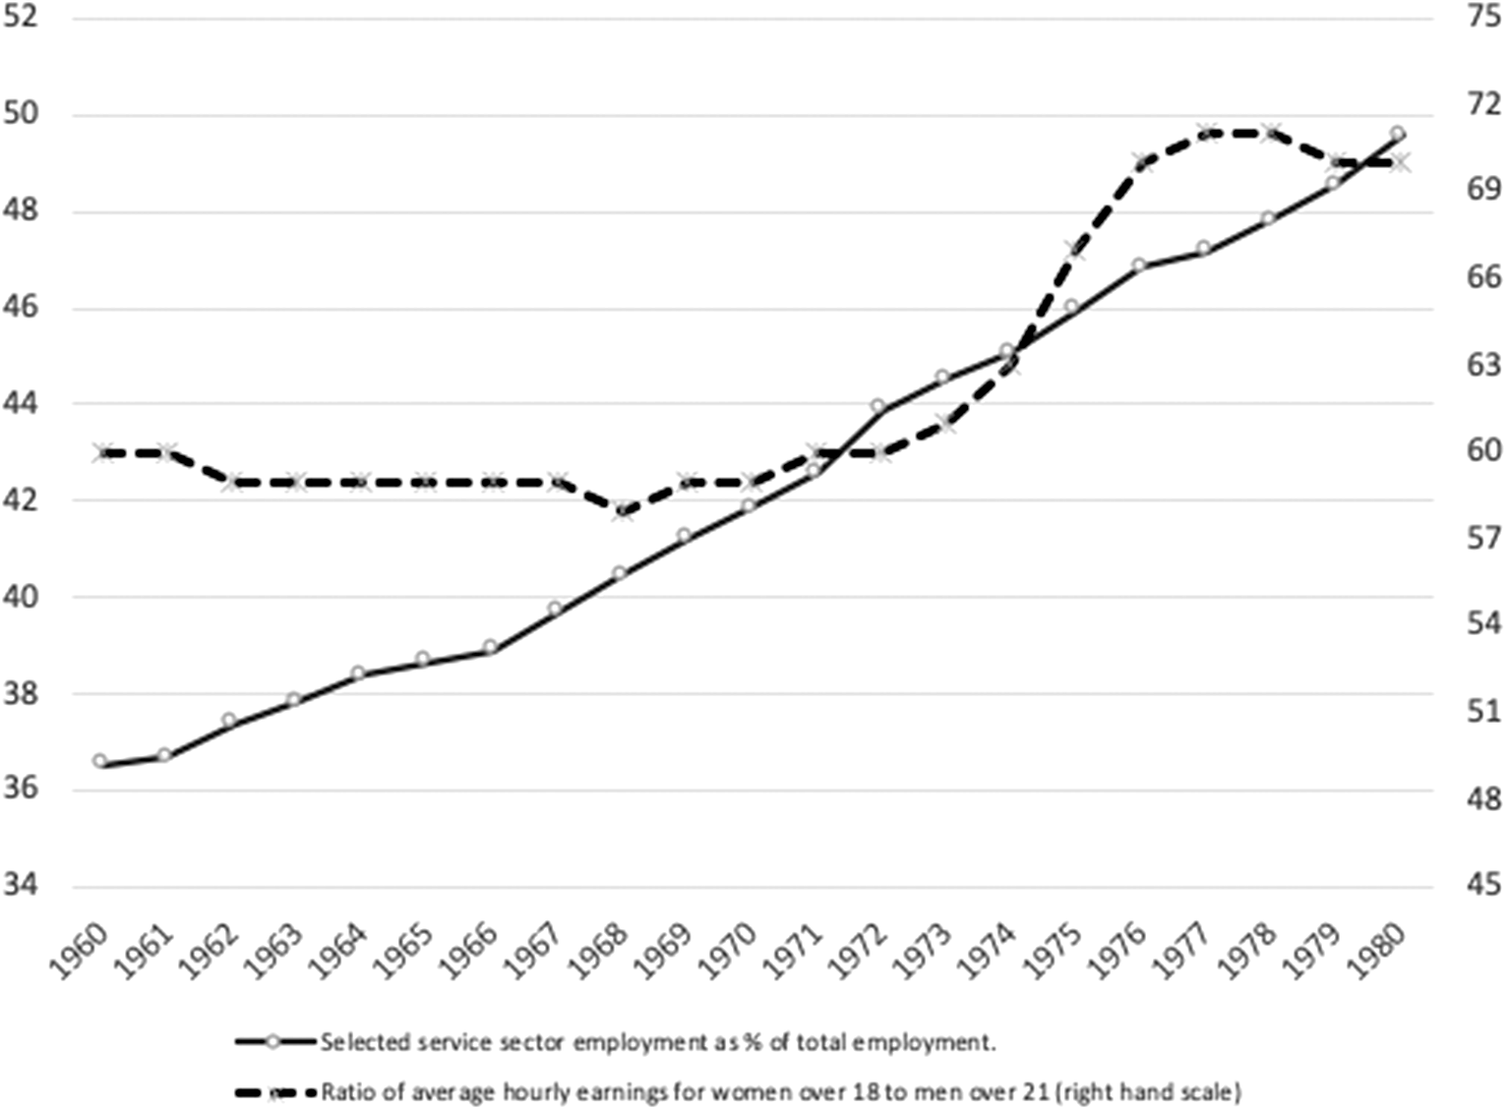
Rising relative female employment in high female-employing service industries was a long-term phenomenon of the twentieth century but had not raised female relative earnings prior to the 1970s.Footnote 86 Therefore, for a rise in the female labor demand curve to explain a rise in female employment, despite higher wages, would require a substantial shift in the trend growth of the main female employing sectors.Footnote 87 The contribution of female workers to the total workforce of these sectors is shown in Figure 2. These sectors include retail and wholesale distribution; insurance, banking and finance; professional scientific and technical services (including education and health); and miscellaneous services, including hotels and catering. The analysis excludes public sector workers (given that many already had equal pay), but their inclusion would not change the pattern of essentially linear growth in these sectors’ proportion of total employment from 1960 to 1980 (Figure 2). The average cumulative increase in the proportion of employment accounted by these sectors was 1.017 percent annually over 1971 to 1977, only marginally higher than its average growth rate of 1.015 percent from 1960 to 1980. Meanwhile, traditional female industries such as clothing, textiles, and pottery continued their long-term secular decline and could not account for this expansion. The rising female demand curve explanation thus appears implausible.
Proportion of total employment accounted for by the main private sector service industries with high female employment ratios and the ratio of female/male hourly earnings for all workers, 1960–1980.
Sources: Employment: Bank of England, “A Millennium of Macroeconomic Data for the UK dataset,” version 3.1, field A53, accessed September 24, 2021. Hourly earnings: Joshi, Layard, and Owen, “Why Are More Women Working in Britain?” S158.
The absence of any significant rise in unemployment was in line with the government’s inquiries regarding the impacts of equal pay legislation in other nations, as discussed above, and with the impacts of later National Minimum Wage (NMW) legislation in Britain and elsewhere. Equal pay is similar in nature to an NMW in that it raises minimum earnings. Females accounted for almost three-quarters of those impacted by the initial British NMW, with part-time female workers accounting for over 50 percent of those covered.Footnote 88 In contrast to the Equal Pay Act, the NMW was introduced in a much more polarized political climate, with economists and economic consultancies routinely lobbying against “interventionist” government policies. The consultancy Business Strategies forecast that Britain’s NMW would cost 80,000 jobs, while the monetarist economist Patrick Minford put the figure as high as 250,000.Footnote 89 Subsequently, its employment impact was estimated from very low to slightly positive, while impacts higher up the wage distribution were minor, with no significant earnings spiral.Footnote 90
This outcome is again consistent with labor market imperfections such as monopsonistic or segmented labor markets. It is unlikely to have been due to unrelated labor demand factors, given the shorter time window for the NMW’s introduction compared to the Equal Pay Act, which should have enabled commentators to factor in trends that might impact on their estimates.Footnote 91 The lack of a substantial negative employment impact has been explained in terms of direct and indirect changes in female workers’ behavior following the legislation, such as higher worker productivity and reduced labor turnover (and associated costs).Footnote 92 Inferring causation from association is problematic, but given the large number of “natural experiments” in equal pay and NMW legislation that yielded positive or insignificant employment impacts, the cumulative evidence appears very strong. A particularly interesting natural experiment was the 1992 minimum wage increase in the state of New Jersey from $4.25 to $5.05 per hour. Comparisons of employment in fast-food restaurants in New Jersey and neighboring Pennsylvania, where the minimum wage was held constant, found no evidence that it reduced employment, despite New Jersey being in a recession at the time.Footnote 93
Fortunately, British policymakers had largely ignored labor market modeling when assessing the likely impacts of equal pay, turning instead to survey methodology and the rich evidence available from West European and North American nations that had already introduced similar legislation. Evidence assembled for the 1965 interdepartmental working party on equal pay, via overseas Labour attachés, was “virtually unanimous: that the implementation of equal pay . . . abroad had virtually no effect on participation rates.”Footnote 94 A follow-up study in 1969 for West European nations also found no evidence of significant increases in unemployment after equal pay legislation.Footnote 95 Meanwhile, evidence regarding equal pay in the UK’s nonindustrial public sector indicated that female Civil Servants’ low wages largely reflected convention rather than any innate gender productivity differences, implying that significant unemployment would be unlikely.Footnote 96
These results are best explained by imperfections in the labor market, including monopsonistic employers, labor market segmentation, and discrimination. These models predict that equal pay is likely to raise earnings (thus removing the exploitative element of lower-wage rates) without significantly reducing female employment. The lack of a substantial employment response to the introduction of equal pay provides strong evidence of labor market imperfections. As Manning noted: “The position that the labour market was in a competitive equilibrium both before and after the Equal Pay Act is unsustainable.”Footnote 97
Monopsony does not have to be absolute (e.g., the “company town” model); it is present in any situation where the elasticity of labor supply to the firm is not zero. Several studies have proposed monopsonistic labor markets (especially for women) as the solution to the paradox of equal pay legislation not creating unemployment.Footnote 98 Female labor markets are likely to be substantially more monopsonistic than male labor markets, as married women’s job search and mobility are particularly constrained by both family circumstances (such as housework and child care) and transport limitations, especially before the 1980s, when two car households were uncommon. Moreover, house location choices are mainly determined by the travel to work journey of the household’s primary earner, rather than the convenience of secondary earners.Footnote 99
Another key feature of female labor markets is segmentation. Labor segmentation theory envisages the labor market as a number of submarkets with very limited movement of labor between them. Labor markets can also be segmented within firms. The most widely used segmentation model is the Dual Labor Market (DLM) model, in which labor markets are divided into two essentially distinct segments: the primary and the secondary sectors. Primary sectors provide relatively good pay and conditions, with earnings sometimes based on seniority to reduce turnover of skilled staff; offer some degree of protection from labor market forces; and provide internal on-the-job training and career advancement, following specific “progression ladders.” Training represents a corporate investment in the primary workforce and thus provides both an incentive to keep workers, even when operating below capacity, and a rationale for clear promotion paths to incentivize workers not to leave voluntarily.
Conversely, secondary sector workers are lower paid, with poorer work conditions, lower training, and very limited advancement prospects. Secondary markets are also typically less stable with high labor turnover. Thus, workers who do not expect to have long careers are more attractive because their low skills and high turnover make them cheaper to employ.Footnote 100 For example, Chiplin and Sloane’s analysis of the 1970 New Earnings Survey found that females had substantially flatter lifetime earning profiles than males, suggesting limited promotion prospects. Female earnings progression flattened out after the 25–29 age range as compared to the 30–39 age range for male manual workers and the 40–49 range for male nonmanual workers.Footnote 101
British labor markets were traditionally highly segmented by gender, based on an expectation that women would permanently leave work upon marriage. This made gender an ideal “screening device” for market segmentation. The EPOP found evidence of labor segmentation by gender. For example, one company “specified different and higher entry requirements for boys . . . because it was assumed that boys would pursue a career in the industry while girls would do the bulk of the low-grade, repetitive clerical work.”Footnote 102 They also found that skilled jobs typically required completing apprenticeships, thereby restricting them to time-served workers, segmented by gender.Footnote 103 DLM theory implies that equal pay would generate only a small substitution effect from women to men, as the factors that segment these markets by gender would protect female workers from replacement by males.Footnote 104
In addition to indirect discrimination by consignment to secondary labor markets, direct discrimination also appears to be a significant factor perpetuating gender wage differentials. Gary Becker modeled direct discrimination using the concept of a “discrimination coefficient,” a nonpecuniary element to monetary costs/rewards applied to the group discriminated against by employers, customers, and/or workers that does not reflect the perceived productivity of the discriminated group. Given that sectors involving frequent interaction with customers and clients typically had high female staff ratios, especially in customer-facing roles (for example, retail and office work) “Becker discrimination” from customers appears unlikely. However, there is strong evidence of Becker discrimination from male workers, who appeared to regard maintaining pay differentials with women coworkers as a key priority.Footnote 105
The importance male employees placed on defending pay differentials with female colleagues was repeatedly raised in discussions regarding the costs of introducing equal pay.Footnote 106 The EPOP noted several attempts by male workers to maintain gender differentials. In one case male workers went on strike over this issue, which was resolved by the company giving them a guaranteed 103 percent of women’s bonus earnings. In another, a man being placed on the same grade as women workers prompted the male workers on that grade to demand transfers to a higher grade.Footnote 107 Some male workers also used their control over wage bargaining to negotiate more favorable incentive schemes or rates for male-dominated departments via job upgrading, changing job titles, and/or additional bonus pay.Footnote 108
Realizing the True Worth of Female Labor
As George Clark noted, female labor supply cannot be treated as a discrete subject.Footnote 109 For example, married women’s labor supply interacts intricately with labor demand; married women’s “unemployment” having a different economic and social meaning than male unemployment. There is no simple “supply” of married women seeking work, as many are looking for “suitable” employment and, if this is not available, might decide to devote their time to the household and/or voluntary sectors, opting out of the “labor supply.” This is reflected in major historical differentials for married women’s workforce participation rates, compared to rates for single or divorced women, with many more women being potentially “active” in the labor market should suitable and convenient work be available. Moreover, factors such as whether available work is regarded as fulfilling and of suitable status are much more important in determining married women’s activity rates than men’s.Footnote 110
During the interwar era, women typically left work on marriage (except in a few sectors, such as textiles), reducing women’s work to an activity that filled the gap between school and marriage, rather than a “career.” This facilitated their segmentation into secondary labor markets. While primary labor markets are created to retain workers with scarce and valuable enterprise-specific skills, developed via on-the-job training, secondary sector jobs “are, above all, jobs in which there is a low investment in human capital.”Footnote 111 Baron and Norris identified five main attributes that typically define secondary workers: dispensability (i.e., the ease with which an employee can be removed from a redundant job); clearly visible social distance; little interest in acquiring training; low “economism” (i.e., the relative importance a worker places on monetary rewards), and lack of solidarity.Footnote 112
An important feature of secondary workers is high voluntary turnover. A 1930 official study noted: “The industrial life of women is, in general, a short one. This makes them unwilling to spend much time on . . . training . . . For the same reason, managers are unwilling to train up [women] workers for skilled occupations.”Footnote 113 Social pressures to quit employment on marriage were reinforced by employers’ “marriage bars”—compulsory redundancy on marriage. Marriage bars increased the dispensability of women workers by providing a relatively uncontroversial means of getting rid of older women workers on adult wage rates who could be replaced by juveniles on much lower “girls” rates.Footnote 114 Marriage bars became less important during the postwar era—mainly owing to tight labor markets—but were only finally outlawed by the Sex Discrimination Act.
Over the postwar decades, women’s labor market behavior changed in ways that made the “pin money” view of their work unrealistic, owing to rising educational qualifications, longer working lives, and shorter career breaks. Changing social norms, together with innovations such as new “labor-saving” homes, consumer durables, easy-clean fabrics, processed food, and better childcare facilities, substantially shifted the relationship between labor market participation and marital/family circumstances. Helen McCarthy’s study of working wives identifies the emergence of a new moral economy of working motherhood during the postwar decades, with women looking to part-time work not only as a source of extra income but also as an opportunity and a relief from the home and the “meaninglessness of middle age” by spending time in the company of other working married women. However, the interviews she summarizes for working-class mothers generally made it clear that the wife’s income was a source of supplementary income and an enjoyable change from household duties rather than a career.Footnote 115
By the late 1960s, mothers doing some paid work was more widely regarded as “aspirational.”Footnote 116 While women born before 1914 typically left work on marriage and generally returned (if ever) only after their children became teenagers, women born after 1920 typically left the labor market on motherhood rather than marriage.Footnote 117 The diffusion of the contraceptive pill in the early 1960s and legalized abortion (from 1968) played important roles in enabling women to postpone parenthood and/or have fewer children. The total period fertility rate fell from a postwar peak of 2.94 in 1964 to 2.41 in 1970 and to 1.90 in 1980, remaining under 2.0 thereafter.Footnote 118
Career gaps due to motherhood also shortened. The rapid increase in working married women during the 1960s typically involved mothers with children aged 10 or older, while during the 1970s there was a growing trend for women to return more rapidly after the birth of their last child and, increasingly, between births.Footnote 119 This contributed to an increase in married women’s labor participation rates from around 10 percent in 1931 to 21.7 percent in 1951 and to 42.9 percent by 1971, without which overall labor force participation rates would have fallen and the working population would have stagnated.Footnote 120 Another rationale for women’s relegation to secondary labor markets, the gender gap in qualifications,Footnote 121 had also narrowed considerably, particularly for younger women. Women had caught up with men in terms of having any formal qualifications (academic or vocational) for birth cohorts from 1945 onward and—for birth cohorts from around 1960—had also closed the gap for tertiary qualifications. For birth cohorts from the late 1970s, women had higher qualifications on both these measures.Footnote 122 Career gaps owing to pregnancy also became shorter; by 1980, a quarter of all mothers reentered the labor force within a year of giving birth.Footnote 123
The growing proportion of women with qualifications beyond “0 levels” for later birth cohorts in 1979 is shown in Table 5, together with the declining proportion of women with no formal qualifications. The trend of converging qualifications for men and women has continued, removing the gender gap in educational attainment in the 2000s; women below age 55 are now more educated than men in the same age cohorts. Most of the convergence in earnings over the last twenty-five years can be explained by the closure of the education gap, while other policy initiatives to reduce male/female earnings differentials have had relatively little impact.Footnote 124
Highest qualifications for economically active men and women (percentage for each age group), UK, 1979
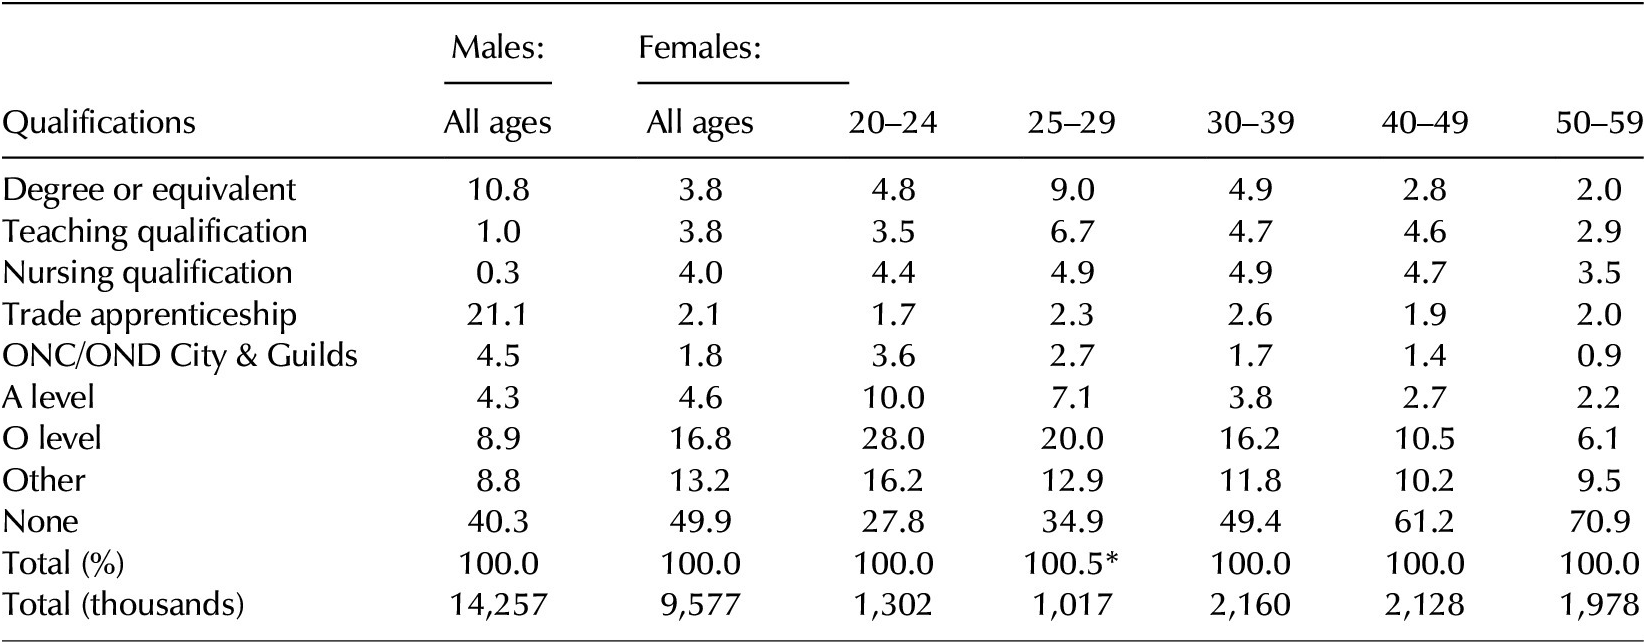
Source: LAB 8/3830, George Clark, “Female Labour Supply, A Review,” November 1981, 20, TNA (based on EC Labour Force Survey data).
Note: “Degree equivalent” includes first or higher degrees, HNC, HND, corporate or graduate membership of a professional institution. “Other” includes CSE below grade 1, other professional and vocational qualifications, still studying, not known, and not stated. *Error in the original source.
Nevertheless, secondary labor markets persisted during the 1960s and early 1970s, as long-standing conventions regarding job sex-typing and differential rates for men and women formed the basis of collective and statutory wage bargaining. Women consigned to secondary labor markets, with unattractive pay, conditions, and prospects, reasonably developed less “attachment” to their jobs than workers in primary labor markets that offered “careers.”Footnote 125 This may account for employers’ complaints regarding women workers’ relatively high absence and turnover rates and poorer time-keeping, together with an attitude that women should be allowed to work part-time and take holidays when convenient for their family, rather than when convenient for their employer. However, while the 1969 Interdepartmental Group on Equal Pay found that some employers thought equal pay would not improve such behavior, and might produce demands for reduced hours, others believed that equal pay would produce equal effort.Footnote 126
Equal pay effectively weakened the “lock-in” of women workers into secondary labor markets and the low attachment this fostered. Shirley Dex’s research on women’s attitudes to paid work from the 1940s to the 1980s identified a long-term trend of greater orientation toward work, reinforced by narrowing male/female educational differentials.Footnote 127 Individual employers were unable to break this lock-in, as they did not know how their female workforce would react to equal pay, without embarking on unilateral changes that might be difficult to reverse if they proved unsuccessful. The Equal Pay Act resolved this impasse, constituting a national experiment that compelled a collective switch to, or at least toward, equal pay.
The longer-term success of this transition is evident from the continued trend of growing female labor force participation, and the gradual, but still incomplete, reduction of male/female earnings differentials following the larger immediate impacts of the 1970s legislation. Moreover, Britain’s male/female earnings differentials declined not only absolutely but also in comparison to other Organisation for Economic Co-operation and Development (OECD) nations—with the United Kingdom moving from being a negative outlier to a country in the middle of the OECD gender gap league table by the early 2020s.Footnote 128 Indeed, given the rising quality of female labor (proxied by educational qualifications) prior to the Equal Pay Act, Britain’s status as one of the last West European nations to introduce any equal pay legislation may have impeded its postwar productivity and labor force growth, in contrast to the Treasury’s view that equal pay was a luxury Britain could not afford.
However, while women’s job opportunities and earnings differentials have substantially improved following the 1970s equal pay and antidiscrimination legislation, both male and female workers have since been adversely impacted by the “casualization” of the labor market. By the late 1990s, traditional internal labor markets were being replaced by “market-based” labor solutions such as de-layering, individualized rewards systems, outsourcing, pay structure fragmentation, and privatization of public services.Footnote 129 Since the late 1970s, the proportion of UK workers whose pay was subject to collective agreements fell from 77 percent to around 47 percent by 1990, while the proportion of unionized civilian workers fell from 53 percent in 1979 to 37 percent in 1990.Footnote 130 Thus, while British labor markets have become more equal by gender, other changes in labor market practices in the United Kingdom (and elsewhere) have acted to increase the precariousness of the job market.
Conclusions
Britain’s belated adoption of equal pay has several important implications for understanding the UK labor market. Labor market modeling has a very poor record in predicting the employment and other impacts of equal pay legislation or related labor market interventions, such as the NMW. This, in turn, is most convincingly explained by substantial labor market imperfections, such as monopsonistic employers, market segmentation, and outright discrimination, together with wage-bargaining systems—especially for lower-wage industries—that often perpetuated traditional male/female wage differentials. Collectively, these market distortions prevented the growth in women’s relative human capital, as proxied by qualifications, over the 1950s and 1960s, as reflected in their relative pay. Therefore, regulation for equal pay and, later, minimum wages was not so much a “distortion” to a frictionless labor market as a partial “correction” to a very imperfect one. Equal pay also increased the female labor supply, given that (especially married) women’s labor supply is determined by complex interactions between labor demand and a “supply” of female labor strongly influenced by not only the availability of work but also its status and prospects.
This study also illustrates the advantages of an evidence-based approach, drawing on the experience of other nations or early adopter sectors in the same nation. Information on the impacts of equal pay overseas proved a much more accurate predictor of its impacts in Britain than either economic modeling or surveys of firms’ opinions, which were often contradictory and may have contained an element of bias against a reform that would require major changes in their workforce organization and pay structures. Given the unusually strong imperfections in labor markets, modeling struggles to deal with factors such as market segmentation, direct discrimination, and monopsonistic employers that can have a considerable impact on the magnitude, or even the sign, of the employment effect.
Finally, this study implies that Britain’s rejection of equal pay prior to the 1970s may not have improved its competitive advantage and probably damaged it by reducing productivity and workforce growth, preventing the optimal allocation of its formal and domestic workforce, and deterring women from undertaking investments in education and training. From World War II to the early 1970s, the United Kingdom suffered from labor shortages, with governments sometimes finding it necessary to deter job creation in some sectors, for example, via the Selective Employment Tax. Given the strong trends toward women returning to work after marriage and of narrowing gender differentials in educational and other qualifications, adoption of equal pay in the early postwar era—when France, Germany, and Italy made this transition—might have provided both a larger and more productive workforce. These findings also have contemporary policy implications; despite considerable progress since the 1970s, truly equal pay is still to be realized, owing to gender segregation in labor markets, barriers to equal pay for equal value, and discrimination in both hiring and promotion practices. The survival of such more subtle methods of gender discrimination in contemporary Britain (and overseas) has not only social but also economic disadvantages by preventing labor markets from achieving social and economic optimization.
Acknowledgments
Grateful thanks are due to the National Archives, Kew, for access to archives that were vital for this project. I am also very grateful to three anonymous referees for their advice; to Andrew Newell and Karina Pavlisa for comments on earlier drafts; and to the Henley Business School, International Business and Strategy seminar series participants, for comments on a presentation of this article. All errors and omissions are mine.
Supplementary Materials
To view supplementary material for this article, please visit http://doi.org/10.1017/eso.2022.44.


 Open access