




INTRODUCTION
Measurements of Δ14C in dissolved inorganic carbon (DIC) have been performed in the ocean since the 1950s (Stuiver and Östlund Reference Stuiver and Östlund1980; Nydal et al. Reference Nydal, Gulliksen, Lövseth and Skogseth1984; McNichol et al. Reference McNichol, Jones, Hutton and Gagnon1994; Graven et al. Reference Graven, Kozyr and Key2012). A large dataset of Δ14C in DIC (hereinafter Δ14C) exists with over 35,000 observations thanks to large oceanographic programs such as the Geochemical Ocean Sections Study (GEOSECS) and World Ocean Circulation Experiment (WOCE) as well as smaller oceanographic campaigns (McNichol et al. Reference McNichol, Key and Guilderson2022). Observations of Δ14C are to large extent available via data products or databases such as the CLIVAR and Carbon Hydrographic Data Office (CCHDO), and they capture the large-scale patterns of spatial and temporal evolution of radiocarbon over the recent decades. The information gained from investigating the changes in seawater Δ14C is highly valuable in many ways, including process understanding (e.g., ocean circulation; Toggweiler et al. Reference Toggweiler, Druffel, Key and Galbraith2019) and the assessment of ocean models (e.g., Graven et al. Reference Graven, Kozyr and Key2012; Frischknecht et al. Reference Frischknecht, Ekici and Joos2022).
The number of facilities capable of doing Δ14C measurements in DIC of seawater is increasing thanks to a greater availability of accelerator mass spectrometry (AMS) systems, and to improving carbon extraction and graphitization techniques. The Laboratory of Ion Beam Physics (LIP) at ETH-Zurich is among the laboratories that has recently expanded its facilities to process seawater samples and measure their isotopic carbon composition using the new ETH-LIP method (Casacuberta et al. Reference Casacuberta, Castrillejo, Wefing, Bollhalder and Wacker2020). LIP presented this method together with other groups during the workshop “Carbon Isotopes in the Ocean: Ensuring High-Quality Results” held in November 2021 (McNichol et al. Reference McNichol, Hansman, Key and Sonnerup2021). One major point of the workshop was that with the growing number of laboratories producing Δ14C data on DIC, it is critical to cross-check and stablish equivalences between methods. This was a pending task for the ETH-LIP method, as its performance is internally assessed on a regular basis, but the produced data were never formally cross checked against other laboratories.
Here we assess the comparability of Δ14C data produced at LIP by comparison to other observations in the North Atlantic Ocean. We present new Δ14C results of samples collected in the subpolar and subtropical regions between 2018 and 2020. First, we provide an accurate assessment of comparability by using duplicate samples collected for an intercomparison between LIP and the Woods Hole Oceanographic Institution’s National Ocean Sciences Accelerator Mass Spectrometry (NOSAMS) facility. Then, the new data from LIP are compared to previous deep water observations from GEOSECS, the Transient Tracers in the Ocean North Atlantic Study (TTO/NAS), and the CLIVAR and Global Ocean Ship-Based Hydrographic Investigations Program (GO-SHIP). For the intercomparison we used different storage and preservation techniques, with the NOSAMS samples using glass bottles and mercuric chloride and the LIP samples using foil bags and freezing. We show that the measurement at LIP of samples collected in foil bags and frozen produces reliable data, although there are logistical challenges with keeping samples frozen and the bags are more likely to be damaged than glass bottles.
METHODS
Cruises for the Collection of New Samples
The new 14C results presented in this study correspond to seawater samples that were collected during two cruises in the North Atlantic (Supplemental Tables S1 and S2).
The subtropical region along the GO-SHIP section A05 was sampled onboard the British RSS James Cook during the JC191 cruise in January–March 2020. Seawater was collected from several stations and at some of them duplicate seawater samples were collected for the intercomparison between LIP and NOSAMS. The seawater samples were collected from the water column using a CTD rosette that was equipped with Niskin sampling bottles.
The other new data we present is from one depth profile sampled in the northeastern Atlantic during a visit to the OVIDE line (GO-SHIP section A25) onboard the French R/V Thalassa in June 2018. There were no duplicate samples measured at NOSAMS from this cruise, but we compare the data with historical data from the deep ocean where Δ14C is likely to stay largely constant over decades.
Collection, Storage, and Preservation of New Samples
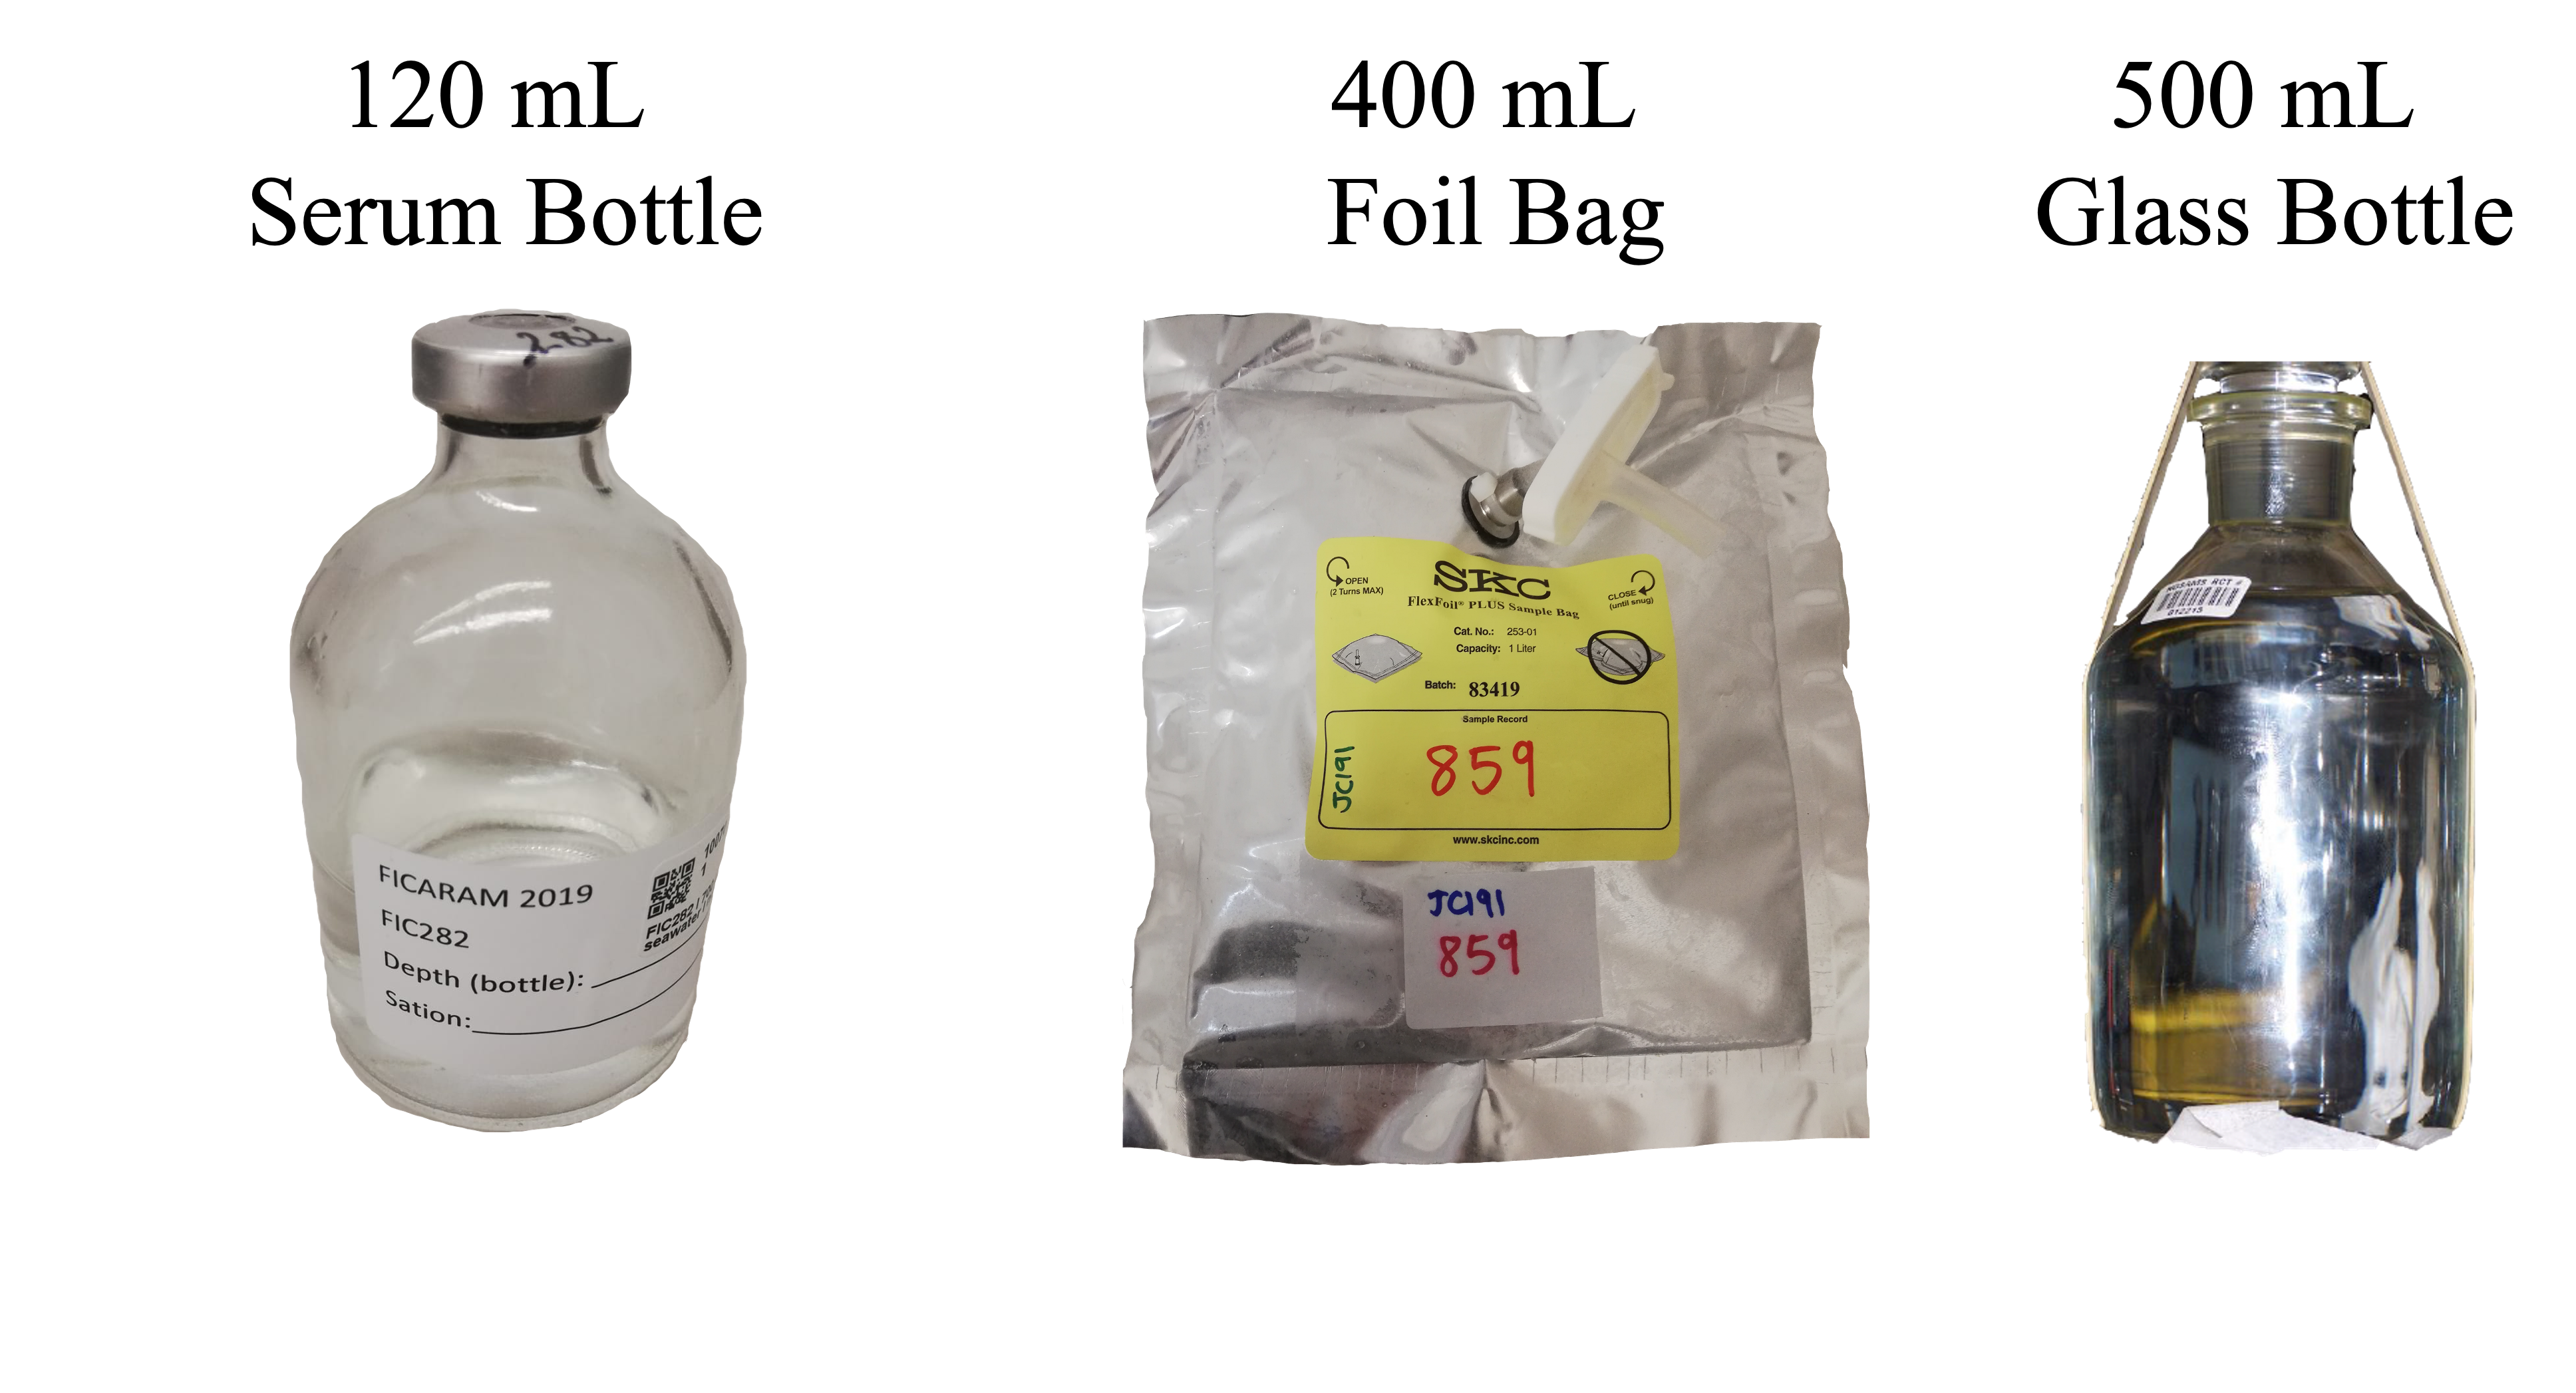
We used three different approaches for sample collection, storage, and preservation. Pictures of the different sampling bottles and bags can be found in Figure S1.
During the OVIDE cruise in June 2018, the samples were collected using 120 mL glass serum bottles that had been previously cleaned with 0.1 N HCl. The bottles were rinsed three times with the seawater sample before the water was allowed to overfill. Then, the sample was poisoned onsite with saturated mercuric chloride (HgCl2) solution to cease biological activity, and sealed using a rubber septum and an aluminum cap. Back at LIP, 60 mL of the original 120 mL sample was transferred to an identical empty and sealed glass bottle that had been previously flushed with helium (He) as detailed in Casacuberta et al. (Reference Casacuberta, Castrillejo, Wefing, Bollhalder and Wacker2020). This approach allows the determination of Δ14C in one subsample of 60 mL of seawater while keeping a second subsample in the original bottle as reserve.
During JC191 in January–March 2020, a total of 14 seawater duplicate samples were collected for the intercomparison exercise between LIP and NOSAMS. An additional 384 samples were collected and measured only at LIP. The sampling locations for the duplicate samples were strategically selected to revisit previous nearby Δ14C measurements from the A05 section in 1998 and to capture a range of depths (5–5500 m), locations (30 to 70°W) and Δ14C values. The samples for LIP were collected following Bryant et al. (Reference Bryant, Henley, Murray, Ganeshram and Shanks2013). Briefly, this technique uses foil bags of about 0.5 L capacity to store the seawater and does not require the chemical poisoning of the sample. Instead of poisoning, preservation is achieved by freezing the sample immediately after collection. Further sampling details can be found in the JC191 cruise report (Sanchez-Franks Reference Sanchez-Franks2020). The foil bags were shipped frozen to Imperial College London in June 2020 and stored in freezers at –20°C until they were shipped frozen to LIP in April 2021 and stored in freezers there at –20°C until analysis through May–July 2021. Foil bags were typically thawed overnight at room temperature the day prior to sample preparation. Once the bag was defrosted, the seawater was manually transferred using PVC tubing into one serum 120 mL bottle, as if one was sampling from a Niskin bottle. Each sample of 120 mL was divided into two subsamples as explained previously. The poisoning step was not necessary as the samples were processed on the same day, or at maximum, they were stored in the fridge for few days.
The collection of seawater for NOSAMS was done using 0.5 L glass flasks and saturated HgCl2 solution for poisoning. The sampling followed the recommended procedure exactly as stated in the guidance report of McNichol et al. (Reference McNichol, Quay, Gagnon and Burton2010).
Extraction of Carbon from Seawater and AMS Measurement
At LIP, seawater samples were processed using the ETH-LIP method described in Casacuberta et al. (Reference Casacuberta, Castrillejo, Wefing, Bollhalder and Wacker2020). Briefly, carbon isotopes were extracted from about 60 mL of seawater that were previously acidified with 800 μL of 85% H3PO4 and heated overnight at 60°C. An auto sampler extracts the DIC as CO2 from seven seawater samples in a row. The sample gas passes through a water trap and a Cu-Ag furnace before being trapped in the molecular sieve trap of the Automated Graphitization Equipment. The Cu-Ag furnace is used to remove traces of nitrogen oxides, halogens, and sulfur compounds that may poison the iron used as catalyst during graphitization. The CO2 is then transferred to a reaction tube and converted to graphite upon reaction with the added H2, heat and the iron catalyst at 580ºC. Finally, the graphite is pressed into targets for AMS. The overall quality of the method is assessed by means of blanks (Phthalic Anhydride and IAEA-C1), a coral used as reference material and the NIST SRM 4990C oxalic acid (OXAII), as detailed in Casacuberta et al. (Reference Casacuberta, Castrillejo, Wefing, Bollhalder and Wacker2020). The AMS measurements were conducted on the MICADAS MIni radioCArbon DAting System (Synal et al. Reference Synal, Stocker and Suter2007) which is equipped with He stripping (Schulze-König et al. Reference Schulze-König, Seiler, Suter, Wacker and Synal2011) and permanent magnets (Salehpour et al. Reference Salehpour, Håkansson, Possnert, Wacker and Synal2016). Each sample was typically measured for about 1.5 hour at C- currents of 60 mA until 700,000 14C counts were collected. The data reduction was performed using the BATS data evaluation program (Wacker et al. Reference Wacker, Christl and Synal2010), the OXAII for standard normalization and the Phthalic Anhydride for blank subtraction. The experimental uncertainty estimated from counting statistics, blanks, reproducibility of standards and replicate seawater samples was 1.6–2.6‰.
At NOSAMS an automated water stripping line was used to acidify and sparge with nitrogen the evolving CO2 from the seawater, which is then cryogenically trapped and purified. The extracted CO2 is reduced to graphite through the addition of H2, heat, and an Fe catalyst on automated graphite lines (McNichol et al. Reference McNichol, Jones, Hutton and Gagnon1994). All graphite was pressed into aluminum cathodes and analyzed on the Continuous Flow AMS system (CFAMS; Roberts et al. Reference Roberts, Burton, Elder, Longworth, McIntyre, von Reden, Han, Rosenheim, Jenkins, Galutschek and McNichol2010). In-house seawater and 14C-free groundwater reference materials are used to assess the quality of the extraction and graphitization process. Data are blank corrected following a formula that fits the observed mass dependency in measured fraction modern carbon of these reference materials (Roberts et al. Reference Roberts, Elder, Jenkins, Gagnon, Xu, Hlavenka and Longworth2019). The resulting experimental error for the intercomparison samples was 1.6–2.1‰.
Previous Observations of Δ14C
The Δ14C data produced at LIP will be compared to measurements on deep water samples from three other laboratories. All data used for the comparison are compiled in Supplemental Table S2.
Here we examine measurements on previous seawater samples in the North Atlantic, where the samples measured at LIP were collected. Samples collected in 1998 along 24.5°N in the subtropical North Atlantic (GO-SHIP section A05) were processed at NOSAMS following the same procedures described above. The full Δ14C dataset can be accessed through CCHDO (McNichol and Key Reference McNichol and Key2022). Samples collected in 1973 were analyzed by the Quaternary Isotope Laboratory at University of Washington (UW) (Stuiver and Östlund Reference Stuiver and Östlund1980). Samples collected in 1981 were analyzed by the Tritium Laboratory from the University of Miami (UM) (Östlund and Rooth Reference Östlund and Rooth1990). Both the UW and UM used 250 L Gerard barrels for the collection of seawater and proportional counters for the measurement of radiocarbon by its radioactive decay (Stuiver et al. Reference Stuiver, Robinson, Östlund and Dorsey1974; Östlund and Rooth Reference Östlund and Rooth1990).
RESULTS AND DISCUSSION
Results of the Intercomparison
The 14 duplicate samples measured at LIP and NOSAMS displayed a broad range of Δ14C (–130 to 50‰) as expected from the sampled depth range (surface down to 5500 m) and the locations along the A05 section (Figure 1). At LIP we generally processed two subsamples from each duplicate sample. We report (Table S1) and examine both the individual measured Δ14C and the weighted average Δ14C.
Δ14C in duplicate seawater samples of the intercomparison exercise. The results reported by LIP and NOSAMS are represented in three subplots to adequately represent the range of Δ14C values in shallow, intermediate, and deep and very deep waters. LIP usually processed two subsamples, except for sample #1 (one measurement) and sample #9 (three measurements). The results for each subsample are reported as “LIP single.” The corresponding weighted average is reported as “LIP average.” NOSAMS reported one value for each duplicate sample.

There is a very good agreement between the two laboratories (Figure 1). Most individual measurements (82%) reported by LIP were statistically identical to the NOSAMS value within one sigma uncertainty of 1.6–2.6‰, while the remaining 18% were comparable within two sigma. The comparison of NOSAMS values to the weighted average LIP value is slightly better, with 86% of Δ14C values falling within one sigma. Based on the limited number of duplicates, most LIP observations appear slightly lower (–1.4 ± 0.7‰) than the ones produced by NOSAMS (Figure 2). However, more duplicate samples will be needed to possibly confirm any systematic bias between the values reported by LIP and NOSAMS. Any possible offset is significantly smaller than the ±4.5‰, reported for the experimental error of Δ14C measurements in the GO-SHIP Repeat Hydrography manual for the collection and measurement of carbon isotopes in seawater DIC (McNichol et al. Reference McNichol, Quay, Gagnon and Burton2010).
Offset of LIP results with respect to NOSAMS in duplicate samples. Black circles represent the individual offset for each duplicate sample. The mean offset and the corresponding one sigma and two sigma uncertainties are represented, respectively, by the dotted line, and the dark gray and light gray shaded areas.

Deep Water Comparison
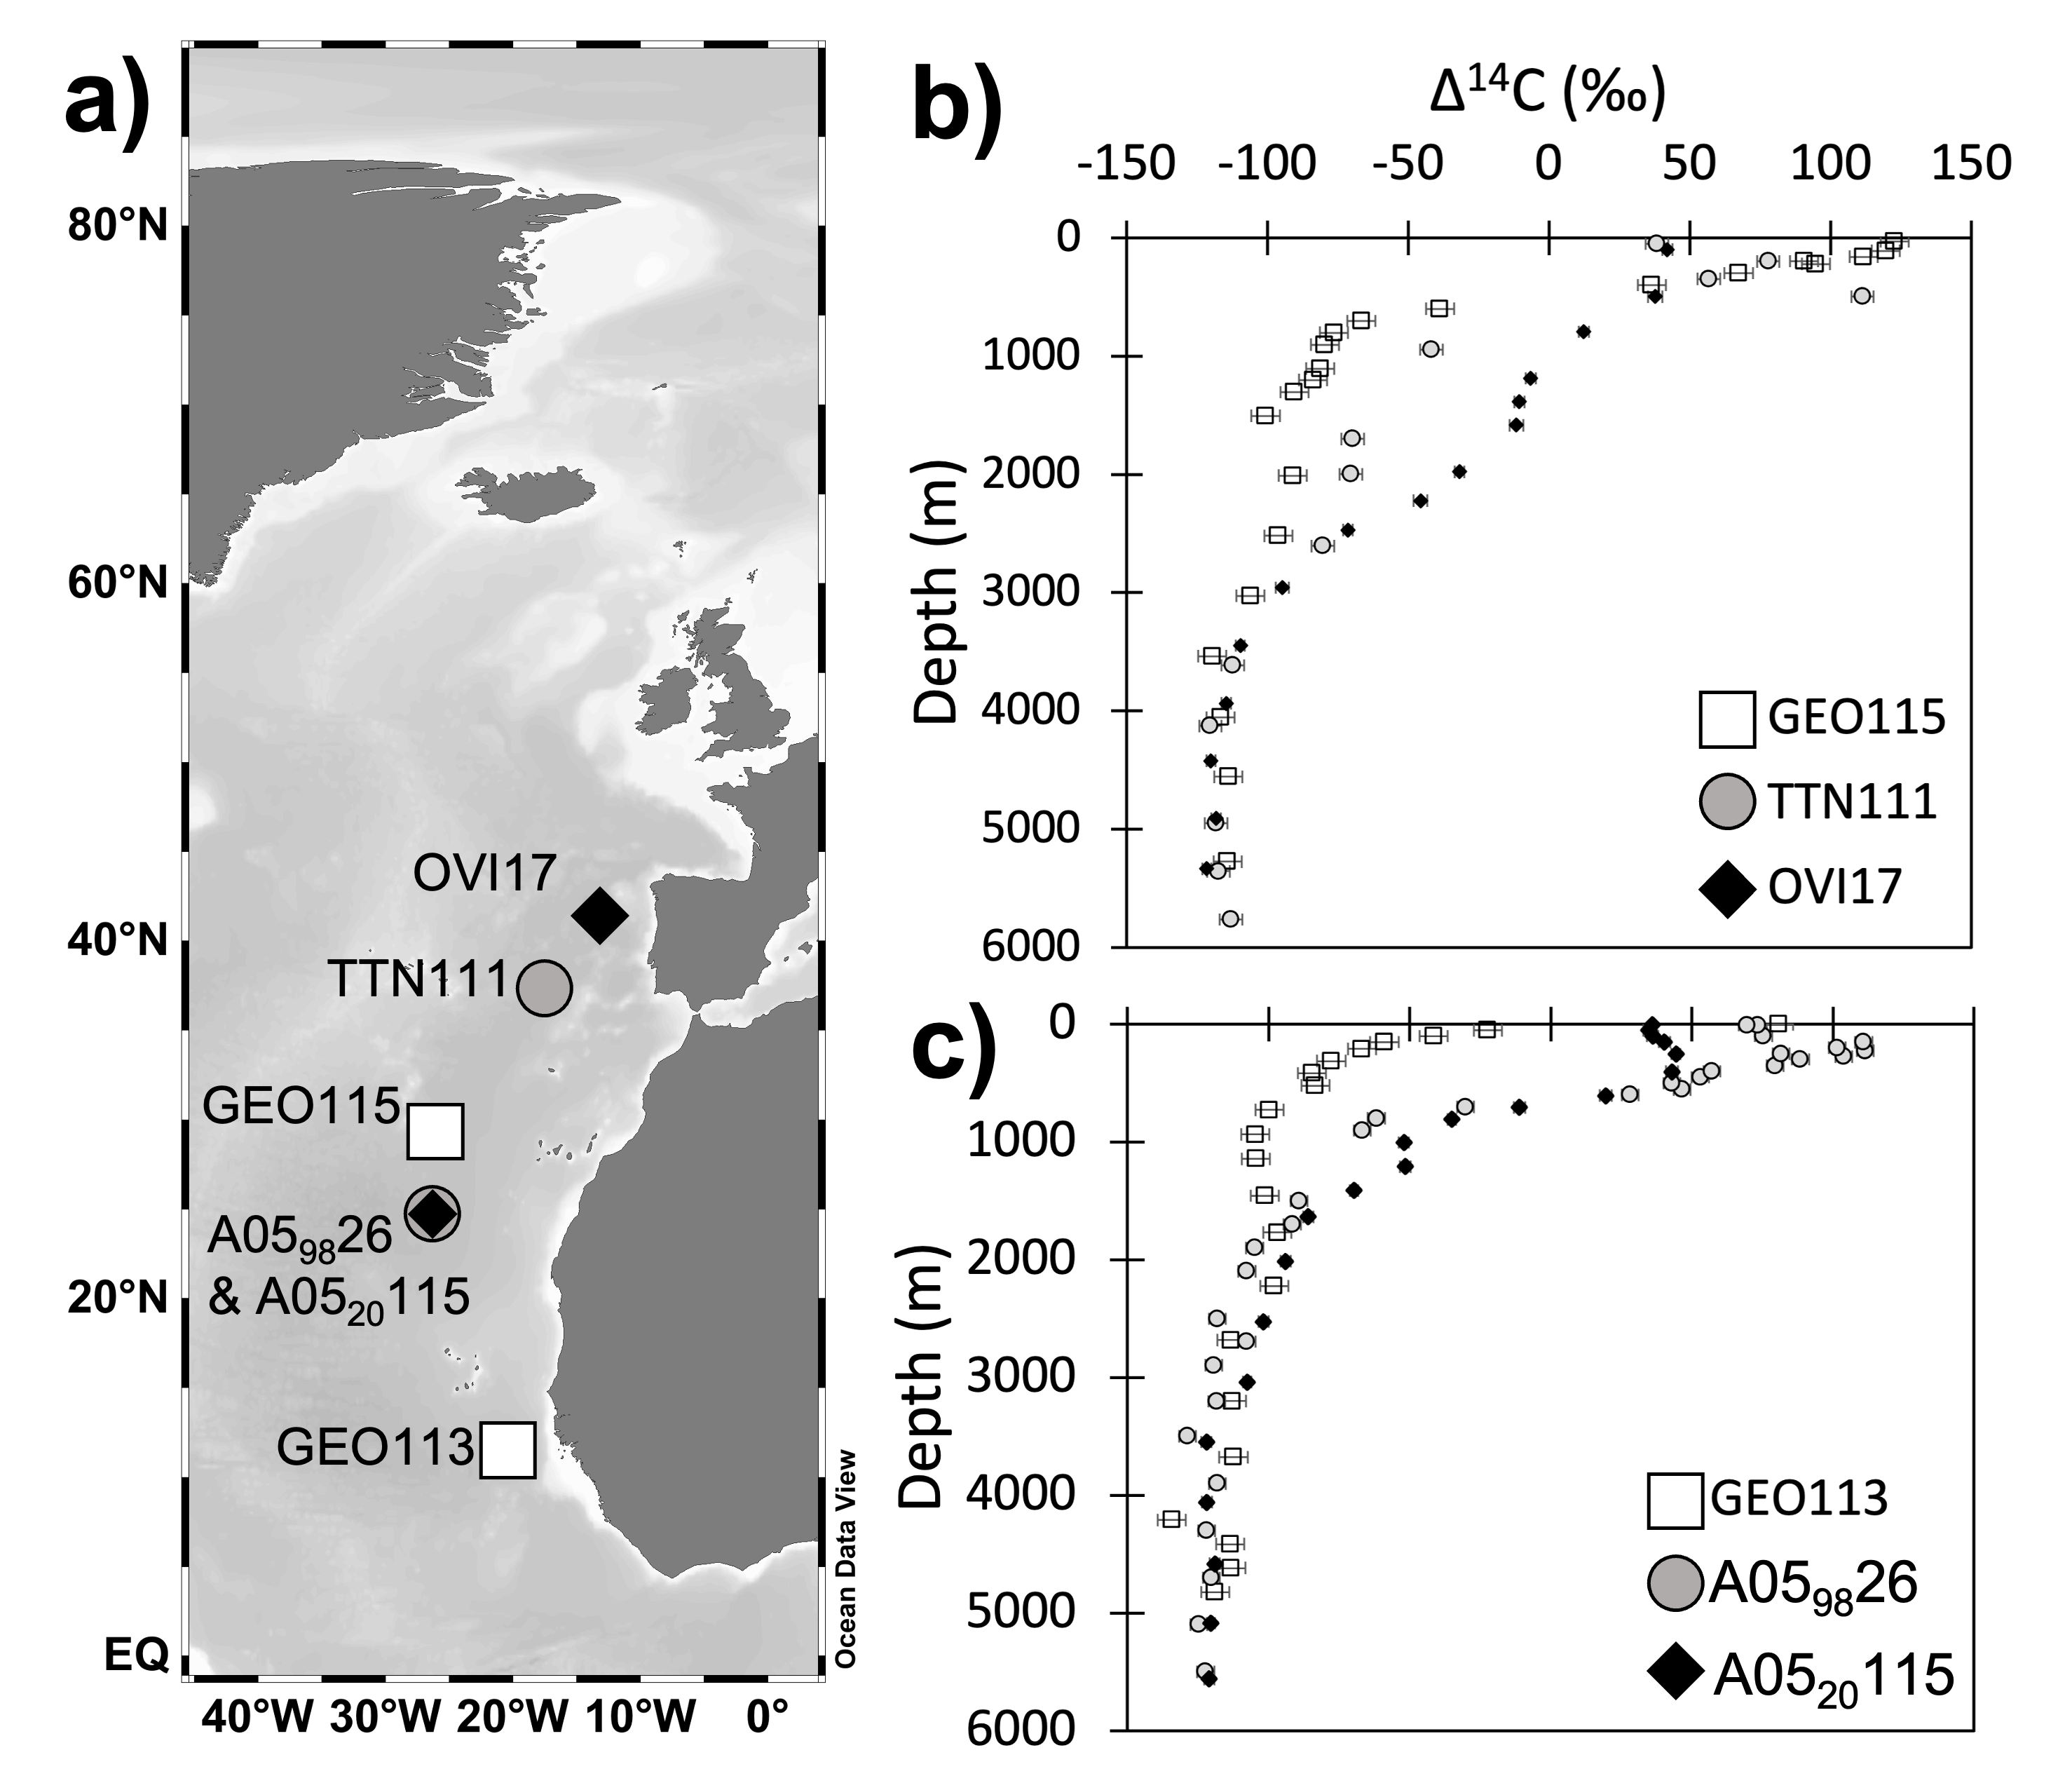
For the deep water comparison, we have selected six stations in the eastern North Atlantic basin because the abyssal depths of this region are dominated by old waters from the Southern Ocean. Thus, the influence of atmospheric nuclear weapon testing in these waters is most likely negligible (Östlund and Rooth Reference Östlund and Rooth1990) and Δ14C constant over time. The location and full depth Δ14C distribution of the selected depth profiles is shown in Figure S2. We restrict our comparison to depths of 3500–6000 m because shallower Δ14C values indicate the presence of bomb 14C that was either deposited on the sea surface or advected to shallow and intermediate depth layers by North Atlantic Central Water and North Atlantic Deep Water.
The upper panels in Figure 3 show six depth profiles of Δ14C measured by four different laboratories (UM, UW, NOSAMS, and LIP) during five sampling campaigns between 1973 and 2020. The measurements scatter around a mean value of about –120‰. As expected, the deep water Δ14C shows almost no change if one considers the uncertainty of individual measurements. The lower panels in Figure 3 show the variation corresponding to each Δ14C datasets versus the year of sampling. The measurements reported by LIP fall mostly within the previous range of observations. The lower left panel shows that the median of LIP measurements (–119.3‰) for year 2018 is slightly lower than for the datasets reported by the laboratories at UM for 1981 and UW for 1973. Yet, the median values of the three laboratories (–119.3 to –116.8‰) range within the experimental error (∼ ±4‰) of GEOSECS and TTO/NAS datasets. The comparison in the lower right panel shows a broader range for the median Δ14C (–122.5 to –114.9‰), where the value of LIP (–121.2‰) is in between the minimum and maximum of the datasets reported, respectively, by NOSAMS and UW. The direct comparison of data for 1998 and 2020 shows that this time, the NOSAMS mean Δ14C was 2.1‰ lower in comparison to measurements of LIP.
Deep water comparison of Δ14C. The upper panels show Δ14C measurements versus depth in deep waters at six nearby locations in the eastern North Atlantic Ocean (for detailed locations please see Figure S2). The plot in the left includes the three stations located in the 28.0–41°N latitudinal band, while the right plot includes the three southernmost stations located between 11 and 24.5°N. The lower panels show the corresponding variation for each set of data (minimum, first quartile, median, third quartile, and maximum). The acronyms of UM, UW, NOSAMS and LIP represent the four different laboratories that produced these Δ14C observations.

The measurements reported by LIP for year 2018 and 2020 correspond to samples collected using glass serum bottles and foil bags, respectively. Therefore, we conclude that LIP was able to reproduce previous deep water measurements independently of the sample collection and preservation technique used.
SUMMARY AND RECOMMENDATIONS
We have conducted the first inter laboratory comparison of Δ14C measured at LIP and NOSAMS and compared North Atlantic deep water Δ14C measurements of LIP to previous observations by UW, UM, and NOSAMS. The intercomparison with NOSAMS has shown that LIP could reproduce their results, and that any possible bias between the two laboratories was significantly smaller than the typical experimental error associated with radiocarbon measurements in seawater. The comparison of deep water observations from the 1970s to 1990s proves that the ETH-LIP method is able to produce Δ14C values within the range established by earlier studies. Therefore, this study shows that LIP data are comparable for the typical range of Δ14C found in DIC of seawater.
The implication of these findings is important for LIP in terms of data quality assessment as well as for data users. The two comparisons are based on a limited amount of data. Aware of this limitation, we make the following recommendations. Firstly, the NOSAMS and LIP data are comparable within ∼3‰. We would recommend bearing this uncertainty in mind when discussing the significance of temporal changes of Δ14C in a water mass or location. We consider that a more extensive comparison is needed between the two laboratories before we can rule out or confirm any possible systematic offset between the two laboratories well beyond 3‰. Secondly, deep water measurements of LIP are in the range of previous data, but they seem to be lower than observations reported by UW for the GEOSECS era. Assuming a temporal increase in deep water Δ14C caused by the penetration of bomb-14C, one might underestimate the temporal change of deep water Δ14C when comparing LIP and UW data.
The accuracy and precision of measurements may vary over time. Δ14C observations in DIC would be more reliable if there was a recognized reference material that could be analyzed together with the samples on a regular basis. The creation of such DIC reference materials and materials that could be used for larger intercomparison activities was discussed in the workshop “Carbon Isotopes in the Ocean: Ensuring High-Quality Results” in November 2021(McNichol et al. Reference McNichol, Hansman, Key and Sonnerup2021). The organizers of that workshop have collected large volume seawater samples which shall be distributed in the future to laboratories wishing to participate in a large intercomparison exercise to investigate comparability of Δ14C measurements in DIC. Their effort, and that of the marine radiocarbon community, will be valuable to obtain a consensus value, and to establish equivalences between datasets and between laboratories capable of making Δ14C measurements in DIC.
During the 24th Radiocarbon Conference many scientists asked about our experience with the relatively new sampling technique of freezing samples in foil bags (Bryant et al. Reference Bryant, Henley, Murray, Ganeshram and Shanks2013). The marine radiocarbon community has long been searching for a reliable alternative to mercuric chloride for sample preservation. This chemical has been shown to be very effective in conserving the isotopic carbon composition of DIC by ceasing the biological activity within the sample. However, it is highly toxic for humans and the environment, its handling and disposal requires special measures, and a growing number of countries are discouraging or prohibiting its use on oceanographic vessels. Bryant et al. (Reference Bryant, Henley, Murray, Ganeshram and Shanks2013) showed that the foil bag method used here is suitable for the determination of total inorganic carbon, radiocarbon, and stable carbon isotopes. The results from the intercomparison presented in this study further show that foil bags processed at LIP did not cause an appreciable bias from the results reported by NOSAMS which were processed following well established procedures (McNichol et al. Reference McNichol, Quay, Gagnon and Burton2010).
One major challenge of using the foil bags is that sample preservation over periods longer than a week is achieved by freezing at –20°C. This adds an extra logistical effort to ship bags via frozen courier and to store the samples in freezers. There is a risk that biology grows if samples cannot be kept frozen, and frozen storage and shipping may not be feasible in some cases. There is also a risk that the foil bags become damaged or break. For the JC191 cruise 5% of the bags lost all the water after thawing them the night prior to laboratory analysis, many more than the number of glass bottles typically broken during shipping or sample manipulation at LIP. A few more bags also broke while transferring the seawater into the glass bottles used for carbon extraction. Furthermore, the cost of the foil bags (approx. $25 each) may be prohibitive as they are not reused for subsequent sampling, although this may be possible. We recommend that the storage of samples in a different container that is more robust but that can still be frozen should be explored. Notwithstanding these challenges, freezing samples in foil bags is currently the only proven method for avoiding chemical poisoning and is thus worthy of consideration in oceanographic studies.
SUPPLEMENTARY MATERIAL
To view supplementary material for this article, please visit https://doi.org/10.1017/RDC.2023.16
ACKNOWLEDGMENTS
Captains, crew, and scientific staff of the OVIDE 2018 and JC191 cruises are thanked for their help at sea. Thanks go also to the cruise chief scientists Pascale Lherminier and Alejandra Sanchez-Franks for providing the opportunity to embark on R/V Thalassa and RRS James Cook. Ann McNichol and Robert M. Key are warmly thanked for their contribution to the Δ14C dataset (EXPOCODE: 33RO19980123) in CCHDO. We would also like to acknowledge Philip Gautschi for his help in the laboratory. MC’s research was funded by the Swiss National Science Foundation Postdoc. Mobility Fellowship (P400P2_199289/1). Laboratory analyses at LIP were partly supported by the ETH Career Seed Grant (SEED-06 19-2) awarded to MC. Additional funds for AMS measurements were provided by LIP and its consortium partners EAWAG, EMPA, and PSI. Sampling during JC191 was supported by UK–NERC funds awarded to HDG. NOSAMS is supported through NSF cooperative agreement OCE-1755125.





 Open access

