
4.1 IntroductionFootnote 1
The electricity system has several special characteristics. First, electricity is an invisible and undifferentiated energy carrier, which does not directly fulfil end-use functions. Instead, it powers electric appliances that provide functionalities such as lighting, heating, freezing/cooling, washing, drying, cooking, entertainment, computing, or powering electric motors that perform mechanical work in households, the commercial sector, and industry. Second, while production and consumption of electricity have become geographically separated, they are integrated in real-time because precise balancing is needed to prevent blackouts. This geographical separation implies the need for electricity grids to transport power from (often centralised) sites of production to (often decentralised) sites of consumption (e.g., households, offices, factories). There are high-voltage transmission grids, which transport power over long distances, and low-voltage distribution grids, which disseminate power locally.
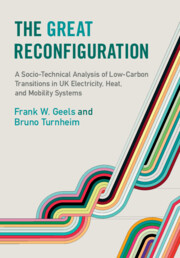
In terms of system architecture, these considerations imply that the electricity system can be distinguished into three sub-systems: production, grids, and consumption. The system architecture has a horizontal ‘hour-glass’ shape: multiple upstream inputs (e.g., coal, gas, nuclear material, biomass, wind, sunshine) are transformed into a single homogenous product (electricity), which is transported by a fine-grained, integrated power grid to sites of consumption where its use in electric appliances enables multiple end-use functions (Figure 4.1). This means that grids not only connect production and consumption but also act as a buffer in the sense that users hardly notice ‘upstream’ changes in power generation (which is an important difference with the mobility and heat systems).
Schematic representation of the material elements and flows in the electricity system
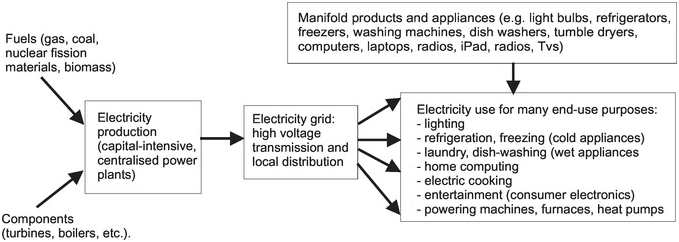
Direct greenhouse gas emissions, which are generated mostly in electricity generation, decreased by 71% between 1990 and 2019 (Figure 4.2), which suggests a low-carbon transition is well under way. The chapter aims to provide an interpretive assessment of underlying changes in various sub-systems. To that end, Sections 4.2, 4.3, and 4.4 respectively investigate the main developments in electricity generation (including coal, gas, and nuclear power), grid, and consumption sub-systems (including washing; cooling; information, communication, and entertainment; and lighting). For each sub-system, we first analyse techno-economic developments and then actors and institutions. Section 4.5 analyses nine niche-innovations across electricity generation (onshore wind, offshore wind, biomass, solar-PV), consumption (energy-efficient lighting, smart meters), and grids (smart grid, battery storage, demand-side response). Section 4.6 draws conclusions about the speed and depth of low-carbon system reconfiguration.
Greenhouse gas emissions from power stations in MtCO2, 1990–2019
4.2 Electricity Generation Sub-system
4.2.1 Techno-Economic Developments
The electricity generation sub-system traditionally consists of large, centralised base-load units (coal, nuclear, or large gas turbines), complemented with flexible units for peak-load generation (e.g., smaller gas turbines). Power generation is a complex, engineering-heavy, and capital-intensive activity, linked upstream to specialised supply-chains for different fuels (e.g., coal, gas, uranium, oil) and equipment manufacturing, installation, and maintenance (e.g., thermal/nuclear reactors, turbines, boilers).
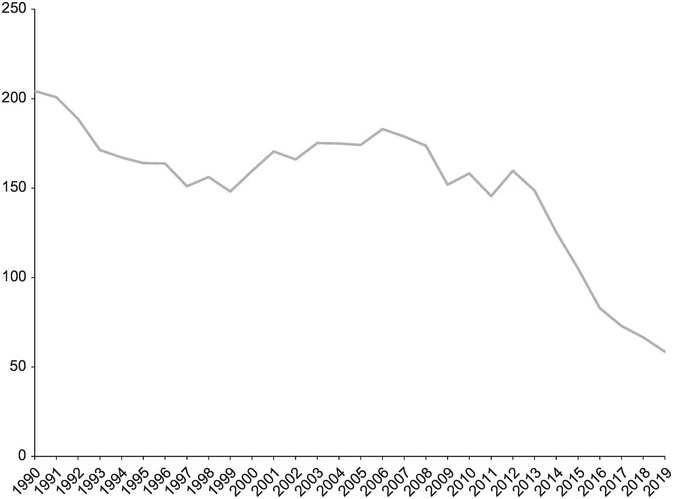
The direct economic relevance of the electricity supply industry decreased since the 1980s, rebounded since the late 2000s, and is still substantial in 2019, generating 98,000 jobs and contributing 1.15% to the Gross Value Added of the UK economy (Figure 4.3). The indirect economic relevance is broader, when taking into account supply chains and the importance of reliable electricity provision to the wider economy.
Relative contribution of UK electricity industry to Gross Value Added (in %, left-hand axis) and number of jobs (in thousands, right-hand axis), 1980–2019
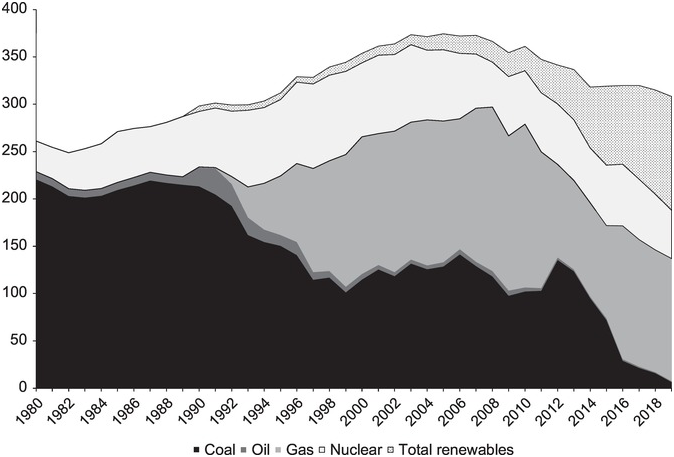
The relative importance of different fuel inputs to power generation has changed substantially since 1980 (Figure 4.4):
nuclear power expanded in the 1980s and 1990s and then gradually contracted;
the use of natural gas increased rapidly after the 1990 privatisation policies;
renewable power generation has increased gradually since 1990, reaching 39% in 2019;
coal use declined very substantially, reducing its relative contribution to power production from 69% in 1990 to 2% in 2019. This decline occurred in two steps. The first step was the market-driven ‘dash for gas’ in the 1990s. The second step was related to climate and energy policies, which stimulated the expansion of renewables and made coal more expensive (e.g., the Carbon Floor Price instrument).
Figure 4.4 also shows that electricity supply peaked in 2005 and subsequently decreased by 18%, owing to decreasing electricity demand, which will be discussed further in Section 4.3.
Electricity supplied by fuel type in TWh, 1980–2019
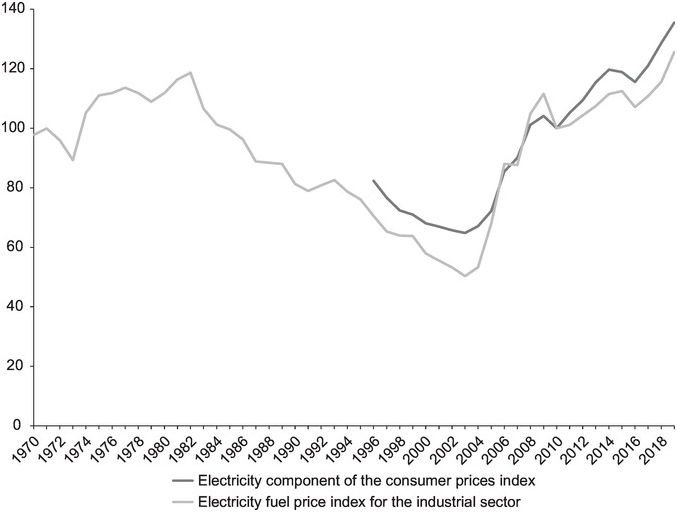
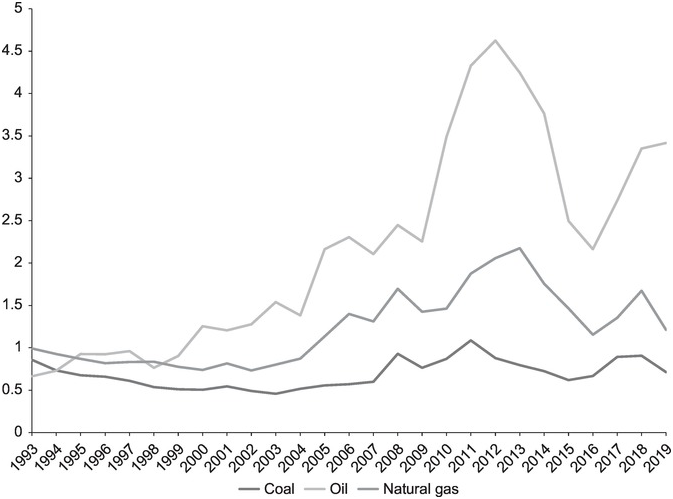
Electricity prices decreased in the 1980s and 1990s (Figure 4.5) because of decreasing fuel input prices such as coal and gas (Figure 4.6) and because privatisation in 1990 increased competition between power producers, which led to lower prices. Since the early 2000s, however, electricity prices have started increasing (Figure 4.5), first because of rising gas prices (which are linked to oil prices) and second because of new investments, related both to decarbonisation and to replacement of old coal and nuclear power plants.
UK electricity price index in real terms for industrial and domestic sectors, 1970–2019 (2010=100)
Average prices of fuel inputs (in pence per kWh in real terms) purchased by the major UK power producers, 1993–2019
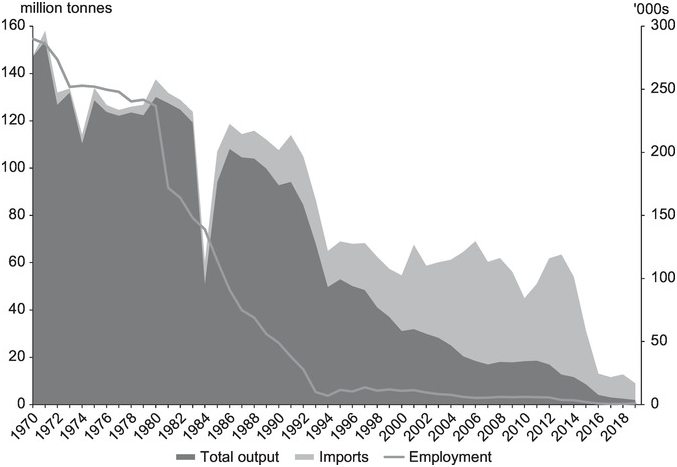
In terms of fuel supplies, the long-term decline in the domestic production of coal was accelerated by the 1984 coal miners’ strike (Turnheim and Geels, Reference Turnheim and Geels2012). Mine closures continued, leading to major declines in coal-related employment (Figure 4.7). Competition from cheaper coal imports and declining coal demand from power producers in the 1990s further reduced domestic coal production. The increasing reliance on imported coal helps explain why electricity-related coal phase-out since the mid-2010s received relatively little industrial opposition.
UK coal production and imports in million tonnes (left-hand axis) and employment in thousands (right-hand axis), 1970–2019
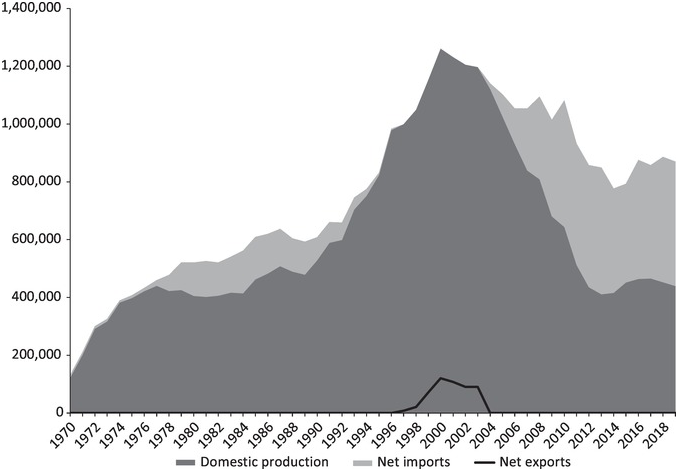
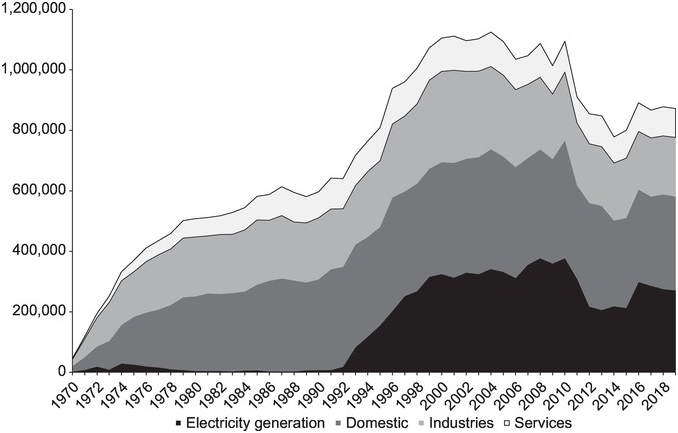
UK gas production increased very rapidly in the 1990s, owing to the exploitation of new North Sea gas fields (Figure 4.8). Between 1997 and 2003, the UK even became a net exporter of natural gas. Since then, however, domestic gas production has decreased, while gas imports (from Norway, the Netherlands, and Belgium) have increased, reaching 49% in 2019 (Figure 4.8). The use of gas in the electricity sector grew rapidly in the 1990s (Figure 4.9). Other important gas users are households and servicesFootnote 2 (which mostly use gas for heating) and industries (which use gas for a range of purposes).
UK natural gas production, net imports, and net exports in GWh, 1970–2019
UK natural gas consumption by main user categories in GWh, 1970–2019
4.2.2 Actors
Firms: Following privatisation (1990) and liberalisation (1998), the UK electricity supply industry consolidated into the ‘Big Six’ electricity companies (EDF, E.ON, SSE, British Gas, Scottish Power, N-Power). Their strategies came to focus on price competition, sweating assets, decreased R&D spending, and fuel flexibility in response to fuel price fluctuations (Pearson and Watson, Reference Pearson and Watson2012). In the absence of clear product differentiation, competition mainly occurs on costs, and to a lesser extent on consumer relations and green profiles.
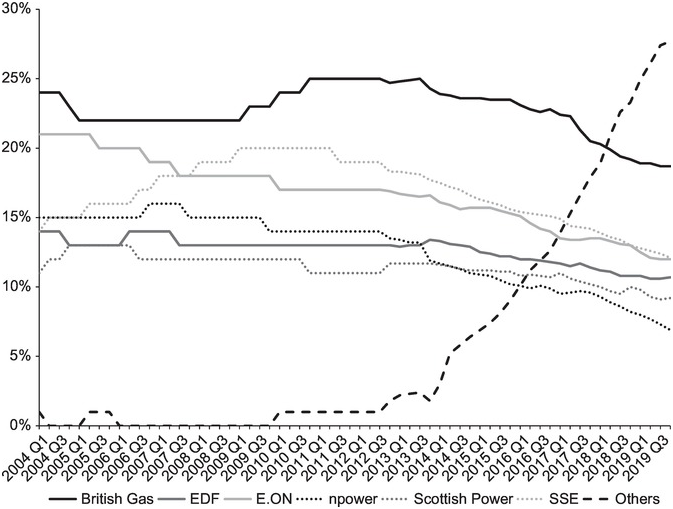
The Big Six are vertically integrated (owning both electricity generation and retail) and dominate the market. But since 2014, new entrants (such as First Utility, Ovo Energy, Sainsbury’s Energy) have begun to gain market share (Figure 4.10), which has increased competition. Organisations with new business models (e.g., community energy, transition towns) have remained small in the UKFootnote 3 because of unfavourable rules and institutions (Mirzania et al., Reference Mirzania, Ford, Andrews, Ofori and Maidment2019): ‘key features of socio-technical regime for electricity provision continue to favor large corporations and major facilities’ (Strachan et al., Reference Strachan, Pye and Kannan2015: 106).
UK market share evolution of energy companies, 2004–2019
Technology strategies in recent decades have been shaped by public policies and economic considerations. In the 1990s, utilities switched from coal to natural gas (Figure 4.4). This ‘dash for gas’ was stimulated by various factors (Pearson and Watson, Reference Pearson and Watson2012): a) utility preferences for power generation units with short lead times, low capital costs, and quick returns on investment, which aligned well with combined cycle gas turbines (CCGT); b) price/performance improvements in CCGT; c) new North Sea gas finds and cheap international gas; d) environmental benefits of gas compared to coal.
Coal-fired power generation in the 1990s also faced pressures from the European Large Combustion Plants Directive (LCPD), which prescribed substantial reductions in SO2 emissions. Existing coal-fired plants therefore had to either invest heavily in flue gas desulphurisation, which would further erode their competitive position, or close by 2015 (Turnheim and Geels, Reference Turnheim and Geels2012). Coal-fired plants also faced increasing pressure from climate change, which the newly elected (1997) Labour government saw as an important issue.
Nuclear power also faced difficulties in the 1990s because of nuclear waste storage scandals and because preparation for privatisation revealed its poor economic performance (Verhees, Reference Verhees2012). Privatisation was therefore delayed until 1996, when the government sold the nuclear plants to British Energy. But declining electricity prices created financial problems for British Energy, which had to be bailed out in 2002 (Hewlett, Reference Hewlett2005).Footnote 4 EDF bought British Energy and its nuclear power plants in 2009 for £12.5 billion.
Rising gas prices in the early 2000s (Figure 4.6) changed the fortunes of coal, leading utilities to burn more coal in existing plants between 2000 and 2006 (Figure 4.4). Concerns about energy security (due to increasing reliance on gas imports) also increased the appeal of coal. Promises of ‘clean coal’ (based on flue gas desulfurisation, supercritical pulverised coal technologies, coal gasification, and Carbon Capture and Storage) also intended to address environmental concern, including climate change (Geels et al., Reference Geels, Kern, Fuchs, Hinderer, Kungl and Mylan2016b).
By 2008, utilities were seeking approval to build new coal-fired power plants, totalling over 11 GW, to replace plants that would be phased out by 2015/16 (Turnheim, Reference Turnheim2012). Because these plans would threaten the ambitions of the 2008 Climate Change Act, policymakers announced that no new coal-fired plants would be permitted unless they incorporated Carbon Capture and Storage (CCS), which did not materialise. Since then, coal use has decreased rapidly (Isoaho and Markard, Reference Isoaho and Markard2020), as some coal-fired plants converted to burning biomass (Drax, Ironbridge) while others closed (Kingsnorth, Cockenzie, Tilbury Didcot, Uskmouth, Ferrybridge) because of LCPD-legislation, end-of-life considerations, and the 2013 Carbon Floor Price policy, which made coal more expensive compared to other options. Decline accelerated after 2015 (Figure 4.4), when the government announced a coal phase-out by 2025 (Isoaho and Markard, Reference Isoaho and Markard2020).
Increasing concerns about climate change and energy security (particularly increasing dependence on imported gas) also led to government plans for the expansion of nuclear power (see later). But utilities showed lukewarm interest, because waste processing liabilities, decommissioning costs, and unclear future electricity prices created uncertainties about the viability of nuclear investments, especially since the government had repeatedly ruled out subsidies. In 2013, the energy company Centrica abandoned new construction plans, leaving only EDF in negotiations with the UK government about a 3.2 GW plant at Hinkley Point C (Thomas, Reference Thelen, Mahoney, Mahoney and Thelen2016). To enable the deal, the government broke its non-subsidy pledge and in 2016 agreed to pay EDF a guaranteed strike price (£92.50 per MWh, twice the wholesale price) for 35 years. Since then, however, the project has encountered problems in securing finance for the £18 billion investment and delays in scheduled opening dates (to 2025). Half of the UK’s nuclear power plants are scheduled to retire in 2025 for end-of-life reasons, creating a potential capacity gap. Policymakers are therefore in discussion with possible suppliers about other new nuclear power plants (further discussed later).
In response to attractive government incentives, electricity generators also reoriented towards large-scale renewables such as biomass combustion in converted coal-plants (e.g., Drax, Ironbridge), onshore and offshore wind parks (Geels et al., Reference Geels, Kern, Fuchs, Hinderer, Kungl and Mylan2016b), which is further discussed in Section 4.5.
Policymakers: The government’s privatisation (1990) and liberalisation (1998) of the electricity supply industry were motivated by desires to unleash market forces and drive down electricity prices. The Labour government, elected in 1997, made climate change into an additional issue for energy policy besides low costs. The 2003 White Paper Our Energy Future: Creating a Low-Carbon Economy highlighted the need for a 60% reduction of GHG emissions by 2050 and committed to a target of 10% renewable electricity by 2010. Rising oil and gas prices in the early 2000s (Figure 4.6) and the 2005 Russia–Ukraine gas dispute (in which Russia closed gap supplies to pressure Ukraine) increased concerns about energy security and increasing reliance on gas imports (Figure 4.8). UK electricity policy was therefore increasingly framed in terms of an ‘energy trilemma’, which aimed to simultaneously address three goals: low cost, energy security, and climate mitigation (Kern et al., Reference Kern, Kuzemko and Mitchell2014a).
Public attention to climate change increased rapidly in the mid-2000s (Figure 1.1), making it an attractive issue for high-level politicians to compete on (Carter and Jacobs, Reference Carter and Jacobs2014). This competition resulted in cross-party consensus about the importance of climate change. This consensus and pressure from environmental NGOs culminated in the ambitious 2008 Climate Change Act that legally committed the UK to 80% GHG reduction by 2050 and 34% reduction by 2020 (Lockwood, Reference Lockwood2013). Nuclear power, Carbon Capture and Storage (CCS), and offshore wind (which will be discussed in Section 4.5) were seen as crucial low-carbon technologies.
The government’s 2008 White Paper on Nuclear Energy announced plans to construct eight new nuclear power reactors by 2025, which would address both climate change and energy security issues. Since the mid-2010s, the government has spend much political capital on the first project (Hinkley Point C), which encountered delays, cost increases, and financing problems, and has been criticised for very costly support policies (Thomas, Reference Thelen, Mahoney, Mahoney and Thelen2016).
CCS was seen as a crucial technology because it would enable continued gas and coal-fired power plants, while reducing GHG emissions. The government’s 2007 White Paper on Energy (Meeting the Energy Challenge) wanted to ‘make the UK a world leader in this globally important technology’ (p. 15) and therefore launched a competition for a £1 billion subsidy to build a CCS demonstration plant. Nine proposals were received and four were selected for further development and negotiation. The BP and Peel Consortiums subsequently withdrew, leaving E.ON and Scottish Power/Shell/National Grid in the negotiation. But E.ON pulled out in 2009 and Scottish Power in 2011, because both deemed the economic risks too high (Kern et al., Reference Kern, Gaede, Meadowcroft and Watson2016). Despite these setbacks, the government’s 2011 Carbon Plan repeated CCS aspirations, foreseeing up to 10 GW of CCS plants by 2030. A second £1 billion competition was launched in 2012, leading to prolonged discussions about the Peterhead project (led by Shell and SSE) and the White Rose project (led by Drax). But the government cancelled the competition in 2016, owing to concerns about the future costs for consumers.
Meanwhile several political countertrends gathered pace after the 2007/8 financial-economic crisis and the election of a new Conservative-Liberal Democrat government in 2010 altered political priorities. Public attention to climate change diminished, leading politicians to realise that they were ahead of their voters (Lockwood, Reference Lockwood2013). Especially the right wing of the Conservative party became more vocal, questioning the climate change science and criticising subsidies for renewables. The financial-economic crisis also enhanced concerns about jobs, competitiveness, and energy prices. The Treasury used these concerns to regain influence over climate policy through the Levy Control Framework (Carter and Jacobs, Reference Carter and Jacobs2014), issuing warnings that green policies should not hinder the economy. In 2013, cost concerns escalated into a full-scale political row over rising energy bills, with the Prime Minister reportedly telling aides to ‘get rid of all the green crap’ (The Guardian, 23 November 2013). These concerns led the government to scrap, delay, or water down various green policies (discussed later).
In this context, the government was also keen to emulate the US shale gas revolution, which it hoped would create jobs, reduce gas prices, and reduce dependence on natural gas imports. In 2012, it therefore lifted restrictions on fracking. In an official statement on 19 July 2013, the Chancellor promised tax breaks for shale gas companies, arguing that shale gas ‘has the potential to create thousands of jobs and keep energy bills low for millions of people’. Since then, shale gas has developed slowly because of public protests, mixed results from underground explorations (because UK soils were found to be fractured and difficult to exploit), and correlations between fracking and local earthquakes that heightened public concerns (Williams and Sovacool, Reference Williams and Sovacool2019). In November 2019, the government therefore announced a moratorium on further shale gas development.
In 2015, the newly elected Conservative Government announced an ‘energy policy reset’, which led to major reductions in financial support for renewables and CCS. To protect its green credentials, the government also announced in 2015 that it intended to phase-out unabated coal-fired power plants by 2025. This phase-out unfolded quicker than anticipated (Figure 4.4) and substantially decreased GHG emissions from the power sector (Figure 4.2). Since the mid-2010s, the government has also started negotiations about other new nuclear power plants, but several of these (Wylfa, Moorside, and Oldbury) have since stalled because project developers (Hitachi, Toshiba) pulled out in 2020 due to problems in securing funding. Negotiations about other plants (Sizewell, Bradwell) are ongoing but challenging because decreasing costs of renewables erode the business case for nuclear power plants (and the political will to subsidise them), creating major business and political uncertainties. Despite the various implementation and delivery problems, the 2020 Energy White Paper states that the government aims ‘to bring at least one large-scale-nuclear project to the point of Final Investment Decision (FID) by the end of this Parliament’, which is 2024 (HM Government, 2020a: 48).
In the context of ‘climate emergency’ debates, the UK government committed in 2019 to a net-zero target by 2050. For the electricity sector specifically, the 2020 Energy White Paper aimed for ‘an overwhelmingly decarbonised power system in the 2030s’. Nuclear power and offshore wind (further discussed later) are thought to play important roles in this decarbonisation process, while the government also aims for ‘at least one’ CCS plant for power production to be operational by 2030 (HM Government, 2020a).
Users: UK consumers have limited direct involvement in power generation. Electricity production by households (through rooftop solar-PV) has remained relatively small in the UK (see Section 4.5.4). Nevertheless, households indirectly shape upstream power generation investments since they ultimately pay for them, either through their electricity bills (which allows utilities to pass costs onto consumers) or through general taxation (which pays for government subsidies to power generators). Additionally, consumer switching between electricity suppliers accelerated after 2013, providing space for new electricity suppliers (Figure 4.10).
Wider Publics: Increasing public attention for climate change and the 2006 Big Ask campaign by environmental NGOs prepared the ground for the 2008 Climate Change Act and stimulated the development of low-carbon electricity plans and policies. Public attention for climate change declined as the 2007/8 financial crisis and austerity increased public concerns about jobs, growth, and energy costs (Lockwood, Reference Lockwood2013). Cost concerns underpinned various public debates about specific issues. Complaints about rising electricity bills culminated in a political row in 2013 and subsequent efforts to reduce public spending on renewables. There were also heated debates about pricing strategies of utilities, which were accused of being slow to pass on decreases in fuel input prices to consumers. They were also accused of too rapidly increasing standard variable tariffs, which would disproportionally affect lower-income people on these tariffs who were traditionally less likely to switch suppliers. Additionally, there were public debates about dysfunctional markets and insufficient competition between utilities that underpinned the market power abuse. This concern led to an energy market investigation by the Competition and Markets Authority, which in 2016 published a critical report with 30 improvement recommendations. Last, there were critical debates about excessive subsidies in the 2016 Hinkley Point C deal. These critical debates decreased public attention to climate change and weakened the climate policy consensus (Gillard, Reference Gillard2016).
There were also public campaigns and debates about specific technologies. In 2008–2009, activist groups such as Climate Camp campaigned against utilities’ plans to expand coal-fired power stations. Demonstrations against a new plant at Kingsnorth attracted much media attention, which pressured the government to not grant licenses (Carter and Jacobs, Reference Carter and Jacobs2014). Public opposition against nuclear expansion plans was more limited because the environmental movement was divided, with some activists (e.g., Stephen Tindale, George Monbiot, Mark Lynas) perceiving nuclear power as a necessary evil to address climate change (Verhees, Reference Verhees2012).
Environmental NGOs and local communities also contested the government’s plans for fracking and shale gas technologies because of concerns about water and noise pollution, industries invading the countryside, and insufficient stakeholder engagement (Williams and Sovacool, Reference Williams and Sovacool2019). Nevertheless, the government decided to move ahead in supporting fracking, with the Prime Minister personally expressing strong commitment in a letter to The Telegraph, dismissing protesters as uninformed NIMBY-activists (11 August 2013). Protests continued, however, and gathered wider support as increasing numbers of earthquakes in fracking areas enhanced public concerns. Combined with lower than anticipated exploration results, this led the government to halt shale gas in November 2019.
4.2.3 Policies and Governance
Governance Style
Governance styles and policy paradigms have changed substantially in the past three decades. Privatisation and liberalisation in the 1990s, which were based on neoliberal principles, introduced market-principles to the electricity system, with the specific aim of focusing utilities on low cost competition (Pearson and Watson, Reference Pearson and Watson2012). The government increasingly adopted a hands-off governance style, leaving decisions to the market. The Department of Energy was disbanded in 1992 and energy policy was relegated to a sub-division of the Department of Trade and Industry (DTI). To depoliticise energy governance, DTI set the regulatory framework, but left implementation to the newly created independent regulator Ofgem (Office of Gas and Electricity Markets). Ofgem’s main remit was to ensure that markets were sufficiently competitive and to protect consumer interests (Kern et al., Reference Kern, Kuzemko and Mitchell2014a).
In the 2000s, climate change became an additional policy concern, which was layered on top of neoliberal arrangements, leading to an emphasis on market-based policies. The 2002 Renewables Obligation introduced technology-neutral trading policies, while the 2003 White Paper Our Energy Future emphasised carbon pricing (via European emissions trading) as the main instrument for creating a low-carbon economy.
The 2008 Climate Change Act marked a shift towards a more interventionist governance style (Kern et al., Reference Kern, Kuzemko and Mitchell2014a; Pearson and Watson, Reference Pearson and Watson2012), in which the government actively shaped markets and stimulated specific technologies. It also created new policy actors such as the Department of Energy and Climate Change (DECC) and the independent Committee on Climate Change (CCC) with responsibility for monitoring progress against climate change targets and advising the government accordingly. DECC’s translation of high-level goals into more specific plans created policy delivery momentum through the UK Low Carbon Transition Plan (2009), the amended Renewables Obligation (2009), the UK Renewable Energy Strategy (2009), the Carbon Plan (2011), the Energy Bill (2012), and the Electricity Market Reform (2013), which stimulated technology implementation and deployment.
Formal Policies
In terms of specific policy instruments, the 2013 Electricity Market Reform introduced Contracts for Difference (from 2017 onwards), which aimed to attract private investors. CfDs guarantee that low-carbon electricity generators receive a stable and predictable ‘strike price’ for long periods.Footnote 5 While CfDs offer protection against the volatility of wholesale prices, the closed auction design makes potential suppliers compete against each other with the aim of driving prices down. The Hinkley Point C nuclear power plant, however, received a generous strike price (£92.50 per MWh for 35 years) to entice EDF as single bidder (Thomas, Reference Thelen, Mahoney, Mahoney and Thelen2016).
The Carbon Price Floor (CPF) is another policy instrument, which was introduced in 2013 to complement the EU Emissions Trading System (ETS). Since the price of carbon in the ETS has remained too low to drive low-carbon investment, the CPF taxes fossil fuels used to generate electricity via Carbon Price Support (CPS) rates set by the government. The Carbon Price Floor thus consists of two components paid by electricity generators: ETS carbon prices and the CPS which further increases carbon prices to the carbon floor price target. The CPF was supposed to increase every year until 2020 (to a price of £30/tCO2), but in 2014 the government decided to cap the CPS component of the floor price at a maximum of £18/tCO2 from 2016 to 2020 to reduce energy bills for consumers. Despite this weakening, the CPF increased the relative price of coal, which contributed to its rapid decline in power generation (Figure 4.4).
Another instrument was the Levy Control Framework, which the Treasury established in 2011 to control financial spending by DECC. It did so by setting a maximum annual budget for projected costs on levy-funded schemes such as the Renewables Obligation, Feed-in-Tariff, and CfDs.
The 2015 energy reset not only reduced financial support for renewables and CCS but also signalled a desire for less interventionism, with the Secretary of State for Energy and Climate Change stating: ‘We want to see a competitive electricity market, with government out of the way as much as possible, by 2025.’Footnote 6 The newly elected (2015) Conservative government thus expressed its preference for restoring a neoliberal approach to electricity policy. In 2016, DECC was reorganised into BEIS (the Department for Business, Energy & Industrial Strategy), which also indicated that low-carbon energy transitions were explicitly viewed in relation to business opportunities and industrial strategy. The 2017 Clean Growth Strategy saw ‘clean, smart, flexible power’ as an industrial growth opportunity, focused particularly on large-scale generation options such as nuclear power, offshore wind, and large solar farms (BEIS, 2017a). The latter two options are further discussed in Sections 4.5.2 and 4.5.4.
4.3 Electricity Grid Sub-system
4.3.1 Techno-Economic Developments
Great Britain’s electricity gridFootnote 7 includes a high-voltage transmission network, which carries electricity from power generators to sub-stations and a low-voltage distribution network for localised electricity delivery from sub-stations to end-users. The GB transmission network consists of 26,000 km of overhead lines, 575 sub-stations, and over 1,000 transformers that transform electricity from high to low voltage (Cotton and Devine-Wright, Reference Cotton and Devine-Wright2012).
Local distribution networks are organised into 14 regional area monopolies, which are managed by distribution network operators (DNOs). DNOs operate one-directional passive networks, which distribute power from electricity generators to end-users. DNOs do not measure or monitor their distribution networks, which remain relatively ‘dark’: DNOs cannot see technical problems or blackouts but rely on customers calling them to report problems (Lockwood, Reference Lockwood2016).
The electricity grid took decades to build and represents major sunk investments that create material and economic path dependencies. Grid operation requires specialised technical and managerial skills to balance the supply and demand of electricity flows, which always needs to be finely tuned to prevent operational problems and blackouts. The operational model traditionally consisted of baseload generation, which operates more or less continuously, and dispatchable generation, which are more flexible sources of electricity that can be dispatched at the request of power grid operators to meet fluctuating consumer demand, including electricity peaks. To keep costs low, choices for baseload and dispatchable operation were conventionally guided by the merit order, which refers to the ranking of electricity generation sources in ascending order of short-run marginal production costs. This often resulted in the use of coal or nuclear plants for base-load generation and gas-powered plants for dispatchable generation.
Several trends are increasing pressures on the grid and the conventional operational model (Bolton and Foxon, Reference Bolton and Foxon2015; Jenkins et al., Reference Jenkins, Long and Wu2015): 1) under-investment over the past few decades has led to aging grid assets (e.g., switchgear, transformers, cables) that require replacing or upgrading, 2) the creation of wind farms in remote locations (e.g., Scottish islands, Welsh coast, offshore) requires the creation of new transmission networks to connect them to the grid, 3) increasing electricity flows from Scotland and Wales (where most wind parks are situated) to England (where most electricity is used) requires upgrading, extension, and intensification of the onshore transmission grid, 4) increasing amounts of intermittent renewables (wind, solar-PV) create load management problems (matching supply and demand) and disrupt the baseload-dispatchable generation model, especially as renewables become the cheapest option and thus rank high in the merit order, 5) increasing amounts of distributed generation (e.g., solar-PV, community energy) need to be integrated into local distribution grids, which involves two-way flows instead of traditional one-directional flows, 6) possible future increases in domestic heat pumps and electric vehicle charging may create new stresses on local distribution networks that require monitoring and management.
These pressures have led to incremental changes in the high-voltage transmission grid, including: 1) extensions of Scottish onshore power cables to wind parks in remote locations; 2) the strengthening of existing transmission connections between England and Scotland and England and Wales, 3) the creation of a new west coast undersea high-voltage direct current transmission cable between Scotland and England, 4) the creation of new offshore grids to connect various wind parks, 5) the building of new interconnectors to Norway, France, Belgium, Denmark, and Iceland to increase import capacity beyond the current four interconnectors (to France, Northern Ireland, Ireland, the Netherlands). Costs for these projects between 2010 and 2020 are estimated to be around £54 billion (DECC, 2014a). Although these projects are complicated and expensive, they are incremental in the sense that they build on and extend existing technological knowledge and capabilities (Andersen, Reference Andersen2014). They also do not fundamentally change the transmission architecture but strengthen and extend it.
The grid pressures have also increased attention for more radical innovations in local distribution networks, including smart grids, demand-side response, and electricity storage. These radical innovations will be discussed in Sections 4.5.7 and 4.5.8.
4.3.2 ActorsFootnote 8
Policymakers: Electricity networks are highly regulated markets, in which the independent regulator Ofgem plays a central role. It provides oversight of the system operator (National Grid), Transmission Network Operators (TNOs), and Distribution Network Operators (DNOs); it implements and monitors regulations; and it approves network investment plans. Ofgem is traditionally dominated by mainstream economists (Cary, Reference Cary2010; Lockwood, Reference Lockwood2016) and focused on lowering cost (through economic competition), which is how it interpreted its original regulatory remit of ‘protecting the interest of consumers’.
To minimise operational costs and improve cost-efficiency, Ofgem introduced price control regulation (called RPI-X) for electricity grids in the late 1990s. This regulation meant that the fees that TNOs and DNOs could charge electricity companies for transmission and distribution services could increase in line with an inflation index (the Retail Price Index) minus an X% reduction each year, which was intended to stimulate TNOs and DNOs to make efficiency gains (Jamasb and Pollitt, Reference Jamasb and Pollitt2007).
Although mainstream economic thinking, which informed Ofgem’s policies, predicted that efficiency orientations would drive innovation, this did not occur, especially not for DNOs (Bolton and Foxon, Reference Bolton and Foxon2015). To stimulate innovation, Ofgem therefore introduced new policies for the 2005–2010 period (Innovation Funding Incentive, Registered Power Zones scheme) and the 2010–2015 period (Low Carbon Network Fund), and a new policy framework called RIIO for the post-2015 period (RIIO stands for Revenue = Incentives + Innovation + Outputs). While these new instruments stimulated DNO R&D activities (Jamasb and Pollitt, Reference Jamasb and Pollitt2015), wider deployment of new technologies in distribution networks has so far remained relatively limited (Lockwood, Reference Lockwood2016).
For grid investments, Ofgem used to have a negotiated model, in which DNOs and TNOs could make proposals that legitimated technical details and costs with regard to demonstrated needs (Lockwood, Reference Lockwood2016). This approach of ‘wait for proven need and then choose the optimal solution’ (Shaw et al., Reference Shaw, Attree and Jackson2010) might be efficient according to economic theory, but in the real world discouraged radical innovations that did not address well-articulated needs. In the mid-2010s, Ofgem announced that it wanted to change from the negotiated model to a competitive tendering model (the CATO regime), which was intended to commence in 2018 (see further discussion later). This change was partly inspired by experiences with the creation of new offshore transmission grids, which began using a competitive tendering model in 2009 (further discussed later).
Climate change was incorporated into Ofgem’s remit in the early 2000s, but has long received far less attention than efficiency improvements and cost reduction. Since 2007, Ofgem has been repeatedly criticised (by the Sustainable Development Commission, the Labour Party, and Parliament’s Energy and Climate Change Select Committee) for insufficiently acting on this additional goal. These criticisms have only slowly been accommodated, because Ofgem was created as an independent organisation with a substantial degree of autonomy and discretion in relation to policymakers (Lockwood, Reference Lockwood2016).
Firms: Different kinds of companies operate different parts of the electricity grid. The transmission grid is managed by a single system operator (National Grid) and three regional Transmission Network Operators (TNOs). Most of the extension, intensification, and reinforcement of onshore transmission networks has been driven by the three TNOs and supply chain firms (e.g., ABB, Alstom), based on investment proposals approved by Ofgem. Since pressures on transmission grids were visible and imminent (e.g., connecting new wind parks, reinforcing grids connections between England and Scotland), these proposals could easily be framed in terms of demonstrated needs. But besides clear demand or regulatory pressure from Ofgem, TNOs had little incentive to innovate since they faced no competition (Jamasb and Pollitt, Reference Jamasb and Pollitt2015). Most transmission grid innovations have therefore been incremental. The new CATO regime intends to change that by creating competitive tendering processes for discrete infrastructure projects. The new regime would also give the System Operator greater power in terms of overall coordination (as a ‘system architect’).
The local distribution system is organised into 14 regional area monopolies, run by six Distribution Network Operators (DNOs). DNOs are passive distributors, who transmit power from sub-stations to end-users. They receive a fee from the electricity companies for transmitting this power but do not have direct commercial relations with end-users. Various DNO-related lock-in mechanisms help explain the limited degree of innovation in distribution networks: 1) the RPI-X regulatory regime’s focus on efficiency and short-term cost reduction stimulated TNOs and DNOs to ‘sweat the assets’ (by postponing network investments) and downscale R&D investments, which decreased to 0.1% of revenue by 2004 (Jamasb and Pollitt, Reference Jamasb and Pollitt2008), 2) DNOs have therefore lost technical capabilities and lack the incentives for major long-term innovations (Bolton and Foxon, Reference Bolton and Foxon2015), 3) DNOs do not have pro-active long-term innovation strategies but react to the regulatory contract or act when this is required (e.g., when distributed power generators seek connections to the distribution network), 4) DNOs also do not face much articulated need from concrete clients, which complicates the legitimation of investment proposals to Ofgem.
DNOs increased their R&D activities in response to Ofgem’s Innovation Funding Incentive and Registered Power Zones scheme (Jamasb and Pollitt, Reference Jamasb and Pollitt2015), but real-world implementation of new technologies has remained slow. Since the Low Carbon Network Fund and the RIIO policy framework, DNOs have become more engaged in larger, real-world demonstration projects.
A third actor, Offshore Transmission Owners (OFTOs), are consortia of large-scale investors, project developers, and construction companies that build and operate offshore transmission networks (Firestone et al., Reference Firestone, Bates and Prefer2018). They have been attracted by Ofgem’s regulations, in which attractive revenues are awarded for providing the availability of transmission infrastructure regardless of the amount of electricity that is generated and transmitted. Two dominant OFTOs are Transmission Capital Partners (including Transmission Capital, International Public Partnerships, and Amber Infrastructure Group) and Blue Transmission (including 3i Group Plc and Diamond Transmission Corporation, which is a UK subsidiary of Mitsubishi Corporation).
Wider Publics: While grid planning and decision-making is a technocratic process involving a small group of actors, on-the-ground implementation and construction affects the lives of citizens and local communities. Various infrastructure projects have encountered protests because residents and NGOs had concerns about various issues (Cotton and Devine-Wright, Reference Cotton and Devine-Wright2012): 1) pylons and overhead power lines that caused visual intrusion in rural and suburban landscapes and noise burdens (related to zooming sounds), 2) negative influences on property and local amenity values, 3) potential cancer risks due to electric and magnetic fields emitted by power lines, 4) distrust of large electricity companies, including National Grid, 5) limited local consultation causing feelings of being ‘bulldozed over’. Examples of protests against grid infrastructure projects include the following (Cotton and Devine-Wright, Reference Cotton and Devine-Wright2013). In the early 2010s the John Muir Trust, a wild land charity, led fierce protests against the creation of new pylons and wires across 220 km of Scottish Highlands, which attracted much public attention. In Suffolk and Essex protesters created the Essex & Suffolk Coalition of Amenity Groups, whose protests led National Grid to decide (in 2013) to postpone its plans for new pylons until the early 2020s. There were also prolonged protests between 2011 and 2014 against new power lines from Mid-Wales through the Shropshire countryside.
The protests in Scotland and Wales led to substantial delays in consultation, approval, and construction of grid projects:
Major delays of 2 to 4 years were announced late in 2012 for many projects in Northern Scotland and the reinforcements required in mid and north Wales remain behind schedule. Our indicators envisaged that construction would begin in 2012 (mid Wales) and this year (north Wales), but there have been continued delays in planning, largely due to local public opposition.
These social acceptance problems were one reason for constructing the west-coast undersea transmission cable between Scotland and England and considering a similar east-coast undersea cable.
4.3.3 Policies and Governance
Governance Style
The governance style in the electricity grid sub-system has characteristics of ‘club governance’ (Lockwood, Reference Lockwood2016; Moran, Reference Moran2003): actors meet frequently in relatively closed networks, know each other well, share mindsets and outlooks, and take each other’s interest into account. The Electricity Networks Strategy Group, for instance, provides a high-level forum where the National Grid, TNOs, DNOs, Ofgem, and policymakers (e.g., DECC, BEIS) meet to discuss electricity grid challenges, policies, and plans. Ofgem has strongly shaped the grid institutions and outlooks, leading to an emphasis on efficiency and costs rather than on transformative change.
Formal Policies
The efficiency-oriented RPI-X price control regulation, introduced in the late 1990s, succeeded in decreasing costs but also hampered innovation and reduced R&D investments, especially by DNOs (Bolton and Foxon, Reference Bolton and Foxon2015). To address this problem, Ofgem introduced two new innovation-oriented instruments for the 2005–2010 period, which were layered on top of the efficiency-oriented institutions (Lockwood, Reference Lockwood2016). The Innovation Funding Incentive (IFI) allowed DNOs to spend up to 0.5% of their revenue on R&D and distribution system asset management. The Registered Power Zones (RPZ) scheme provided additional revenue (capped at £500,000 per DNO per year) to demonstrate innovative solutions for connecting distributed generation facilities to the network.
Although these instruments increased DNO R&D spending in subsequent years (Bolton and Foxon, Reference Bolton and Foxon2015), they hardly influenced the broader implementation and deployment of new technologies (Lockwood, Reference Lockwood2016). For the 2010–2015 period, Ofgem therefore created a new Low Carbon Network Fund (LCNF), which was an order of magnitude larger than IFI and allowed DNOs to bid for up to £500 million over five years for demonstration projects.
Based on an internal review, Ofgem (2013) also introduced the new RIIO-framework that aimed to stimulate innovation and promote a ‘step-change’ in the prominence of low-carbon futures. Coming into force in 2015, RIIO introduced several new instruments: a Network Innovation Competition, in which DNOs can bid for large-scale projects (funded from a £70m per year pot); a Network Innovation Allowance, which is an allowance each RIIO network licensee receives to fund smaller scale innovative projects that have the potential to deliver benefits to network customers; and an Innovation Roll-out Mechanism to fund the roll-out of proven low-carbon innovations for transmission owners (up to £10m).
While the RIIO-framework introduced several changes, Lockwood (Reference Lockwood2016: 120) diagnosed that it ‘retained the basic structure of revenue cap regulation at its core’. More broadly, it is not guaranteed that these new instruments will be sufficient to drive actual uptake and widespread deployment of new innovations in the electricity grid:
The understanding of innovation processes within Ofgem has evolved over time but remains incomplete. … Despite a shift away from a purist view of innovation based on Austrian economics to a more nuanced approach, it remains … to be seen if … the incentive to reduce costs in the wider regulatory framework will now be sufficient to drive network companies to take the lessons learned in LCNF trials and apply them in business-as-usual network planning, investment and operation.
Ofgem’s belief in market competition also led to the introduction of competitive bidding schemes for transmission grid projects. For offshore transmission projects, DECC and Ofgem introduced the Offshore Transmission Regulatory Regime in 2009. The regulations distinguish between a ‘transitional regime’ (2009–2012), which forced offshore wind farm operators to sell their self-constructed transmission grids to Offshore Transmission Owners (OFTOs), and an ‘enduring regime’ (post-2012), in which offshore transmission grids were either built directly by OFTOs or transferred to OFTOs once construction was completed. Licenses to build and/or operate offshore grids were distributed through a competitive tendering process overseen by Ofgem. To attract private investments, the OFTO license regulations are deliberately appealing, offering investors a solid fixed 20-year return on a relatively low risk profile, underwritten by a stable regulatory framework (KPMG, 2012).
Following the 2012–2015 ITPR policy review (Integrated Transmission Planning and Regulation), Ofgem announced that it wanted to change its onshore transmission regulations from the negotiated model to a competitive tendering model, known as the Competitively Appointed Transmission Owner (CATO) regime. By providing stable, long-term (25-years), financially attractive revenues, the CATO regime aims to mobilise large amounts of private investment (e.g., from the financial community) for discrete infrastructure projects with expected capital expenditures of over £100 million. The competitive tendering process also aims to keep costs low, allowing TNOs, construction companies, and other companies to bid for the design, financing, construction, ownership, and operation of onshore transmission grid assets. Although the new CATO regime was supposed to commence in 2018, Ofgem announced in June 2017 that it had to be postponed because, in the aftermath of the 2016 Brexit decision, Parliament had been unable to make the necessary legislative changes (Ofgem, 2017).
4.4 Electricity Consumption Sub-system
4.4.1 Techno-Economic Developments
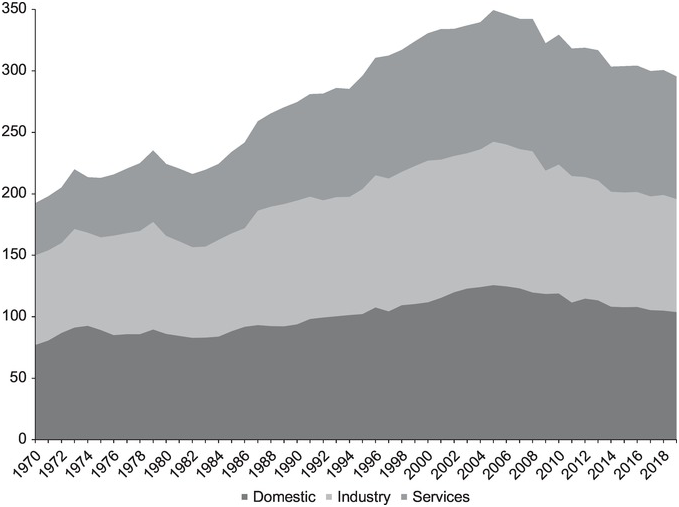
Electricity consumption (Figure 4.11) peaked in 2005 and then declined by 15% to 2019, owing to the combined effect of energy efficiency innovations, the financial crisis (and austerity policies), and offshoring which reduced industrial demand (Hardt et al., Reference Hardt, Owen, Brockway, Heun, Barrett and Taylor2018, Reference Hardt, Barrett, Brockway, Foxon, Heun and Owen2017). Although electricity consumption by households, industry, and servicesFootnote 9 is of roughly equal size, we focus here on domestic consumption, because of our interest in social practices and end-use functionalities.
Final electricity consumption by different sectors in TWh, 1970–2019
The number of appliances in UK households has increased continuously since the 1970s (BEIS, 2019; Figure 4.12) because of the introduction of new products (e.g., juicers, microwaves, mobile phones, television flat screens), more use of existing products for different purposes (e.g., more lightbulbs to create ambiance), multiple household ownership of some appliances (e.g., fridges, TVs, computers), and increasing affordability due to manufacturing efficiencies and cost decreases (EST, 2011; McMeekin et al., Reference McMeekin, Geels and Hodson2019; Van Buskirk et al., Reference Van Buskirk, Kantner, Gerke and Chu2014).
Total number of electrical appliances owned by UK households in thousands, 2006–2019
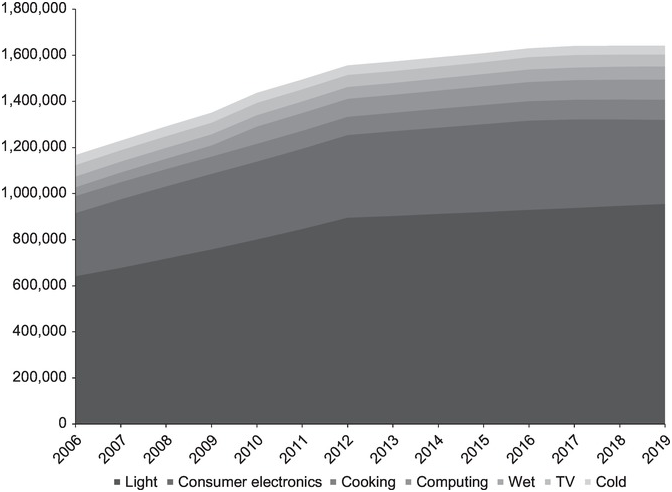
Household electricity consumption increased until 2005, but then declined by 17% until 2019 (Figure 4.11), despite increasing appliance use (Figure 4.12) by an increasing population. Electricity consumption by various domestic appliances has evolved in different ways in the last four decades (Figure 4.13), reflecting different diffusion patterns and innovation trajectories.
UK domestic electricity consumption by appliance category (1970–2015) in kilotons of oil equivalent
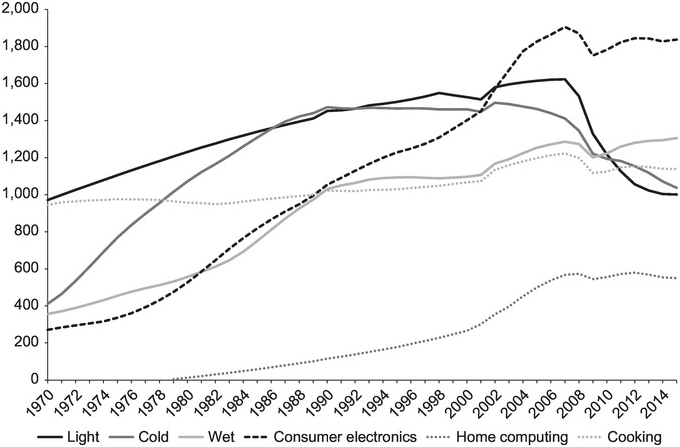
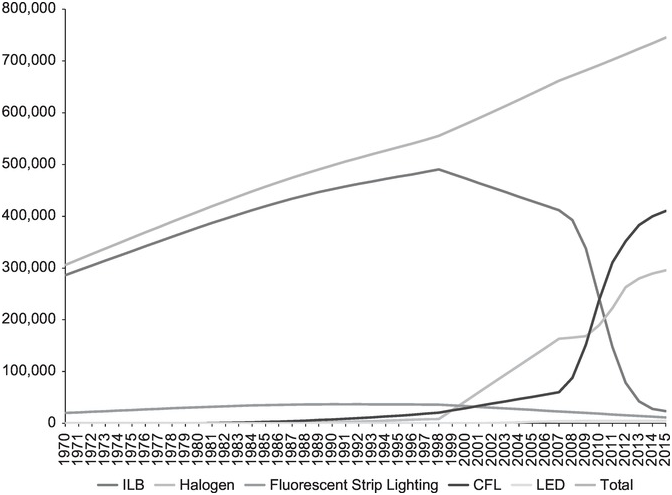
Electricity use for lighting increased until the mid-2000s, owing to expanding numbers of lightbulbs in UK households. Between 2007 and 2015, however, electricity use for lighting decreased by 38% (Figure 4.13), owing to a technological shift from ILBs (incandescent light bulbs) to CFLs (compact fluorescent lighting), halogen bulbs, and LEDs (light emitting diodes) (Figure 4.14). This unfolding transition (which is further analysed in Section 4.5.5) has reduced electricity consumption because the new technologies are more energy efficient than ILBs, which convert only 5% of electrical energy into light (Aman et al., Reference Aman, Jasmon, Mokhlis and Bakar2013).
Number of light bulbs (in thousands) owned by UK households, 1970–2015
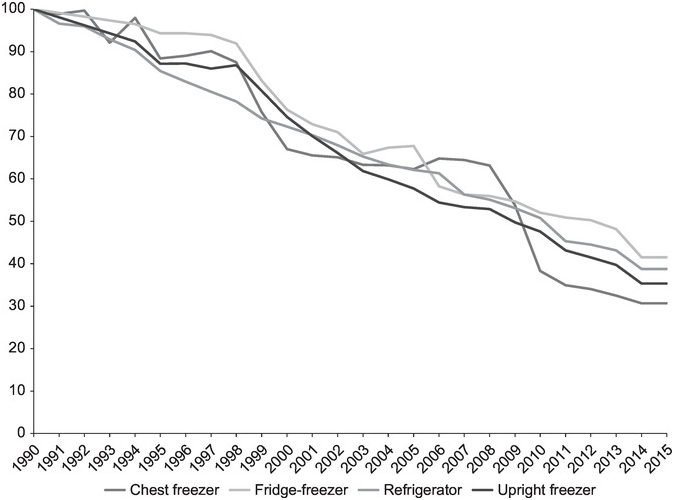
Electricity use by cold appliances started to decrease in the 1990s, despite continued proliferation of refrigerators, fridge-freezers, chest freezers, and upright freezers. This decrease was driven by impressive incremental energy efficiency innovations that reduced electricity consumption for new appliances by 59–69% between 1990 and 2015 (Figure 4.15).
Average energy consumption of new cold appliances, 1990–2015 (index 1990=100)
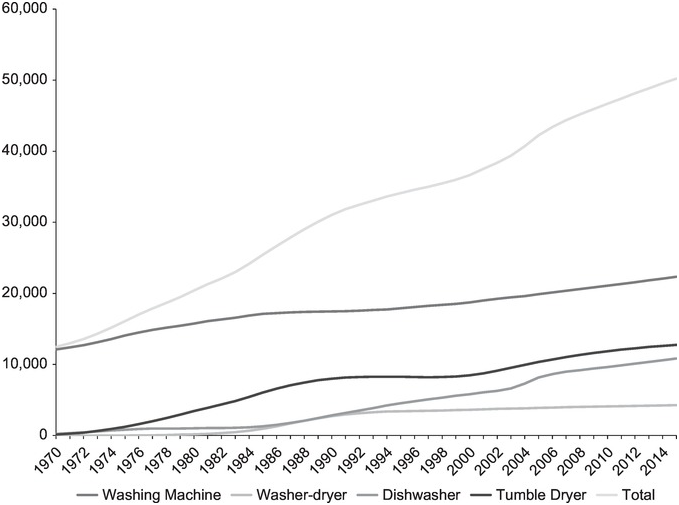
Electricity use by wet appliances increased in the 1970s and 1980s, plateaued in the 1990s, but has increased further since the early 2000s. Electricity use by washing machines decreased between 1986 and 2015, owing to 33% energy efficiency improvements in new washing machines in that period (DECC, 2016). But these effects were counteracted by the diffusion of new appliances such as dishwashers, tumble dryers, and washer-dryers (Figure 4.16), which also became larger and more powerful.
Number of wet appliances (in thousands) owned by UK households, 1970–2015
Electricity use for cooking has remained largely stable since the 1970s (Figure 4.13). Electricity consumption by consumer electronics has increased substantially since the 1970s, owing to a quadrupling of TV ownership (resulting in more than two TVs per household by 2015) and the proliferation of new appliances (set-top boxes, games consoles, and DVD/VCR products). Since the mid-2000s, however, energy efficiency innovations such as increasing use of light-emitting diodes (Park et al., Reference Park, Phadke, Shah and Letschert2013) has helped to stabilise electricity use by consumer electronics (Figure 4.13).
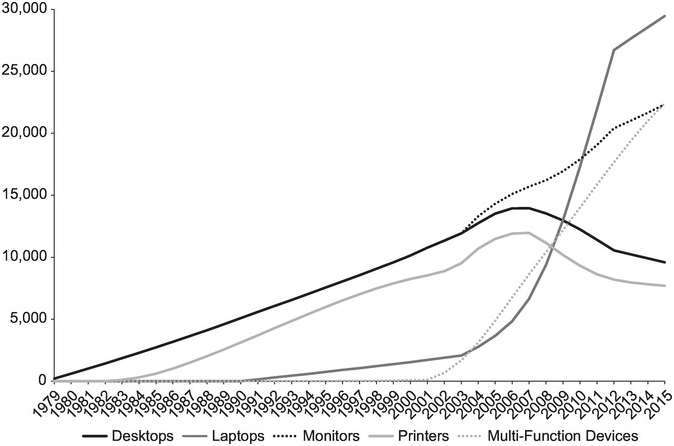
Electricity use by home computing increased substantially in the 1990s and 2000s due to the emergence of an information society and the associated proliferation of computers, monitors, gadgets, and devices with higher processing power, improved connectivity, and additional functionalities (Chandler, Reference Chandler2001; Røpke et al., Reference Røpke, Christensen and Jensen2010). Since the late-2000s, however, their domestic electricity consumption has stabilised (Figure 4.13) because of energy efficiency innovations and the shift from desktops to laptops and from printers to multi-functional devices (Figure 4.17).
Number of home computing devices (in thousands) owned by UK households, 1970–2015
4.4.2 Actors
Firms: Most electric appliances are imported into the UK or produced by foreign-owned manufacturing facilities, leading to the decline of UK electric appliance manufacturing (Beynon et al., Reference Beynon, Cam, Fairbrother and Nichols2003). While appliance brands have proliferated in the UK, these are owned by a small number of multinational companies operating in a highly concentrated and oligopolistic market. Multinational appliance manufacturers (of televisions, radios, computers, refrigerators) are economically important and technically dynamic, generating high degrees of product innovation along many quality and performance dimensions (Chandler, Reference Chandler2001; Godoe, Reference Godoe2000). The Association of Manufacturers of Domestic Appliances (AMDEA) is the UK appliance trade association, which represents the interests of international appliance firms active in the UK.
In the early 1990s, appliance manufacturers and trade associations such as AMDEA resisted the European Union’s energy efficiency initiatives (Boardman, Reference Boardman2004). They ‘refused to supply data and cooperate in an energy efficiency study upon which to base policy, hampering the efforts of the EU to meet its obligations under the Climate Convention’ (Newell and Paterson, Reference Newell and Paterson1998: 684). This resistance stemmed from the belief that energy efficiency was a marginal issue for consumers and that energy labels would therefore only impose costs on manufacturers (Toke, Reference Toke2000).
By the mid-1990s, however, these actors changed their strategic orientation and began to engage more actively with energy efficiency as an additional consideration. By 1996, ‘AMDEA had become convinced that they needed to protect their interests by acting within, rather than against the energy efficiency lobby. Their world view had changed. Peter Carver, AMDEA Director commented: “Pressure on us to improve energy efficiency is never ending. Unless we agree voluntary codes, regulations at a European level are inevitable”’ (Toke, Reference Toke2000: 850). Since then, AMDEA has been involved in several initiatives, further discussed later, and by the 2010s was actively lobbying for stronger energy efficiency policies: ‘A change in focus is required so that policies to reduce demand for electricity receive at least as much, if not more, attention than policies to encourage low carbon electricity generation’ (AMDEA, 2014: 7).
As such, the energy efficiency agenda has been actively incorporated by incumbent firms, partly as a strategy for regime protection and reproduction. Their mostly incremental innovation strategies substantially improved energy efficiency performance in cold appliances, wet appliances, consumer electronics, and home computing devices. In 2010, the Energy Saving Trust established a ‘voluntary retailer initiative’, in which eight leading retailers agreed to promote more energy efficient computers and televisions and remove the most inefficient models from their shelves by 2011 (IPPR, 2013).
Incumbent lighting companies pursued a more radical innovation strategy, shifting from ILBs to more efficient CFLs and LEDs (Franceschini and Alkemade, Reference Franceschini and Alkemade2016). This shift, which is further analysed in Section 4.5.5, was stimulated by pressure from environmental NGOs, regulatory pressure that culminated in the 2009 European ILB ban, and competitive pressure from Chinese companies, which made incumbent companies more willing to explore the economic opportunities of new lighting technologies.
In sum, appliance and lighting companies have incorporated energy efficiency as an additional regime dimension, which has led to some re-orientation of industry strategies and innovation patterns. But it also left other regime rules intact, such as a focus on persistent innovation, rapid product lifecycles, increasing functionalities, differentiation, and market expansion (Wieser, Reference Wieser, Bakker and Mugge2017; Wieser and Tröger, Reference Wieser and Tröger2018).
Wider Publics: From the main environmental UK NGOs, the Green Alliance has been the most active in pushing the consumer-focused energy efficiency agenda. Since the mid-1990s, its campaigns often aligned with AMDEA in putting pressure on the UK government (and European policymakers) to intensify policy support for energy efficiency (Boardman, Reference Boardman2004). At the European level, environmental NGOs such as WWF and Greenpeace started criticising the inefficiency of ILBs in the early 2000s and succeeded in establishing a new cultural framing that associated ILBs with energy waste (Franceschini and Alkemade, Reference Franceschini and Alkemade2016).
Policymakers: Electricity consumption generally receives less policy attention than electricity supply. Despite its limited visibility, policymakers have been relatively effective in stimulating the development and adoption of energy efficiency innovations in various appliances, leading to a 15% reduction in electricity consumption between 2005 and 2019 (Figure 4.11), despite an increase in the number of appliances (Figure 4.12).
The push for energy efficiency innovation initially came from European regulatory frameworks, and their translation into national demand-oriented policies (Boardman, Reference Boardman2004; Toke, Reference Toke2000). The 1992 European Directive on Energy Labelling, for instance, required manufacturers of light bulbs, white goods (e.g., refrigerators, washing machines, dishwashers), and other appliances to provide consumers with information about the energy efficiency performance of their products.
The UK government was initially slow and reluctant to implement this Directive into national policy, adopting a compliance-only approach in which it introduced labels but otherwise undertook little effort to raise public awareness (Boardman, Reference Boardman2004). The government did, however, establish the Energy Saving Trust in 1992 as an independent body to promote energy efficiency, publish research, and provide information to consumers. Since the mid-1990s, the UK government has begun to engage more strongly with demand reduction and efficiency improvement, which was helped by the strategic reorientation of appliance manufacturers, discussed earlier. Between 1994 and 2012, UK policymakers ran several programmes that placed energy savings obligations on energy suppliers (Rosenow, Reference Rosenow2012), which will be further discussed later.
Regulatory pressures further increased with the 2005 European Ecodesign Directive, which introduced a new framework approach in which minimum energy efficiency standards for energy-using products would be articulated that would increase over time and thus remove the worst products from the market. These tightening standards further stimulated international appliance manufacturers to innovate and improve energy efficiency. The 2005 framework approach was elaborated by the 2009 Ecodesign Directive that specified minimum standards for more than 40 energy-using product groups (including lightbulbs, televisions, refrigerators, and boilers), which were implemented and adjusted through successive Ecodesign working plans (2009–2011, 2012–2014, 2016–2019). For incandescent lightbulbs (ILB), the increasing policy pressure even culminated in a European phase-out policy, which in 2009 banned the sale of ILBs of more than 80W, progressing to lower wattage in successive years (which is further discussed in Section 4.5.5).
The Ecodesign Directive was complemented by the 2010 EU Framework Directive on energy labelling, which updated the 1992 policy by harmonising national measures on end-user information for energy-related products via labelling and product standard information. New Ecodesign and Energy Labelling measures were agreed in 2018 and 2019, covering more product categories and raising standards further.
In the late 2000s, UK policymakers also showed some interest in behaviour change, which led the Energy Saving Trust to initiate information campaigns encouraging consumers to switch off lights when not in use, fill the kettle to the level required, and reduce the use of standby functions. These campaigns were mostly limited in their success, which led policymakers to acknowledge that: ‘Currently we lack deep understanding of the complexities of what really drives energy demand and how to change it at user and provider level’ (DECC, 2012a: 56). Subsequent policy efforts therefore continued to focus mostly on energy efficiency improvements in technical appliances, which have been relatively effective in reducing electricity demand, as noted earlier.
Users: Most electricity consumption is routine, taken for granted, and detached from material supply realities. Most users know little about the worlds behind the socket (how it works, where it comes from, how it is organised). They mainly interact with suppliers through meters and bills, supplier choice, and the occasional need for electrical repair. Consumer switching between suppliers was limited until 2014 but then increased rapidly (Figure 4.10), leading to more new entrants and increased competitive pressure in the electricity market.
Climate change is of less concern to consumers than electricity bills. Few UK consumers opt for ‘green’ electricity suppliers. Although most consumers do not actively choose renewables, they ultimately pay for the upstream investments in RETs and grid innovations through their energy bills and general taxation (which finances government subsidies to generators). This ‘indirect’ or ‘involuntary’ market demand, which has been created through regulations and billing practices, helps explain the higher speed of low-carbon transitions in electricity, compared to other domains (where consumers need to make deliberate choices to buy electric cars, insulate homes, or change food purchases).
Electricity is used by specific appliances, which relate to particular end uses and social practices (Shove and Walker, Reference Shove and Walker2014). Regarding the laundry, for instance, more people have started to wash at low temperatures since the early 2000s (Mylan, Reference Mylan2017). But energy saving gains were counteracted by other behaviour changes such as washing clothes more frequently in smaller loads and drying them in tumble-dryers, driven by the desire for greater convenience (Mylan and Southerton, Reference Mylan and Southerton2018).
Regarding cooling, people have also adopted more energy-efficient fridges and freezers. But here, too, energy savings have been partly eroded by increasing use of multiple cold appliances in households and shifts towards larger appliances (DEFRA, 2009). The associated behavioural trends towards storing more foods and drinks in cold appliances partly relate to the stronger preferences for chilled goods and the increasing ‘cultural significance of freshness’ (Evans and Mylan, Reference Evans and Mylan2019: 426). The increasing use of freezers, in turn, relates to the diffusion of microwaves and ready-meals and to changes in food preparation patterns towards greater convenience and flexibility, which have consequently become significantly entrenched in modern ways of living (Hand and Shove, Reference Hand and Shove2007).
End-uses and social practices are thus deeply intertwined with persistent cultural conventions such as convenience (e.g., storing ready-meals in freezers, heating food in microwaves, dishwashers, drying clothes in tumble dryers), cleanliness (e.g., more frequent laundry cycles), fun and novelty (e.g., new gadgets and functionalities), and freshness (e.g., more cold drinks) as drivers of demand for domestic appliances (Hand and Shove, Reference Hand and Shove2007; Mylan, Reference Mylan, Bulkeley, Paterson and Stripple2016; Mylan and Southerton, Reference Mylan and Southerton2018; Shove, Reference Shove2003). Consumers also expect new functionalities and enhanced standards of home entertainment and digital connectivity (Crosbie, Reference Crosbie2008). More generally, electricity has become a taken-for-granted background to modern life. Increased appliance use is associated with progress, and associated electricity consumption is rarely questioned (Shove and Walker, Reference Shove and Walker2014). The increasing policy and business focus on energy efficiency does not question these cultural conventions or call for deeper behaviour change.
4.4.3 Policies and Governance
Formal Policies
Since the 1990s, European policies have been important in stimulating international appliance manufacturers to improve the energy efficiency of their products, which they actively engaged with after an initial period of resistance, as discussed previously.
National policies have been important to stimulate the adoption of energy-efficient appliances. Since the mid-1990s, UK policymakers have run several programmes that have placed energy savings obligations on energy suppliers, which incentivised them to engage with demand reduction and help diffuse energy-efficient appliances. These included the Energy Efficiency Standards of Performance (EESoP), which ran from 1994 to 2002, the Energy Efficiency Commitments (EEC) from 2002 to 2008, and the Carbon Emissions Reduction Target (CERT) from 2008 to 2012. While EESoP programmes focused exclusively on electric appliances, EEC and CERT also included gas, heating, and home insulation, which increasingly became the prime focus because of greater energy and carbon saving potential.
The various energy savings obligations set (gradually increasing) energy saving targets on energy suppliers, which could pass the costs for their actions and measures on to their customers via energy bills (although this was constrained by price control measures). This policy design fitted with neoliberal policy thinking because it was assumed that companies would compete to meet their targets at the lowest cost to consumers, who were themselves assumed to have incentives to switch to suppliers with the lowest prices (Rosenow, Reference Rosenow2012). The successive programmes with energy savings obligations were relatively effective, leading electricity suppliers to adopt give-away programmes of energy-efficient lightbulbs and the promotion (with retailers) of energy-efficient cold appliances through discounts and targeted in-store marketing strategies (AMDEA, 2014). Between 2002 and 2005, the EEC, for instance, brought forward an estimated 4.5 million sales of fridge-freezers, compared to the existing market trend (DEFRA, 2009).
From 2013, the Energy Company Obligations (ECO) focused exclusively on heating and insulation, which thus relieved electricity companies from demand-reduction obligations.
UK policymakers implemented the 2005 and 2009 European Ecodesign Directives and subsequent upgrades through their Products Policy (DEFRA, 2009), which: a) removed the least efficient products from the market (using European minimum standards), b) encouraged the development of more efficient products (through R&D and innovation policy), and c) stimulated market uptake (through labelling, public information, producer obligations, public procurement, and voluntary initiatives). Initial implementation was relatively slow, so that by 2012 only 13 out of 25 product categories in the first tranche had regulations applied to them (Cary and Benton, Reference Cary and Benton2012). In subsequent years, however, the Products Policy was further implemented, which together with tightening product standards stimulated substantial energy efficiency improvements.
Governance Style
Initial European Energy Labelling Directives were relatively weak market-based policies, which assumed that providing consumers with information (about energy efficiency ratings of appliances) would lead them to choose more energy-efficient products. When this proved limitedly effective, stronger regulatory control policies were introduced such as the European Ecodesign Directives, which articulated gradually strengthening minimum energy efficiency standards that pushed appliance manufacturers to innovate and improve their products.
The policy processes for these Directives were dominated by stakeholder consultation processes and technocratic debates about specifying the minimum level for environmental performance and the most appropriate layout of labels to communicate information to consumers (Rosenow et al., Reference Rosenow, Kern and Rogge2017). The European-level governance style thus has corporatist characteristics, with close interactions between policymakers and incumbent firms, aimed at negotiating the feasible speed of energy efficiency improvements and policies.
UK demand-focused policies also started relatively weakly but gradually strengthened over time, mostly through tightening regulations and standards. Successive energy savings obligations (1994–2012) set gradually increasing targets on electricity companies, which stimulated them to help deploy and diffuse energy-efficient appliances. Energy saving obligations on electricity suppliers were dropped by the 2013 Energy Company Obligations, which focused exclusively on heating and insulation. But since the late 2000s, the UK’s Products Policy has represented a fairly interventionist market shaping governance style, which advanced energy-efficient appliances through increasing minimum standards, labelling, public information, public procurement, and voluntary initiatives.
Energy saving policies thus focused centrally on energy-efficient products, addressing both upstream technological improvements and downstream consumer demand. This product-centred approach suits the interests of incumbent appliance manufacturers, which have therefore come to support the energy efficiency agenda.
4.5 Niche-Innovations
Radical niche-innovations have emerged and diffused in each of the three electricity sub-systems, leading to substantial reconfiguration. For the electricity generation sub-system, we will analyse four niche-innovations: 1) onshore wind, 2) offshore wind, 3) bio-power, and 4) solar PV. For the electricity consumption sub-system, we will discuss two niche-innovations: 5) energy-efficient lighting, including CFL and LEDs, and 6) smart meters. And for the grid sub-system, we will also analyse two niche-innovations: 7) smart grids, and 8) two flexibility-enhancing options: battery storage and demand-side response.
The analysis of each niche-innovation will address both techno-economic developments and actors and institutions. Several niche-innovations have experienced substantial changes in both analytical dimensions as they first emerged and then diffused. The analysis of niche-innovations in the electricity systems is therefore somewhat longer than for the heat and mobility systems.
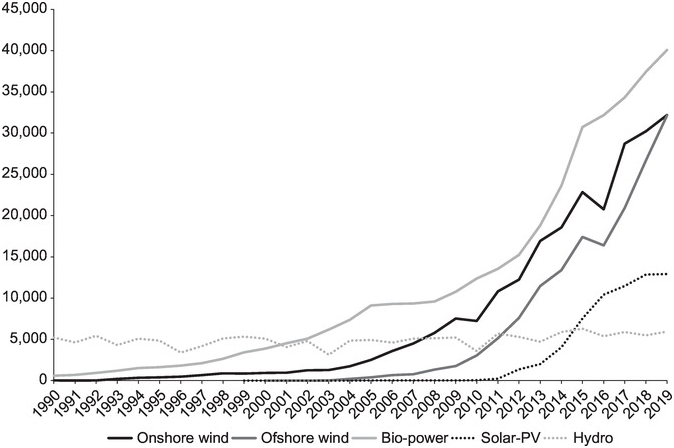
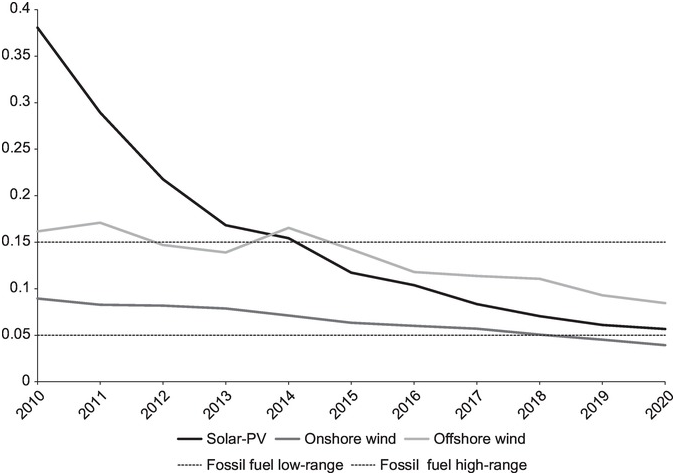
Power-generation niche-innovations, in particular, have experienced relatively long developmental trajectories. Renewable electricity technologies (RETs) emerged in the 1990s, experienced several ups and downs in the 2000s, and diffused quite substantially in the 2010s (Figure 4.18). Onshore wind, offshore wind, and bio-power diffused fastest in recent years, because of government support and deployment by incumbent actors (utilities, project developers, foreign energy companies). Solar-PV also diffused substantially, often through deployment by new entrants such as farmers and households. Cumulatively, RETs accounted for 39% of electricity generation in 2019, which means they are taking on regime-like characteristics. Rapidly falling costs (Figure 4.19) have been an important driver of the diffusion of RETs, which are increasingly cost-competitive with coal and gas-fired power plants. Between 2010 and 2020, the global average levelised cost of electricityFootnote 10 (LCOE) decreased by 85% for utility-scale solar-PV, 56% for onshore wind, and 48% for offshore wind (IRENA, 2021).
Electricity generated from renewable sources in GWh, 1990–2019
Global average levelised costs of electricity, 2010–2020 (in constant 2020 US dollars per kWh) for different technologies
Other important drivers for rapid diffusion were renewable energy policies, which affected all RETs and are therefore briefly discussed here, before we analyse the individual niche-innovations. Renewable electricity policies emerged as a ‘side-effect’ (Toke and Lauber, Reference Toke and Lauber2007) of support for nuclear power via the 1990 Non-Fossil Fuels Obligation (NFFO) that required electricity companies to buy certain amounts of nuclear power. Renewables’ advocates argued that renewable electricity technologies (RETs) should also qualify for non-fossil fuel subsidies, which led the government to introduce an NFFO policy for renewables in the form of a competitive auction system in five successive rounds between 1990 and 2004. Bidders could submit proposals to produce a certain amount of renewable electricity for a certain price. In each round, the government awarded contracts to the lowest bidders within particular technology bands (Mitchell and Connor, Reference Mitchell and Connor2004).
The NFFO-bidding process was complicated and required sophisticated financial capabilities and sufficient capital to cope with economic risks and policy uncertainties. These characteristics favoured professional corporate actors and discriminated against smaller new entrants with less-developed procedural and financial capabilities and resources (Mitchell and Connor, Reference Mitchell and Connor2004; Toke, Reference Tilly2005). The NFFO was limitedly effective because many accepted bids never resulted in actual RET-deployment, because many winning bidders realised their low-cost proposals were too uneconomical to be realised (Toke and Lauber, Reference Toke and Lauber2007). Over the whole period (1990–2004), only 30% of winning projects were actually completed (Wood and Dow, Reference Wood and Dow2011).
In 2002 the Labour government introduced the Renewables Obligation (RO) as a new policy, requiring utilities to meet gradually increasing annual renewable electricity targets in one of several ways: a) generate renewable electricity themselves, b) buy Renewable Obligation Certificates (ROCs) from other generators, c) pay a ‘buy-out’ penalty of 3p/kWh. The RO was more market-oriented than the NFFO, because it was based on free-market trading of ROCs and abolished the NFFO’s technology banding. Because all RETs received the same number of ROCs, the RO was biased towards cheaper (large-scale) technologies such as onshore wind and landfill gas (Foxon and Pearson, Reference Foxon and Pearson2007). The RO stimulated close-to-market options, neglected innovation, and created uncertainties about longer-term policy commitment (Woodman and Mitchell, Reference Woodman and Mitchell2011). The RO also disadvantaged new entrants, because the trading of ROCs created financial uncertainties, which were easier to manage for incumbent utilities.
The increasing political salience of climate change resulted in the 2008 Climate Change Act. The translation of its high-level goals into more specific targets and plans increased policy delivery momentum, and the creation of multiple complementary instruments. For the electricity sector, the UK Low Carbon Transition Plan (2009) articulated a target of 30% renewable electricity by 2020 and an almost complete decarbonisation by 2030, which created clear directionality. Criticism of the limited effectiveness of the RO resulted in the amended Renewables Obligation (2009), which included technology bandings that allocated varying amounts of ROCs to different technologies, depending on the degree of maturity and level of risk. In 2010, the government also (reluctantly) introduced a Feed-in-Tariff (FiT) as part of a political deal with backbenchers, who wanted a stimulus for small-scale renewables in exchange for their support for nuclear and offshore wind (Smith et al., Reference Smith2014). The 2013 Electricity Market Reform (discussed in Section 4.2.3) further introduced Contracts for Difference (CfD), which provided attractive long-term incentives for large-scale renewables and nuclear power from 2017 onwards (replacing the Renewables Obligation).
The 2015 energy policy reset slashed subsidies for renewables such as onshore wind, bio-power, and solar-PV. The 2016 Brexit decision resulted in ‘a loss of time and policy momentum, … as uncertainty over Brexit continues to make it difficult to plan for the UK’s energy future’ (UKERC, Reference Turnheim and Sovacool2019: 2). A new Energy White Paper, scheduled to be published in 2019, was delayed as a result of domestic political upheaval, which created further uncertainties. Feed-in tariffs for small-scale renewables were ended in 2019, which reinforced the UK’s focus on large-scale renewables. Although the 2020 Energy White Paper confirmed the net-zero direction of travel across multiple systems, it did not articulate many new policies for renewable electricity technologies. It did, however, articulate the vision that a future ‘low-cost, net zero consistent system is likely to be composed predominantly of wind and solar’ (HM Government, 2020a: 43). This very central role of RETs is new compared to previous major policy documents in which renewables were just one among multiple generation options. Other generating options such as nuclear power and gas-with-CCS are now expected to play smaller complementary roles to RETs. The 2020 Energy White Paper also emphasises the future role of flexibility options such as batteries and demand-side response, which will be further discussed in Section 4.5.8.
While many of the renewable electricity policies we have discussed influenced all RETs, there were also specific policies that shaped RETs, as we will analyse next. We will first discuss four RET-niches, then two demand-oriented niche-innovations, and then two grid-oriented niche-innovations.
4.5.1 Onshore Wind
Techno-Economic Developments
Onshore wind deployment gradually increased in the 1990s (Figure 4.18), as utilities and project developers received continuous subsidy support over successive NFFO-rounds. Deployment accelerated rapidly after 2002 (Figure 4.18) because the RO and amended RO provided attractive financial support (Foxon and Pearson, Reference Foxon and Pearson2007).
Technical developments focused on higher wind turbines with greater capacity and on improvements in rotor turbines, drive trains, and material use. Wind forecasting models also improved, leading to better turbine siting (Gross et al., Reference Gross, Heptonstall, Greenacre, Candelise, Jones and Castillo2013). Technical improvements, learning-by-doing, and scale increases decreased the cost of onshore wind by 56% between 2010 and 2020 (Figure 4.19), making it the cheapest RET.
The 2015 reductions in subsidies and the 2016 government moratorium on new onshore wind farms from 2020 onwards (further discussed later) substantially decreased annual installation rates (Figure 4.20) with a few years lag-effect, because projects in the pipeline were still being completed.
Cumulative and annual installed capacity of UK onshore wind turbines (in MW)
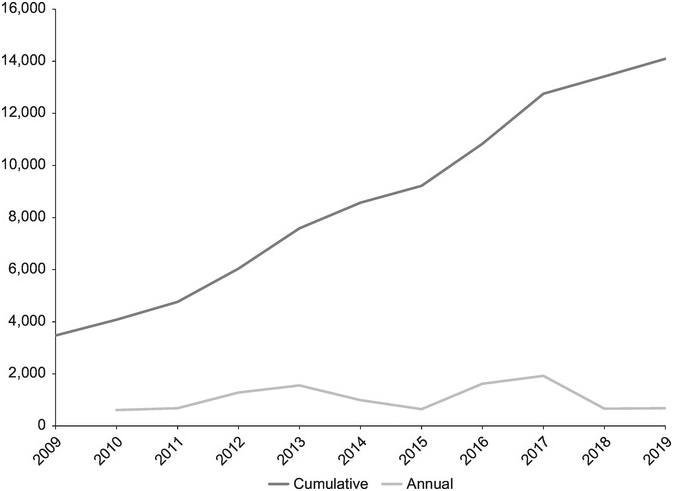
Actors and Policies
UK onshore wind development has mainly been a corporate economic activity, involving utilities, project developers, and independent generators who sell electricity to utilities. This corporate dominance differs from Germany, Denmark, and the Netherlands, where new entrants such as cooperatives, farmers, and communities have historically played a larger role (Table 4.1). There has been some rise of community wind energy in the UK since the mid-2000s (Walker and Devine-Wright, Reference Walker and Devine-Wright2008), but this has remained comparatively small, partly because of limited organisational capacities at the community level and partly because of ‘the persistence of key features of socio-technical regime for electricity provision, which continues to favour large corporations and major facilities’ (Strachan et al., Reference Strachan, Pye and Kannan2015: 106). The NFFO, RO, and CfD policies, for instance, were all designed to favour large companies, as discussed previously.
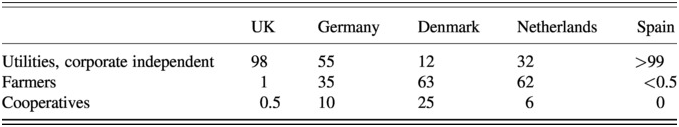
The bidding design of NFFO and RO policies also helped to create social acceptance problems, because most project developers did not start the planning permission process until after they were awarded the contract. They would then be in a hurry and often installed wind turbines without proper stakeholder consultation, which turned many stakeholders into opponents (Ellis et al., Reference Ellis, Cowell, Warren, Strachan and Szarka2009). For onshore wind, this resulted in negative sentiments and perceptions of unfair distributions of costs (local stakeholders experiencing noise, visual burdens, and shadow flicker) and benefits (project developers enjoying wind resources and financial gains).
Wind farm projects therefore encountered increasing local opposition, leading to decreasing approval rates in planning procedures from 73% in 2007 to 50% in 2012 (CCC, 2013). The public wind discourse became increasingly negative, because of concerns about subsidies, visual and landscape impacts, and the perceived invasion of the countryside by corporate interests (Kern et al., Reference Kern, Smith, Shaw, Raven and Verhees2014b). These concerns gave rise to opposition from the Campaign to Protect Rural England, which pressured local Conservative MPs, one hundred of whom wrote an open letter to the Prime Minister arguing against onshore wind subsidies (5 February 2012). These increasing socio-political problems culminated in the 2015 slashing of subsidies and the 2016 government decision to halt subsidies and not build new wind turbines after 2020.
In March 2020, however, the Johnson government overturned the moratorium, partly because nuclear power implementation problems created future capacity problems, and partly because decreasing costs enhanced the appeal of onshore wind. This U-turn enables onshore wind to participate in the 2021 CfD auction, which means that new wind farms could be up and running by the mid-2020s. The 2020 Energy White Paper confirmed that onshore wind (and solar) is allowed to compete in the next CfD auction in late 2021, which is likely to boost future diffusion.
4.5.2 Offshore Wind
Techno-Economic Developments
Offshore wind (OffSW) initially diffused slower than onshore wind because of greater technical difficulties and higher cost. In the 2001–2007 period, government support stimulated experimentation and learning with six successive demonstration projects (Kern et al., Reference Kern, Smith, Shaw, Raven and Verhees2014b). Technological developments led to larger turbines with higher capacities. Operational challenges associated with salt water, stronger winds, and waves led to technical changes in materials, electronics, and gearing mechanisms. To reduce visual complaints, OffSW-farms were increasingly located further from shore in deeper waters, which required technology developments to deal with seabed foundation challenges. The installation of OffSW-farms further required specialised offshore capabilities and tools (e.g., docks, ships, platforms, cranes, drilling tools), creating a new market for UK offshore firms from the oil and gas sector.
Technical improvements, scale economies, and learning-by-doing reduced the levelised cost of electricity from offshore wind by 48% between 2010 and 2020 (Figure 4.19). In the third (2019) CfD auction round, for projects coming online in the mid-2020s, costs decreased further, reaching as low as £40 MW/h.
Offshore wind diffused rapidly after 2009 (Figure 4.18), because the amended RO provided attractive financial support (Heptonstall et al., Reference Heptonstall, Gross, Greenacre and Cockerill2012). Cumulative and annual installed OffSW capacity increased (Figure 4.21), except for 2016 when no wind farm project was completed (which relates to the lumpy nature of these mega-projects). Rapidly increasing installed capacity made the UK a world leader in OffSW. At 1.2 GW operational capacity, the newly installed (2019) Hornsea One is the largest offshore wind farm in the world.
Cumulative and annual installed capacity of UK offshore wind turbines (in MW)
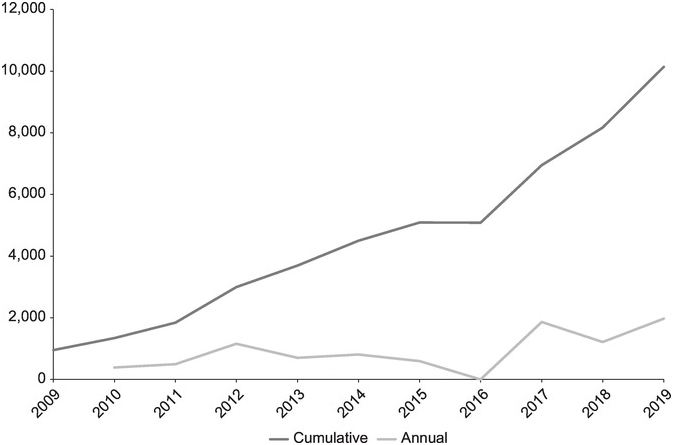
Actors and Policies
Offshore wind is supported by a powerful network of actors with different but congruent interests (Kern et al., Reference Kern, Smith, Shaw, Raven and Verhees2014b). Big utilities (Vattenfall, RWE, E.ON, SSE, Centrica) and energy companies (Dong, Statoil) became the dominant project developers for OffSW-farms, which enabled them to preserve their business model based on large-scale, centralised forms of electricity generation. Research and technological innovation, aimed at OffSW cost reduction and incremental improvement, was supported by the Carbon Trust, Energy Technologies Institute, Technology Strategy Board, and the Engineering and Physical Sciences Research Council. Multiple UK ministries were involved. DECC stimulated OffSW because of climate and energy targets. The Department for Business, Innovation and Skills was interested in business opportunities and jobs related to OffSW. Ofgem was involved to arrange grid connections. And the Crown Estate, as the owner of the seabed, was involved to provide and sell wind farm concessions. Environmental NGOs also supported OffSW, which they preferred over onshore wind (Toke, Reference Toke2011). And trade associations such as RenewableUK and the Offshore Wind Developers Forum provided support and coordination for the network.
Although most OffSW technologies were initially imported (e.g., turbines from Siemens and Vestas), domestic UK manufacturing capacity has gradually increased as international firms (e.g., Siemens, General Electric, Mitsubishi) set up production facilities in the UK.
Despite high technology costs, government support for OffSW has been strong since the early 2000s. Capital grants and the Renewables Obligation (RO) supported early demonstration projects. The technology banding in the amended 2009 RO, which increased the ROCs per MWh for OffSW from 1.5 to 2, created an attractive support premium estimated at £100/MWh on top of the retail price (Heptonstall et al., Reference Heptonstall, Gross, Greenacre and Cockerill2012). From 2009, the government has stimulated research and technology development projects, investing £206 million through various schemes led by DECC, Energy Technologies Institute, BIS, and the Technology Strategy Board (see Kern et al. (Reference Kern, Smith, Shaw, Raven and Verhees2014b) for details). In 2011, the government also created the Offshore Wind Cost Reduction Task Force, with the aim of reducing costs to about £100/MWh by 2020, which was markedly successful. The three CfD auction rounds (in 2015, 2017, and 2019) provided further support for OffSW but also helped to drive costs down.
In March 2019, the government and industry partners (including offshore wind developers, equipment manufacturers, and supply chain actors) agreed an Offshore Wind Sector Deal that serves as the roadmap for a 30GW installed capacity target by 2030. This would triple current capacity and enable OffSW to provide about 30% of the UK’s electricity. As part of the deal, the government committed £557 million funding for bi-annual CfD auctions for the next 10 years, while industry partners committed to increase UK manufactured content to 60% by 2030, increasing exports fivefold to £2.6bn by 2030, and invest up to £250m to improve productivity and innovation in the UK supply chain. In December 2019, the newly elected Johnson government raised the 2030 target from 30GW to 40GW, making offshore wind a central plank of the future UK electricity system. The new 40GW target was confirmed in the 2020 Energy White Paper.
4.5.3 Bio-power
Techno-Economic Developments
Bio-power is a heterogeneous niche associated with a variety of feedstocks (such as wood pellets, wood residues, farming residues, straw, sewage sludge, waste) and conversion routes (e.g., combustion, gasification/pyrolysis, anaerobic digestion). While cumulative bio-power has grown substantially since 1990 (Figure 4.18), specific sub-categories have experienced several ups and downs (Figure 4.22):
Landfill gas, which uses bio-technological processes to convert organic waste to methane that is burned in gas turbines, grew rapidly in the mid-1990s and early-2000s due to continuous NFFO support and the availability of many landfill sites. Deployment rates plateaued in the mid-2000s as new waste policies reduced the amount of organic landfill waste.
Dedicated biomass plants diffused in the 1990s in the form of solid waste combustion plants (e.g., demolition wood) and other bioenergy options (e.g., animal biomass, sewage sludge digestion, anaerobic digestion). Both categories remained relatively small because of long-term supply uncertainties and local opposition but have gained some momentum since the mid-2000s, e.g., through increased construction of small-scale dedicated biomass plants.
Co-firing of biomass with fossil fuels in adjusted coal plants grew rapidly after the 2002 Renewables Obligation, because it was a relatively easy and cheap way for utilities to meet their renewables obligations. Co-firing decreased rapidly after 2011 and gradually disappeared, with co-firing plants converting entirely to burning biomass.
After 2011, the conversion of several large coal plants to biomass burning (e.g., Drax, Ironbridge, Tilbury, Lynemouth) rapidly increased the use of biogenic solid fuel (such as wood chips or pellets).
Electricity generated from bio-power sub-categories in GWh, 1990–2019
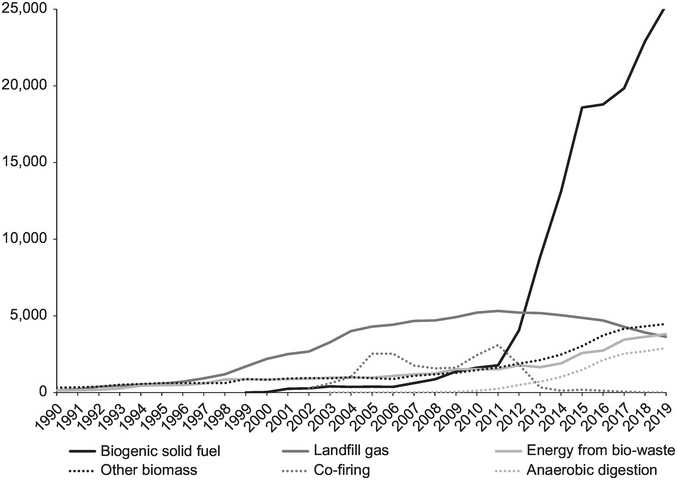
Since many bio-power technologies are relatively mature, innovation efforts have focused on incremental improvements addressing problems associated with boiler injection mechanisms, ash deposition, boiler corrosion, and fuel storage and handling (Perry and Rosillo-Calle, Reference Perry and Rosillo-Calle2008). BECCS (bioenergy with carbon capture and storage) also received attention (especially at Drax) because this would enable negative emissions.Footnote 12 This option is hampered, however, by the lack of feasible CCS technologies and concerns about sustainable biomass supply (Fridahl and Lehtveer, Reference Fridahl and Lehtveer2018).
Levelised costs of different bio-power options vary substantially because of differences in technologies and supply costs of different kinds of biomass. The government’s latest levelised cost estimates for 2025 put dedicated biomass at £97/MWh, biomass conversion at £87/MWh and biomass-CHP at £167/MWh (BEIS, 2016). Average installed costs/kW of electricity from biomass have not decreased over time, which contrasts markedly with other RETs (Figure 4.23).
Global weighted-average total installed costsFootnote 11 of different RETs (in 2020 USD/kW), 2010–2020
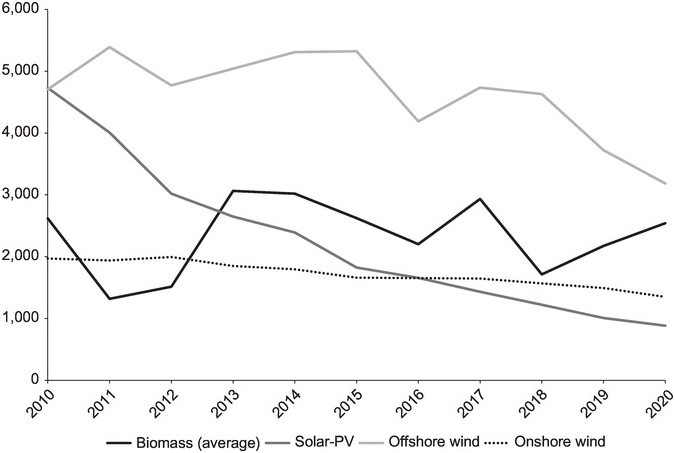
Actors and Policies
Actor-networks in the bio-power niche are fragmented, with each sub-category having distinctive principal actors and actor constellations: landfill gas is mainly enacted by professional landfill site operators; anaerobic digestion involves a variety of actors (farmers, food and drink processors, local communities) associated with alternative feedstocks; energy-from-waste incineration projects are enacted by project developers or waste companies; dedicated biomass plants (which tend to be relatively small at under 50 MW) are mostly operated by new entrants (e.g., sawmills, poultry farms); biomass conversion involves coal plant owners converting to co-firing or 100% biomass combustion plants.
The principal actors in these sub-niches interact with networks comprising technology suppliers, local policymakers (for planning purposes), investors, energy companies, and suppliers of waste or plant biomass. Local residents, NGOs, and communities have sometimes opposed energy-from-waste incineration and anaerobic digestion projects, because of concerns about smell, unhealthy emissions, or inconvenience from waste supplying trucks. Their protests can prevent or delay project developers from acquiring local planning permissions (Upreti and Van der Horst, Reference Upham, Dütschke, Schneider, Oltra, Sala and Lores2004).
NFFO and RO policies supported bio-power niches in the 1990s and 2000s, including smaller dedicated biomass plants. The UK Bioenergy Strategy (DECC, 2012b) represented a major policy change, which hindered the expansion of dedicated biomass and shifted the focus towards the conversion of coal plants into biomass-burning plants through stronger market shaping policies. It placed a 400MW cap on the total amount of dedicated biomass that could qualify for RO and excluded dedicated biomass from the CfD policy that replaced the RO in 2017. These restrictions did not apply to co-firing and biomass conversions, which received loan guarantees and subsidies through the RO and CfD.
Deployment of biogenic solid fuel accelerated rapidly after the 2012 policy shift. These converted biomass plants were large-scale facilities, which required some technical adjustments, but enabled coal plant operators to extend the plant’s lifetime and circumvent the European Large Combustion Plant Directive.
The policy shift triggered a public controversy about the sustainability of imported biomass pellets (from forests in British Columbia and the United States). A 2012 report by the Royal Society for the Protection of Birds, Friends of the Earth, and Greenpeace (titled ‘Dirtier than coal? Why government plans to burn trees are bad news for the planet’) criticised DECC’s assumptions for sustainability assessments, which ignored ‘carbon debt’ and indirect substitution emissions. The NGOs therefore campaigned against industrial-scale ‘Big Biomass’, including via direct protests at the 2013 opening of a converted unit of the Drax coal-fired plant and through a 2013 complaint by Friends of the Earth to the European Commission, questioning the legality of £75 million loan guarantees to Drax. In 2014, the government admitted mistakes in calculating carbon savings from large-scale biomass (DECC, 2014b) and said that biomass sustainability policies would be adjusted. In 2015, the newly elected Conservative government slashed financial support schemes for RETs, including biomass. But Drax won a CfD auction for a third biomass unit, which was again met with EU-level contestation about state aid. In December 2016, the European Commission ruled in favour of Drax, allowing its third unit to convert to wood pellets, followed by a fourth unit in 2018.
4.5.4 Solar-PV
Techno-Economic Developments
Solar photovoltaics (PV) emerged in the 1970s in space applications and then through the 1980s and 1990s in stand-alone applications without grid connection, for example, remote dwellings, boats, caravans, roadside emergency telephones. From the late 1990s, the UK saw modest deployment of solar-PV for domestic power generation. Diffusion rapidly accelerated after the 2010 Feed-in-Tariff (Figure 4.24), which provided stable long-term payments that made deployment economically feasible. Diffusion was also stimulated by positive cultural discourses and large reductions in the price of solar panels, which decreased by about 90% between 1976 and 2010 (Gross et al., Reference Gross, Heptonstall, Greenacre, Candelise, Jones and Castillo2013: 54) and another 85% between 2010 and 2020 (Figure 4.19). Price reductions in the 2010s were driven by learning-by-doing, scale economies in Chinese mass production, overproduction, and price dumping (Lauber and Jacobsson, Reference Lauber and Jacobsson2016; Nemet, Reference Nemet2019).
Cumulative UK installed capacity of solar-PV (in MW) by capacity size, 2010 to May 2020
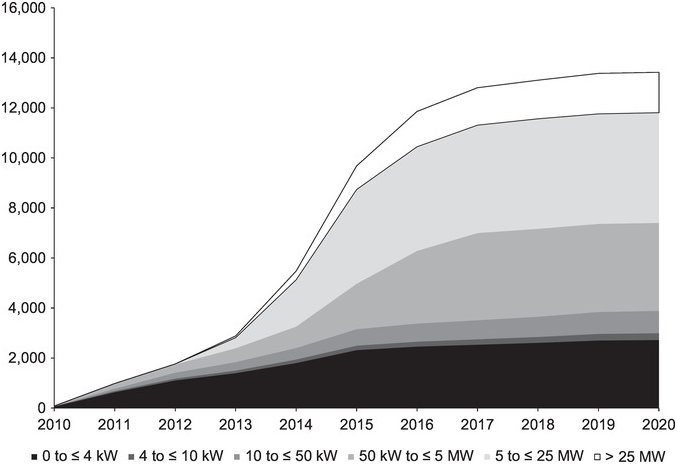
Solar panels are a modular technology, which can be installed in various sizes to suit the demands of different users:
Small-scale solar-PV (<10 kW) is commonly installed on domestic rooftops.
Mid-size building-mounted solar-PV (10–50 kW) is suitable for commercial and non-domestic properties (offices, hospitals, schools, factories, hotels, supermarkets, warehouses). Communities also installed mid-size ground-based solar farms, which delivered directly to the grid.
Large-scale (50kW–5M) and utility-scale solar farms (>5 MW) are mostly ground-based installations in fields, which can be up to 40 hectares.
Mature first-generation technologies, such as crystalline silicon, dominate the market. Incremental innovation focuses on module design and production processes, for example, improvements in silicon wafer cutting, automation, and standardisation (Gross et al., Reference Gross, Heptonstall, Greenacre, Candelise, Jones and Castillo2013). Second-generation technologies, such as thin-film solar cells, are improving, offering the potential of lower material and manufacturing costs and easier and broader application, albeit at somewhat lower efficiencies (Nemet, Reference Nemet2019).
Actors and Policies
The solar-PV niche was supported by a strong network of new entrants, including environmental NGOs, roof installation companies, the solar industry, and even British Petroleum, which in 1997 pledged to increase investments in solar-PV from $100 million to $1 billion a year, as part of an energy diversification strategy (Pinkse and Van den Buuse, Reference Pinkse and Van den Buuse2012). When the government’s 2008 Energy Bill privileged nuclear energy over renewables, Friends of the Earth, Greenpeace, the construction industry, roofing contractors, and solar manufacturers mounted a visible public campaign in favour of a FiT. In this context, the government struck a political deal with pro-renewables backbenchers to support the government bill for nuclear power in return for the introduction of a FiT for small-scale renewables (Smith et al., Reference Smith2014).
The 2010 FiT triggered unanticipated interest, resulting in rapid diffusion of domestic solar installations until 2016 (Figure 4.24), when more than 850,000 households had rooftop solar-PV. Increasing adoption and decreasing prices gave rise to wider cultural visions about the coming solar energy revolution and how it could transform energy systems towards decentralised production and active ‘prosumers’ (Barnham, Reference Barnham2014).
The mid-size segment (of commercial and non-domestic properties and community energy) grew only modestly after 2010. The strongest growth occurred in the large-scale and utility-scale segment, which received attractive financial support from the amended RO policy. By May 2020, this segment accounted for 70% of installed capacity (Figure 4.24). Farmers pioneered large-scale applications in the early 2010s, installing panels on barn roofs or in fields grazed by sheep. Their success opened the way for even larger utility-scale solar farms, which were developed by commercial project developers interacting with large landowners, the financial community, energy companies, and PV system suppliers. The Shotwick Solar Park (72 MW) is presently the largest UK solar farm, but even larger ones are in the planning pipeline.
Policymakers and advisory bodies did not anticipate this boom because solar was the most expensive RET. In 2011, the Committee for Climate Change only foresaw a ‘limited role for UK deployment of solar-PV’ (CCC, 2011: 22), and the UK Renewable Energy Roadmap (DECC, 2011a) did not include a separate section on solar-PV. This changed in the next two years, when part 1 and part 2 of the UK Solar PV Strategy (DECC, 2014c, 2013a) saw solar-PV as an important part of the future energy mix. While these documents envisaged 10 GW solar capacity as a likely medium-range scenario for 2020, the Ministerial foreword called more bullishly for 20 GW within a decade, as part of a wider shift towards decentralised energy.
Despite these positive visions, less favourable developments in the broader political context (discussed earlier) led to the 2015 energy reset, which slashed feed-in tariffs and closed the RO for large-scale solar-PV. In 2016, the RO for small-scale solar-PV was also closed. These sudden policy adjustments sharply reduced the rate of new installations, leading to stagnated diffusion in all segments (Figure 4.24). In 2019, the government ended FiTs for small-scale renewables entirely. In March 2020, however, the government’s new net-zero ambitions led it to reinstate support for large-scale solar-PV, allowing its inclusion in the 2021 CfD auction round. This inclusion was confirmed by the 2020 Energy White Paper.
4.5.5 Energy-Efficient Lighting
Techno-Economic Developments
The transition from incandescent lightbulbs (ILB) to compact fluorescent lamps (CFL), light emitting diodes (LEDs), and halogen (Figure 4.25) substantially reduced electricity use for lighting, as discussed in Section 4.4, despite increases in the total numbers of lamps.
Number of different kinds of bulbs (in thousands) for non-directional lighting, owned by UK households, 2006–2019
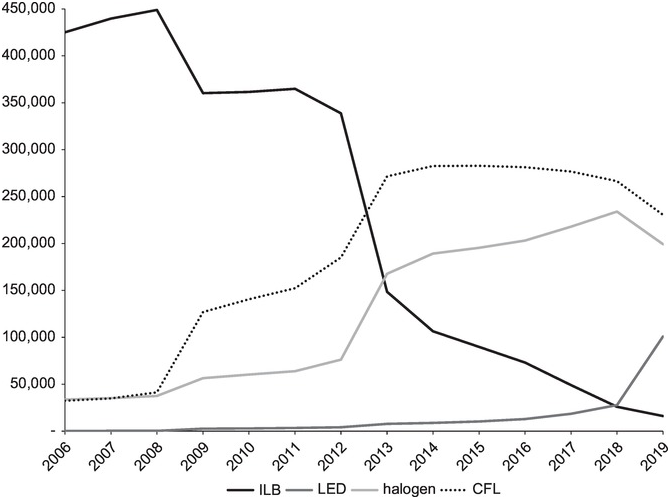
Decisions to phase-out ILBs (2007 in the UK; 2009 European Commission) greatly accelerated this transition, but techno-economic developments were also important.
ILBs and halogen have long been the cheapest per bulb, but their lighting efficacy (in lumen per Watt) improved little over time (Aman et al., Reference Aman, Jasmon, Mokhlis and Bakar2013).Footnote 13
Fluorescent lighting uses three to five times less energy per lumen than ILBs (Aman et al., Reference Aman, Jasmon, Mokhlis and Bakar2013), but its linear (strip-lighting) form was long confined to large-space lighting niches (e.g., schools, offices) where bright light was required. General Electric (GE) developed a more compact, spiral-shaped fluorescent lamp in the 1970s (Franceschini and Alkemade, Reference Franceschini and Alkemade2016), but the purchase price was initially much higher (up to 20 times) than ILBs (Menanteau and Lefebvre, Reference Menanteau and Lefebvre2000), which hindered CFL diffusion into households. Their lifetime costs were lower, however, because they lasted considerably longer and used less energy.
LEDs, which are based on solid state electronics, use seven to 10 times less energy than ILBs (Aman et al., Reference Aman, Jasmon, Mokhlis and Bakar2013) and efficiencies are still improving (Sanderson and Simons, Reference Sanderson and Simons2014). LEDs long remained much more expensive per bulb, which limited domestic use to small market niches such as directional, spot lighting, and decorative (e.g., Christmas trees) purposes. Broader use was stimulated by rapidly falling LED prices, which decreased 96% between 2008 and 2015 (Figure 4.26) due to scale economies, standardisation and commoditisation of LED chip technology, and improved manufacturing techniques (Sanderson and Simons, Reference Sanderson and Simons2014). LEDs also last long, which by 2011 had already brought their whole life costs ($/kilolumen-hour) close to CFL and halogen (Table 4.2), which stimulated wider uptake. LEDs are also versatile and can generate different types of lighting, which opens up the possibility for consumers to control colour and light intensity by connecting LEDs to in-house ICT systems, leading to ‘smart lighting systems’.
Decreasing prices of light emitting diodes, in USD/kilolumen
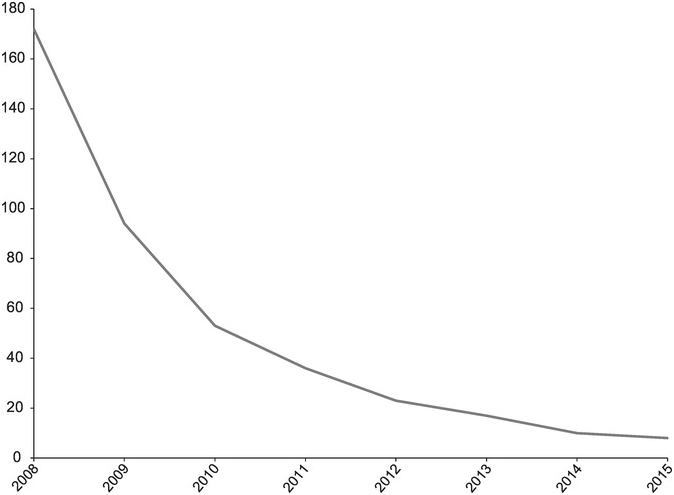
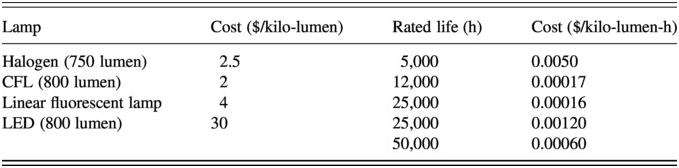
Actors and Policies
Incumbent lighting firms (e.g., Westinghouse, General Electric, Philips) developed and marketed CFLs in the 1980s and 1990s, but cheaper Chinese firms overtook them in the 2000s (Khan and Abas, Reference Khan and Abas2011), which lowered CFL prices. LEDs were initially developed by electronics firms (e.g., Bell Labs Hewlett-Packard, National Semiconductor, Fairchild, Samsung), but established lighting companies (e.g., Philips, Osram, GE) also acquired semi-conductor capabilities in the 1990s to position themselves for the anticipated LED market (Franceschini and Alkemade, Reference Franceschini and Alkemade2016). UK firms play only a minor role in lighting innovation.
As attention on energy efficiency increased in the 1990s, policymakers attempted to stimulate energy-saving lamp diffusion through voluntary measures. The 1992 European Directive on Energy Labelling, for instance, required lighting companies to provide consumers with information about the energy efficiency performance of their products. UK policymakers also introduced subsidised give-away programmes and rebates to encourage retailers and utility firms to promote energy-efficient lighting, especially CFLs (Howarth and Rosenow, Reference Howarth and Rosenow2014; Martinot and Borg, Reference Martinot and Borg1998).Footnote 14 These policies had limited effects, however, because consumers perceived CFLs as giving ‘cold’ light; being unattractively shaped; taking too long to achieve full brightness; and being unsuitable for many fittings (Wall and Crosbie, Reference Wall and Crosbie2009).
These problems galvanised further CFL technology development, aimed at reducing flickering, re-engineering shapes, and improving durability. Philips led these CFL developments, capturing 50% of the European market by 2000 (Menanteau and Lefebvre, Reference Menanteau and Lefebvre2000). LED-innovation in the 2000s was also driven by western multinationals, with Philips again acting as leading firm.
Increasing political attention for climate change and criticisms from environmental NGOs (e.g., WWF, Greenpeace) strengthened debates about the inefficiency of ILBs, which were increasingly framed in terms of energy waste (Franceschini and Alkemade, Reference Franceschini and Alkemade2016). The 2005 European Eco-design Directive increased regulatory pressure by stipulating minimum energy efficiency standards for light bulbs and other energy-using products. UK policymakers also tightened Energy Efficiency Commitments (from 2002 to 2008) on utilities, mandating them to promote CFLs (Rosenow, Reference Rosenow2012).
Incumbent lighting firms began to abandon ILBs, which was a low-profit margin market with tough international competition. In 2006, Philips announced support for a possible ILB ban, with the European Lamp Companies Federation (an industry association including Philips, Osram, and GE) following suit in 2007. The UK government announced in 2007 that it would phase out ILBs by 2011, while other European member states expressed support for the idea (Howarth and Rosenow, Reference Howarth and Rosenow2014). In 2009, combined pressures from the lighting industry, NGOs, and member states led the European Commission to introduce a ban for ILBs of more than 80W, progressing to lower wattage in successive years.
While the ILB ban initially mostly boosted halogen and CFLs, it also stimulated LED-uptake (Figure 4.25). Further LED diffusion was driven both by declining costs and by new functionalities that allowed consumers to control colour and light intensity to create ambience (Monreal et al., Reference Monreal, McMeekin and Southerton2016). Because of these rapid developments, LEDs came to be seen as the future of domestic lighting (Franceschini et al., Reference Franceschini, Borup and Rosales-Carreón2018). The 2016 and 2018 European bans on directional and non-directional halogen bulbs explicitly intended to further accelerate the LED-transition and reduce energy consumption for residential lighting.
4.5.6 Smart Meters
Techno-Economic Developments
First discussed in the 1970s, discussions about smart meters gained momentum in the 1990s, when ICT-devices became more sophisticated and available. Smart meters can measure exact gas and electricity usage by customers and send the information to the energy supplier and the customer through in-home displays (IHDs) or other ICT-devices. A 2006 UK study suggested that such information feedback could lead to behaviour change and energy demand reductions of between 5 and 15% (Darby, Reference Darby2006). Based on a positive cost-benefit analysis (BERR, 2007), the UK government decided in 2008 to roll out 53 million smart gas and electricity meters for all households and small businesses.
Depending on their technical configuration, smart meters vary in costs, from £50–60 for simple clip-on customer display units to £240 for more complex, multi-functional meters (BERR, 2007). After years of negotiations, the UK chose for a smart meter configuration towards the more complex end of the scale, costing around £215 (DECC, 2014d). Rising cost estimates were accompanied by increasingly positive estimates of benefits (Table 4.3), which in 2014 were estimated at £17,141 billion: 48% in the form of supplier cost savings (by removing the need for meter reading visits, simplifying consumer switching, improving theft detection and debt management), 33% consumer energy savings, 8% UK-wide benefits (carbon), 5% peak load shifting, and 6% network benefits (DECC, 2014d: 15).
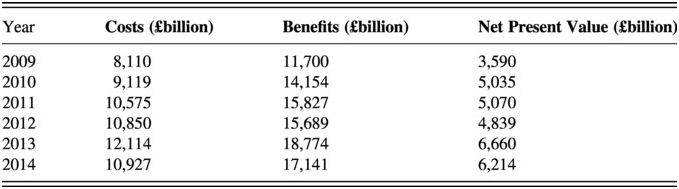
Despite the positive ex-ante estimates, smart meter diffusion has been disappointing (Figure 4.27), with only 15.5 million smart meters being installed by 2020, which is 29% of the original target.
Domestic smart meters operated by large suppliers, 2012–2020
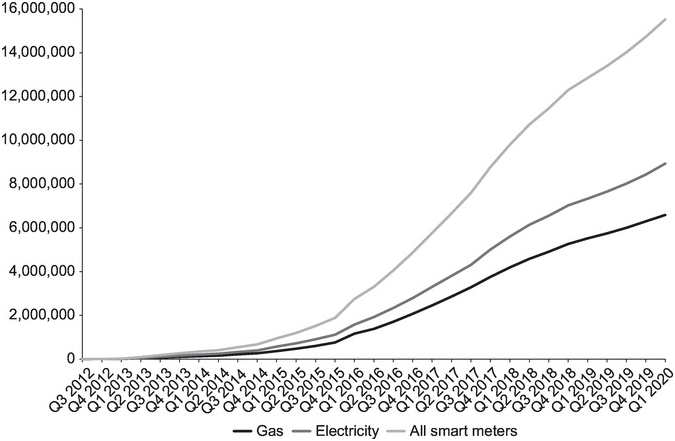
Actors and Policies
Wanting to act on climate change, the Labour government’s interest in smart meters was triggered by the aforementioned 2006 study. From 2007 to 2010, the government sponsored a large-scale smart meter trial in the Energy Demand Research Project. But instead of waiting for the trial outcomes, it decided in 2008 for a 100% roll-out of smart meters by 2020. The government also decided to make energy suppliers responsible for the roll-out and ruled that they would bear the up-front costs, which they could subsequently recover through consumer energy bills (Sovacool et al., Reference Sovacool2017). This deviates from most other countries, which allocated this responsibility to Distribution Network Operators, who could install meters on a street-by-street basis in their regional monopolies (Geels et al., Reference Geels2021). The government’s 2008 decision also stipulated that smart meters should include IHD-units to provide consumers with information about their energy use, which was intended to trigger behaviour change. Observing Dutch social acceptance problems with a mandatory roll-out model, UK policymakers announced in 2012 that their smart meter roll-out would be voluntary, based on an ‘opt-in’ model, in which consumers had to ask energy companies for a smart meter (Geels et al., Reference Geels2021).
Early implementations showed that smart meters did not work well in high-rise flats, basements, and rural areas (Sovacool et al., Reference Sovacool2017). Evaluations also suggested that energy savings from information feedback might be more limited than was initially assumed, leading to reductions in estimated energy savings from 5–15% to 1–3% (Shipworth et al., Reference Shipworth, Fell and Elam2019). A further problem was that first-generation (‘SMETS-1’) meters were incompatible with some suppliers, which complicated consumer switching.
These technical problems were widely covered in the media. Public debates also expressed concern about rising costs and the ‘business case’ for consumers. Additionally, libertarian and conservative media warned that the government could use smart meters to increase its control and surveillance over citizens, sowing doubts among the public about privacy and security consequences (Sovacool et al., Reference Sovacool2019). These negative debates generated substantial scepticism around smart meters, which hampered the roll-out (Hielscher and Sovacool, Reference Hielscher and Sovacool2018).
Energy companies also questioned the need for IHDs, arguing instead for cheaper apps that would allow phones, tablets, or personal computers to capture meter readings with no additional hardware cost (IoD, 2015). But government officials were committed to a standardised roll-out of IHDs and reluctant to consider changes. The logistics of the supplier-led roll-out and the fragmented nature of energy markets also created extra costs and delays because installation had to be done through individual site visits (Sovacool et al., Reference Sovacool2017). Limited public trust in energy suppliers further undermined the roll-out, with growing concerns since 2016 about the health impacts of smart meters (Hielscher and Sovacool, Reference Hielscher and Sovacool2018).
Large-scale roll-out commenced in 2016, but installation failures remained commonplace, with more than 10% of homes requiring multiple visits to complete the installation (Utility Week, Reference Upreti and Van der Horst2017). After two relatively successful years, quarterly installation rates decreased markedly after 2017 (Figure 4.28). The problems with technical functionalities and SMETS1 standards, combined with years of negative debates, tarnished the public reputation of smart meters. The (un)reliability of energy companies and home installation problems also became issues of public debate (Connor et al., Reference Connor, Axon, Xenias and Balta-Ozkan2018). Although the first SMETS2 meters began to be installed in 2017, public trust remained problematic (Meadows, 2018), resulting in lukewarm consumer interest.
Domestic smart meters quarterly installation by large suppliers
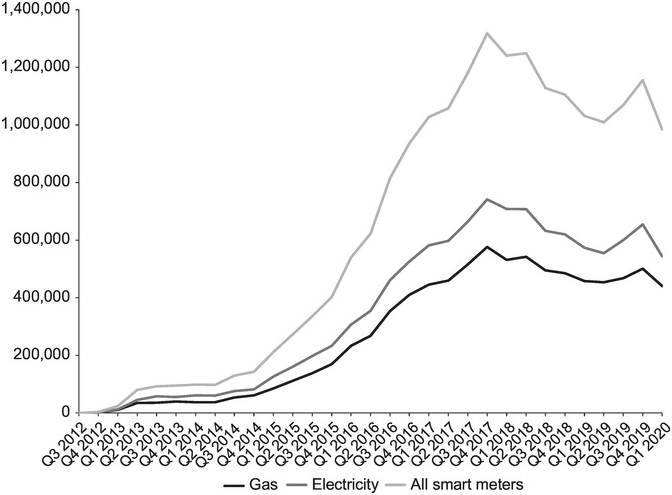
Acknowledging the delays and problems, the government announced in 2019 that it would postpone the roll-out deadline from 2020 to 2024, which would increase costs but allow for a greater focus on consumers (BBC, 2019). Although demand-reduction expectations have been downscaled, proponents made new promises about the future role of smart meters, smart grids, peak shifting, and demand-side response (DRS), in which information feedback from smart meters and new kinds of tariffs may modulate demand to accommodate fluctuations in electricity supply (Hielscher and Sovacool, Reference Hielscher and Sovacool2018).
4.5.7 Smart Grids
‘Smart grids’ is a catch-all concept that can refer more narrowly to the inclusion of information and communication technologies (e.g., sensors, automatic switches, power electronics, digital controls) into the grid to enhance the visibility, control, and management of electricity flows or, more broadly, to wider functionalities that the ICT-enriched grid may enable and support, including demand-side response, storage, and flexible capacity management. We discuss the former in this section and the latter in Section 4.5.8.
Techno-Economic Developments
Interest in smart grids has increased since the 2000s, first, because of the increasing proliferation of information and communication technologies (ICT) and the shift to an information age, and, second, because the use of ICTs could potentially help address some of the increasing pressures on electricity grids, discussed in Section 4.3.1, particularly load management problems (due to increasing amounts of intermittent renewable power generation) and bi-directional electricity flows in distribution networks (due to increasing amounts of distributed power generation). Both problems require increased monitoring, control, and management of electricity flows (especially in distribution networks), which is something that ICT-devices could help with.
Smart grids are still a protected technological niche, constituted by a collection of projects. Both the number of UK projects and the proportion of real-world demonstration projects have increased since the early 2000s (Figure 4.29). Between 2002 and 2015, there were 95 R&D projects and 103 demonstration projects, covering a wide variety of functions and technologies such as sensors, automatic switches, power electronics devices, network management, and voltage and thermal constraints (Jenkins et al., Reference Jenkins, Long and Wu2015). Illustrative examples from the 2010s include Orkney Islands active network management project (exploring integration of high loads of wind, wave, and tidal energy into local grids), E.On MK2000 (exploring relations between smart homes and smart grids), and the Smart Hooky project (which connected monitoring nodes in 40 households in an Oxfordshire village to a smart hub at the distribution sub-station).
Annual number of new R&D and demonstration projects with smart grid technologies in the UK
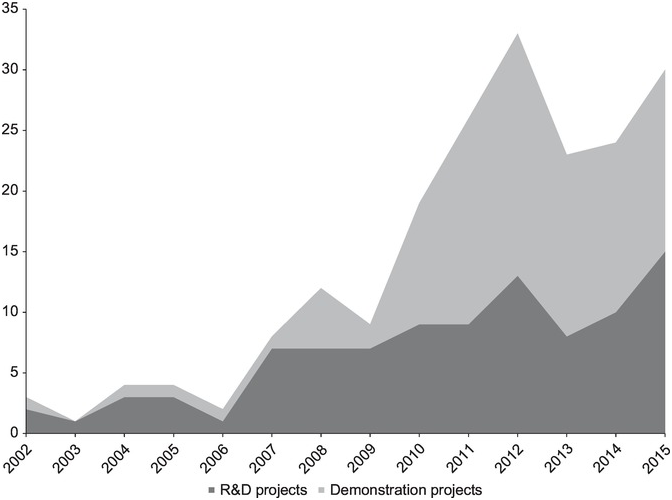
While these subsidised projects enabled learning processes and the build-up of new technical capabilities, they have not yet been followed by widespread diffusion and deployment of smart grid technologies (Lockwood, Reference Lockwood2016).
Actors and Policies
DNOs were initially reluctant to engage with radical innovations such as smart grids, because of limited technical capabilities, limited future planning skills, and business models focused on efficiency and cost reduction (discussed in Section 4.3.2). To stimulate network innovation, Ofgem introduced the Innovation Funding Incentive (2005–2010), which increased DNO engagement in smart grid R&D projects. To also stimulate larger demonstration projects, Ofgem introduced the Low Carbon Network Fund (2010–2015), which allowed DNOs to bid for up to £500 million over five years. This instrument aimed to engage DNOs in real-world learning-by-doing processes and also pushed them to be ‘more outward-looking by requiring bids for LCNF funding to include partnerships with suppliers, ICT firms, local communities and universities’ (Lockwood, Reference Lockwood2016: 120). The LCNF clearly accelerated the number of demonstration projects (Figure 4.29), which involve different configurations of actors. The Orkney Island project, for instance, involved Scottish and Southern Energy Power Distribution, University of Strathclyde, Smarter Grid Solutions, local renewable generators, and community energy groups. The E.On MK2000 project involved E.On, households, and Greenwave. And the Smart Hooky project involved Western Power Distribution, Hook Norton Local Authority, local community groups, Ranesas Electronics, and Tech Research (Owaineh et al., Reference Owaineh, Leach, Guest and Wehrmeyer2015).
Incumbent energy companies have been prominent in articulating future visions for UK smart grids. The Electricity Networks Strategy Group,Footnote 15 for instance, produced a high-level plan and a cost-benefit analysis for smart grids (ENSG, 2009), followed by a ‘route map’ (ENSG, 2010) and scenarios (ENSG, 2012). In 2011, DECC and Ofgem established the Smart Grid Forum (SGF) to address technical and economic drivers and barriers. Although the Forum accommodated multiple kinds of stakeholders, ‘membership is oriented towards the electricity sector, and includes lower representation from the ICT sector’ (Hiteva and Watson, Reference Hiteva and Watson2019: 147). The SGF’s 2014 Smart Grid Vision and Routemap is broad in terms of technologies and functionalities (including demand management and storage) and does ‘not attempt to outline a precise path’ (SGF, 2014: 7). It does, however, focus mostly on distribution networks, which smart technologies aim to make more ‘flexible and efficient’, leading to lower costs, empowerment of consumers, economic growth, and jobs (p. 6). A key aspect of this vision concerned significant organisational change for DNOs to become Distribution System Operators (DSOs), with much wider responsibilities as active managers of a smart distribution system.
The focus in these smart grid visions on efficient, low-cost improvements of existing grids is unsurprising given the dominance of incumbent energy companies. It does, however, mean that visions of local semi-autonomous micro-grids are hardly discussed in the UK (Lockwood, Reference Lockwood2016). This contrasts with other countries (e.g., United States, Germany, Denmark, Netherlands), where visions of micro-grids in relation to decentralised energy systems and socio-cultural changes (Meadowcroft et al., Reference Meadowcroft, Stephens, Wilson and Rowlands2018; Stephens et al., Reference Stehlin, Hodson and McMeekin2013; Van Mierlo, Reference Van Driel and Schot2019) are more common.
It is also striking that policymakers have, so far, been relatively absent in the articulation of visions or policy plans for smart grid development. Some analysts therefore diagnosed that: ‘Regulatory incentives like LCNF encourage piecemeal solutions without a clear UK strategy’ (Connor et al., Reference Connor, Axon, Xenias and Balta-Ozkan2018: 6).
In sum, there are increasing numbers of smart grid projects, which enable learning processes, network building, and development of new technical capabilities. But future visions are very broad and oriented towards large-scale applications suiting incumbent interests. Given DNO resistance to major change, it remains unclear if current impulses and incentives are sufficient to overcome the DNO lock-in mechanisms and lead to widespread deployment of smart grid technologies in distribution networks (Connor et al., Reference Connor, Axon, Xenias and Balta-Ozkan2018; Hiteva and Watson, Reference Hiteva and Watson2019; Lockwood, Reference Lockwood2016).
4.5.8 Flexibility-Enhancing Options: Battery Storage and Demand-Side Response
To alleviate increasing load management problems, grid managers have become more interested in flexibility-enhancing options that help match electricity supply and demand. Conventional power generation (e.g., gas turbines) or energy storage technologies can be used to provide back-up capacity, which can be activated when demand peaks. Demand-side response (DSR) provides flexibility by reducing electricity demand at certain periods to either ‘shift the peak’ or follow fluctuating supply, which would entail a reversal of the current operational principle (in which supply follows demand). While some of these flexibility-enhancing options have been used for some time (e.g., energy storage through pumped hydro facilities or paying large firms to disconnect from grid supply during peak demand), it is the emergence of newer options (e.g., battery storage and household DSR, mediated by smart meters) that has generated new enthusiasm and will be discussed next.
Techno-Economic Developments
Battery Storage: While a range of energy storage technologies (e.g., flywheels, compressed air, liquid air, hydrogen) is under development (Schmidt et al., Reference Schmidt, Matsuo and Michaelowa2017), battery storage is already in the deployment stage. The use of home batteries (in the 4–20 kWh range) in combination with rooftop solar-PV has remained relatively small in the UK, compared to countries such as Germany, Spain, and Italy (Gardiner et al., Reference Gardiner, Schmidt, Heptonstall, Gross and Staffel2020). Larger-scale battery storage has experienced more growth, especially in relation to providing grid-oriented flexibility services. Since 2013, the number of UK battery storage projects larger than 150 kW and annual installed capacity has increased substantially (Figures 4.30 and 4.31). Despite a drop in 2019 (which will be discussed next), future growth prospects are high, with 13 battery storage projects (with 343 MW capacity) under construction and 192 projects (with 13,152 GW capacity) being granted planning permission (information from the Renewable Energy Planning Database at Statistics at BEIS). While battery storage can be operated as stand-alone facilities, they can also be co-located with fossil fuel plants or large-scale renewable energy (RE) generators (which means that excess capacity can be stored and sold to the grid at a later stage). Most residential and utility storage projects use lithium-ion batteries, which have reduced substantially in price in recent years, owing to a learning rate of about 12% (Schmidt et al., Reference Schmidt, Matsuo and Michaelowa2017).Footnote 16 Residential battery storage is relatively more expensive than utility storage. Gardiner et al. (Reference Gardiner, Schmidt, Heptonstall, Gross and Staffel2020) estimate that a 4kWh home-storage system (including battery plus inverter and other electronics) cost around £3,497 in 2017, which has restricted its use to a small market niche.
Number and type of UK battery storage projects larger than 150 kW, 2013–2019
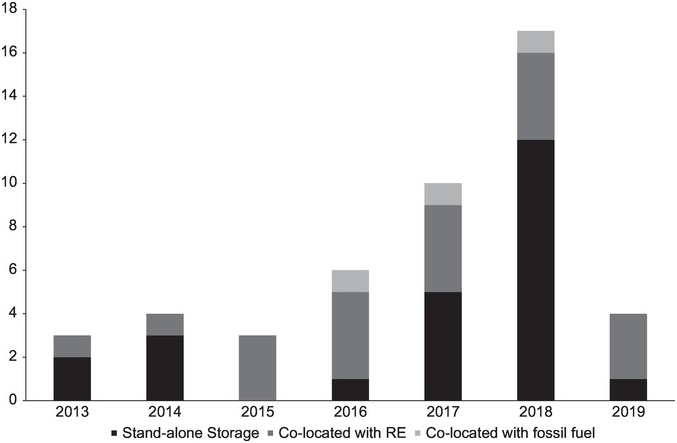
Annual installed capacity (in MW) of UK battery storage projects larger than 150 kW, 2013–2019
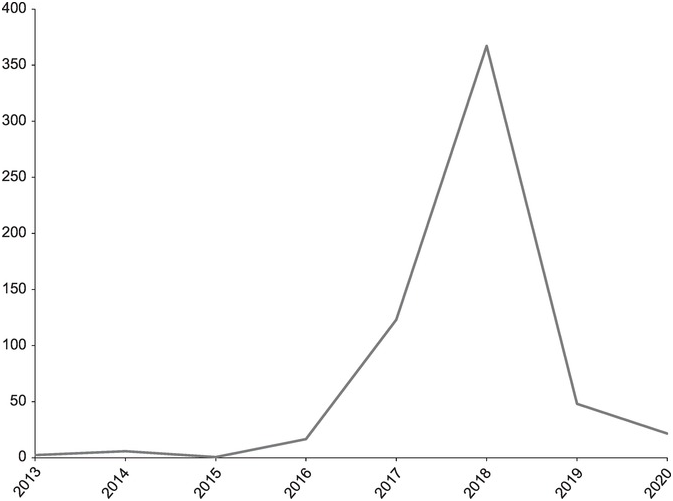
Demand-Side Response: DSR already exists for UK major commercial energy users, who have bespoke contractual arrangements about the payments and conditions under which they will reduce electricity demand in response to a signal or incentive from the grid operator (Grünewald and Torriti, Reference Grünewald and Torriti2013). In the early 2010s, UK smart-meter roll-out plans stimulated visions about applying DSR to household demand (Parrish et al., Reference Parrish, Gross and Heptonstall2019). Various combinations of smart meters, new tariffs, and smart appliances resulted in different residential DSR-visions (Darby and McKenna, Reference Darby and McKenna2012), which to varying degrees propose economic principles and technological controls to bring about desired behaviour change:
Static peak shifting: Smart meters enable the introduction of time-of-use tariffs that incentivise consumers to change the timing of certain activities (e.g., doing the laundry at night). Timers could be added to automatically shift loads away from peak times.
Dynamic load shifting: Smart meters enable the introduction of real-time (‘dynamic’) tariffs that would incentivise households to change electricity demand on an hourly basis in response to price fluctuations driven by supply and demand.
Continuous balancing (or ‘direct load control’): Smart meters, smart appliances, and new tariff structures allow grid managers to remotely control appliances (e.g., freezers, refrigerators, washing machines) to adjust electricity demand.
While there have been some trials, implementation of household DSR has, so far, been limited (Langendahl et al., Reference Langendahl, Roy, Potter and Cook2019; Parrish et al., Reference Parrish, Gross and Heptonstall2019).
Actors and Policies
Battery Storage: Home batteries are provided by new companies such as Tesla, Powervault, Moixa, and Sonnen, but, given high prices and lack of dedicated policy, the residential battery storage market has remained small. Without policy intervention, residential batteries are not currently financially viable in the UK (Gardiner et al., Reference Gardiner, Schmidt, Heptonstall, Gross and Staffel2020: 1).
The number of commercial storage companies, who purchase batteries from international suppliers and provide flexible energy services to grid companies, has increased quickly in recent years. New entrants such as KiWi Power, Renewable Energy Systems, and UK Battery Storage were followed by incumbent utilities (such as EDF, Vattenfall, and E.ON) and big firms from other sectors (e.g., Jaguar Land Rover, Statoil). This rapid growth was stimulated by Capacity Market (CM) contracts and Enhanced Frequency Response (EFR) contracts from National Grid.Footnote 17 The drop in 2019 was caused by CM rule changes for the 2017/18 auctions (which de-rated batteries depending on their duration, halving CM revenues for most batteries) and National Grid halting EFR in 2018. Since 2019, however, battery storage was able to access the National Grid’s broadened Balancing MechanismFootnote 18 and other forms of trading, which opened up new revenue streams and attracted more companies and projects. With the aim of further boosting the large-scale storage market (particularly in relation to utility-scale wind and solar farms), the government in July 2020 relaxed project size limitations from 50 MW to 250 MW in England and 350 MW in Wales.Footnote 19 Decentralised energy storage and visions of energy independence (in which households mostly consume self-generated power) or virtual power plants (in which local communities combine and aggregate self-generated and stored power) do not receive much policy attention in the UK (Ambrosio-Albalá et al., Reference Ambrosio-Albalá, Upham and Bale2019).
Demand-Side Response: Increasing amounts of intermittent renewables and anticipated smart meter rollouts led economists, engineers, and policymakers to consider possibilities of residential DSR. Because demand-side flexibility could support load management and reduce the need for network upgrades and peaking plants, policymakers saw DSR, smart meters, and new tariffs as interesting possibilities: ‘Smart meters make time-varying and other sophisticated type of tariffs possible by recording the time when electricity is used, and by allowing two-way communications. Such tariffs can incentivise demand-side response (DSR) or load-shifting, which can potentially bring significant benefits to the electricity system’ (DECC, 2014d: 58). DSR was therefore allowed to participate in the Capacity Market (CM) auctions, which pay power station owners or providers of DSR or storage for the availability of electricity generation or reduced demand in agreed periods (often related to peak demand). Between 2014 and 2020, however, DSR won only 1.5% of contracted resources in these auctions (Lockwood et al., Reference Lockwood, Kuzemko, Mitchell and Hoggett2020).
There are various reasons that DSR has so far remained a ‘niche activity’ (Langendahl et al., Reference Langendahl, Roy, Potter and Cook2019: 3). First, incumbent actors remained hesitant about DSR, which ‘represents something very different from more established forms of the electricity industry’s asset management approaches’ (Langendahl et al., Reference Langendahl, Roy, Potter and Cook2019: 7), which are based on technological solutions and the building of new capacity. Contractual DSR relationships and incentives through new tariffs also created uncertainties about the reliability of delivery of demand reduction. Second, lobbying from incumbent power generators (who had invested substantially in flexible gas-powered plants) shaped CM auction rules so that these marginalised DSR and favoured conventional back-up capacity (Lockwood et al., Reference Lockwood, Kuzemko, Mitchell and Hoggett2020).Footnote 20 ‘The protection of the existing system thus appears to have been a higher priority than the development of a new, more flexible and demand-side focused system’ (Lockwood, Reference Little2017: 17). Third, households may be less interested in DSR than economic modelling studies assume. Based on a systematic review of international evidence on trials, surveys, and programmes of residential DSR, Parrish et al. (Reference Parrish, Gross and Heptonstall2019: 107) conclude that ‘the high levels of demand response modelled in some future energy system scenarios may be more than a little optimistic’. Specifically, households tend to have limited knowledge of DSR, may not accept high degrees of external appliance control, and may not respond predictably to price signals because most electricity consumption relates to routinised practices (Verbong et al., Reference Van Mierlo2013).
Although DSR holds potential, we suggest that its momentum has weakened, especially compared to battery storage, which is expected to provide large amounts of flexible capacity in the coming years.
4.6 Low-Carbon Transition through Whole System Reconfiguration
Pulling together information from the sub-system and niche-innovation analyses, this section first assesses low-carbon whole system reconfiguration through the three lenses (techno-economic, actors, institutions) and then addresses speed, scope, and depth of change.
4.6.1 Low-Carbon Innovations Driving GHG Emission Reductions
Based on the investigations in this chapter, we conclude that the substantial reduction in greenhouse gas emissions between 1990 and 2019 resulted from four main changes:
the diffusion of renewable electricity technologies (e.g., onshore wind, offshore wind, bio-power, and solar-PV), which displaced coal in the power generation sub-system; this change represents niche-innovations replacing existing system technologies.
the diffusion of CFLs and LEDs, which replaced incandescent light bulbs in the consumption sub-system; this change also represents niche-innovations replacing existing system technologies.
the switch from coal to gas in the power generation sub-system, which represents a substitution between existing system technologies;
efficiency innovation in appliances, which helped to reduce electricity demand, despite appliance proliferation in households; this change represents existing incremental improvements in existing system components.
4.6.2 Techno-Economic Reconfiguration
These low-carbon innovations represent either ‘modular incrementalism’ or ‘modular substitutions’, which improved or replaced parts of the existing sub-systems without challenging traditional boundaries between them. Summary Table 4.4 positions these and the other innovations we have discussed in the techno-economic mapping framework that we developed in Section 2.2.1. RET diffusion was accompanied and enabled by incremental innovations in transmission grids (extensions, strengthening, new offshore grids, new interconnectors), which represent ‘architectural stretching’ to incorporate remote RETs such as onshore and offshore wind farms.
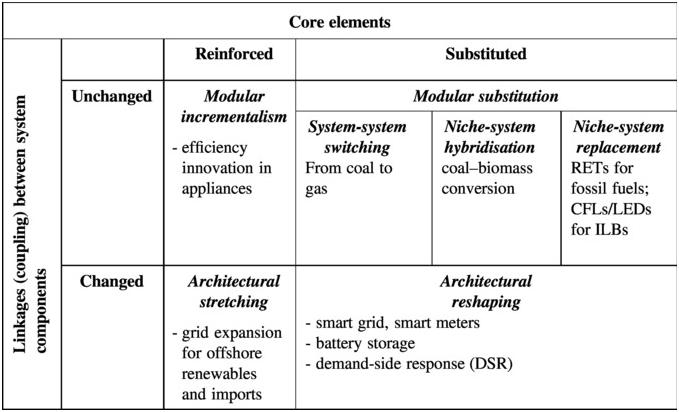
For a few years, however, increasing amounts of intermittent RETs in the generation sub-system have been having knock-on effects in the consumption and infrastructure sub-systems, because they create problems (such as intermittency and load balancing) that have increased interest in radical niche-innovations (such as smart meters, battery storage, smart grids, demand-side response), which improve grid management by enhancing flexibility and bi-directional electricity flows. These knock-on effects and niche-innovations create new linkages between the three sub-systems. The sub-system boundaries are thus becoming more porous, suggesting the possible emergence of a new phase of whole system reconfiguration (McMeekin et al., Reference McMeekin, Geels and Hodson2019), including changes in the system architecture, for example, intelligent and flexible load management, peak shifting, decentralised power generation (including ‘prosumption’, which is the use of self-generated electricity by consumers), and different operational principles (e.g., demand-follows-supply). This ‘architectural reshaping’ is still in the making and uncertain because most associated niche-innovations are still in early developmental stages and because of ongoing institutional struggles (which are further discussed next).
Modular changes within generation and demand sub-systems have, so far, accounted for most of the low-carbon progress. This modular reconfiguration pattern was possible because electricity generation and demand sub-systems are separated from each other by the grid. These loosely coupled sub-systems can thus have independent operational and innovation patterns that do not interfere with each other. It is only in recent years that modular changes in the electricity generation system have been having knock-on effects on the grid and demand sub-systems, which create the prospect of a new phase of architectural reshaping, as indicated earlier.
4.6.3 Actor Reconfiguration
Focusing on actors and social networks, we conclude that the unfolding low-carbon electricity system transition was enabled by substantial changes in goals, agendas, interests, strategies, and capabilities. This means that constitutive dimensions of some actors changed during the transitions, as they learned, struggled, debated, and interpreted changing contexts, barriers, and opportunities. This does not mean, however, that all actor dimensions changed in low-carbon directions. Some routines, conventions, capabilities, or interests remained relatively ‘locked-in’ and unchanged, which hindered the speed and depth of change. Some actors also became worried about new concerns that hindered or detracted from low-carbon transitions.
Regarding the three sub-systems, Tables 4.5 to 4.7 provide interpretive assessments of the main actor changes, lock-ins, and new concerns. For each actor category, we have added evaluative qualifiers in capital letters to indicate the relative importance of actor changes or lock-ins for the unfolding low-carbon transition.
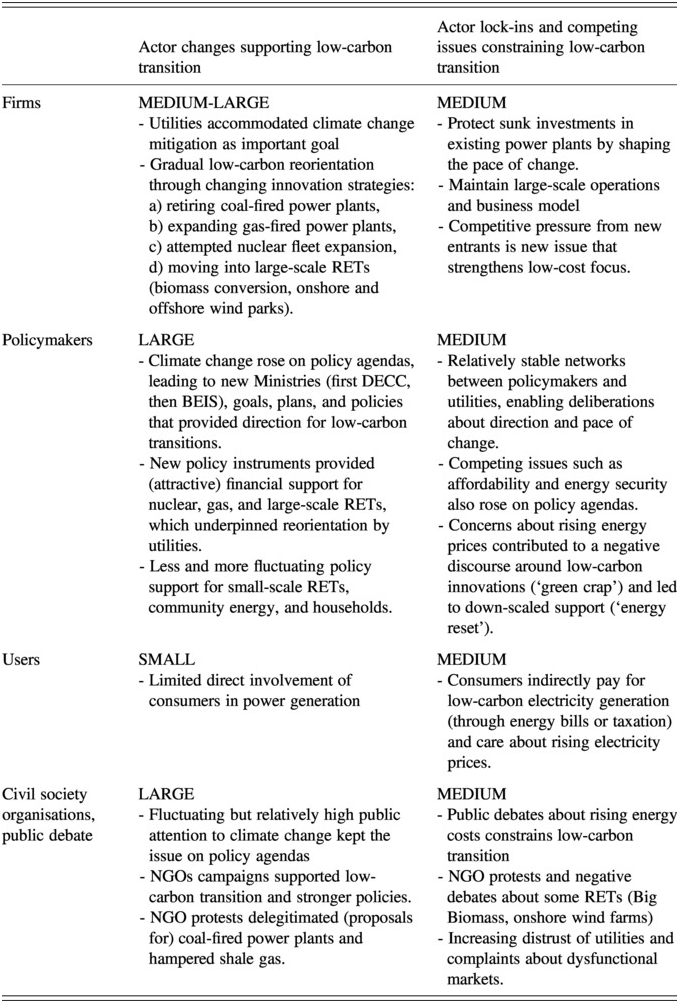
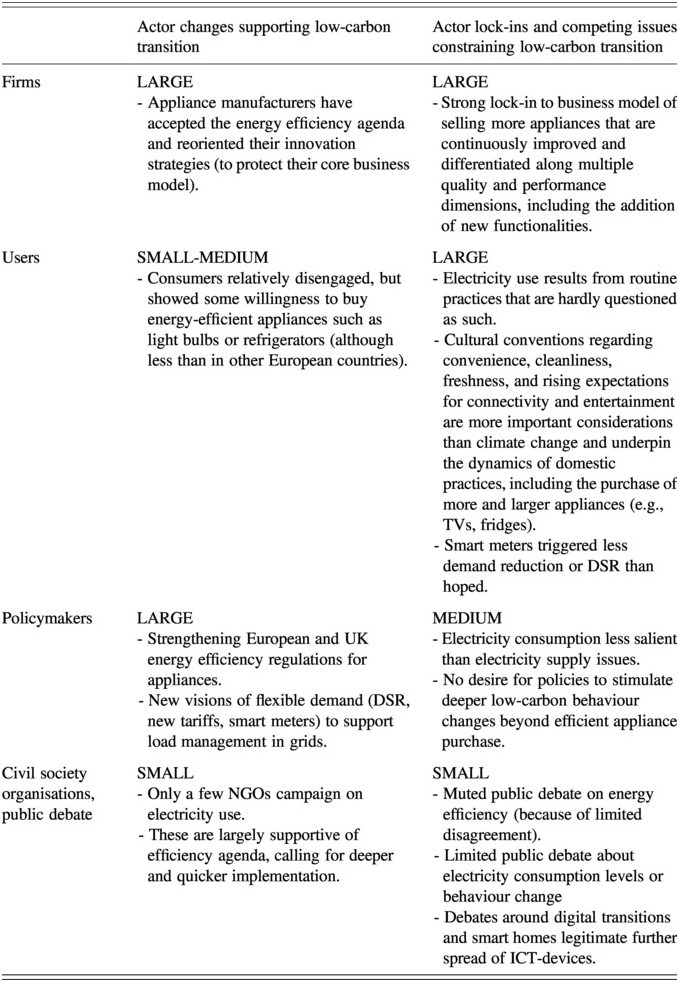
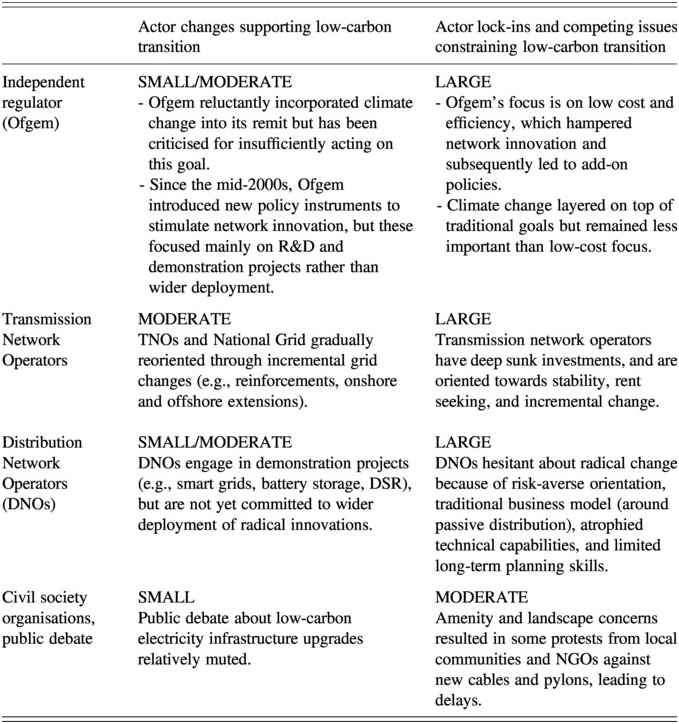
In the electricity generation sub-system, the main actor changes in support of low-carbon transitions were: a) gradual reorientation of utilities through adjustments in investment strategies, and technical and operational capabilities, b) relatively interventionist government policies that shaped markets and supported utilities’ reorientation through attractive financial incentives for large-scale low-carbon technologies, c) relatively high, but fluctuating, public attention on climate change, negative discourses about coal, and positive discourses about renewables.
The main lock-ins and new issues that hampered low-carbon transitions were: a) sunk investments in existing coal- and gas-fired power plants, and large-scale business models, which utilities aimed to protect by shaping the pace of change, b) stable and closed networks between policymakers and utilities (including official platforms and informal consultation channels), which enabled frequent discussions and coordination, c) increasing concerns (reinforced by conservative politicians and utilities) about rising electricity consumer bills.
In the electricity consumption sub-system, the main actor changes in support of low-carbon transitions were: a) tightening European and UK energy efficiency regulations, including strong policies such as a ban on incandescent light bulbs, b) gradual reorientation of appliance manufacturers, who embraced the energy efficiency agenda and adjusted their innovation strategies.
The main lock-ins that hampered the depth of low-carbon reorientation were: a) adherence to the business model of selling more electrical appliances, which are continuously improved and differentiated along multiple dimensions offering better and more functionalities to consumers, b) cultural conventions and assumptions with regard to consumption (e.g., electricity use as an unquestioned background assumption of modern societies; desires for convenience, cleanliness, freshness, entertainment, and connectivity that underpin domestic practices and increased appliance use).
In the electricity grid sub-system, the actor changes were less substantial than for the generation and consumption sub-systems: a) the National Grid and Transmission Network Operators (TNOs) gradually reoriented in response to grid pressures, making incremental changes that build on existing capabilities, b) the regulator Ofgem reluctantly accepted climate mitigation as an additional goal and introduced some add-on instruments to stimulate infrastructure innovation (mostly in the form of R&D and demonstration projects).
The main actors are reluctant to commit to radical change because of strong lock-in mechanisms: a) TNOs and Distribution Network Operators (DNOs) have deep sunk investments in electricity infrastructures, b) DNOs are also locked into their traditional business model (around passive distribution) and have lost technical capabilities and long-term planning skills in recent decades, owing to a low-cost ‘sweat the assets’ orientation, c) Ofgem mainly focused on low cost and efficiency, and shaped grid regulations accordingly, d) National Grid, DNOs, TNOs, and Ofgem formed stable closed-knit networks and shared mindset and orientations (operating a form of ‘club governance’).
This analysis shows that that the unfolding low-carbon transition in the UK electricity system has evolved into what currently is a negotiated and controlled transformation process, driven by the reorientation of incumbent actors (e.g., utilities, grid actors, appliance manufacturers, policymakers), who gradually adjust their goals, capabilities, strategies, and instruments. Civil society organisations and public debates played important roles in raising the profile of climate change and in shaping perceptions of electricity generation technologies (e.g., delegitimating coal, supporting RETs). The role of consumers and households in the low-carbon transition has, so far, remained more limited (e.g., stagnated rooftop solar-PV adoption and limited ‘prosumption’, limited DSR, limited behaviour change), although there has been some change towards buying more energy-efficient appliances. The most important consumer role, so far, is that they have ultimately paid for low-carbon power generation and grids through their electricity bills and general taxation. But this was not a deliberate choice since electricity bills are opaque, and consumers did not explicitly consent to utilities passing on extra costs through their bills.
One actor-related risk to the transition concerns frequent policy changes and U-turns, and the recently weakening support policies, which may erode investor confidence. Another risk is the presence of social acceptance problems of particular innovations, which are partly caused by a top-down technocratic policy style. A third risk is that the planned retirement of coal and nuclear plants by the mid-2020s may create capacity problems, especially if RET expansion and new nuclear power plants and CCS proceed more slowly than anticipated. A fourth risk is that the slow and reluctant reorientation of grid actors (especially DNOs) may create reverse salients that hamper deeper reconfiguration of the entire electricity system. A fifth risk relates to the challenge of mobilising £200–300 billion investments that the low-carbon electricity transition is estimated to require between 2010 and 2030 (Watson et al., Reference Watson, Gross, Ketsopoulou and Winskel2014). While investments have increased substantially in the 2010s, the further roll-out of low-carbon options and infrastructural reconfiguration will require much greater expenditure in the next 10 years, which may be challenging in a post-COVID climate of economic recession and high debt.
4.6.4 Policy Reconfiguration
Formal Policies and Regulations
We conclude that the unfolding low-carbon electricity system transition was supported by strengthening policies, especially in the generation and consumption sub-systems.
The electricity generation sub-system was institutionally reconfigured through many policy changes. A target of 30% renewable electricity by 2020 was introduced by the UK Low Carbon Transition Plan (2009), creating a general sense of direction and speed. The direction of travel was further elaborated by multiple policy plans and strategies that altered regulatory frameworks, for example, the UK Low Carbon Transition Plan (2009), the amended Renewables Obligation (2009), the UK Renewable Energy Strategy (2009), the Carbon Plan (2011), the Energy Bill (2012), the Electricity Market Reform (2013), and the energy reset (2015). Several generic financial instruments shaped economic frame conditions, for example, Feed-in-Tariffs, Renewables Obligation, Contracts for Difference, and Carbon Floor Price. And various technology-specific plans and strategies addressed more specific implementation issues, for example, White Paper on Nuclear Energy (2008), UK Bioenergy Strategy (2012), UK Solar PV Strategy (2013; 2014), and Offshore Wind Sector Deal (2020).
In the electricity consumption sub-system, policy changes were, more limitedly, focused on the energy efficiency of appliances. But since regulatory policies strengthened over time, they increasingly shaped markets and innovation strategies. The European Directive on Energy Labelling focused on information provision to consumers, while successive European Ecodesign Directives (2005, 2009) articulated minimum efficiency standards for appliances, which increased over time. The UK Products Policy (from 2009 onwards) translated these European Directives to UK contexts. Between 1994 and 2012, UK policymakers also imposed several energy savings obligations on energy suppliers to help disseminate more efficient appliances. The incandescent light bulb ban (2007 UK, 2009 EU) was a strong market shaping policy that accelerated the transition towards energy-efficient CFLs and LEDs. The UK’s smart meter roll-out decision (2009) was also a strong (technology-forcing) policy, but this encountered implementation problems.
Policy changes in the grid sub-system have remained more limited and weaker. While there are some broad visions and ad-hoc decisions (e.g., recent relaxing of project size limitations for battery storage), there are few policy strategies or dedicated instruments for smart grids, DSR, or battery storage. And the Capacity Market policy, which potentially could have supported grid transformation, was designed in a way that favoured conventional back-up capacity and marginalised alternatives such as DSR and storage. So, while the technologies for architectural reshaping are becoming available (as discussed in Section 4.6.1), socio-institutional changes in the grid sub-system are lagging behind. There thus seems to be increasing tension between technological and institutional reconfiguration. The independent regulator Ofgem, which itself initially resisted inclusion of climate change in its remit, layered a few innovation-oriented instruments on top of its primary, efficiency-oriented regulations, but these have, so far, done little to bring about wider system change. Deeper reconfiguration would require a shift in the grid sub-system from being a buffer to an active integrator of the whole system. But existing grid-actor roles and operational routines have, so far, not changed much since the late 1990s.
While these strengthening policies in the generation and consumption sub-systems supported low-carbon transitions, they did not threaten vested interests. Instead, these policies enabled incumbent actors (e.g., utilities, appliance manufacturers, TNOs, National Grid) to gradually reorient. In fact, policymakers made many political choices that favoured large-scale options, which suited incumbents, over smaller-scale options linked to new entrants:
large-scale biomass (e.g., co-firing and biomass conversion of coal-fired plants) was favoured over smaller-scale dedicated biomass plants (by sawmills or poultry farms), even though the latter had higher carbon performance (but was somewhat more expensive);
large-scale solar-PV farms (operated by landowners, investors, project developers) were favoured over small-scale roof-top solar-PV (by households);
large-scale wind farms (by energy companies, investors, project developers) were favoured over smaller-scale community wind projects;
large-scale battery storage (by new and incumbent companies) was favoured over decentralised batteries by households with rooftop solar-PV;
smart grids in relation to the flexibility agenda were favoured over micro-grids in relation to decentralisation and energy independence;
the Capacity Markets policies were designed to favour conventional back-up capacity (by utilities) rather than domestic DSR;
large-scale offshore wind parks and nuclear power (by utilities) received generous financial (and political) support.
Another characteristic of UK electricity policy, particularly in the generation sub-system, is the high degree of flux and churn over time: RET policies such as the RO (2002), amended RO (2009), and CfD (2013) succeeded each other in the space of a few years; CCS support policies were introduced and removed several times (2007–2010; 2012–2016); a moratorium on onshore wind was introduced in 2016 and removed again in 2020; feed-in-tariffs for small-scale renewables were introduced in 2010, reduced in 2016, and scrapped in 2019. The CCC (2020: 99) characterised this policy flux and churn as ‘shortcomings’, noting that ‘frequent changing of policy should be avoided’ because it ‘can damage faith in Government policy and reduce business willingness to invest’.
Governance Style
Substantial policy changes in the electricity generation and consumption systems were complemented by substantial changes in governance style. In the generation sub-system, the governance style shifted in the late 2000s from a hands-off, technology-neutral approach towards a more interventionist and technology-specific style (Carter and Jacobs, Reference Carter and Jacobs2014; Kern et al., Reference Kern, Kuzemko and Mitchell2014a). In the consumption sub-system, the governance style also became increasingly interventionist as stronger energy efficiency standards and phase-out policies increasingly shaped markets and innovation strategies. These changes in governance style happened in tandem with changes in policy goals. Although climate change was initially layered on top of existing goals (e.g., low cost, energy security), they became increasingly integrated, leading to concepts such as the ‘energy trilemma’ that recognised all three goals as important, while acknowledging potential trade-offs.
Some other governance style dimensions remained unchanged, however, which helps explain the persistent political privileging of incumbent interests and large-scale options. The centralised style of policymaking and close-knit policy networks provided more access to incumbent utilities and grid actors than to new entrants. The technocratic, top-down policy style with limited interest in stakeholder engagement contributed to social acceptance problems for onshore wind, Big Biomass, and shale gas, which were pushed through with limited consultation of citizens and societal actors. And neoliberal political ideology explains the preference for low-cost, market-based policy instruments (e.g., auctions), which often favour incumbents over new entrants.Footnote 21 It thus remains to be seen if the post-2009 interventionist ‘market shaping’ approach will last or if the government will return to a hands-off approach.
The changes in policy instruments and governance styles did not affect deeper arrangements such as privatised market organisation, large-scale operational models of utilities, the business model of appliance manufacturers (selling more and better appliances and stimulating consumer upgrading to the latest ICT-models), consumer sovereignty, or cultural conventions (e.g., desires for convenience, entertainment, novelty, connectivity). New goals (such as climate mitigation) and policies have thus been layered on top of existing arrangements (McMeekin et al., Reference McMeekin, Geels and Hodson2019), which suits incumbent interests (e.g., utilities, appliance manufacturers, grid-actors) because it enables them to survive the unfolding energy transition.
Although these deeper arrangements have not been disrupted or overhauled, significant decarbonisation has been achieved. This finding contradicts some of the neo-institutional literature, which tends to see policy change as relatively ‘superficial’ (Scott, Reference Scott2008) and suggests that deeper arrangements need to change to bring about transitions. In contrast to this theoretical claim, our empirical analysis of the UK electricity system shows that major low-carbon improvements can be achieved without radical change in deeper arrangements, provided that policies are strong enough to stimulate the reorientation of incumbent actors.
4.6.5 Scope, Depth, and Speed of Reconfiguration
The scope of techno-economic reconfiguration has been substantial for the generation and consumption sub-systems, where substantial changes have occurred in many power generation technologies and appliances. The scope of techno-economic change remained more limited in the infrastructure sub-systems, where most niche-innovations have remained small. Reconfiguration scope is increasing because the diffusion of intermittent renewables is having knock-on effects in the other two sub-systems, leading to the emerging deployment of battery storage, smart meters, smart grids, and demand-side response.
The scope of actor reconfiguration in the generation sub-system has been substantial, as utilities, policymakers, and wider publics experienced substantial change. It remained medium to low in the consumption sub-system, because only appliance manufacturers and policymakers enacted substantial change, while users simply adopted more efficient appliances, which involved limited change. The scope of actor reconfiguration remained limited in the grid subsystem, because few actors enacted substantial change.
The scope of policy reconfiguration has been substantial for the generation sub-system because multiple strategies, plans, and instruments have been used since the early 2010s to drive change. It was somewhat less for the consumption sub-system, where the policy instrument mix was less comprehensive, relying mostly on regulations (e.g., efficiency standards, energy supplier obligations). It remained limited in the grid sub-system, where Ofgem only introduced some ad-hoc instruments that have not supported broad deployment of new technologies.
Techno-economic reconfiguration has been moderate-depth in the generation sub-system because modular substitution mostly occurred between large-scale options (e.g., from coal to gas and large-scale RETs), while small-scale RETs, which represent a deeper change towards decentralised generation, have remained relatively marginal. Techno-economic reconfiguration remained limited in depth in the consumption and grid sub-systems, where incremental change dominated and niche-innovations remained marginal.
The depth of actor reconfiguration has been substantial for policymakers in the generation and consumption sub-systems, who changed both policies and governance styles, including goals. The depth of actor reconfiguration has been moderate for utilities and appliance manufacturers, which changed their investment strategies and technical capabilities but mostly retained their core business models, and for wider publics, who increasingly acknowledged climate change as an important issue but also maintained traditional concerns (e.g., affordability, energy security). Actor reconfiguration has been less substantial for consumers, who adopted energy-efficient appliances but did not alter their social practices or cultural conventions, and for grid-actors, who have not deeply changed their roles and operational routines, although they are extending their technical capabilities. The depth of actor reconfiguration has gradually increased over time, as the diffusion of renewables and the knock-on effects on grid and consumption sub-systems have required various actors to make deeper adjustments.
The depth of policy reconfiguration was substantial in the generation and consumption sub-systems because of changes in policy goals and governance style, and the creation of a new ministry (DECC, later BEIS) with budgets and policy responsibilities. It was limited in the grid sub-system, where climate mitigation remained an add-on policy goal and economic efficiency thinking and incentive tinkering prevailed.
The speed of reconfiguration has been substantial in the generation sub-system, especially in the last 10 years when RETs diffused rapidly (Figure 4.18) and coal-fired power generation almost disappeared (Figure 4.4). Substantial speed was driven by: a) strong policy interventions (including large financial incentives), b) strategic reorientation of incumbent actors towards low-carbon innovations, in response to both policy incentives and perceived economic opportunities, resulting in high investments (in the order of tens of billions of pounds), c) rapid cost decreases in RETs, particularly for onshore and offshore wind, and solar-PV (Figure 4.19), d) high public attention for climate change and positive discourses about RETs, which incentivised politicians; e) (‘indirect’ or ‘involuntary’) market demand because consumers (ultimately) paid for low-carbon innovations through energy bills and taxation, even though they do not make active purchase decisions. Rapid change in power generation was also enabled by the electricity system’s architecture, in which the grid infrastructure separates the generation and consumption sub-systems. This structural characteristic means that consumers are not directly involved in upstream changes in power generation (even though they do pay for them).
The speed of change has been gradual but sustained in the consumption sub-system, where the energy-efficiency of many appliances incrementally improved due to tightening standards, labelling, public information campaigns, producer obligations, public procurement, and voluntary initiatives. The speed of change has been moderate for transmission grids (e.g., extensions and new offshore grids) and relatively low for distribution grid transformation (e.g., smart grids, bi-directional flows) due to various DNO lock-in mechanisms.
4.6.6 Future Outlook
The decarbonisation of the UK electricity system has progressed well in the past decade, and this is likely to continue in the coming years, potentially resulting in a decarbonised system in the 2030s. Increasing amounts of intermittent renewables increasingly have knock-on effects on the electricity grid and consumption sub-systems, potentially leading to further substantial reconfiguration of the entire system. This low-carbon transition is thus beginning to have characteristics of a Great Reconfiguration with deep and broad changes across the entire system.
The depth of this reconfiguration could be even more substantial if multiple smaller-scale options would diffuse, but this is being prevented by incumbent firms and policymakers, who systematically privilege large-scale options. Reconfiguration of local distribution networks has not yet progressed much because of techno-economic lock-in effects, hesitation by Distribution Network Operators, and limited policy push. This may become a bottleneck in the coming decade when the likely diffusion of electric vehicles and potential diffusion of heat pumps will increase both electricity demand and local network electricity flows. If demand-side response and domestic rooftop solar-PV, which has stalled in recent years, also diffuse more widely in the coming decade, local electricity networks will certainly need to be deeply reconfigured to accommodate more flows, bi-directional flows, and flexible management. It remains to be seen if these grid reconfigurations will be implemented at sufficient speed and scale.
There are also ongoing uncertainties about the composition of the future electricity generation mix. While future onshore and offshore wind power generation will likely be substantial, it is uncertain how large the contributions of solar power (probably at utility scale) and bio-power will be. On the one hand, biomass could potentially be reoriented to other sectors with fewer decarbonisation options (e.g., biofuels in aviation, heavy goods vehicles, or shipping). On the other hand, bio-power with CCS offers the potential of negative emissions, although there are various feasibility uncertainties. Beyond renewables, there are also uncertainties about the future role of nuclear power and CCS. Despite ambitious goals and plans in the past decade, the actual realisation of nuclear power expansion has lagged far behind stated intentions (due to cost concerns and financing problems), while several attempts to kickstart CCS for power generation have failed. Continued cost reductions of renewable electricity technologies (and battery storage) may further undermine the business case for these options.
Despite these uncertainties and possible bottlenecks, low-carbon reconfiguration of the UK electricity system is likely to continue and deepen in the coming decade, providing a concrete example of the feasibility and effectiveness of Great Reconfigurations.


 Open access